
Abstract
Background:
The incidence rate of elbow injuries has been rising in recent years among professional baseball pitchers. Determining valid screening procedures that allow practitioners to identify pitchers at an increased risk of such injuries is therefore of critical importance.
Purpose:
To validate the use of countermovement jump (CMJ) tests as a diagnostic tool for pitcher conditioning.
Study Design:
Case-control study; Level of evidence, 3.
Methods:
More than 500 pitchers at a single professional baseball organization performed preseason CMJ assessments on a force plate before the 2013 to 2018 seasons. Three measurements were extracted from ground-reaction force data during the test: eccentric rate of force development (ERFD), average vertical concentric force (AVCF), and concentric vertical impulse (CVI). Athletic trainers at the organization collected detailed information on elbow and shoulder injury rates as well as workload (pitch count) throughout the rest of the season. Poisson regression models were fit to investigate the dependency of injury rates on CMJ test performance.
Results:
ERFD, CVI, and AVCF were all significant predictors of elbow injury risk after accounting for pitcher age, weight, and workload. The analysis identified 3 specific indicators of heightened risk based on the results of a CMJ scan: low ERFD, a combination of low AVCF and high CVI, and a combination of high AVCF and low CVI. In contrast, shoulder injury risk was roughly independent of all 3 CMJ test measurements.
Conclusion:
This study supports the hypothesis of the entire kinetic chain’s involvement in pitching by establishing a link between CMJ test performance and elbow injury risk in professional baseball pitchers. CMJ assessment may be a powerful addition to injury risk alert and prevention protocols. Pitchers in high-risk groups can be prescribed specific exercise plans to improve movement imbalances.
Professional baseball pitchers have experienced a significant rise in elbow injury rates over the past 3 decades. 10 The increase in ulnar collateral ligament (UCL) injuries has been particularly alarming, with only 33 pitchers requiring UCL reconstruction in the 1990s, compared with 101 UCL reconstructions between 2000 and 2009. 34 Despite considerable research efforts to identify modifiable risk factors for UCL injuries,9,34 injury rates have continued to increase since 2010, and the situation has been described as a UCL injury “epidemic.”4,34 UCL injuries are most common in pitchers, 29 occurring with repetitive high valgus torque across the elbow joint during throwing motions. The majority of this stress is concentrated on the anterior band of the UCL. 11
Previous studies have shown that high one-time or long term pitch volumes, 20 pitch speed, 3 and fatigue 15 may increase the risk of UCL injury. One posited explanation for these results is that repetitive pitching motions cause an accumulation of microtraumas to the elbow and shoulder, leading to an increased risk of ligament injuries. 1 The microtraumas occur because the UCL approaches or exceeds cadaveric failure loads with certain arm positions common to throwing motions in baseball.11,24
Unfortunately, workload can be difficult to control for professional pitchers under the demands of competitive regular season schedules. Ideally, one would like to develop preventive measures that target throwing mechanics in addition to managing workload. Efficient operation of the kinetic chain, which transfers force toward the distal segments of the body in throwing movements, 2 may reduce injury risk by decreasing valgus forces placed on the UCL. 8 Previous research has demonstrated an association between deficiency in full activation of the kinetic chain and elbow injury risk 2 and points out the important role played by other physiological structures in stress stabilization during repetitive throwing. 12 For example, internal rotation of the shoulder results in a protective varus force against the valgus force at the elbow. Thus, deficiencies in internal rotation of the shoulder can increase elbow injury risk as well.8,14
The neuromuscular system functions to ensure proper activation, coordination, and transfer of forces through the kinetic chain. Consequently, assessing neuromuscular performance may help diagnose injury risk. Garrison et al 13 established a link between lower extremity balance performance and elbow injuries with a Y balance test, showing that participants with a UCL tear demonstrated decreased performance in their lower extremity balance test as compared with an uninjured control group. Alternatively, a countermovement jump (CMJ) test is among the most reliable and valid forms of jump tests for predicting athletic performance,21,23 lifting ability, 6 and strength. 26 The meta-analysis by Claudino et al 7 further highlighted the utility of the CMJ test as a tool for monitoring neuromuscular status. The authors surveyed the efficacy of 63 CMJ performance variables from 151 studies and found that several kinematic and kinetic variables exhibited moderate sensitivity to detect supercompensation effects, while average jump height was also moderately sensitive to fatigue levels.
These meta-analyses and the studies therein suggest that simple lower body assessments such as the Y balance and CMJ test are valid procedures for monitoring athlete wellness. Several companies have started to take advantage of this relationship to design diagnostic and prescriptive tools for injury prevention. This article focuses on analyzing the validity of 1 specific tool, the “best 3 of 6” CMJ scan employed by Sparta Science. This scan consists of a sequence of 6 CMJ trials. Three measurements are extracted from each jump’s ground-reaction force data: the eccentric rate of force development (ERFD), the average vertical concentric force (AVCF), and the concentric vertical impulse (CVI). At the end of a scan, ERFD, AVCF, and CVI scores are assigned to the athlete based on their average values over the 3 jumps of maximum height. Nibali et al 25 established the reliability of scores obtained during this scanning procedure. The aim of this work is to investigate their validity as a tool for determining injury risk in professional baseball pitchers.
Methods
Experimental Approaches to the Problem
This study retroactively examined 5 seasons (2013-2018) of CMJ scans and injury data from pitchers in a single professional baseball organization (both major and minor leagues). Athletes in the organization performed preseason CMJ scans on a force plate with the results recorded and stored in a force acquisition software (Sparta software). Athletic trainers and coaches at the organization provided injury data throughout this 5-year period with injury locations classified based on the Orchard Sports Injury Classification System (OSICS-10). This included all injuries assessed by athletic trainers or coaches throughout this time. Randomly generated athlete identification numbers de-identified athlete information from both force plate trials and injury data. Counts of elbow and shoulder injuries for each player-season in the data set were used as response variables in Poisson regression models with interactions between the 3 CMJ measurements of ERFD, AVCF, and CVI as explanatory variables. Pitcher age and weight at the start of the season were included as covariates in the model, while pitch count was used as an offset to standardize for workload.
Participants
The participants for this study consisted of professional baseball pitchers from a single Major League Baseball organization. Overall, the analysis included 524 player-seasons of data from 274 different pitchers. Table 1 summarizes the sample sizes for all injury groups considered in the study. Athletes completed the CMJ testing as a part of their routine preseason training and were free of injuries at the time of their CMJ testing. The study did not record previous years of pitching experience or injury history. All participants were over the age of 18 years with a mean age of 24.40 ± 3.59 years and provided consent before testing, data collection, and the publication of results as part of their agreement with their team. In addition, the institutional review board at the corresponding author’s university approved the use of CMJ and injury data for research purposes.
Number of Elbow and Shoulder Injuries in the Sample With Counts in Terms of Player-Seasons a
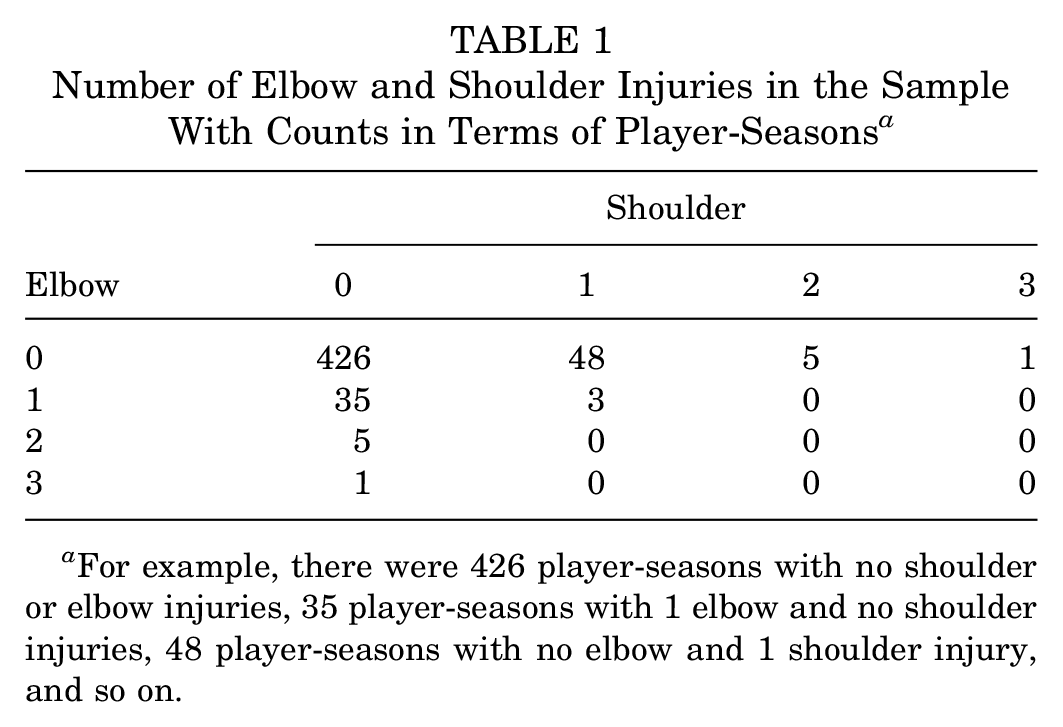
For example, there were 426 player-seasons with no shoulder or elbow injuries, 35 player-seasons with 1 elbow and no shoulder injuries, 48 player-seasons with no elbow and 1 shoulder injury, and so on.
Procedures
Participants performed a preseason scan consisting of 6 CMJs on a commercially available piezoelectric force plate with a sampling frequency of 1000 Hz (9260AA6; Kistler Instruments). Each participant stood on the force plate before waiting for an auditory cue, indicating a 2-second stabilization of body weight, at which time the participant performed a CMJ (a vertical jump for height with arm swing; see the online Video Supplement for this technique). Three force-time variables (ERFD, AVCF, and CVI) were extracted from ground-reaction force data via numerical integration. 19 These force variables are commonly used measures of CMJ performance; additional details of definitions and variable computations can be found in Nibali et al. 25 Participants were allotted 30 seconds between successive jumps. At the end of the 6 jumps, ERFD measurements from the 3 jumps of maximal height were averaged to obtain an overall ERFD score for the pitcher’s scan. AVCF and CVI scores were obtained in the same manner. Nibali et al showed that this method of averaging across the “best 3 of 6” trials results in reliable measurements for all 3 scan variables.
Athletic trainers from the professional organization collected elbow and shoulder injury data throughout the 2013 to 2018 baseball seasons. All injuries to pitchers that caused disruption in either playing time or training ability were included in the study and classified based on the corresponding OSICS-10 code. Data on pitcher age, weight, pitch count, and preseason CMJ scans were merged with the injury data, and the resulting data set was de-identified using unique athlete identification numbers.
Statistical Analysis
The analyses considered 2 response variables, NELBOW and NSHLDR, the number of elbow and shoulder injuries, respectively, in a given year of play. A Poisson regression model with log-link functions was fit to each response variable. Predictor variables included normalized versions of the 3 CMJ test variables (ERFD, AVCF, and CVI) as well as all 2-way interactions to account for the possibility that imbalances may be important for predicting injury risk. Pitcher AGE and WEIGHT were included as covariates. To standardize results based on workload (a variable previously linked to injury risk 20 ), each model also included PITCH.COUNT as an offset variable. Deviance tests were employed to compare models with scan variables to baseline models that included only the covariates, while individual variable significance was assessed by Wald z tests for nonzero coefficients (significance level = .05). All statistical analysis was performed using R, 30 with models trained using the caret package. 16
Results
Overall, there were 51 elbow injuries and 64 shoulder injuries that occurred during the study period. The inclusion of CMJ test variables significantly improved elbow injury prediction compared with the baseline model (deviance, 19.861; P = .003), while no significant gain was found for predicting shoulder injuries (deviance, 3.875; P = .694). Two of the interaction terms from the elbow prediction model (ERFD:AVCF and ERFD:CVI) were insignificant and dropped from the final model. The 2 significant terms were ERFD (coefficient, –0.604; P = .002) and the AVCF:CVI interaction (coefficient, –0.215; P = .009). Table 2 summarizes all coefficients from the model.
Estimated Coefficients, SEs, and Wald z Test P Values for Elbow Injury Poisson Regression Model a
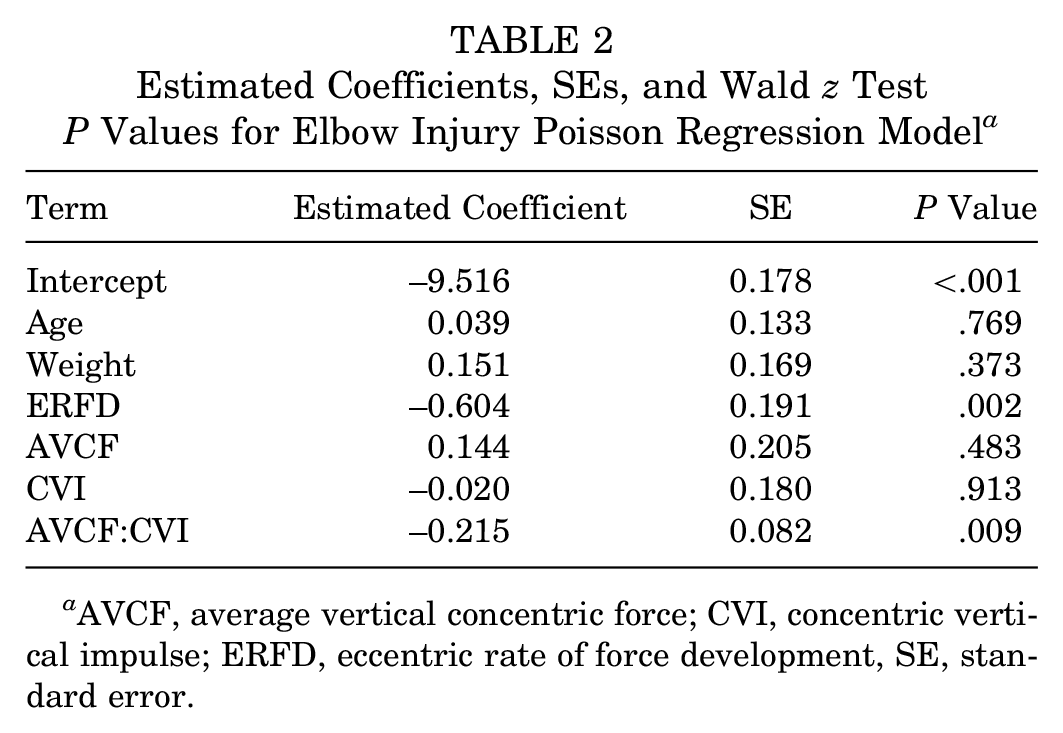
AVCF, average vertical concentric force; CVI, concentric vertical impulse; ERFD, eccentric rate of force development, SE, standard error.
The negative coefficient of ERFD implies that players with high rates of force development during the eccentric phase of their jump tend to incur fewer elbow injuries. In particular, the model predicts that the average number of elbow injuries per year decreases by
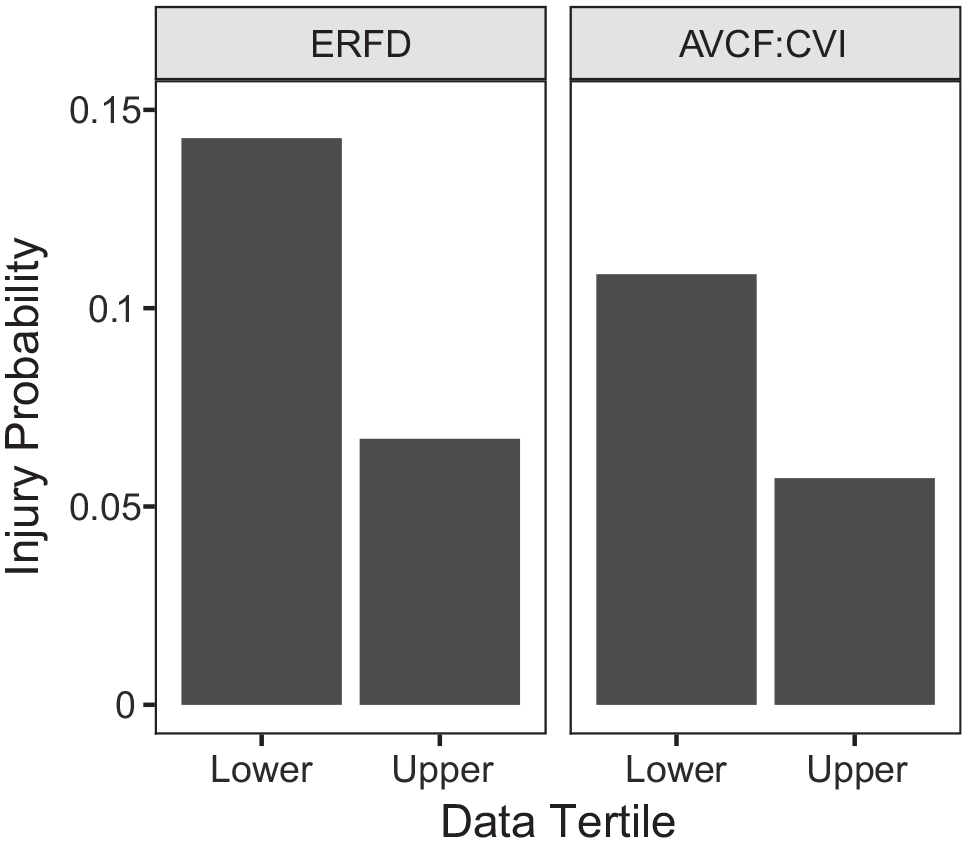
Empirical elbow injury rates for athletes in the lower and upper thirds of observations based on ERFD (left) and AVCF:CVI (right). AVCF, average vertical concentric force; CVI, concentric vertical impulse; ERFD. eccentric rate of force development.
The right panel of Figure 1 presents a different breakdown of injury rates based on the product of AVCF and CVI. The significantly negative coefficient of AVCF:CVI suggests that players with more imbalanced profiles (high CVI/low AVCF or low CVI/high AVCF) are more susceptible to elbow injuries compared with players with more balanced profiles. Athletes in the lower third of AVCF:CVI values were almost twice as likely to sustain elbow injuries compared with athletes in the upper third (probability of injury for upper third, 0.057 vs lower third, 0.108).
Figure 2 presents a more detailed illustration of the AVCF:CVI interaction by showing how predicted injury rates vary with AVCF and CVI for a pitcher with average values of age, weight, pitch count, and ERFD. Note that there is a sharp increase in injury risk for athletes in the upper left and lower right corners of the heat map. Pitchers in these corners represent those with low AVCF/high CVI and those with high AVCF/low CVI, respectively. The risk for the latter group appears to increase more rapidly compared with the risk for the former. Figure 3 illustrates jump profiles of the 4 pitchers with the highest injury risk based on their preseason scans. Three of the 4 pitchers at highest risk had low ERFD/low AVCF/high CVI profiles. This was the most common high-risk profile in the sample, occurring in 45% of the top quartile of predicted high-risk scans. The fourth (low ERFD/high AVCF/low CVI) profile from Figure 3 was the second most common, occurring in 19% of high-risk scans. The other 2 most commonly occurring high-risk profiles were (high ERFD/high AVCF/low CVI) (12% of high-risk scans) and (low ERFD/low AVCF/low CVI) (11%).
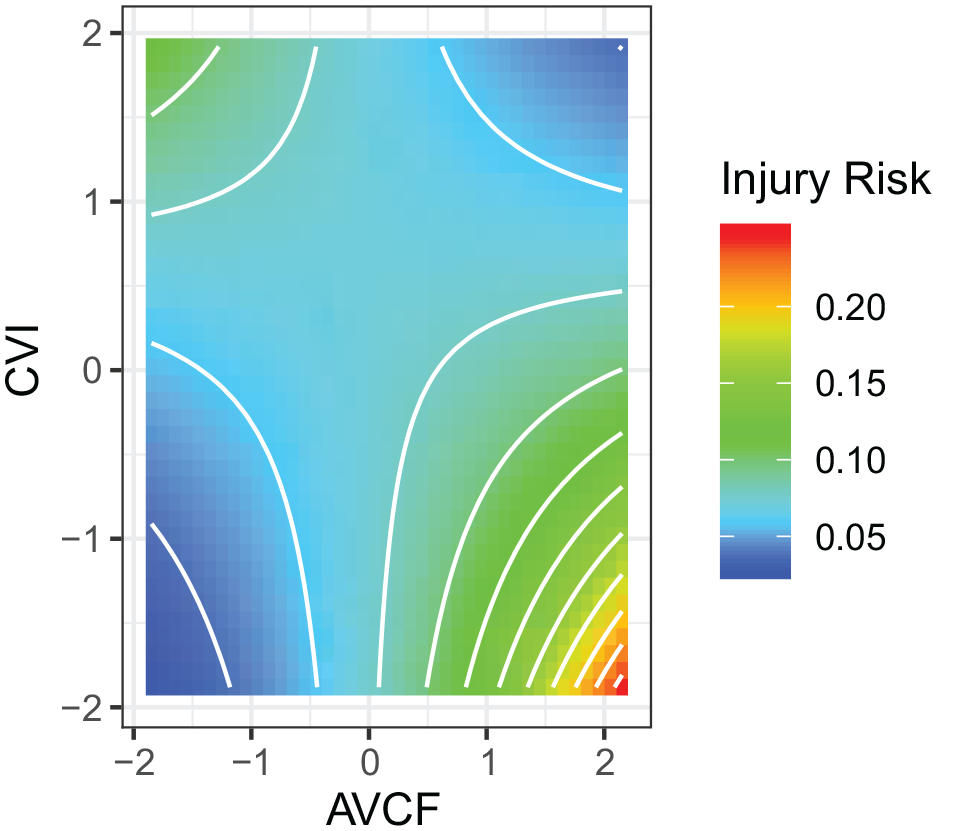
Heat map showing the predicted mean number of elbow injuries per year (injury risk) based on the Poisson regression model. The x and y axes cover the middle 95% of average vertical concentric force (AVCF) and concentric vertical impulse (CVI) scores in the sample.
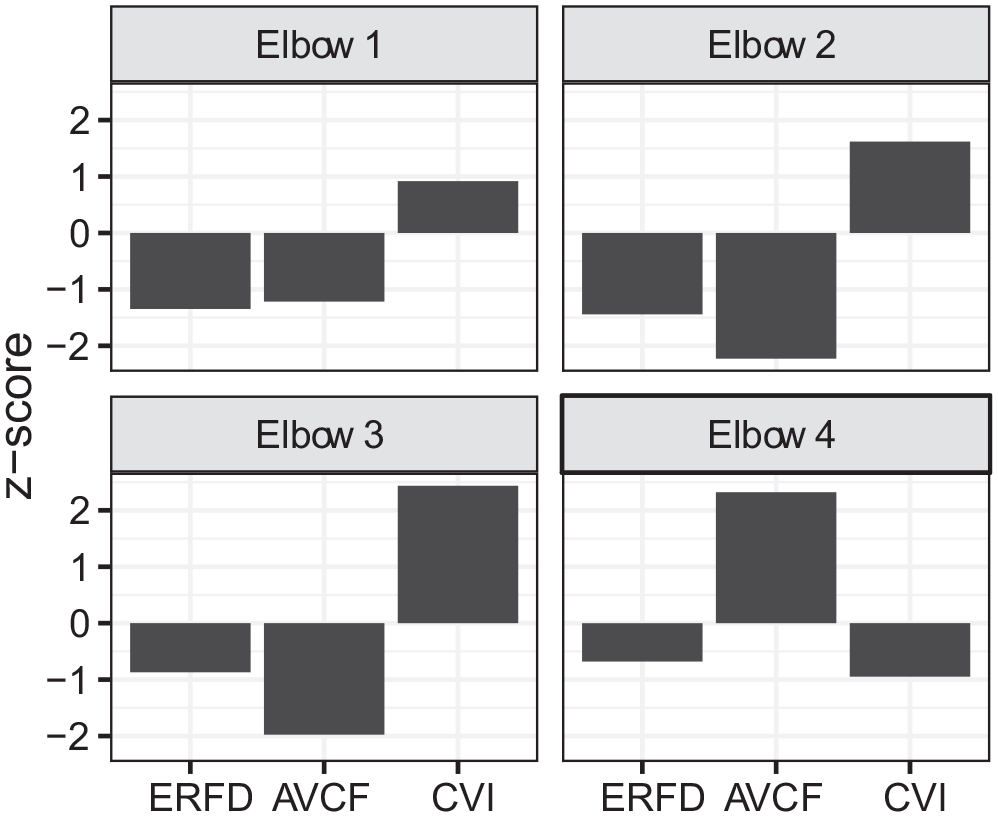
Sample profiles of the 4 pitchers in the study with the highest predicted elbow injury risk. The pitchers in elbows 1 to 3 all have below-average ERFD/AVCF with above-average CVI, while the pitcher in elbow 4 has below-average ERFD/CVI with above-average AVCF. AVCF, average vertical concentric force; CVI, concentric vertical impulse; ERFD, eccentric rate of force development.
Discussion
This study examined the effectiveness of CMJ testing as a tool for assessing elbow injury risk in professional baseball pitchers. A detailed analysis of CMJ scan variables identified 3 key indicators of high injury risk:
Low rates of force development during the eccentric phase of the jump (ERFD)
High impulse momentum (CVI) coupled with low force production (AVCF) during the concentric phase of the jump
Low impulse momentum (CVI) coupled with high force production (AVCF) during the concentric phase of the jump
In contrast, there were no significant relationships between shoulder injury rates and CMJ test variables.
Theories as to why certain types of CMJ scan profiles predict higher elbow injury risks are multifold. As forces are transferred up the kinetic chain during a pitch, the sequencing or timing and magnitude of these forces influences how they are expressed through more distal segments of the upper body. 31 The upper body is required to transfer and direct these forces from proximal to distal segments and ultimately to the baseball. 31 These extreme forces must also dissipate through different joint structures (multiple ligaments and muscles) to improve joint control and decrease the likelihood of injury.
Kinetic force development is an important component of pitch initiation as it establishes a base of support for transferring potential energy through the kinetic chain. 5 Pitchers in the first high-risk group (low ERFD) may overcompensate for a slow rate of force development during the windup and stride phases of their throwing motion, with increased force generation in the subsequent acceleration and follow-through phases of the pitch, 33 which places extraordinary demands on the elbow joint. 28 The elbow may be incapable of handling this additional strain. Pitchers record valgus forces as high as 64 N·m, while the known tensile strength of the UCL has been reported at 33 N·m,27,32 although it should be pointed out that the latter measurement is based on in vitro testing of an older group of nonathletes who may exhibit drastically different torques when compared with younger athletes. Regardless, proper lower body force generation in early phases can help reduce unnecessary stresses on elbow joints during later phases of a pitch.
Pitchers from the second identified high-risk group (low CVI/high AVCF) produced and applied relatively high amounts of force over a short period during their CMJ test. If the pitcher mimics this pattern in throwing motions, then he may experience a sharp peak force in his elbow joint during the transition from the acceleration to deceleration phases of a pitch. This sharp whipping motion may increase the likelihood of acute elbow traumas, cause chronic elbow soreness, and eventually even lead to ligament tears. 11
Pitchers in the third identified high-risk group (high CVI/low AVCF) may exhibit the opposite problem; they are producing and applying relatively low amounts of force over a long period. Such throwing motions potentially overutilize impulse momentum to compensate for force deficiencies. Prolonged force application requires an increased duration of motor control for the individual on every throw, which could wear down the stabilizing structures of joints over time, again increasing the likelihood of both acute and chronic injuries.
Pitchers with balanced ground-reaction profiles from a CMJ may be more efficient at generating forces and absorbing the stresses of repetitive throwing motions by distributing them across different neuromuscular mechanisms instead of relying too heavily on elbow joints and muscles. This theory supports previous studies on the relationships between deficiencies in the full utilization of the kinetic chain, force generation, and elbow injury risks. 11
Several issues limit the scope of the conclusions herein. First, this study does not take into account changes in CMJ profiles that may result from in-season workloads by each player, particularly the number of pitches thrown and/or the average pitch velocity. An interesting follow-up study would be to test athletes at regular intervals throughout the season and perform a survival analysis of injury rates based on CMJ test results. Unfortunately, this limitation is a consequence of the challenges of collecting data on professional athletes. Performing controlled experimental studies, or even observational research on this population, is difficult because of the restrictions placed on athletes by their organizations to perform at the highest level over the course of an 8-month preseason/season. Correlating the results of a preseason CMJ scan with a practical in-season assessment such as a Y balance field test provides 1 potential line of future inquiry into this issue.
A second limitation is that the present study focuses only on pitchers at the highest level of competitiveness. Testing against other levels of play, such as college or high school, is helpful to fully validate the hypothesized predictive power of CMJ measurements, as well as investigate differences in such findings among younger populations. Addressing this question will rely on more organizations adopting CMJ scans as an evaluation tool.
A third potential limitation is that this study ignored other injury types, such as core, knee, and ankle injuries, which could affect the individual’s risk factors, especially since this study highlights the importance of the entire kinetic chain in injury prediction from movement. This study also did not take into account severity of injuries. Classifying elbow and shoulder injuries based on time-missed data could provide further insights into injury prediction and prevention.
The challenge of “small data” makes injury prediction a difficult pursuit. Previous studies have shown that CMJ measurements constitute a reliable set of metrics for athlete conditioning, and this present study provides the first evidence of their potential validity as a tool for injury prediction. Combining CMJ scans with other diagnostic tools may provide a powerful battery of tests to use in identifying pitchers at high risk. By focusing on specific deficiencies in movement during CMJ testing, one can also prescribe preventive measures to strengthen athletes and decrease injury risk. For example, 1 study investigated the effect of different workout plans on ERFD, AVCF, and CVI. 22 This study found that pitchers with low ERFD, the first high-risk group identified in this study, show increased rates of force development after completing workout plans that emphasize Olympic-style squats. In contrast, athletes with low CVI/high AVCF can adjust imbalances through exercises with sustained ground-reaction force production (eg, movements performed on only 1 leg rather than 2 legs, such as split squats), while athletes with low AVCF and high CVI should emphasize “larger load” exercises performed with 2 limbs in contact with the ground (eg, dead lifts). “Resting” a player based on a test with high false-positive rates could carry heavy consequences at a competitive level of play, but workout adjustments like those mentioned above provide less risky prescriptions. Overall, this combined reliability, 25 validity,17,18 and action ability 22 of CMJ force-time metrics establishes the test as a powerful tool for tracking athlete wellness.
Footnotes
Acknowledgements
The authors thank the Colorado Rockies organization and medical staff for their support of this project. The video demonstration of a CMJ scan and CMJ test statistics appear courtesy of Sparta Science (Menlo Park, CA). The authors extend special thanks to Sarah Cohen, Bryce Patterson, and Dr Phil Wagner of Sparta Science for helping the authors access relevant data from their system and providing important feedback on early versions of this manuscript.
Submitted June 26, 2019; accepted December 12, 2019.
The authors declared that they have no conflicts of interest in the authorship and publication of this contribution. AOSSM checks author disclosures against the Open Payments Database (OPD). AOSSM has not conducted an independent investigation on the OPD and disclaims any liability or responsibility relating thereto.
A Video Supplement for this article is available online.
References
Supplementary Material
Please find the following supplemental material available below.
For Open Access articles published under a Creative Commons License, all supplemental material carries the same license as the article it is associated with.
For non-Open Access articles published, all supplemental material carries a non-exclusive license, and permission requests for re-use of supplemental material or any part of supplemental material shall be sent directly to the copyright owner as specified in the copyright notice associated with the article.