
Abstract
Background:
Delayed gadolinium-enhanced magnetic resonance imaging of cartilage (dGEMRIC) allows objective and noninvasive assessment of cartilage quality. An interim analysis 1 year after correction of femoroacetabular impingement (FAI) previously showed that the dGEMRIC index decreased despite good clinical outcome.
Purpose:
To evaluate dGEMRIC indices longitudinally in patients who underwent FAI correction and in a control group undergoing nonoperative treatment for FAI.
Study Design:
Cohort study; Level of evidence, 3.
Methods:
This prospective, comparative longitudinal study included 39 patients (40 hips) who received either operative (n = 20 hips) or nonoperative (n = 20 hips) treatment. Baseline demographic characteristics and presence of osseous deformities did not differ between groups. All patients received indirect magnetic resonance arthrography at 3 time points (baseline, 1 and 3 years of follow-up). The 3-dimensional cartilage models were created using a custom-developed deep learning–based software. The dGEMRIC indices were determined separately for acetabular and femoral cartilage. A mixed-effects model was used for statistical analysis in repeated measures.
Results:
The operative group showed an initial (preoperative to 1-year follow-up) decrease of dGEMRIC indices: acetabular from 512 ± 174 to 392 ± 123 ms and femoral from 530 ± 173 to 411 ± 117 ms (both P < .001). From 1-year to 3-year follow-up, dGEMRIC indices improved again: acetabular from 392 ± 123 to 456 ± 163 ms and femoral from 411 ± 117 to 477 ± 169 ms (both P < .001). The nonoperative group showed no significant changes in dGEMRIC indices in acetabular and femoral cartilage from baseline to either follow-up point (all P > .05).
Conclusion:
This study showed that 3 years after FAI correction, the dGEMRIC indices improved compared with short-term 1-year follow-up. This may be due to normalized joint biomechanics or regressive postoperative activation of the inflammatory cascade after intra-articular surgery.
Femoroacetabular impingement (FAI) leads to chondrolabral damage and can result in premature osteoarthritis of the hip. 5 Joint-preserving surgery can delay the degenerative cascade by normalizing joint biomechanics, and outcome is dependent on the already existing cartilage damage.6,17,30 Therefore, accurate preoperative identification and quantification of cartilage damage are of crucial importance to determine which patients will benefit from joint-preserving surgery and which will not.4,6,17,30 While morphologic magnetic resonance imaging (MRI) is limited to a macroscopic and qualitative evaluation of cartilage damage, compositional imaging techniques such as delayed gadolinium-enhanced MRI of cartilage (dGEMRIC) allow for quantitative cartilage mapping and therefore enable a more objective assessment of cartilage damage in a noninvasive fashion. 14
dGEMRIC is a histologically validated imaging biomarker for cartilage quality that has the potential to improve the understanding of degenerative hip disease and the effect of different treatment protocols on cartilage composition based on the indirect assessment of cartilage glycosaminoglycan content.23,25 The effect of joint-preserving surgery on cartilage quality in patients with FAI is unclear and has been controversially discussed in the literature.9,24 A previous study reported an overall decline in dGEMRIC indices despite an improvement in patient-reported outcome measures (PROMs) 1 year after FAI surgery. 24 In contrast, a multicenter setting reported no significant change of the overall dGEMRIC indices 1 year after FAI surgery. 9
This study represents the extended 3-year follow-up of a cohort that was previously reported with short-term 1-year clinical and dGEMRIC outcomes. In the current study, we aimed to evaluate whether there is further evolution in cartilage composition assessed with dGEMRIC indices 3 years after FAI surgery compared with nonoperative treatment. This is a longitudinal comparative study using a deep learning–based approach for automatic 3-dimensional (3D) cartilage segmentation.
We hypothesized that dGEMRIC indices would improve 3 years after FAI surgery after the initial decrease at 1-year follow-up.
Methods
Study Design
This prospective comparative longitudinal study was approved by the local ethics committee and was performed between 2012 and 2017 at a Swiss tertiary center for hip preservation surgery. The participants were symptomatic patients who had FAI and underwent either surgery or nonoperative treatment (physical therapy). Our aim was to compare the dGEMRIC indices of these patients over a 3-year follow-up period.
Participants
Between 2012 and 2015, a total of 105 patients (116 hips) with hip pain who were suspected of having FAI underwent biplanar radiography for evaluation of FAI deformities and were offered a dGEMRIC scan for further evaluation. The inclusion criterion was a diagnosis of FAI based on clinical history (>3 months) and clinical findings (positive anterior impingement and/or apprehension test 32 ) suggestive of FAI in the presence of osseous FAI deformities. 32 Joint-preserving surgery was offered to all patients. The final decision to undergo operative or nonoperative treatment was made by the patients. Operative treatment included joint-preserving surgery by either hip arthroscopy or open surgical hip dislocation, and nonoperative treatment consisted of dedicated hip physical therapy.
Arthroscopic surgery was performed in the presence of focal osseous deformities and associated collateral damage. More complex and global osseous deformities and chondrolabral damage were treated with surgical hip dislocation. Patients in the nonoperative group underwent standardized physical therapy for the hip, including detailed patient assessment, help with pain relief, and an exercise-based program that was individualized, supervised, and progressed over time.
Clinical evaluation at baseline and at 1- and 3-year follow-up included clinical examination (range of motion, anterior and posterior impingement test) by 1 of 3 individuals (P.C.H., M.S.H., F.S.) and assessment of PROMs including the modified Harris Hip Score (mHHS), the Western Ontario and McMaster Universities Osteoarthritis Index (WOMAC), and the University of California Los Angeles (UCLA) activity scale.
Imaging Protocol
Patients underwent conventional radiographic imaging in a standardized supine position at each study visit (anteroposterior pelvic radiograph and cross-table view).16,32
Patients further underwent indirect hip magnetic resonance arthrography at each study visit. Imaging was performed with the same 3-T scanner (Trio; Siemens) with a flexible surface coil and intravenous administration of gadopentetate-dimeglumine (Magnevist 0.2 mmol/mL/kg; Bayer). The standardized protocol included multiplanar, proton density–weighted, turbo spin-echo sequences in coronal, sagittal, and radial orientation for morphologic evaluation. 27 For dGEMRIC, a previously validated 3D, T1-weighted, volume interpolated, breath-hold examination sequence was acquired with the following parameters: repetition time/echo time, 15/3.3 ms; flip angles, 4° and 24°; slice thickness, 0.8 mm; field of view, 160 × 160 mm; matrix size, 192 × 192; isotropic voxels, 0.8 mm3; acquisition time, 8.46 minutes for 128 slices.3,7,8,11,29,31
Deep Learning–Based Segmentation of 3D dGEMRIC Cartilage Models
To standardize dGEMRIC measurements across time points and to eliminate the effect of interobserver variability, we used a deep learning approach for automatic segmentation of 3D cartilage models. To generate a training data set, we manually segmented cartilage using the morphologic raw data of the dGEMRIC acquisition on the baseline MRI scan of each patient (N = 39) according to a previously validated approach. 26 Manual segmentations were performed in consensus by a radiologist (F.S.) and an orthopaedic resident (M.K.M.) with extensive experience in cartilage mapping techniques of the hip joint who were blinded to MRI studies acquired at other time points. Morphologic images of the same examination were available to ensure segmentation accuracy. In addition to the morphologic images with annotated cartilage, the spatially coregistered dGEMRIC maps were used as input data for the segmentation pipeline. A previously validated 2-step automatic segmentation algorithm was used to create the 3D cartilage models. 21 A deep learning–based landmark detection algorithm was used to detect the femoral head center, which allowed automatic cropping of the original image data to a smaller subvolume of the weightbearing joint. In the next step, three 2-dimensional networks were used in 3 image planes. These 3 networks were combined by a voxelwise majority vote, creating an ensemble of an axial, sagittal, and coronal plane–based network. Segmentation performance was excellent with a Dice coefficient of 88% ± 3% and a mean bias of 0.8 ± 7.9 ms (P = .641) between manual and automatic segmentations. We performed dGEMRIC analysis using a previously validated, custom-made software application for 3D visualization with color-coded dGEMRIC indices and evaluation. 21 Every segmentation prediction of the 1- and 3-year follow-up visits was visually checked by the same expert readers and manually corrected if needed. Intraobserver reproducibility and interobserver reliability were excellent, ranging from 0.962 to 0.998 and 0.987 to 0.999, respectively (assessed via intraclass correlation coefficient). 26
Primary Outcome Measure: Evaluation of dGEMRIC Indices
The software allows for sectioning of the 3D cartilage to smaller regions of interest according to a predefined clock face system, 28 in which the acetabular teardrop defines the 6 o’clock position, and 3 o’clock and 9 o’clock represent anterior and posterior, respectively. In addition, the cartilage models can be separated into peripheral and central sectors and femoral and acetabular cartilage.
Secondary Outcome Measure: Patient-Reported Outcomes
At baseline, 1-year follow-up, and 3-year follow-up, patients filled out questionnaires to assess PROMs including the WOMAC, UCLA, and mHHS. Improvement in PROMs was assessed as minimal clinically important difference (MCID), which was 22 points for WOMAC, 10 0.5 points for UCLA, 18 and 8 points for mHHS. 19
Statistical Analysis
Statistical analysis was performed using Prism (Version 9.1; GraphPad Software). Data were tested for normality using the Kolmogorov-Smirnov test for continuous data. Between-group differences in participant characteristics were compared using unpaired t test for continuous data and the Fisher exact test for dichotomous data. To evaluate the dGEMRIC indices and PROMs over time (baseline, 1 year, and 3 years), a mixed-effects model with Tukey correction for repeated measures was used with pairwise differences and corresponding confidence intervals. Correlation analysis was performed using the Spearman correlation coefficient. Significance for all analyses was set a priori at P < .05. Patients who had missing data or were lost to follow-up were not included in the analysis.
As previously described in the pilot study with 1-year follow-up, 24 we calculated a minimal sample size of n = 20 for each group to provide an alpha level of .05 and a beta level of 0.20, given a mean preoperative acetabular T1 value in symptomatic FAI hips of 447 ms, 35 an expected difference in the T1 value of 71 ms, 8 and an estimated SD of 120 ms. 8
Results
The flowchart of patient recruitment is provided in Figure 1.

Flowchart of patient inclusion. dGEMRIC, delayed gadolinium-enhanced magnetic resonance imaging of cartilage; FAI, femoroacetabular impingement; LCPD, Legg-Calve-Perthes disease; MRI, magnetic resonance imaging; SCFE, slipped capital femoral epiphysis.
Of the initial 105 patients (116 hips), 10 patients (11 hips) were excluded due to previous surgery (n = 3 patients/hips), Legg-Calve-Perthes disease or slipped capital femoral epiphysis (n = 2 patients, 3 hips), osteoarthritis Tönnis grade 3 (n = 1 patient/hip), and absence of FAI deformities (n = 4 patients/hips) (Figure 1). A total of 95 patients (105 hips) were enrolled after providing written informed consent: 45 patients (47 hips) in the operative group and 56 patients (58 hips) in the nonoperative group. Of those, 58 patients (61 hips) refused 1-year follow-up or had MRI scans of insufficient quality at 1-year follow-up, resulting in 21 patients (22 hips) in the operative group and 22 patients (22 hips) in the nonoperative FAI group at 1-year follow-up. At the time of evaluation, 3 patients (4 hips) had been lost to 3-year follow-up, resulting in 19 patients (20 hips) in the operative group and 20 patients (20 hips) in the nonoperative group with complete 1-year and 3-year follow-up. In the operative group, 8 patients underwent hip arthroscopy and 12 patients underwent surgical hip dislocation. Patient characteristics are displayed in Table 1. Radiographic parameters were comparable between study groups (Table 2). There was no crossing over from nonoperative to operative group. None of the 40 patients (0%) had progression in Tönnis radiographic osteoarthritis among the 3 time points.
Characteristics of Study Groups a
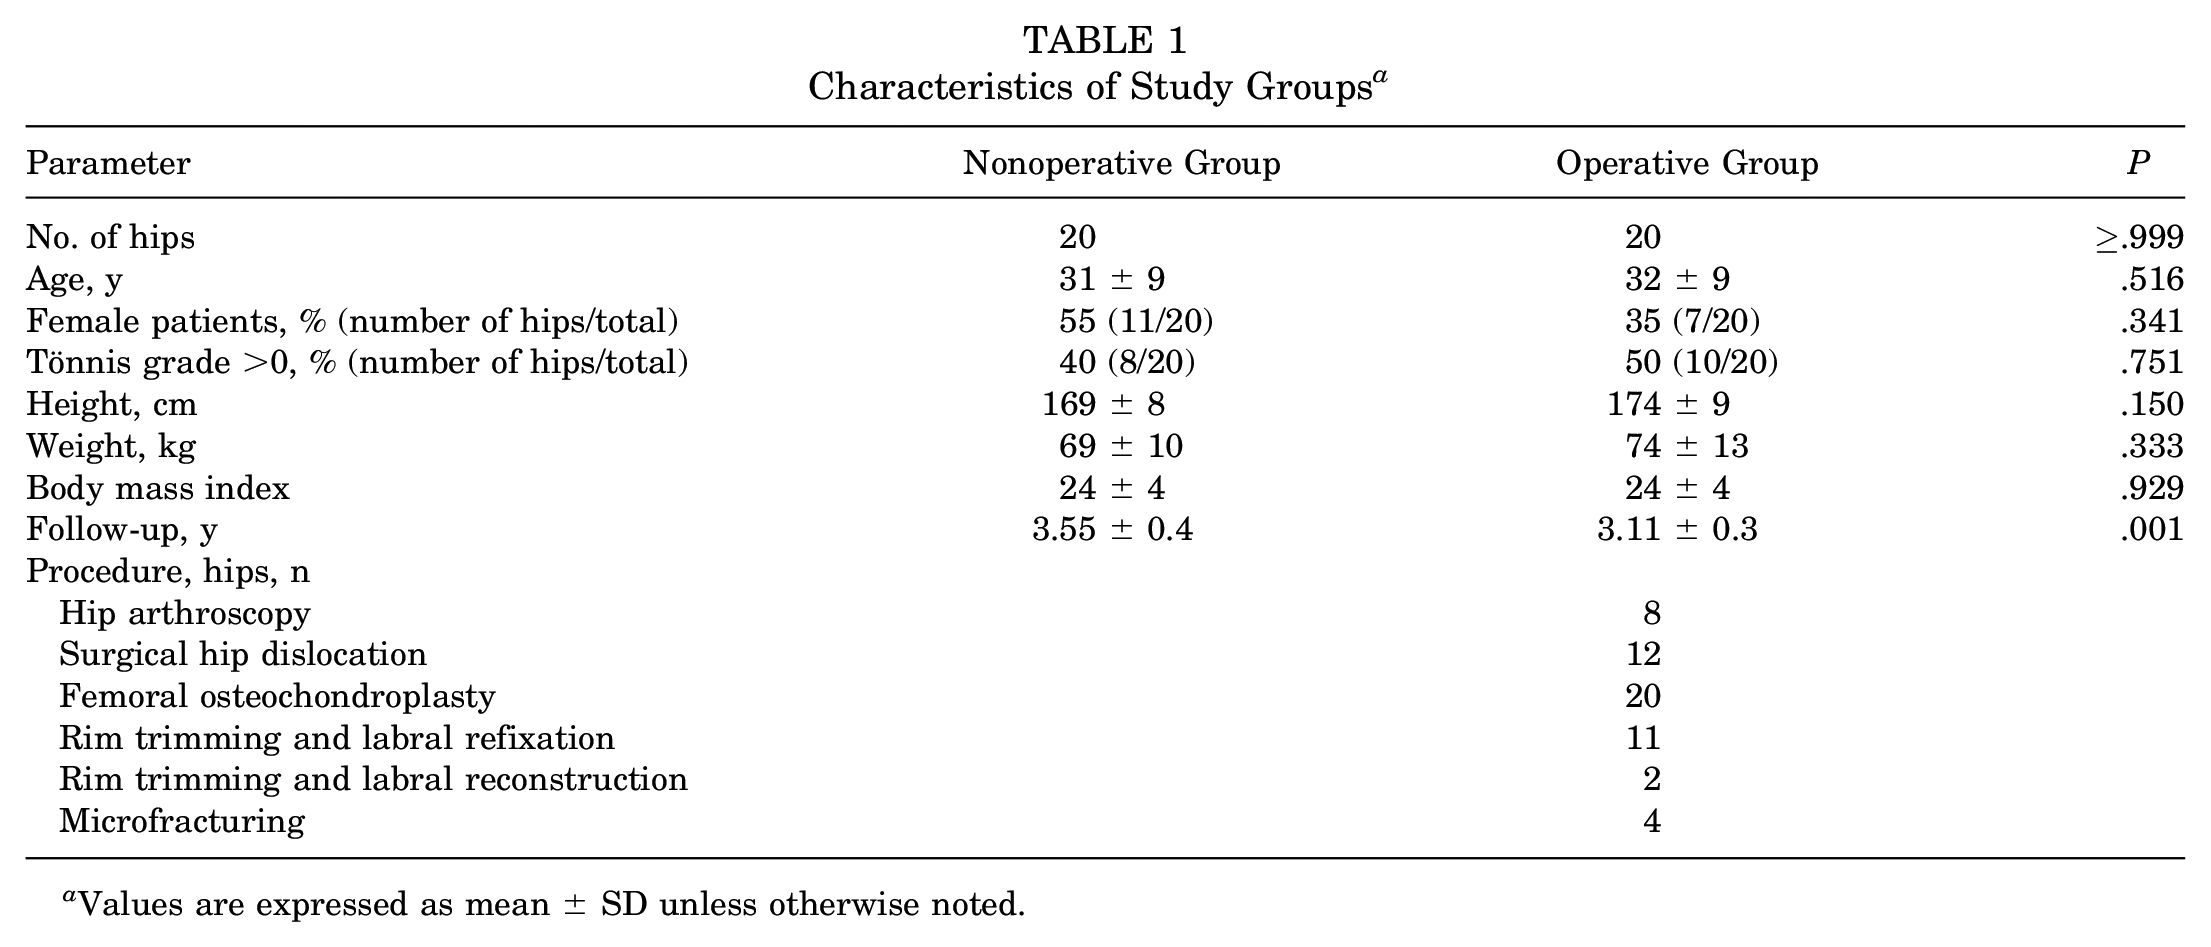
Values are expressed as mean ± SD unless otherwise noted.
Baseline Radiographic Parameters of Study Groups a
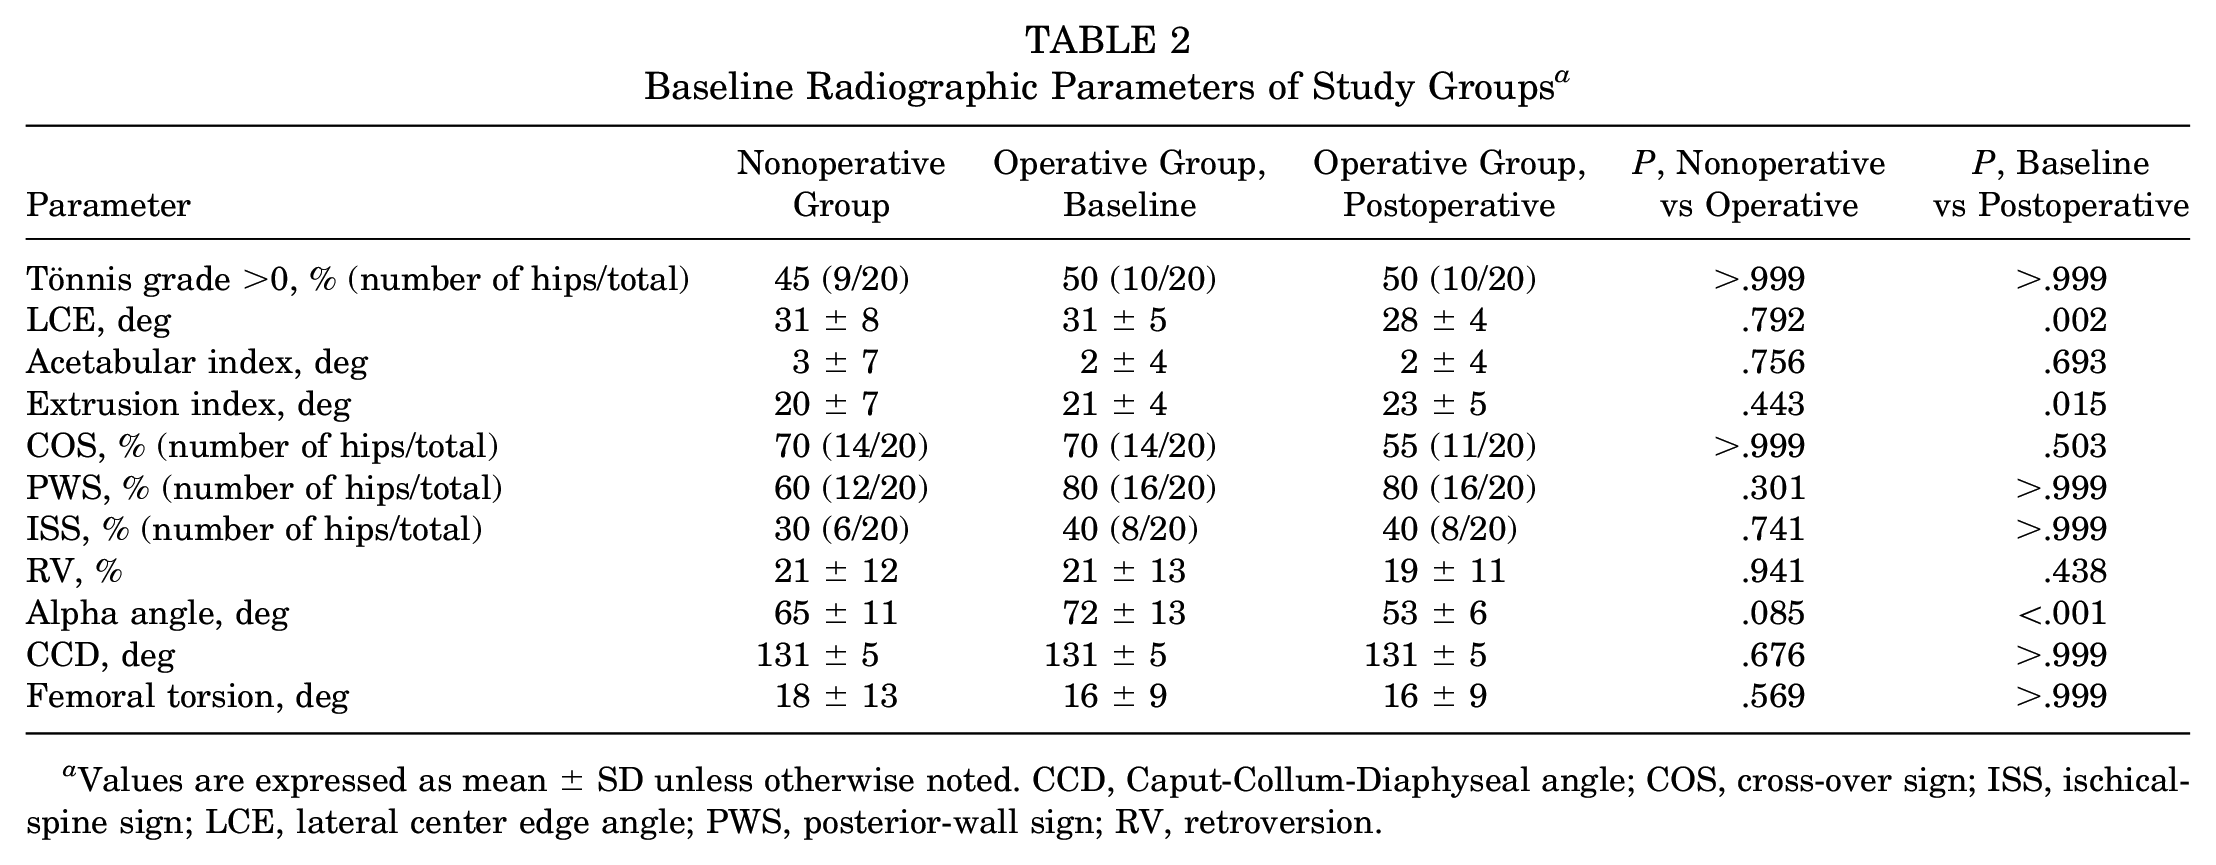
Values are expressed as mean ± SD unless otherwise noted. CCD, Caput-Collum-Diaphyseal angle; COS, cross-over sign; ISS, ischical-spine sign; LCE, lateral center edge angle; PWS, posterior-wall sign; RV, retroversion.
DGEMRIC Indices
The baseline dGEMRIC indices did not differ significantly between the operative and nonoperative groups for acetabular indices (P = .294) and femoral indices (P = .283). The operative group showed an initial (preoperative to 1-year follow-up) mean decrease of 120 ms (95% CI, 92 to 148 ms; P < .001) in dGEMRIC indices for acetabular cartilage (a decrease from 512 ± 174 to 392 ± 123 ms). For the femoral cartilage, the initial decrease was 119 ms (95% CI, 86 to 152 ms; P < .001), a decrease from 530 ± 173 to 411 ± 117 ms. From 1- to 3-year follow-up, dGEMRIC indices increased. For the acetabular cartilage, the increase was 64 ms (95% CI, 32 to 96 ms; P < .001), an increase from 392 ± 123 to 456 ± 163 ms. The increase in femoral dGEMRIC was 66 ms (95% CI, 30 to 102 ms; P < .001), corresponding to values of 411 ± 117 ms at 1-year follow-up and 477 ± 169 ms at 3-year follow-up (Figure 2; Table 3).
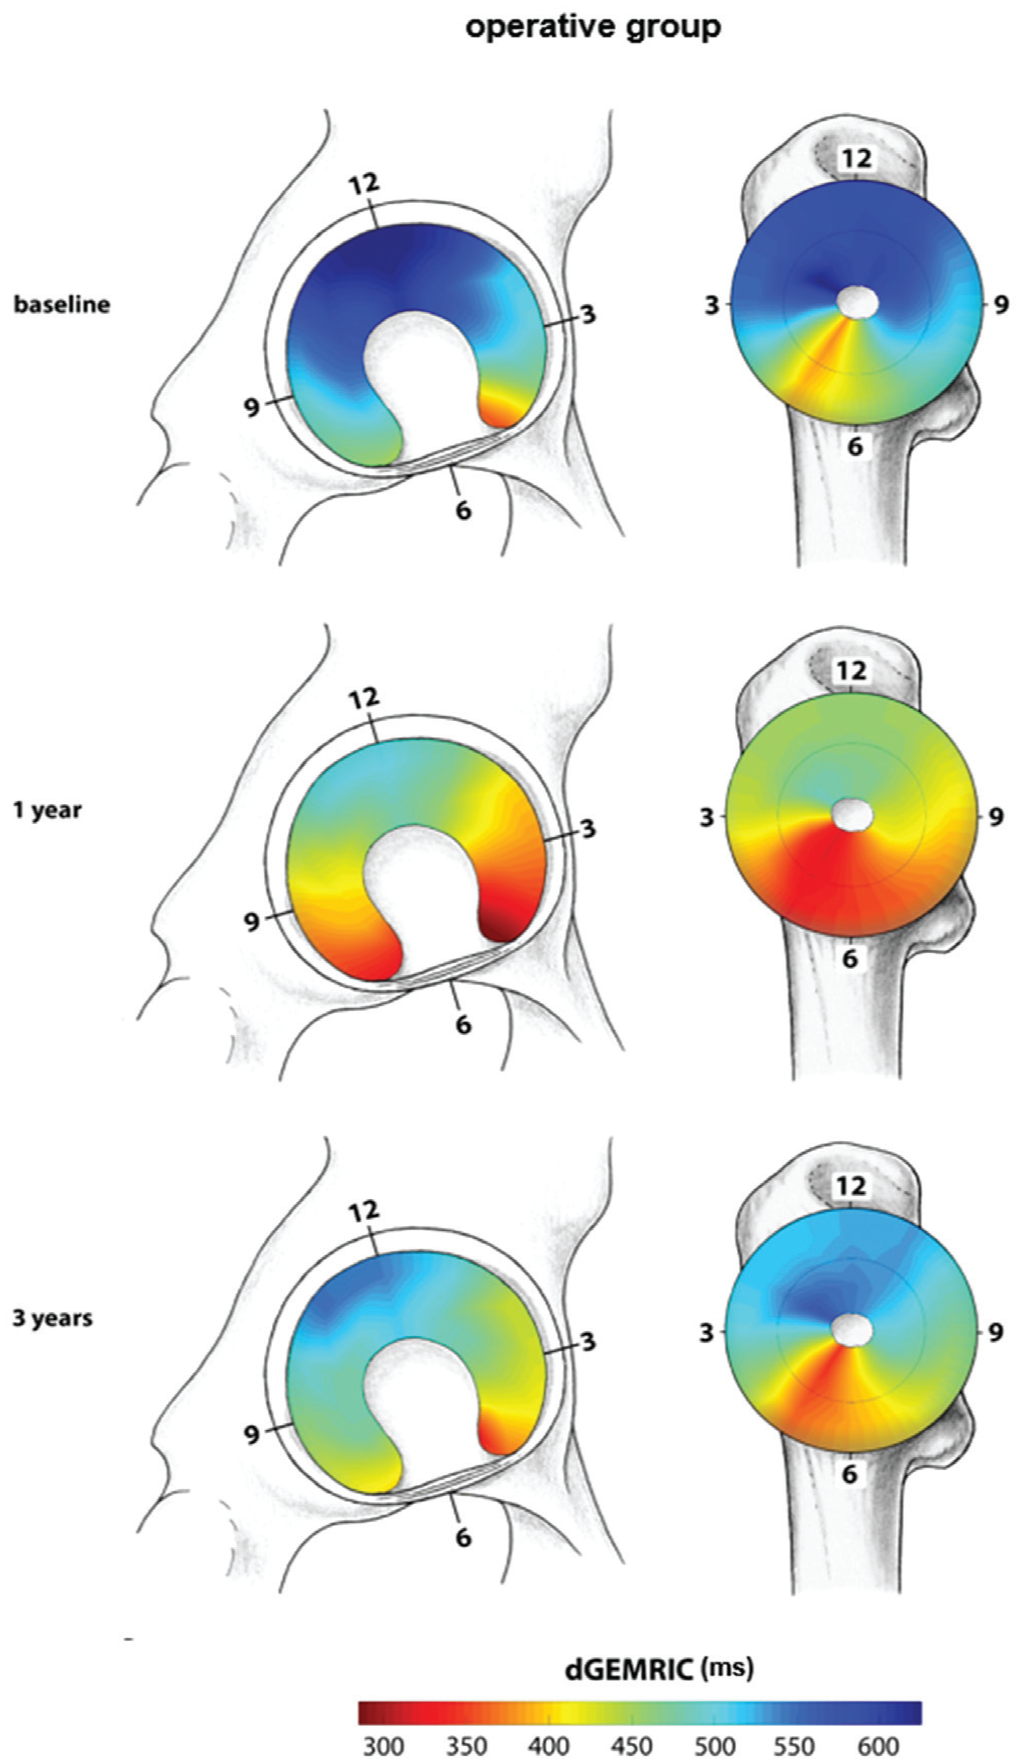
Color-coded mapping of regional distribution of delayed gadolinium-enhanced magnetic resonance imaging of cartilage (dGEMRIC) indices of the operative group at baseline and at 1 year and 3 years of follow-up, indicating a global decrease of the dGEMRIC indices at 1 year of follow-up followed by a partial recovery at 3 years of follow-up.
Changes Over Time in Acetabular and Femoral dGEMRIC Indices After Surgery and Nonoperative Treatment a
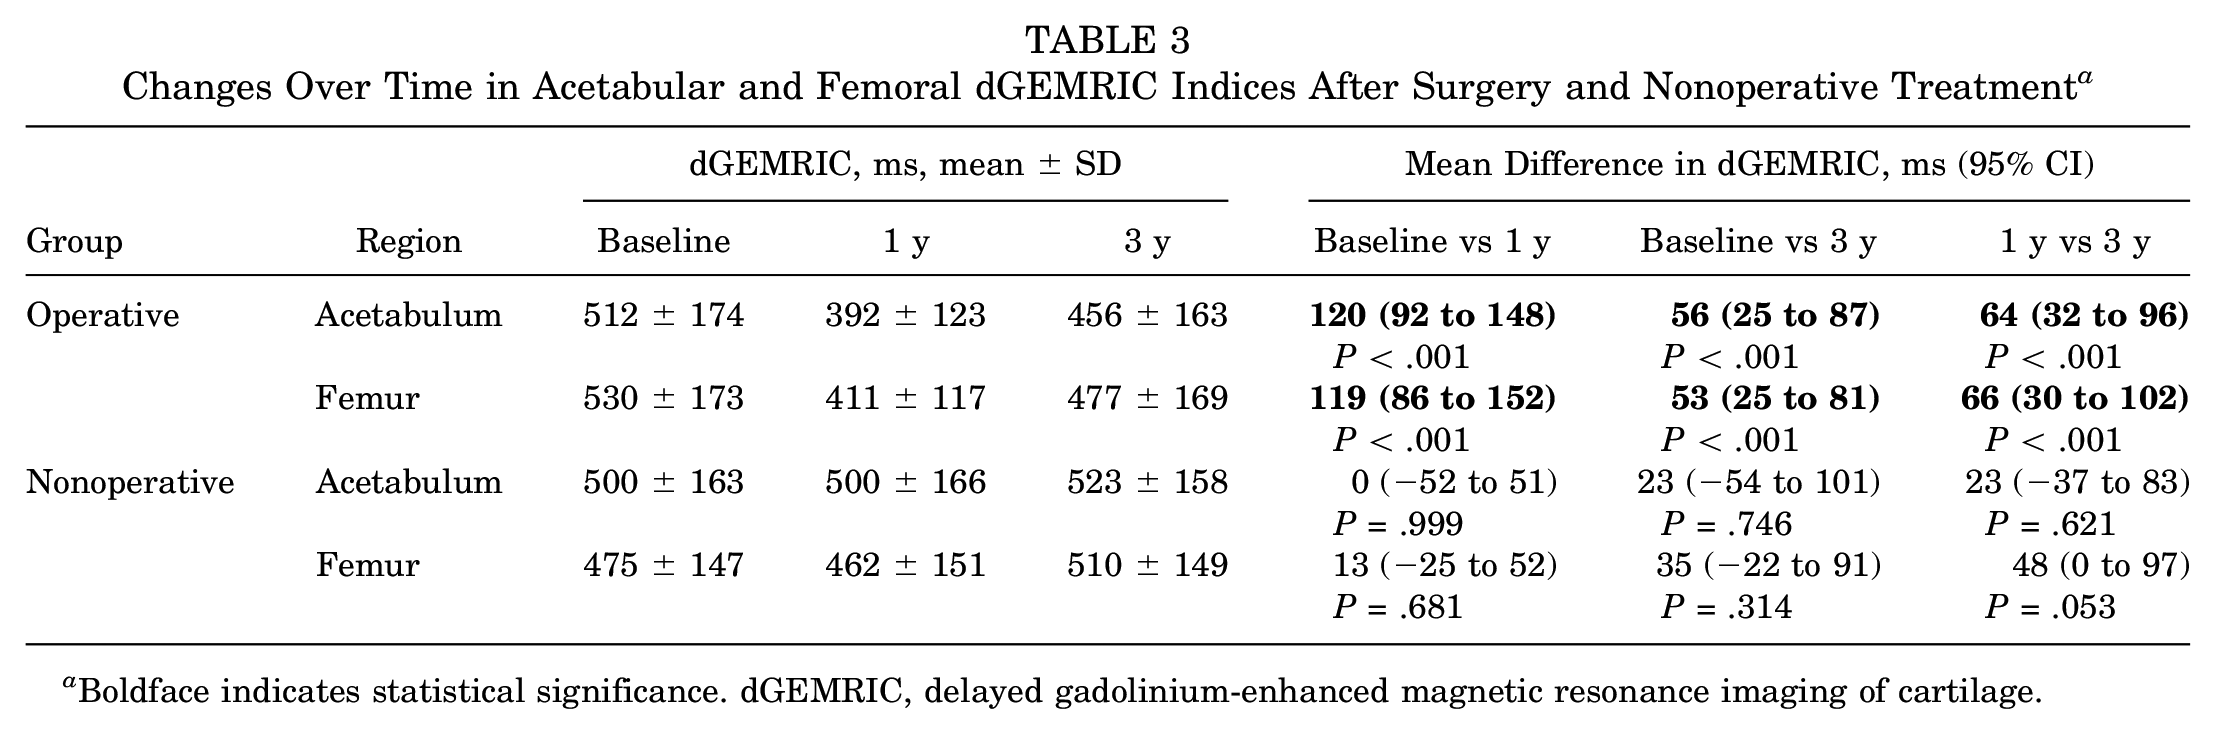
Boldface indicates statistical significance. dGEMRIC, delayed gadolinium-enhanced magnetic resonance imaging of cartilage.
The nonoperative group showed no significant changes in dGEMRIC indices from baseline to 1-year follow-up. The difference in acetabular dGEMRIC was 0 (95% CI, −52 to 51; P > .999), from 500 ± 163 at baseline to 500 ± 166 ms at 1 year. The difference in femoral dGEMRIC was 13 ms (95% CI, −25 to 52 ms; P = .681), from 475 ± 147 at baseline to 462 ± 151 ms at 1 year. From 1-year follow-up to 3-year follow-up, there were also no significant changes in dGEMRIC indices in the nonoperative group. The difference in acetabular dGEMRIC was 23 ms (95% CI, −37 to 83 ms; P = .621), from 500 ± 166 at 1 year to 523 ± 158 ms at 3 years. The difference in femoral dGEMRIC was 48 ms (95% CI, 0 to 97 ms; P = .053), from 462 ± 151 at 1 year to 510 ± 149 ms at 3 years (Figure 3; Table 3).
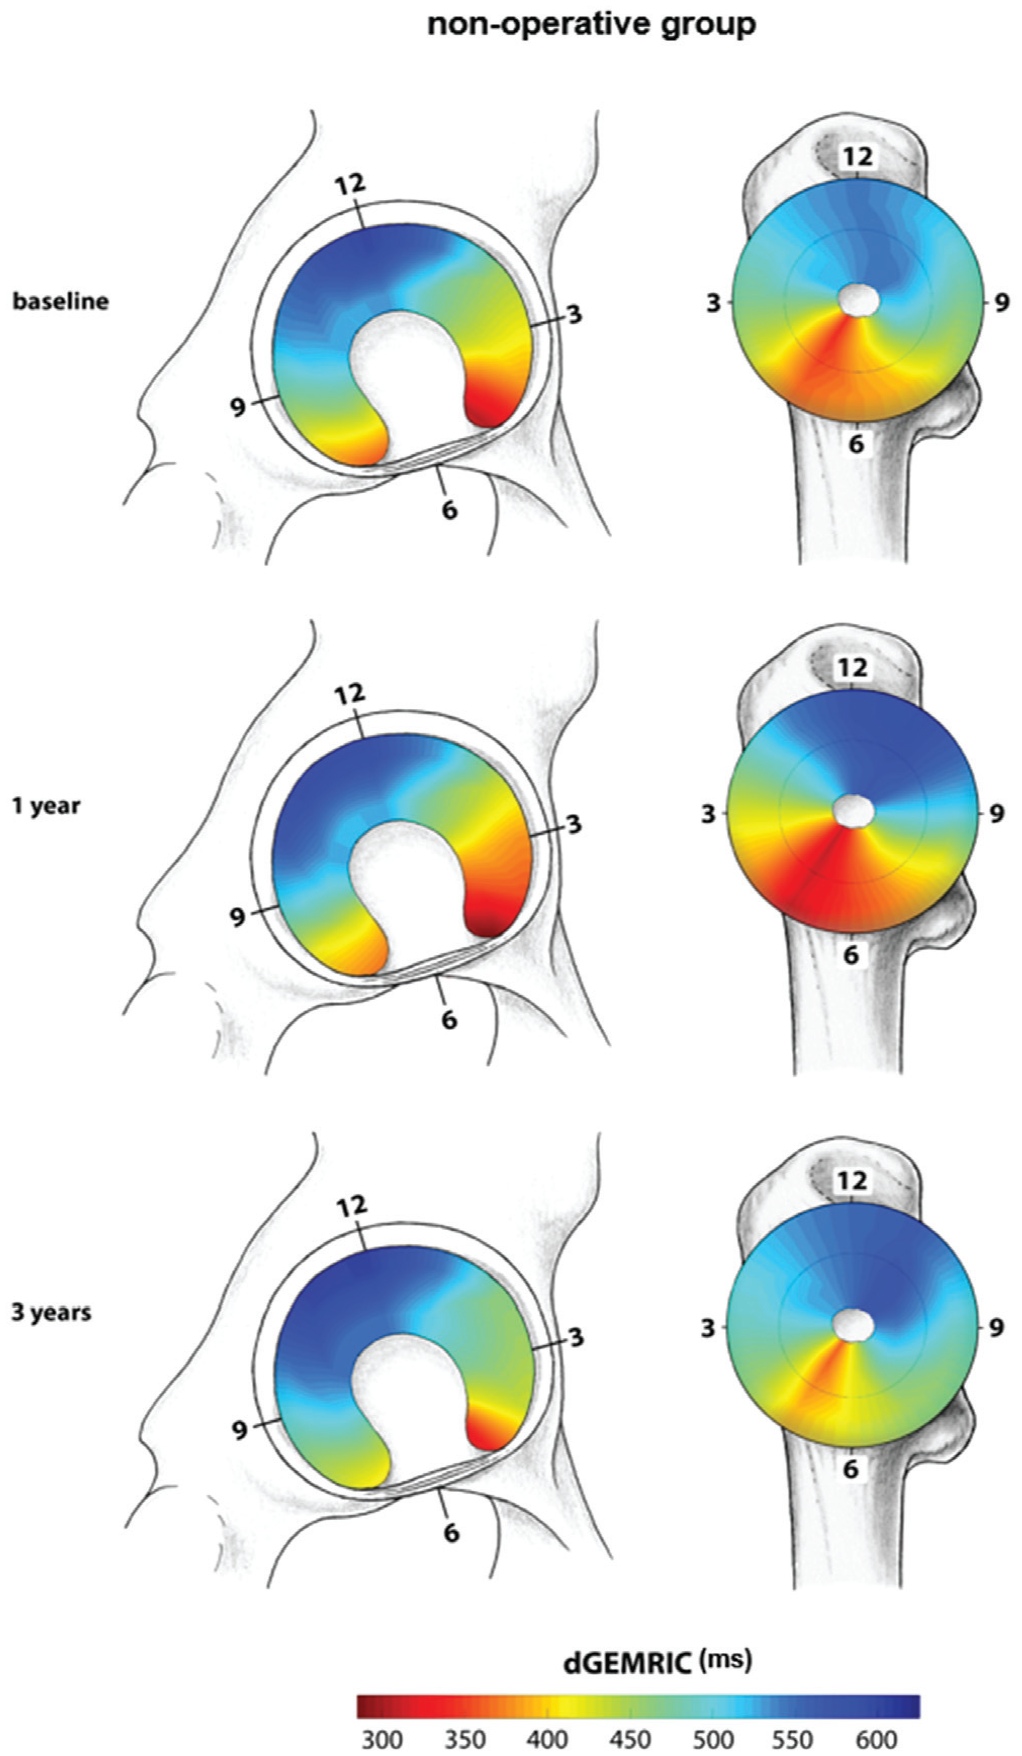
Color-coded mapping of regional distribution of delayed gadolinium-enhanced magnetic resonance imaging of cartilage (dGEMRIC) indices of the nonoperative group at baseline and at 1 year and 3 years of follow-up, indicating no significant change in dGEMRIC indices.
Patient-Reported Outcome Measures
In the operative group, the mean WOMAC score decreased from 51 ± 46 points at baseline to 27 ± 29 points at 3-year follow-up, with 65% (13/20) of patients achieving MCID. The mean UCLA score increased from 4.1 ± 3.6 points at baseline to 5.9 ± 2.1 points at 3-year follow-up, with 75% (15/20) of patients achieving MCID. The mean mHHS increased from 41 ± 27 points at baseline to 75 ± 11 points at 3-year follow-up, with 85% (17/20) of patients achieving MCID (Table 4).
PROMs of the Nonoperative and Operative Study Groups With Number of Patients Achieving MCID Over Time a
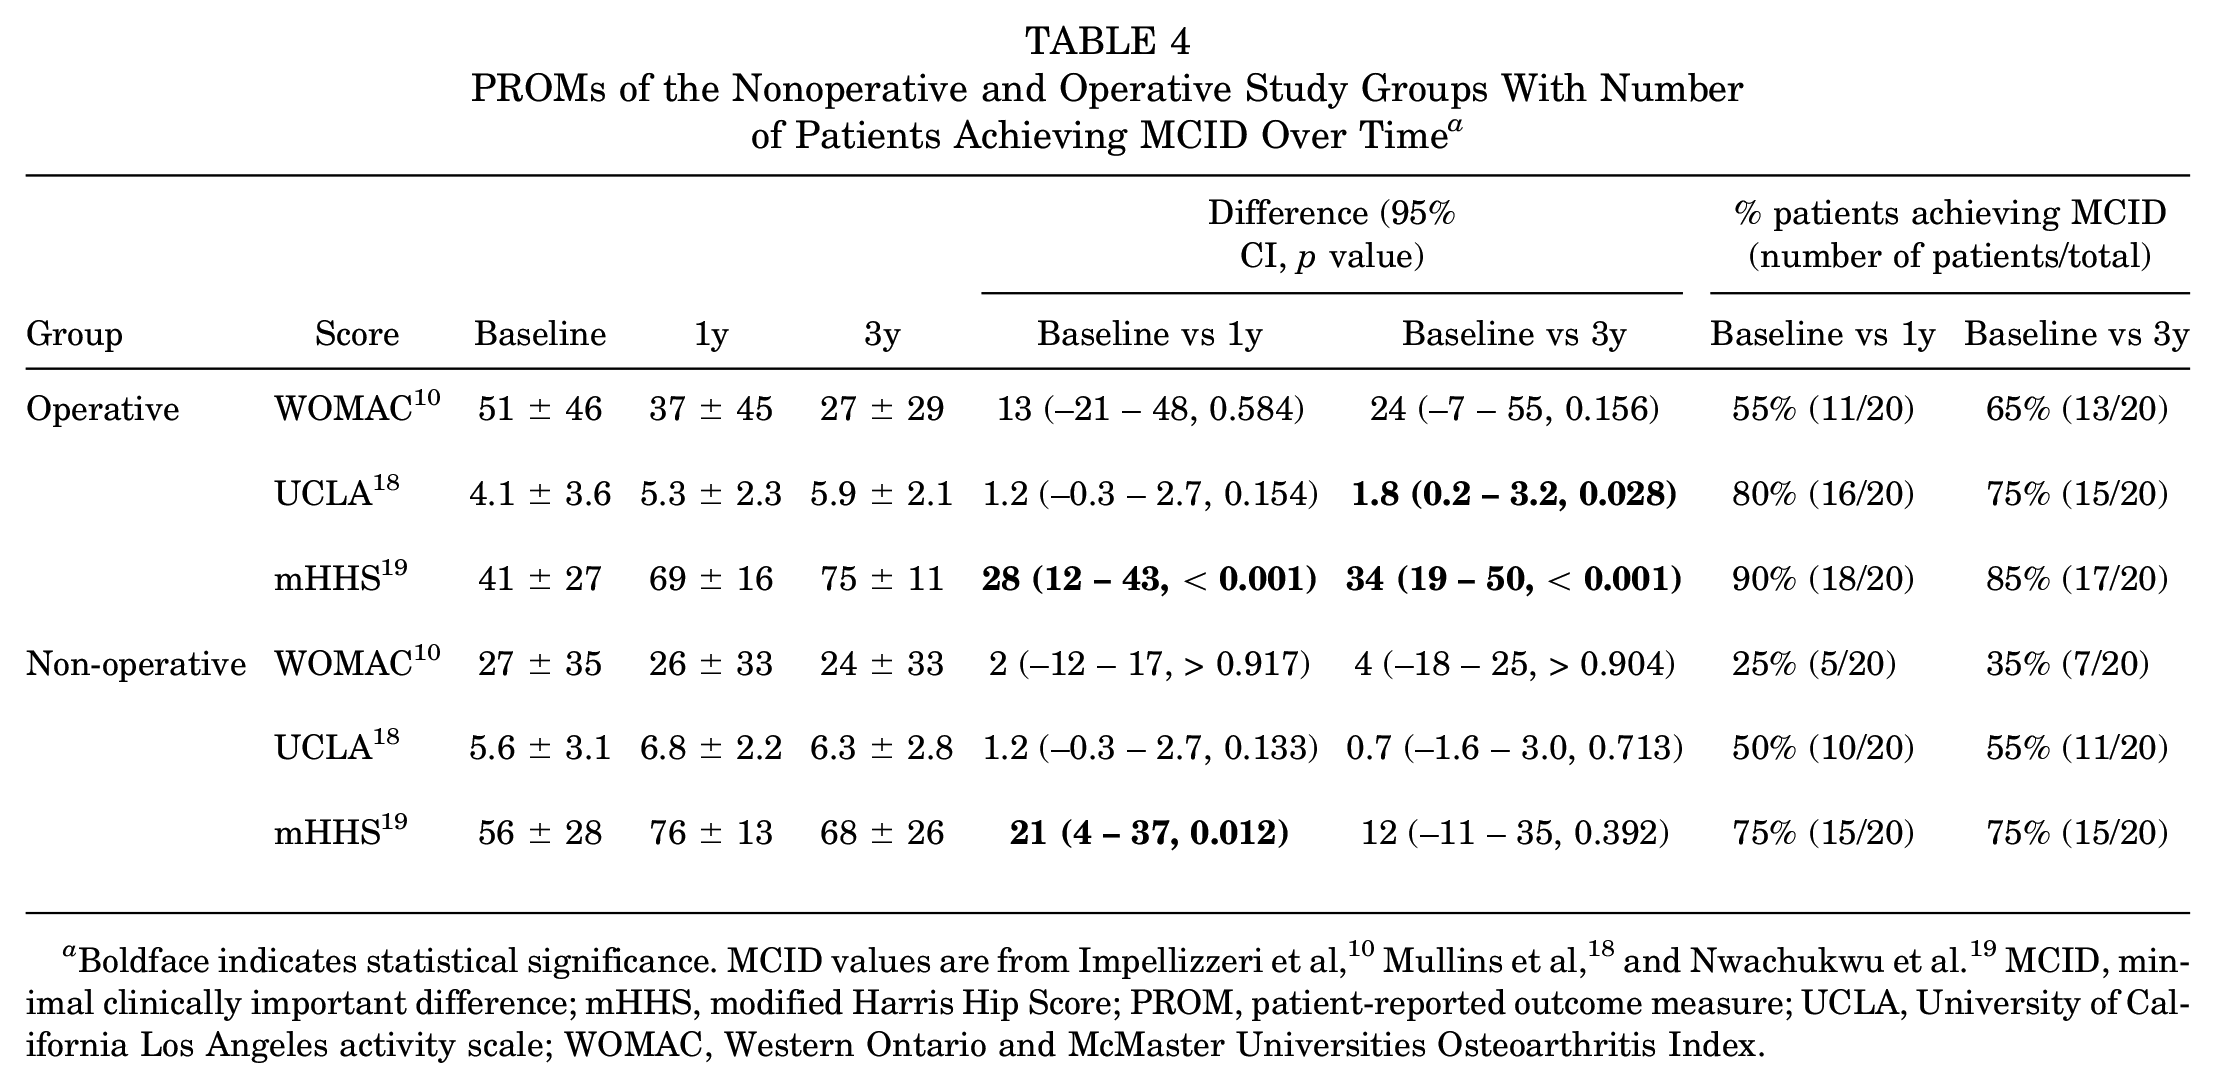
Boldface indicates statistical significance. MCID values are from Impellizzeri et al, 10 Mullins et al, 18 and Nwachukwu et al. 19 MCID, minimal clinically important difference; mHHS, modified Harris Hip Score; PROM, patient-reported outcome measure; UCLA, University of California Los Angeles activity scale; WOMAC, Western Ontario and McMaster Universities Osteoarthritis Index.
In the nonoperative group, the mean WOMAC score decreased from 27 ± 35 points at baseline to 24 ± 33 points at 3-year follow-up, with 35% (7/20) of patients achieving MCID. The mean UCLA score increased from 5.6 ± 3.1 points at baseline to 6.3 ± 2.8 points at 3-year follow-up, with 55% (11/20) of patients achieving MCID. The mean mHHS increased from 56 ± 28 points at baseline to 68 ± 26 points at 3-year follow-up, with 75% (15/20) of patients achieving MCID (Table 4).
The difference in mean WOMAC score correlated with the mean baseline dGEMRIC index for both acetabular (r = 0.60; P = .005) and femoral (r = 0.62; P = .004) cartilage in the operative group (Appendix Table A1, available in the online version of this article). No other correlations between mean baseline dGEMRIC indices and differences in PROMs were found (Appendix Table A1, available online).
Discussion
This is the extended follow-up of the initial cohort reporting a dGEMRIC decrease after FAI surgery at 1-year follow-up despite good clinical outcome. 24 Most important, we observed a partial recovery of dGEMRIC indices at 3-year follow-up after an initial decrease of dGEMRIC indices at 1-year follow-up after FAI surgery (example patient demonstrated in Figure 4). In the operative group, the acetabular dGEMRIC results recovered by 64 ms (P < .001), from 392 ± 123 ms at 1 year to 456 ± 163 ms at 3 years, and the femoral dGEMRIC results recovered by 66 ms (P < .001), from 411 ± 177 ms at 1 year to 477 ± 169 ms at 3 years, in accordance with most patients meeting the MCID. In addition, the improvement in WOMAC score from baseline to 3-year follow-up correlated significantly with the mean baseline dGEMRIC indices. By contrast, no changes in dGEMRIC indices were observed in the nonoperative group, with up to 75% patients achieving MCID.
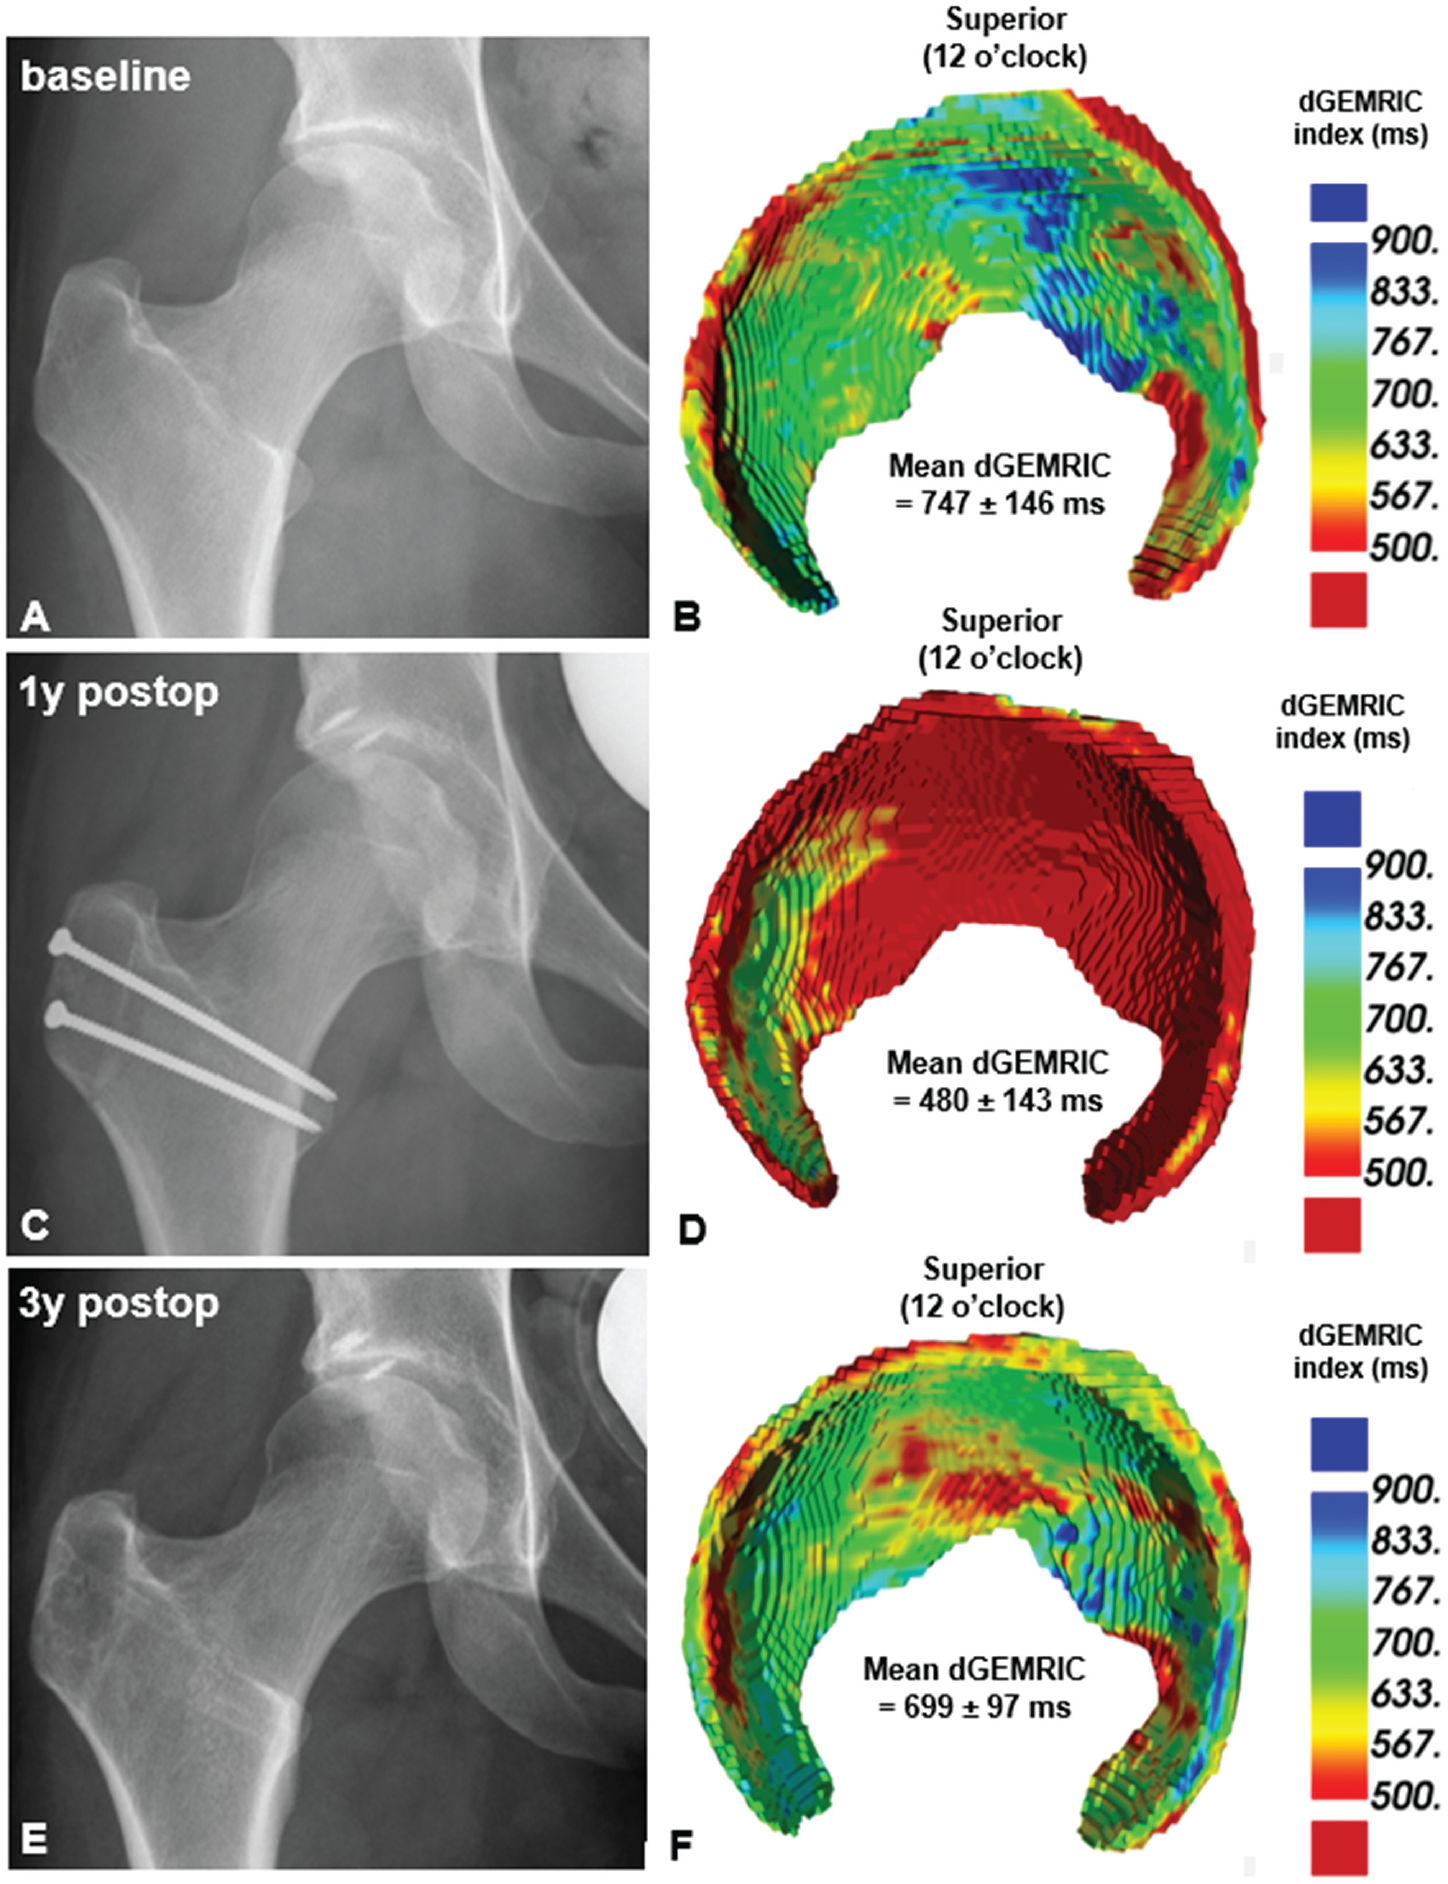
(A) Anteroposterior pelvic radiograph of a 22-year-old female patient presenting with hip pain due to mixed femoroacetabular impingement with (B) corresponding baseline 3-dimensional (3D) delayed gadolinium-enhanced magnetic resonance imaging of cartilage (dGEMRIC) cartilage model indicating good cartilage quality (mean, 747 ± 146 ms). (C) At 1-year follow-up, the width of the joint space without progression in Tönnis grade. (D) The corresponding 3D dGEMRIC cartilage model shows a marked decrease in dGEMRIC indices (mean, 480 ± 143 ms). (E) At 3 years of follow-up, no progression of Tönnis grade is seen radiographically, but (F) the 3D dGEMRIC cartilage model indicates a partial recovery of the dGEMRIC indices with a mean of 699 ± 97 ms almost reaching baseline dGEMRIC values. postop, postoperative.
In a randomized controlled multicenter study (FASHIoN trial), Hunter et al 9 compared dGEMRIC indices of patients with FAI who were treated either arthroscopically or with physical therapy. The investigators reported no significant changes in dGEMRIC indices at 1-year follow-up in either the operative (baseline 680 ± 119 ms to 1-year follow-up 677 ± 123 ms; P = .142) or the nonoperative group (baseline 667 ± 127 ms to 1-year follow-up 723 ± 146 ms; P = .137). 9 In that study, dGEMRIC was performed at multiple sites with multiple scanners, which can be problematic.13,15 One of the challenges when applying quantitative imaging techniques is the reproducibility of the results across different MRI scanners.13,15 Compared with newer sequences for dGEMRIC, the previously applied dual-flip angle-based method is prone to variations in magnetic field homogeneities (B1 inhomogeneity), which can differ substantially between different scanners and require meticulous calibration when applied at different scanners.2,22 If scanner calibration is not performed, it is recommended to scan patients consistently with the same scanner to limit this potential bias, which is why we performed all the scans on one scanner. 36
Our literature search revealed only 2 other studies investigating dGEMRIC indices longitudinally after joint-preserving hip surgery. Hingsammer et al 7 reported a decrease in dGEMRIC indices at 1-year follow-up (baseline 562 ± 118 ms to 1-year follow-up 515 ± 118; P < .001) and a partial recovery after 2 years (529 ± 99 ms; P < .001) in patients undergoing periacetabular osteotomy (PAO) for correction of hip dysplasia. The same authors also distinguished between superficial and deep cartilage layers and found this effect to be more pronounced in the superficial cartilage layers. 8 The authors discussed several potential reasons for the initial dGEMRIC decrease, including elevated postoperative levels of interleukin 6, which lead to glycosaminoglycan loss in articular cartilage, and the effect of protected weightbearing on proteoglycan content. 7 However, in contrast to their study, which included patients with hip dysplasia and static hip instability, our patient cohort included patients with FAI, in which the underlying pathomechanism is a dynamic abutment of the femur against the acetabulum. Furthermore, our study differs from the studies by Hingsammer and colleagues7,8 in terms of surgical procedure. PAO is an extra-articular surgery, whereas hip arthroscopy and surgical hip dislocation, which were performed in our study, are intra-articular surgical procedures requiring capsulotomy. In contrast to extra-articular surgery, intra-articular surgery may lead to a more pronounced induction of the inflammatory response due to bleeding of the cancellous bone and release of inflammatory mediators after femoral and acetabular osteoplasty.7,12 This may be a potential explanation for the larger decrease in dGEMRIC indices observed in our FAI population as opposed to patients with hip dysplasia undergoing PAO in the studies by Hingsammer et al.7,8 In addition, cartilage remodeling occurs after joint-preserving surgery due to modified joint biomechanics and contact stresses, which might be more pronounced in PAO compared with hip arthroscopy and surgical hip dislocation due to induction of remodeling in the acetabular fossa. 34 This is supported by finite element studies that showed cartilage contact area increased medially with large reductions in contact stress anteriorly and laterally after PAO. 1
The partial recovery of dGEMRIC indices from 1 to 3 years postoperatively may be explained by the transient induction of the inflammatory cascade7,12 and the short-term effect of partial weightbearing.20,33 Although these effects decrease over time, the altered joint biomechanics and consecutive redistribution in joint reaction forces may explain our observation that at 3-year follow-up, the dGEMRIC indices had not recovered to baseline values.
Clinical Implications
The standard assessment of dGEMRIC maps requires time-consuming re-formation and region of interest placement on very few selected images, as applied in previous studies.7-9,24 By contrast, a deep learning approach was used in the current study for a more objective assessment independent of reader bias. This approach further enables fast and automatic assessment of the entire cartilage volume, which makes this approach feasible for clinical routine and opens the door for large population-based studies.
Limitations
This study has several limitations. We observed a relatively high dropout rate over the individual study period of ≥3 years for each patient. However, this dropout rate was balanced for both groups, so we do not consider this to be a potential selection bias. Nevertheless, the final sample size of 20 in each group precludes subgroup analysis regarding morphology and surgical approach. Future studies may examine these factors in patients with FAI to further our understanding of the effect of these factors. Furthermore, the dGEMRIC technique we used is susceptible to B1 inhomogeneity. However, this potential bias was mitigated in the present study by using the same scanner and a uniform approach for all time points. However, use of only 1 scanner has the disadvantage of decreasing the possibility of a large-scale sequence implementation. Another limitation is that the baseline clinical symptoms were not comparable between groups. This fact might be mitigated by the comparable osseous deformities.
In conclusion, this study showed that 3 years after FAI correction, the dGEMRIC indices improved compared with short-term 1-year follow-up. This may be due to normalized joint biomechanics or regressive postoperative activation of the inflammatory cascade after intra-articular surgery.
Supplemental Material
sj-pdf-1-ajs-10.1177_03635465231167854 – Supplemental material for Does the dGEMRIC Index Recover 3 Years After Surgical FAI Correction and an Initial dGEMRIC Decrease at 1-Year Follow-up? A Controlled Prospective Study
Supplemental material, sj-pdf-1-ajs-10.1177_03635465231167854 for Does the dGEMRIC Index Recover 3 Years After Surgical FAI Correction and an Initial dGEMRIC Decrease at 1-Year Follow-up? A Controlled Prospective Study by Malin Kristin Meier, Samira Scheuber, Markus Simon Hanke, Pascal Cyrill Haefeli, Adrian Cyrill Ruckli, Emanuel Francis Liechti, Nicolas Gerber, Till Dominic Lerch, Moritz Tannast, Klaus Arno Siebenrock, Simon Damian Steppacher and Florian Schmaranzer in The American Journal of Sports Medicine
Footnotes
Submitted October 10, 2022; accepted February 16, 2023.
One or more of the authors has declared the following potential conflict of interest or source of funding: This project was funded by the Swiss National Science Foundation (grant No. 84801742) and the Clinical Trials Unit of the University of Bern (grant No. 135627). F.S. has received speaking fees from Geistlich. AOSSM checks author disclosures against the Open Payments Database (OPD). AOSSM has not conducted an independent investigation on the OPD and disclaims any liability or responsibility relating thereto.
References
Supplementary Material
Please find the following supplemental material available below.
For Open Access articles published under a Creative Commons License, all supplemental material carries the same license as the article it is associated with.
For non-Open Access articles published, all supplemental material carries a non-exclusive license, and permission requests for re-use of supplemental material or any part of supplemental material shall be sent directly to the copyright owner as specified in the copyright notice associated with the article.