
Abstract
Background:
An undersized hamstring tendon (HT) autograft is significantly associated with a higher graft failure rate in anterior cruciate ligament reconstruction (ACLR) surgery. The ability to accurately predict inadequate HT graft diameter is critical, as it could assist surgeons in making better graft choices and surgical plans.
Purpose:
To develop a web-based prediction tool to better assess the size of HT autograft and to help clinicians accurately identify patients with potentially undersized HT grafts in order to make appropriate clinical decisions.
Study Design:
Cross-sectional study; Level of evidence, 3.
Methods:
A total of 588 patients who received primary arthroscopic single-bundle ACLR surgery with gracilis tendon (GT) and semitendinosus tendon (ST) autograft were retrospectively reviewed. According to the size of 4-strand HT graft, patients were divided into diameter ≥8 mm and <8 mm groups. The least absolute shrinkage and selection operator method and logistic regression were used to identify the independent factors associated with HT graft diameter and establish the models. The prediction performance of the model was evaluated by concordance index and calibration combined with external validation. The diagnostic performance of the prediction model was assessed by sensitivity, specificity, predictive values, and likelihood ratios. Decision curve analysis was used to evaluate the clinical utility of the model.
Results:
Among the numerous indicators, sex, weight, height, thigh length, and ST-GT diameter (measured on plane 1 of a magnetic resonance imaging scan) were identified to be highly correlated predictors that could provide satisfactory prediction performance in determining the HT graft diameter. Based on these predictors, a prediction model named the HTD model was developed with satisfactory discrimination (concordance index, 0.932) and calibration (mean absolute error, 0.039). When the probability calculated by the HTD model was >65%, the sensitivity and specificity of predicting 4-strand HT graft diameter ≥8 mm were 86.7% and 90.2%, respectively.
Conclusion:
As a useful supplementary prediction tool, the HTD model could accurately predict the diameter of HT autograft during preoperative planning.
Anterior cruciate ligament (ACL) injury is one of the most common sports injuries, although it occurs in trauma patients as well as athletes. ACL reconstruction (ACLR) is an important treatment that uses grafts, mainly allografts and autografts such as the bone–patellar tendon–bone, quadriceps tendon, and hamstring tendon (HT).22,29 Among them, the HT autograft (semitendinosus tendon [ST] and gracilis tendon [GT]) has gradually become the preferred choice for some surgeons.3,6,19,20,33 Although good functional outcomes have been observed with HT autograft, the potential adverse aspects associated with an undersized autograft need to be noted, especially in young patients.14,35 When performing an ACLR with HT, the surgeon should give predominant consideration to the graft diameter, as a graft diameter <8 mm has been significantly associated with a higher graft failure rate.26-28 One study found that more than half of the HT grafts did not reach the ideal size. 25 If an undersized HT graft was found intraoperatively, the operators usually produced a 5- or 6-strand configuration to increase the diameter of the HT autograft. 16 However, recent biomechanical studies have found that although the multistrand configurations increased the diameter, they did not significantly improve the stiffness and displacement of HT graft compared with the 4-strand configuration.9,31 A prospective randomized controlled trial demonstrated that the routinely used 5-strand HT graft did not present superior clinical outcomes compared with the 4-strand configuration. 15 These findings suggest that the use of a multistrand configuration as a remedy to increase 4-strand HT graft diameter might not improve the results. When the diameter of a multistrand autograft is inadequate intraoperatively, it has been common practice to increase the diameter of the graft by integrating supplementary allograft. Researchers found that the overall failure rates of autograft reconstructions, allograft reconstructions, and hybrid reconstructions were 8.9%, 13.2%, and 20.0%, respectively. 23 HT autografts augmented with allograft may increase the graft failure rate. 24 Therefore, preoperative evaluation of HT autograft diameter would be useful, as it could assist surgeons in making better graft choices and surgical plans.
Historically, to obtain information on HT graft size preoperatively, researchers attempted to use anthropometry and patient demographic characteristic to predict the diameter of the HT graft.2,13,34 Studies2,34 have investigated the relationship between height, weight, body mass index (BMI), sex, age, and HT autograft diameter, and some results suggested that height, weight, and BMI could be used to predict HT autograft diameter. However, other studies found that smaller graft diameter was related to female sex and age.13,21 A recent study with 1681 ACLRs revealed correlations between height, weight, sex, and HT graft size, and height was recommended as the most important anthropometric factor. 25 The available evidence indicated that predicting HT autograft size based on demographic and anthropometric characteristics had led to inconsistent conclusions and lacked sufficient accuracy.21,25,34 A consensus on reliable predictors was needed.
With the development of imaging techniques, researchers began to focus on magnetic resonance imaging (MRI), hoping to find a more direct and reliable method to estimate the size of the GT and ST. The cross-sectional area (CSA) of the ST and GT was the most commonly used measurement on MRI scans.11,17 Grawe et al 8 measured CSA of the ST and GT at the widest condylar dimension of the femur on MRI scans and suggested that a total CSA of >22 mm2 could reliably predict HT autograft diameter of >8 mm. Hanna et al 10 and Hodges et al 11 reported that the minimum total CSA to ensure HT graft diameter ≥8 mm was 17.2 mm2 and 18 mm2, respectively, based on measurements in 3 MRI planes. In addition to the variation of measurement planes, different field strengths and magnification of MRI will also lead to variation of CSA measurement.2,12 Compared with anthropometric and demographic characteristics, CSA measurements could predict HT autograft diameter more accurately. 5 However, several studies reached different conclusions regarding the threshold values of this indicator. Recent studies8,10-12,17 reported a large variation in CSA (16.9-28.1 mm2), this wide range of values was not conducive for clinicians to select. In clinical practice, it is difficult to reach a consensus on the CSA threshold. In addition, using CSA alone to predict HT autograft diameter might be limited by considerable variability (r = 0.42-0.93) in the correlation between CSA and HT autograft diameter. 1
Because of the limitations in using either anthropometrics or CSA alone, combining patient characteristics and MRI measurements might better evaluate the size of HT. The ability to accurately predict inadequate HT graft diameter is critical in the preoperative planning of ACLR. A relatively intelligent prediction tool to assist clinicians in the preoperative evaluation of HT graft diameter is currently lacking. Some patient characteristics and MRI measurements are uniquely associated with the size of HT autografts, according to our clinical experience. We preferred to translate this clinical experience into scientific statistical prediction. Among all the available models, nomogram can provide an individualized, evidence-based, and highly accurate risk estimation, which is easy to use and can facilitate management-related decision-making. The purposes of our study included the following: (1) to incorporate more patient characteristics and imaging measurements for a comprehensive analysis to determine reliable and accurate predictors and (2) to establish a web-based dynamic nomogram to identify patients with undersized HT graft diameter. We hypothesized that this online prediction tool would easily and accurately assist clinicians in preoperatively identifying patients with potentially inadequate diameter of HT graft.
Methods
Patient Cohort
Between January 2016 and January 2022, data of 588 patients who received primary arthroscopic single-bundle ACLR with ST-GT autograft at our medical institution and another institution were retrospectively collected. The ethics committee of our hospital approved this study. Based on inclusion and exclusion criteria, 472 participants were eventually enrolled in the study. Among these patients, 318 patients (66 women and 252 men; mean age, 29.4 years) who underwent ACLR at our institution between January 2016 and December 2019 were included in the training cohort, and 101 patients (19 women and 82 men; mean age, 28.5 years) who underwent ACLR at our institution between January 2020 and January 2022 were included in the validation cohort. Data from 53 patients (9 women and 44 men; mean age, 32.1 years) who underwent ACLR at another institution were used as the external validation cohort. The inclusion criterion was that preoperative knee MRI scans of the patients were collected from the picture archiving and communication system. Patients who had previous other knee surgeries, multiple-ligament injuries of the knee, and previous injuries of the hamstring were excluded. The flow chart of the study is presented in Figure 1.
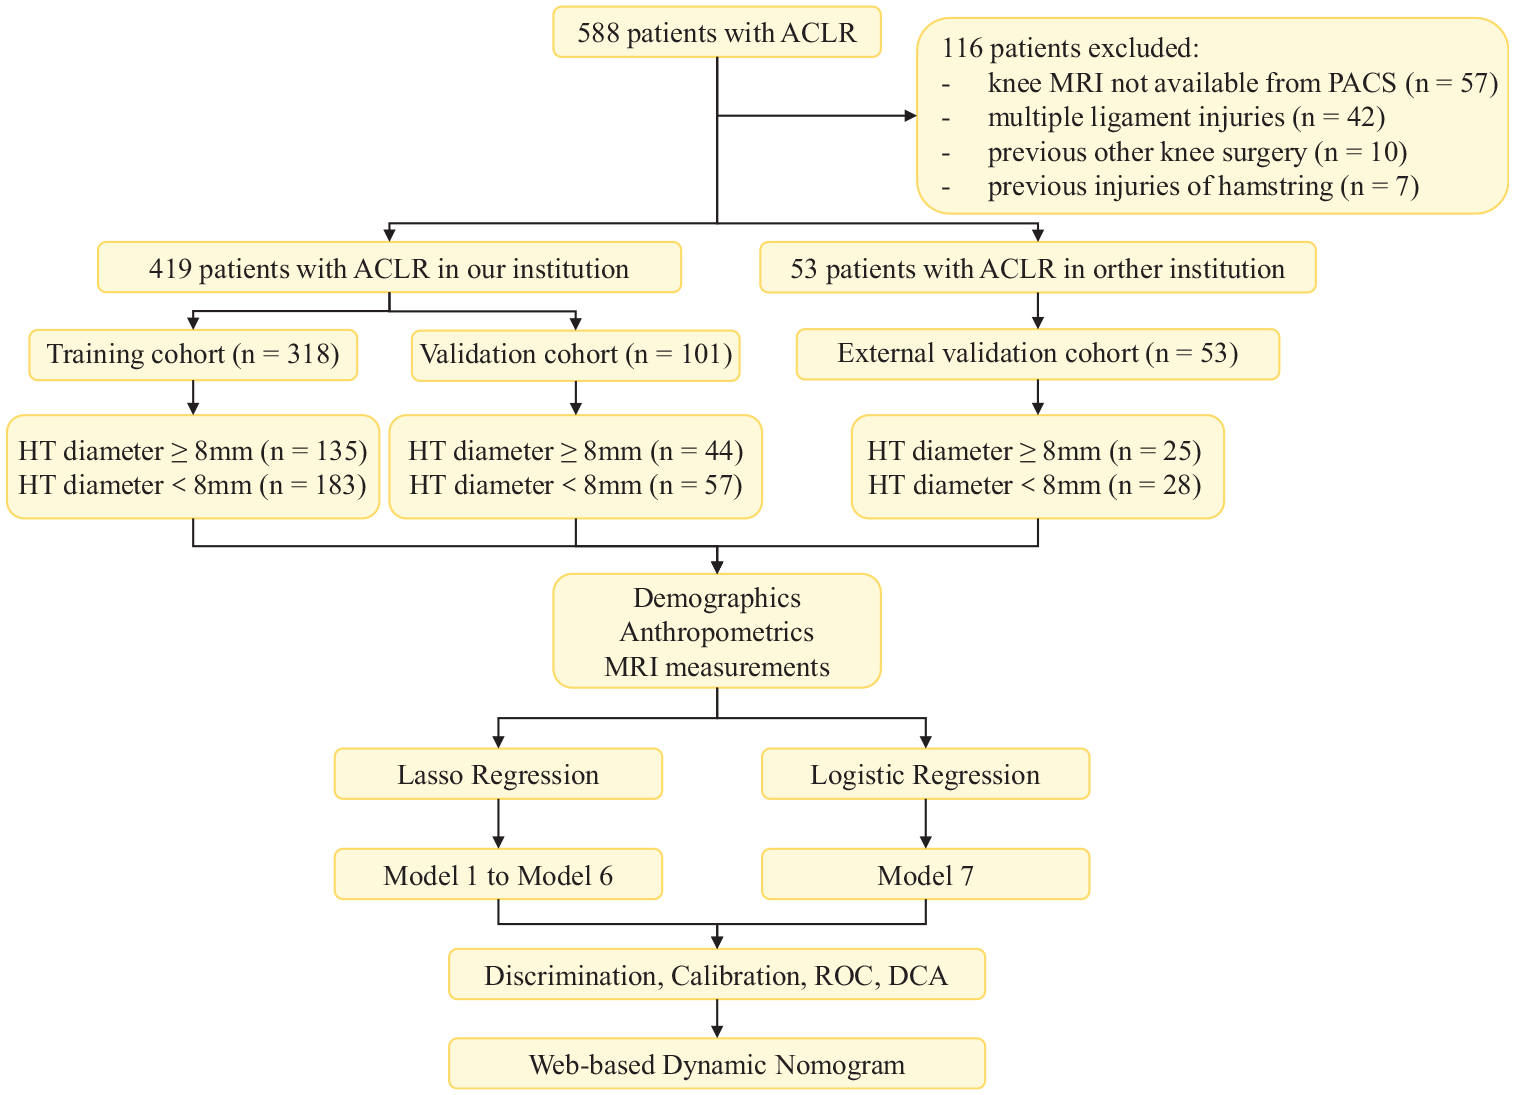
Flow chart showing the process of patient selection, the inclusion of observation indicators, and statistical analysis. ACLR, anterior cruciate ligament reconstruction; DCA, decision curve analysis; HT, hamstring tendon; MRI, magnetic resonance imaging; PACS, picture archiving and communication system; ROC, receiver operating characteristic.
Patient data were collected, including sex, age, weight, height, BMI, duration of injury, cigarette smoking, alcohol consumption, lower limb length, thigh length, and shank length. Lower limb length was measured from the anterior superior iliac spine to the medial malleolus with a tape. Thigh length was defined as the distance from the anterior superior iliac spine to the medial knee joint line. The shank length was defined as the distance from the medial knee joint line to the medial malleolus. 18 The intraoperative autograft diameter was documented for each patient. Previous studies indicated that use of HT graft <8 mm in diameter was a significant risk factor for graft failure.26,27 In the current study, patients were divided into ≥8-mm and <8-mm groups according to their 4-strand HT graft diameter. If the 4-strand autograft size was <8 mm, 5- or 6-strand techniques were used for ACLR.
Ultimately, 135 patients and 183 patients were enrolled in the ≥8-mm group and <8-mm group, respectively, in the training cohort. A total of 44 patients and 57 patients were enrolled in the ≥8-mm group and <8-mm group, respectively, in the validation cohort. For patients who received ACLR at another institution (external validation cohort), 25 patients had HT graft diameter ≥8 mm, and the remaining 28 patients had grafts <8 mm in diameter. In the training cohort, 152 patients had 4-strand autografts ≥8 mm in diameter; in the remaining 166 patients with 4-strand autografts <8 mm in diameter, 5-strand or 6-strand techniques were used to increase the diameter of the graft. Further, 45 and 26 patients in the validation cohort and external validation cohort, respectively, had 4-strand grafts <8 mm in diameter; for these patients, graft diameter was increased using 5-strand or 6-strand techniques.
Autograft Harvesting Technique and Intraoperative Graft Size Measurement
All patients who underwent ACLR surgery were placed in the standard arthroscopic position with spinal anesthesia, and all of the procedures were performed by the same senior sports medicine surgeon (W.L.). The HT grafts were harvested through an anteromedial incision over the pes anserine. To expose the ST and GT, an L-shaped fascial incision was made over the sartorius fascia. Periosteal flaps were used to peel off the ST and GT distal insertions. A tendon stripper was used after clearing the tendon path of any fascial adhesions. As soon as the tendon was harvested, the associated muscle and fatty tissue were removed from each tendon individually. For patients who underwent 4-strand ST-GT surgery, both ends of the tendons were whipstitched using an Arthrex Fiber Loop construct. After graft preparation, the final graft size (measured at the thickest diameter of the prepared graft) was determined using a standard sizing block to the nearest 0.5 mm. The HT graft was then placed on 20 lb of tension.
Imaging Evaluation and Measurement
All patients included in the study underwent MRI with standard protocols within 3 weeks after the injury. T1-weighted, T2-weighted fast-spin-echo, and fat-suppressed gradient echo and proton density-weighted images (field of view, 220 mm; thickness, 3 mm) were obtained using a conventional 3.0-T MRI scanner (Siemens Medical Systems) with the knee in a neutral position. The tested knee joint was positioned in a relaxed state, maintained in external rotation of 15° to 20°, flexed at 15° to 30°, and padded to ensure that the patient was comfortable. According to previous reports, clinical importance, and clinical experience, the study evaluated the relationship between imaging indicators and HT autograft diameter. Two previously trained sports medicine clinicians (C.J. and Z.Z.Z.) evaluated these measurements. The consensus was reached after deliberation, and the average of variables was obtained using 3 repeat measurements.
Considering the variability of HT size between individuals, we selected 3 levels of MRI axial planes to measure the ST and GT. The first measurement level (plane 1) was the first plane in which the cross-section of semitendinosus and gracilis continued as an approximately elliptical tendon and could be simultaneously observed in the axial plane (MRI scan from cephalad to caudal) (Figure 2). The second measurement level (plane 2) was defined as the last axial plane where the continuation of the medial and lateral femoral condyles was observed (scan from cephalad to caudal) (Figure 2). The tibiofemoral joint line (plane 3) was chosen as the third measurement plane (Figure 2). These 3 measurement planes made the cross-section of ST and GT closest to an ellipse and facilitated localization on the axial plane. This was particularly important for accurate measurements and reliable predictions. For each tendon measurement (ST and GT), we measured the long and short diameters (long diameter, d1; short diameter, d2) of the corresponding cross-sections. We also measured the CSA of each tendon in these 3 axial planes with a region of interest tool. In this way, we could determine the d1, d2, and CSA of each tendon in these 3 planes (Figure 2).
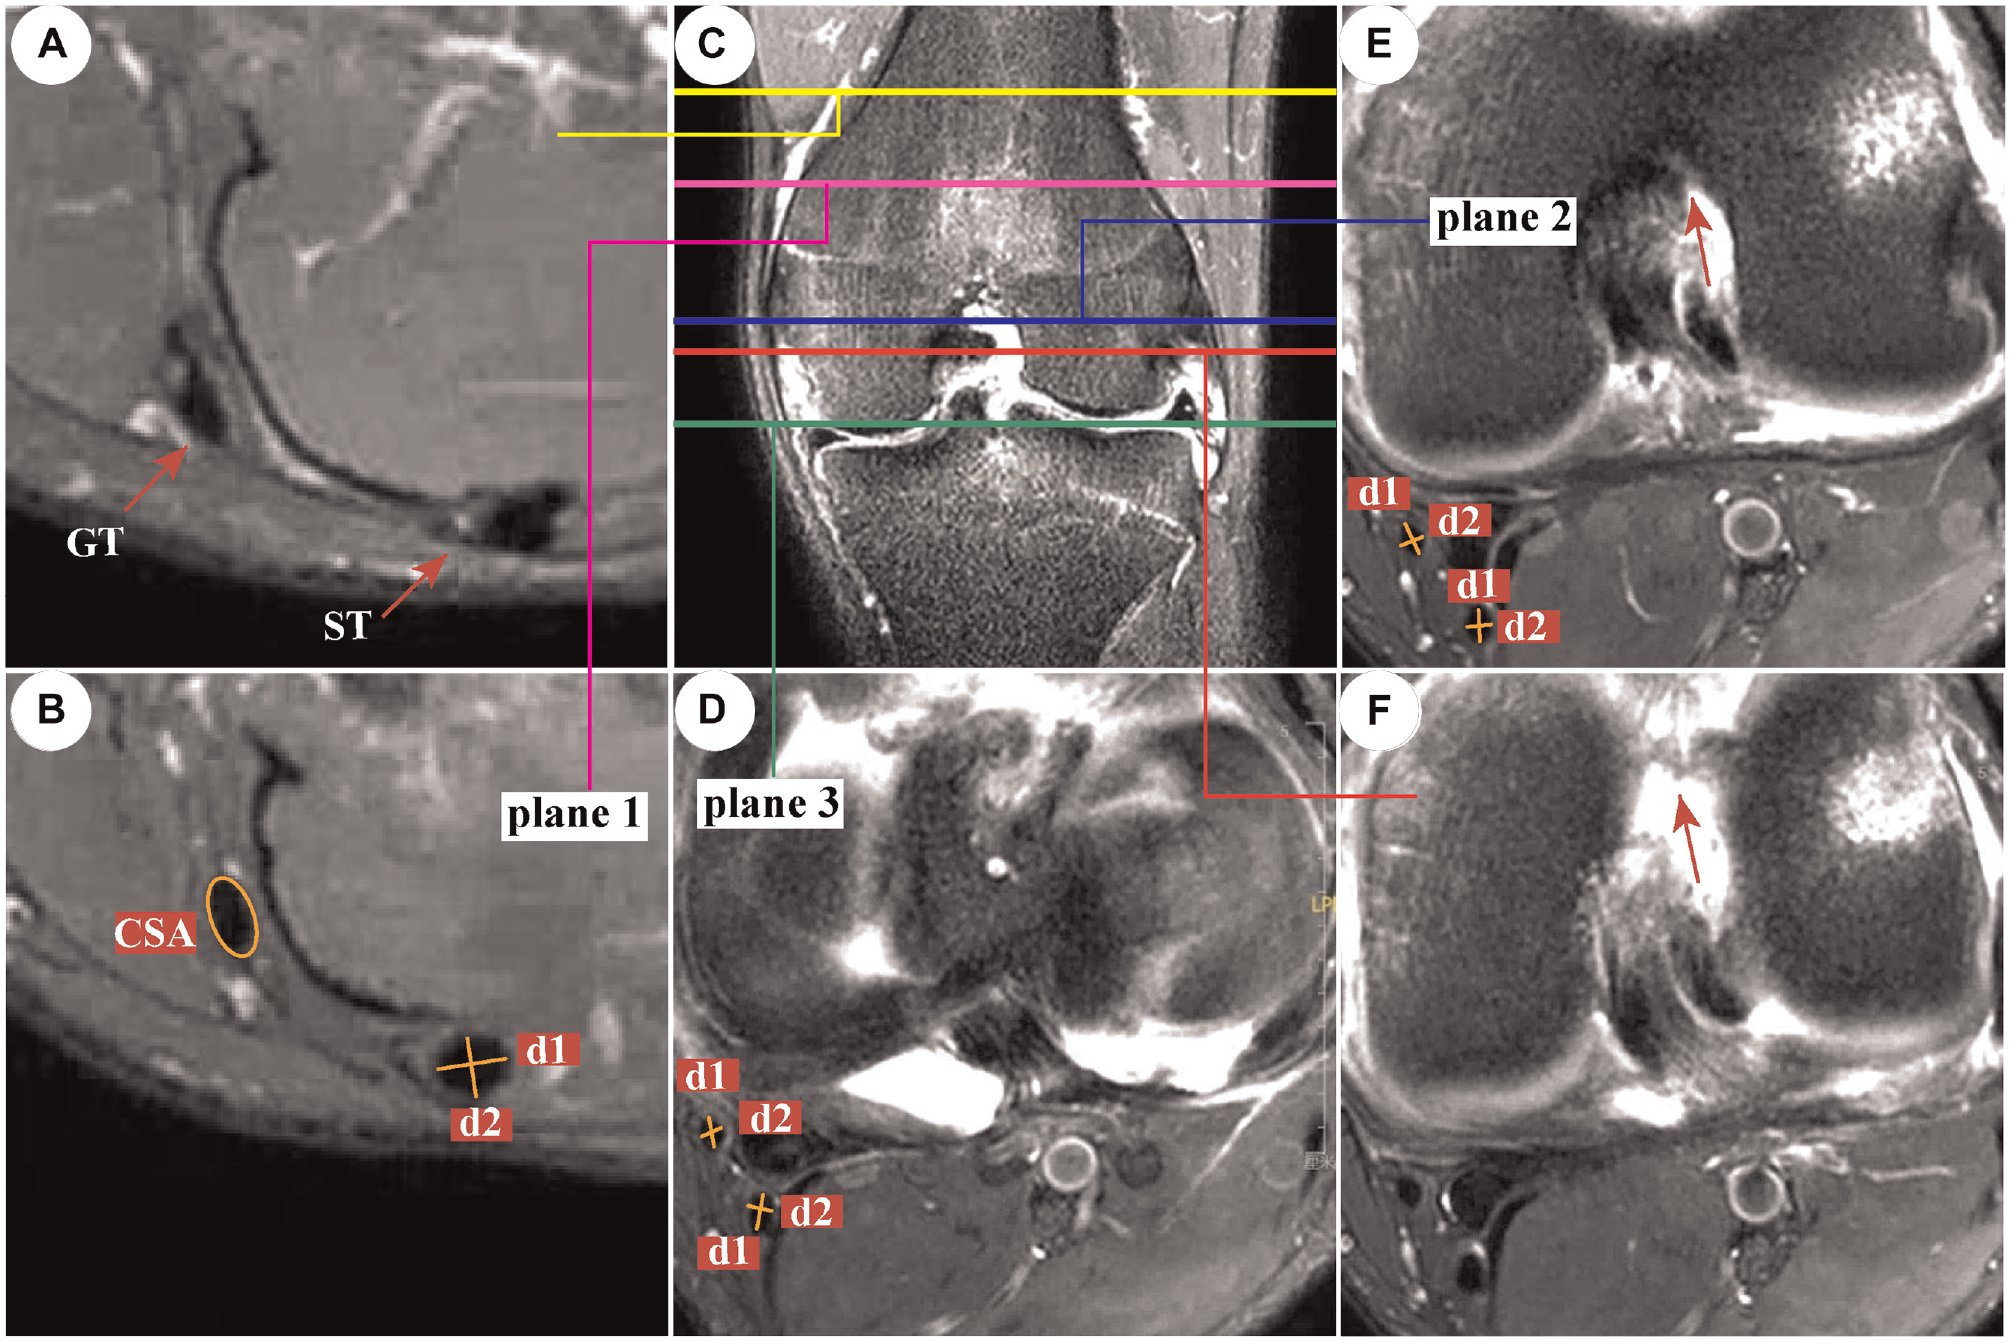
T2-weighted magnetic resonance imaging scans of semitendinosus tendon (ST) and gracilis tendon (GT). (A) The axial plane of the ST-GT was observed (red arrow), and the cross-sections of ST and GT were irregular. (B) The first axial plane (plane 1), where the cross-sections of ST and GT were simultaneously observed to be almost elliptical. (C) Coronal plane to explain the level of these 3 planes (plane 1, purple line; plane 2, blue line; plane 3, green line). (D) Axial plane at the tibiofemoral joint line (plane 3). (E) The last axial plane (plane 2), where the continuation of the medial and lateral femoral condyles was observed (red arrow). (F) The next level of plane 2, where the continuation of the medial and lateral femoral condyles disappeared. CSA, cross-sectional area; d1, long diameter; d2, short diameter.
Statistical Analysis
Continuous variables are presented as mean ± standard deviation, whereas categorical variables are expressed as whole numbers. A priori power analysis was performed to determine the sample size required to achieve the desired statistical power. To assess the distributional assumptions of the variables, a normality test with Kolmogorov-Smirnov test was performed. When the data did not meet the assumption of normality, nonparametric tests (Wilcoxon test) were used. Student t tests or nonparametric tests were used to assess the significance of continuous variables. Categorical variables were analyzed using chi-square tests or Fisher exact tests. Variables with significant differences (P < .05) were candidates for the least absolute shrinkage and selection operator (LASSO) method and 10-fold cross-validation, which is suitable for the regression of high-dimensional data. The advantage of LASSO regression is that the number of independent variables tends to decrease gradually as the penalty coefficient (lambda) increases. This helps researchers understand the variation in the contribution of each variable in the prediction process and facilitates the selection of appropriate indicators. After LASSO regression was used to select variables and establish the predictive model, logistic regression was performed for mutual validation. SPSS (Version 25.0; IBM) was used for statistical analysis, and the package “glmnet” in R (Version 4.0) was used to perform LASSO regression with 10-fold cross-validation.
According to the results of regression, a web-based dynamic nomogram was constructed using the “rms,”“DynNom,” and “shiny” packages of the R language Version 4.0 (http://www.r-project.org/). The predictive performance of the model was evaluated by the concordance index (C-index) as well as calibration with 1000 bootstrap samples. The specificity, sensitivity, likelihood ratios, and predictive values were calculated to evaluate the diagnostic performance of the prediction model. The clinical utility of this prediction model was evaluated using decision curve analysis (DCA).
Results
Screening for Variables Related to HT Graft Diameter
The clinical and imaging characteristics of patients are summarized in Tables 1 through 4. Drawing on clinical importance, clinical experience, and previous reports, we selected a total of 31 variables for analysis. Among these variables, 30 variables with P < .05 were determined as candidates by univariate analysis. LASSO regression was performed to select the optimal feature subset to construct the final model. One standard error of minimum lambda from a 10-fold cross-validation was used for parameter selection. According to this criterion (lambda = 0.02), 12 variables including weight, height, sex, thigh length, shank length, short and long diameters of ST and GT (plane 1), long diameter of GT (plane 2), and short and long diameters of ST (plane 3) were identified to be highly correlated with HT autograft diameter (Figure 3).
Patient Characteristics in Training Cohort a
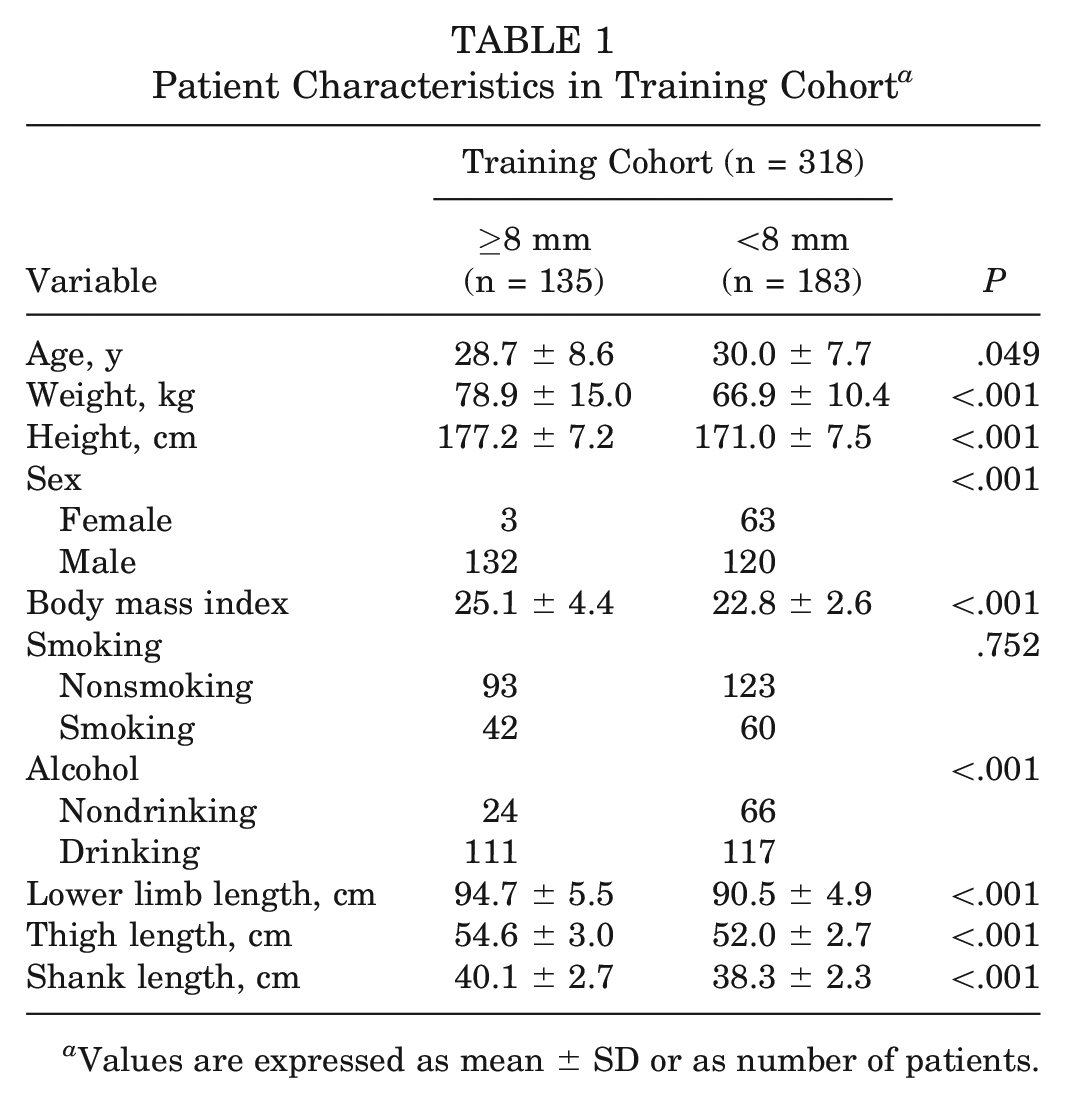
Values are expressed as mean ± SD or as number of patients.
Patient Characteristics in Validation Cohort and External Validation Cohort a

Values are expressed as mean ± SD or as number of patients.
Magnetic Resonance Imaging Measurements in Training Cohort a
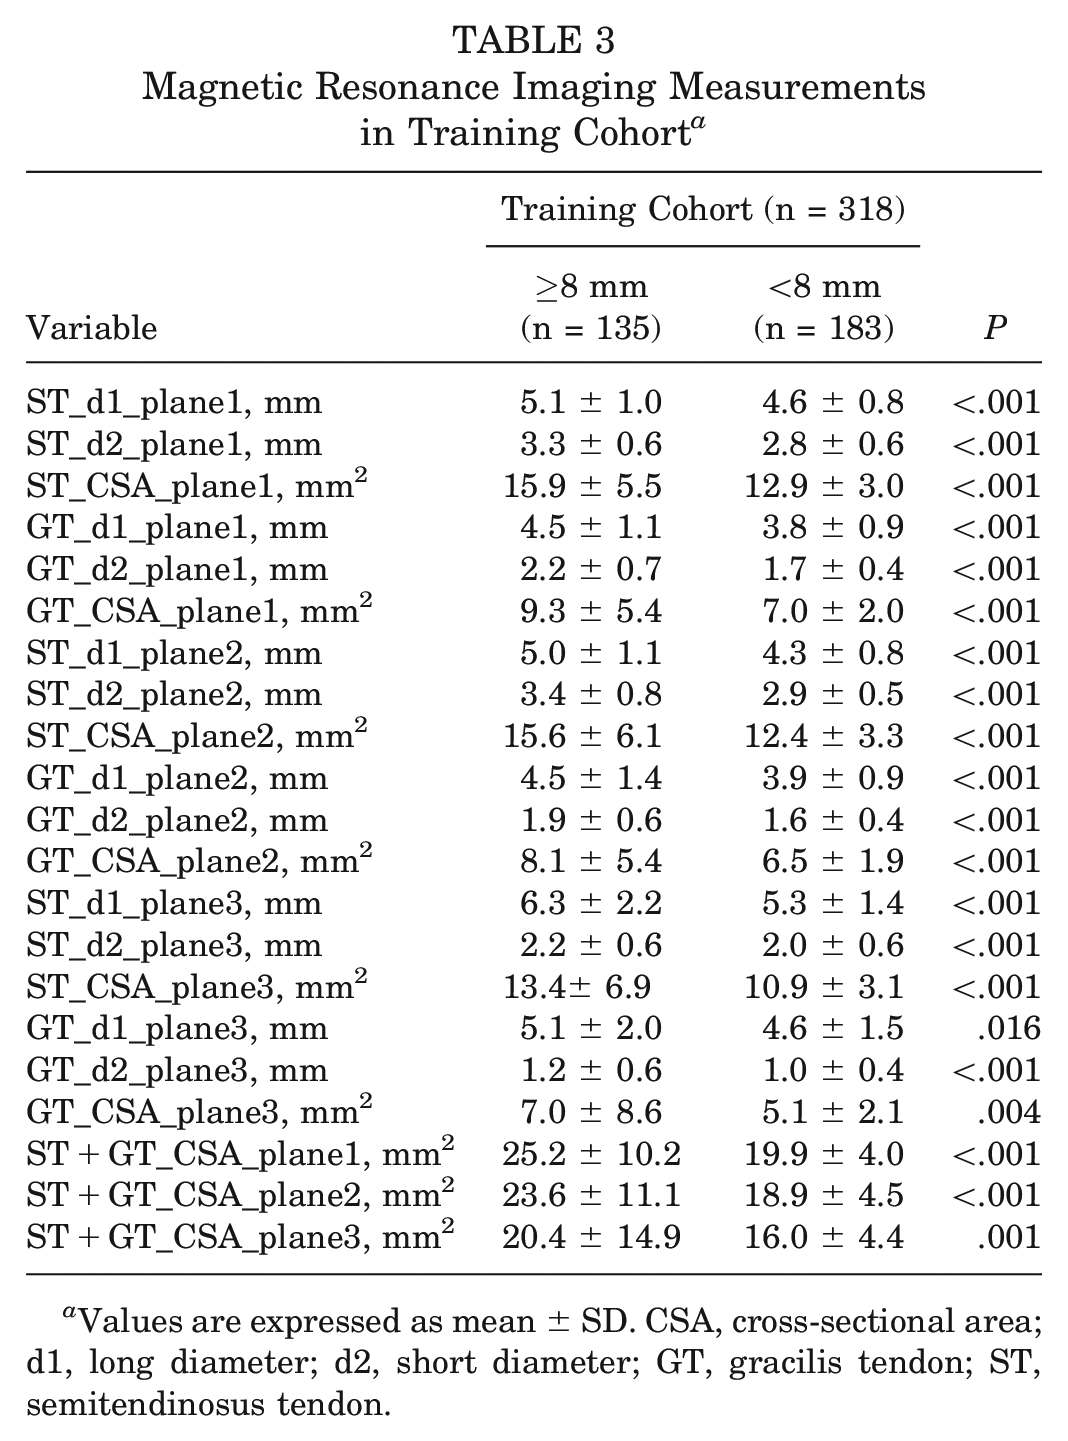
Values are expressed as mean ± SD. CSA, cross-sectional area; d1, long diameter; d2, short diameter; GT, gracilis tendon; ST, semitendinosus tendon.
Magnetic Resonance Imaging Measurements in Validation Cohort and External Validation Cohort a
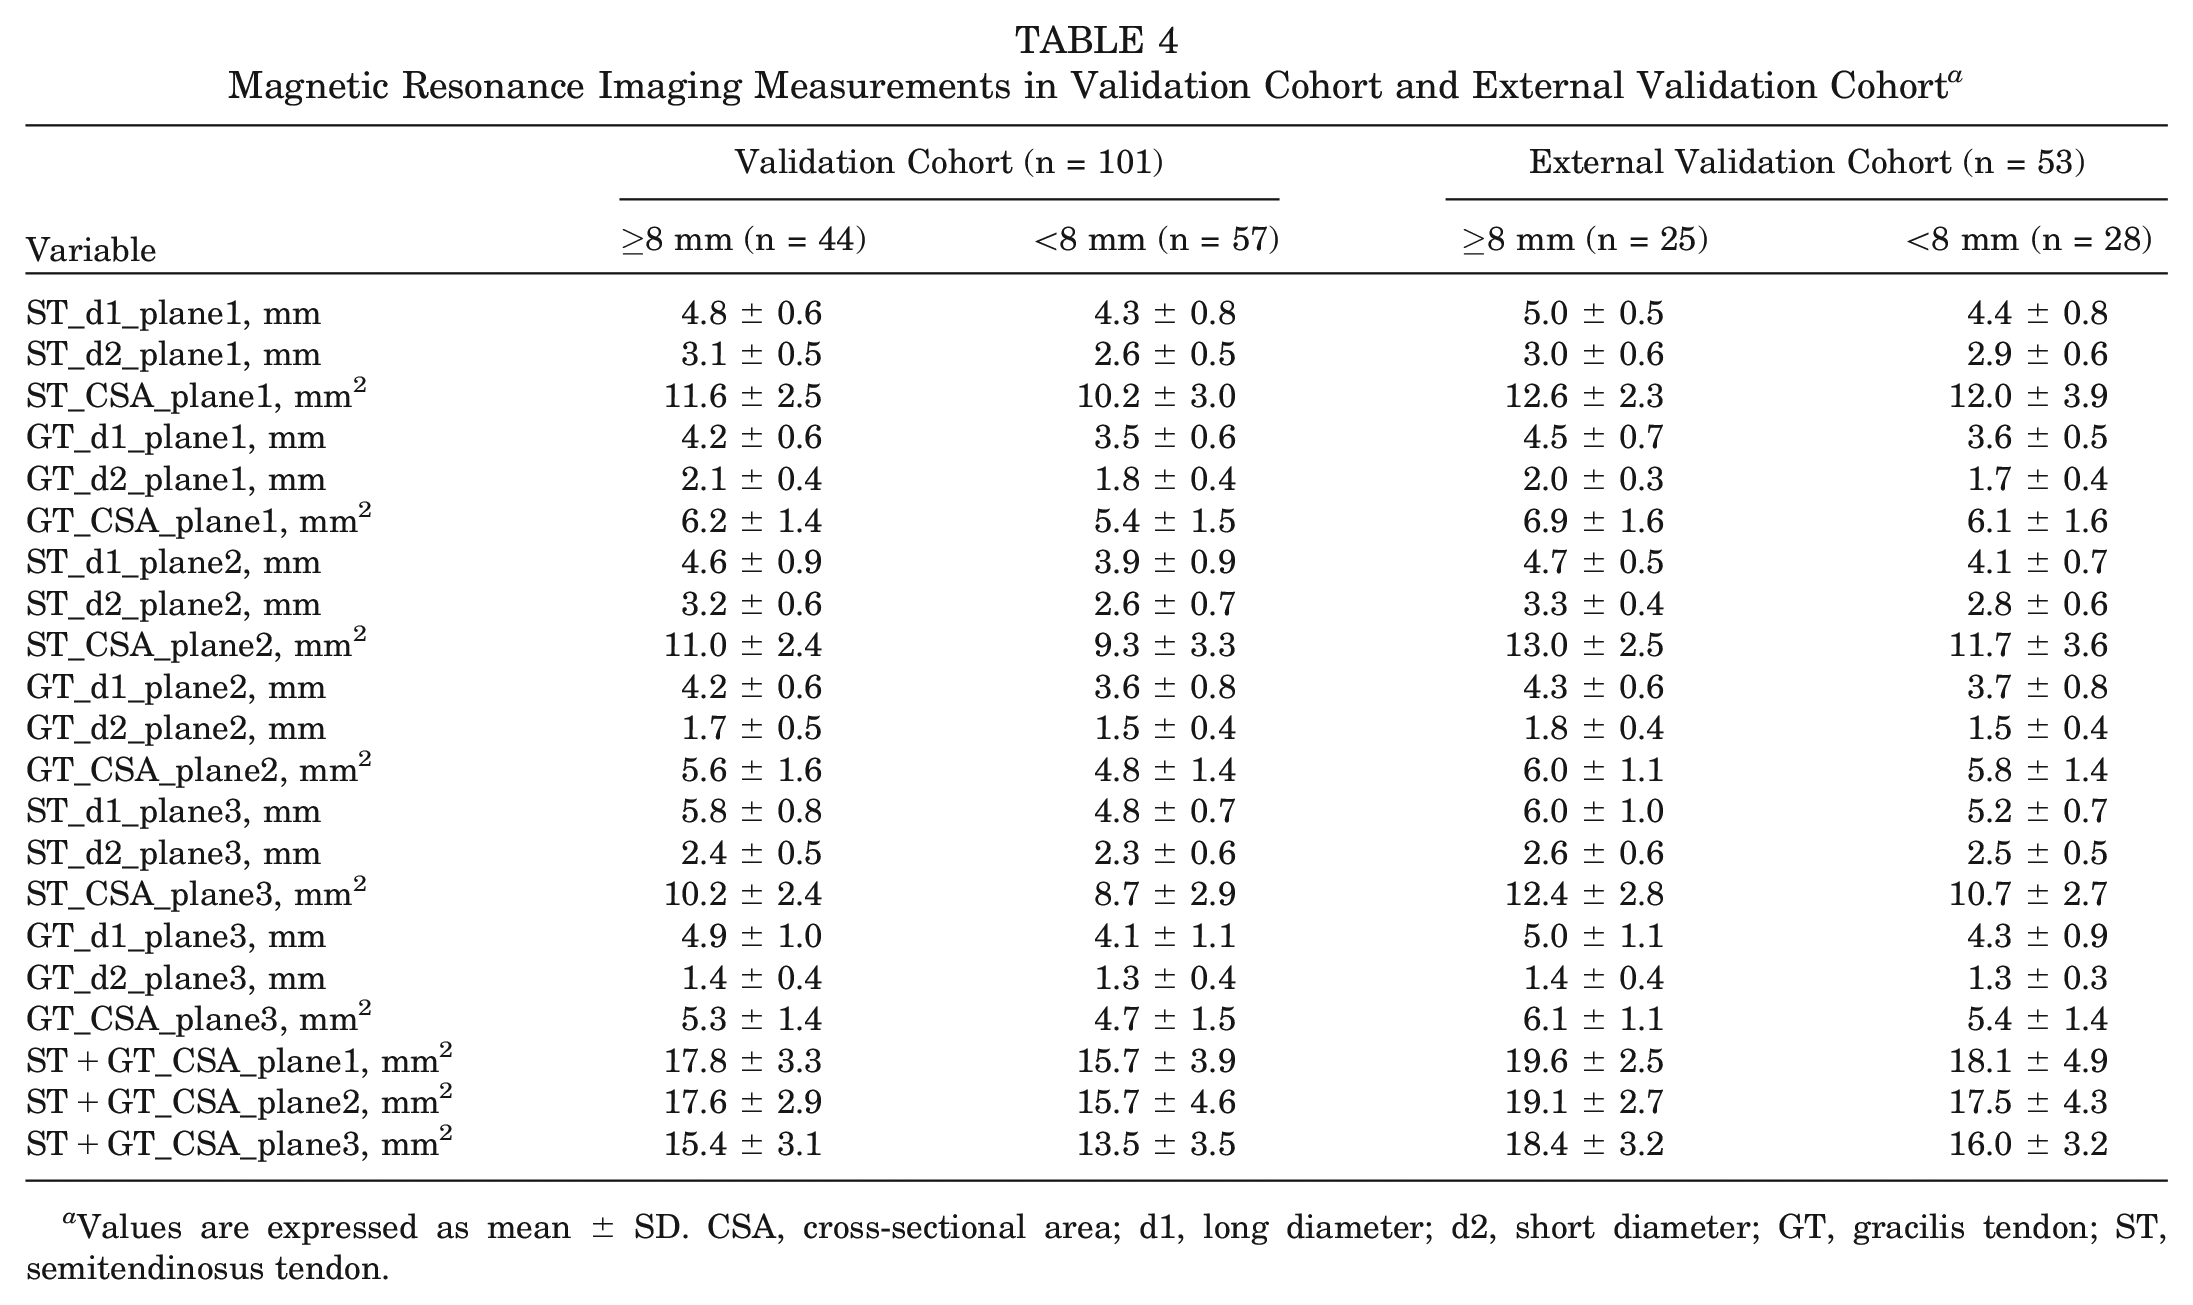
Values are expressed as mean ± SD. CSA, cross-sectional area; d1, long diameter; d2, short diameter; GT, gracilis tendon; ST, semitendinosus tendon.
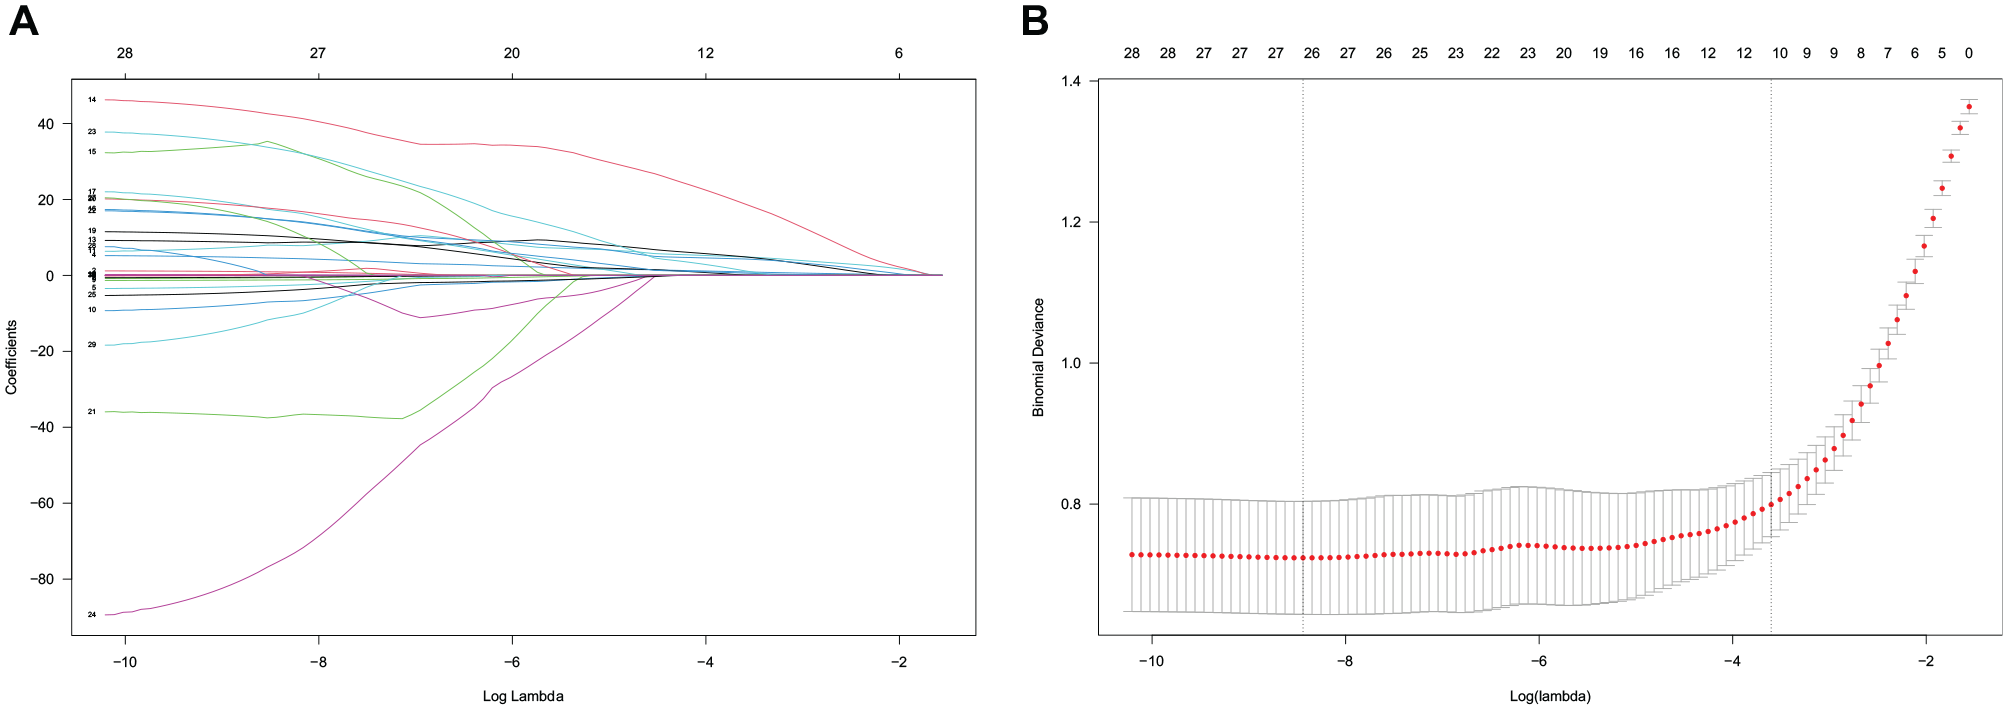
Feature selection using the least absolute shrinkage and selection operator (LASSO) and cross-validation. (A) The extracted features were reduced via LASSO and correlation matrix selection. (B) 10-fold cross-validation was used to obtain the best lambda value. The minimum log (lambda) value was approximately −8.4. The vertical line of 1 minimal standard error was drawn at the right side of the minimum log (lambda), where optimal lambda resulted in 12 items with nonzero coefficients.
Development and Evaluation of the Prediction Models
The prediction model could be simplified by dimensional reduction, making it more convenient for clinical application. Considering the relatively large number of variables obtained according to the cross-validation criteria, different models were constructed by tuning the lambda values (shrinking regression coefficients) to maximize the clinical utility and minimize the number of features.
With increasing lambda, the number of independent variables tended to gradually decrease. Eventually, 6 models based on increased lambda were established and evaluated by discrimination (C-index) and calibration (calibration curves). Model 1 was established with 12 variables according to the optimal lambda value of cross-validation (lambda = 0.02; C-index = 0.930). As the lambda value increased to 0.03, model 2 was established with 10 variables (lambda = 0.03, C-index = 0.931). As the lambda value increased to 0.05, model 3 was established with 9 variables (lambda = 0.05; C-index = 0.931). As the lambda value increased to 0.06, model 4 was established with 8 variables (lambda = 0.06; C-index = 0.932). As the lambda value increased to 0.10, model 5 was established with 7 variables (lambda = 0.10; C-index = 0.929). As the lambda value increased to 0.14, model 6 was established with 6 variables (lambda = 0.14; C-index = 0.907). As the lambda value increased to 0.14, the number of variables included in the model was minimized to 6, but the discrimination of the model was also diminished. With the increasing penalty coefficient, variables that contributed more to the model were retained. Weight, height, sex, thigh length, ST-d1 (plane 1), ST-d2 (plane 1), GT-d1 (plane1), and GT-d2 (plane 1) were recognized as reliable and accurate predictors. The coefficient variations of each variable in different models are shown in Figure 4.
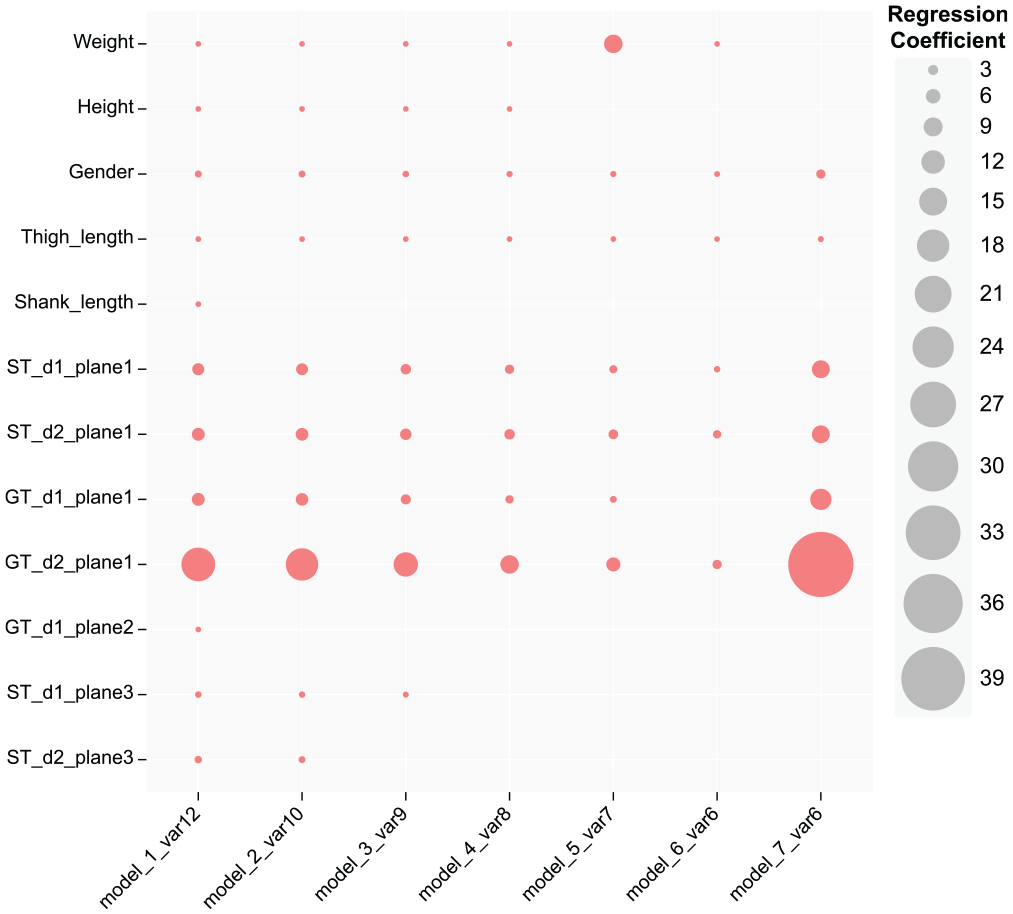
Coefficient variations of each variable in different models. Var12 means that the model incorporated 12 variables. The red circle represents the variables contained in the corresponding model, and the size of the circle represents the coefficient of each variable in the model. d1, long diameter; d2, short diameter; GT, gracilis tendon; ST, semitendinosus tendon; Var, variable.
Subsequently, 12 variables identified by the optimal lambda (lambda = 0.02) were analyzed in the multivariable logistic regression. The result indicated that sex, thigh length, ST-d1 (plane 1), ST-d2 (plane 1), GT-d1 (plane1), and GT-d2 (plane 1) were independent factors highly associated with HT diameter (model 7) (Figure 4). Comparably consistent results were obtained based on the mutual verification of these 2 statistical methods. Both statistical methods (LASSO and multivariable logistic regression) demonstrated that 6 variables were probably the fewest predictors required to maximize the clinical utility of the prediction model. Receiver operating characteristic (ROC) curves were plotted to evaluate the diagnostic performance of these 7 models (see Figure 6A). Among them, model 4 (named the hamstring tendon diameter [HTD] model) presented satisfactory sensitivity (86.7%), specificity (90.2%), discrimination (C-index = 0.932), and calibration (mean absolute error, 0.039). In terms of clinical utility and convenience, model 4 achieved excellent predictive performance with fewer indicators, making it more accessible for clinical application (Figure 5A). The nomograms for other models are shown in the Appendix (available in the online version of this article).
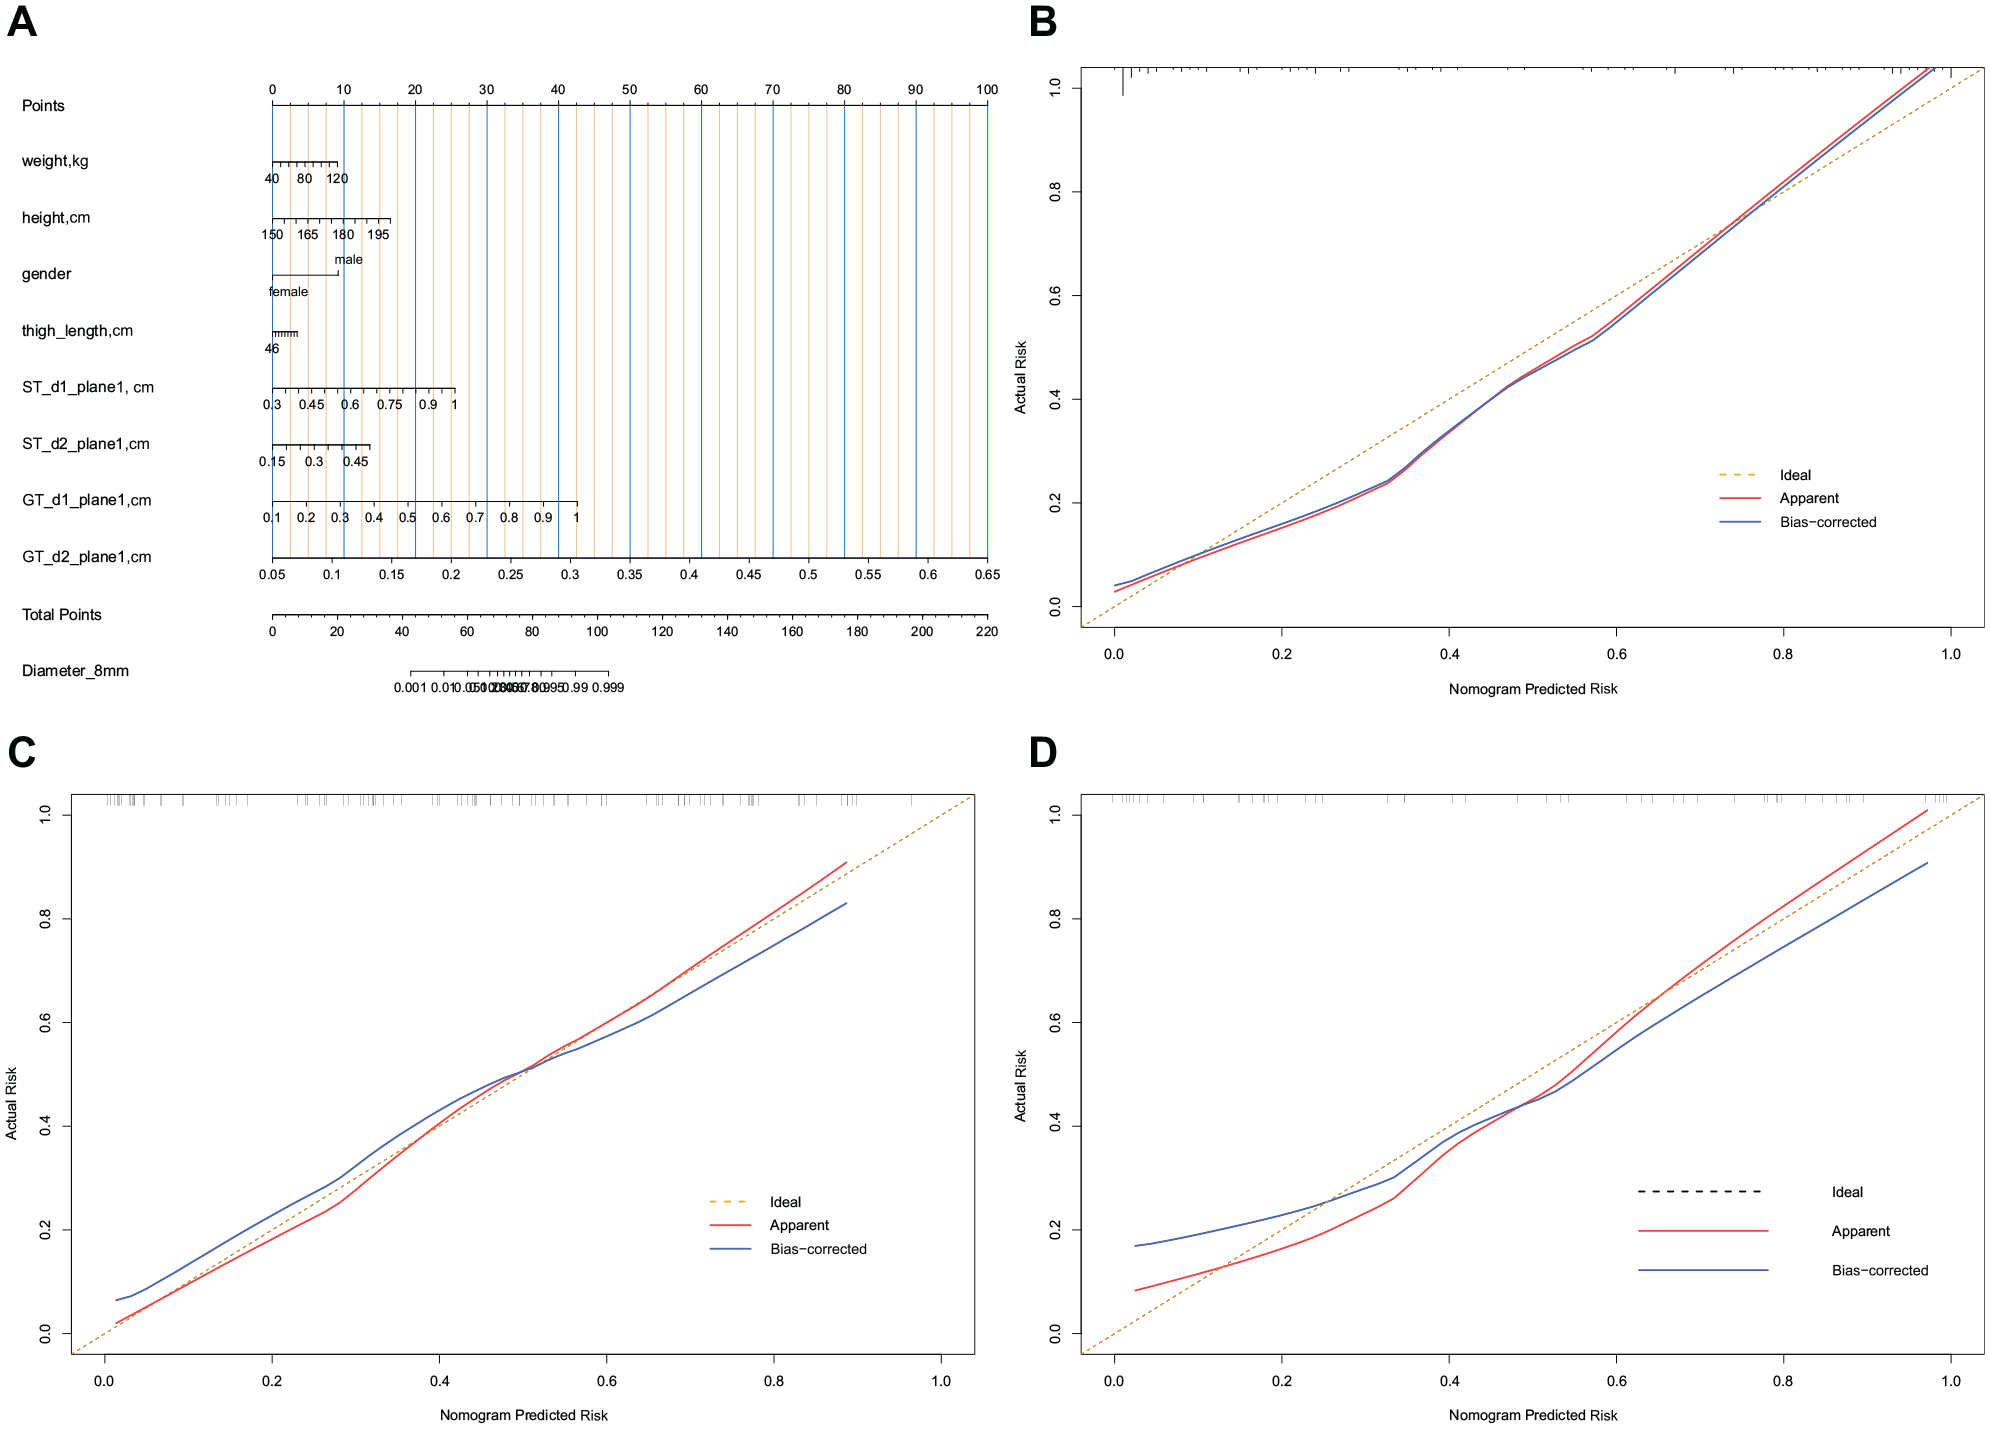
Nomogram and calibration of model 4 (the HTD model). (A) Nomogram. To use the nomogram, find the position of each variable on the corresponding axis, draw a line to the points axis for the number of points, add the points from all of the variables, and draw a line from the total points axis to determine the possibility of HT diameter >8 mm at the lower line of the nomogram. (B) Calibration plot of the training cohort. Validity of the predictive performance of the nomogram in estimating the possibility of HT diameter >8 mm with the 1000-sample bootstrapped calibration plot. The calibration plot showed good agreement between predicted and observed outcomes in the training dataset. (C) Calibration plot of the validation cohort. The calibration plot showed good agreement between predicted and observed outcomes in the validation dataset. (D) Calibration plot of the external validation cohort. The calibration plot showed good agreement between predicted and observed outcomes in the external validation dataset. d1, long diameter; d2, short diameter; GT, gracilis tendon; HTD, hamstring tendon diameter; ST, semitendinosus tendon.
The prediction model was presented as a nomogram, a visualization tool that could provide risk prediction value. Internal validation was performed for each model based on 1000 bootstrap samples. The models demonstrated a good discriminative ability of the training cohort and validation cohort (Table 5). External validation of model 4 (the HTD model) based on the other institutional cohort also showed a good C-index (0.893; 95% CI, 0.805-0.981). The calibration plots of model 4 showed good agreement on the risk estimation by the models of these 3 cohorts (Figure 5, B-D). The calibrations for other models are shown in the Appendix (available online).
Discrimination of Training and Validation Cohorts a
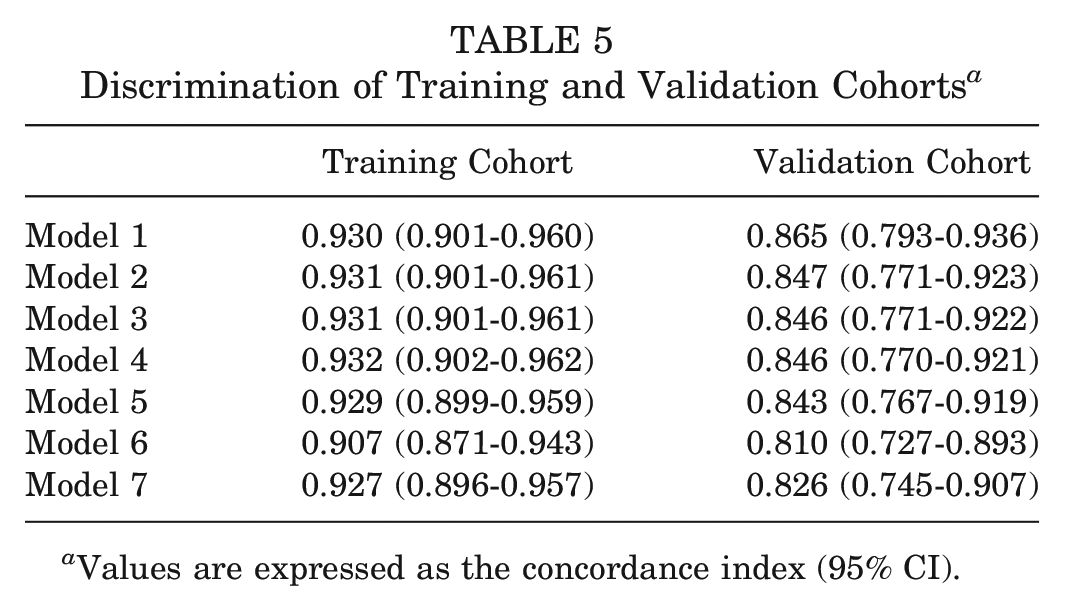
Values are expressed as the concordance index (95% CI).
Previous studies have routinely used CSA as an imaging predictor for evaluating HT diameter but have ignored the predictive value of other imaging indicators.11,12,23 The results of LASSO regression suggested that the long and short diameters of ST-GT in plane 1 were strongly correlated with HT graft diameters as well as superior prediction capability compared with CSA. Patients with greater weight, greater height, male sex, longer thigh length, and larger short and long diameters of ST-GT in plane 1 had higher nomogram points, which indicated a higher probability of diameters ≥8 mm. The sensitivity, specificity, positive predictive value, negative predictive value, positive likelihood ratio, and negative likelihood ratio of these 7 models are presented in Table 6. DCA was performed to assess the clinical utility of these 7 models (Figure 6C). Because model 4 (the HTD model) was the recommended model, we replaced the 4 tendon diameter variables (ST-d1, d2, and GT-d1, d2) of model 4 with total CSA in different planes (planes 1, 2, and 3) and compared their diagnostic performance and clinical utility with model 4, respectively (Figure 6, B and D). The result suggested that when the threshold probability was between 0% and 100%, model 4 could yield a good net benefit with higher clinical application value and better diagnostic performance compared with total CSA in different planes (Figure 6, B and D).
Diagnostic Performance of the Models a
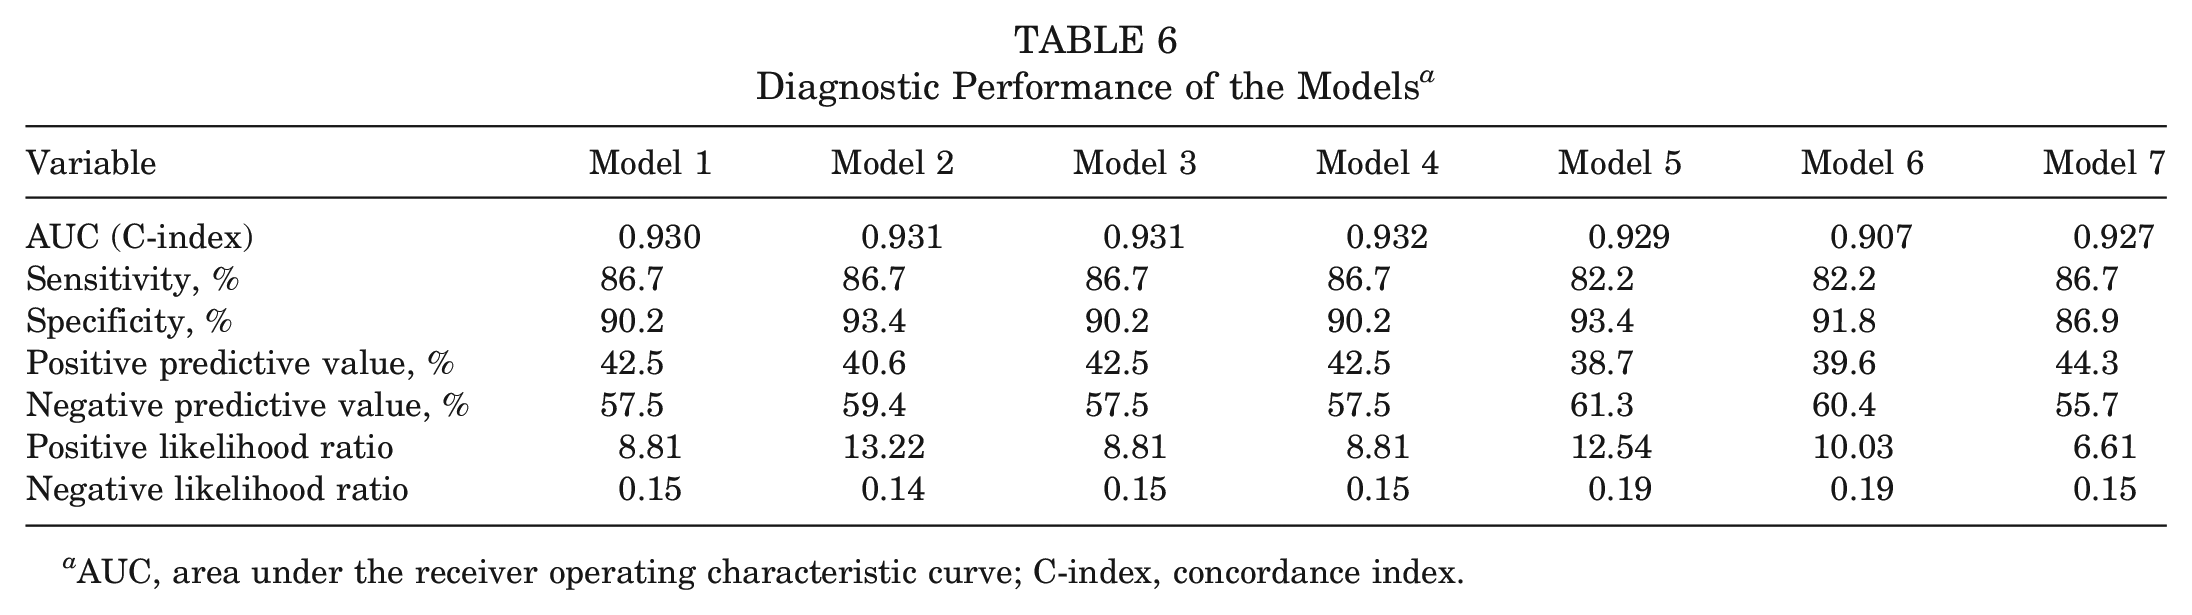
AUC, area under the receiver operating characteristic curve; C-index, concordance index.
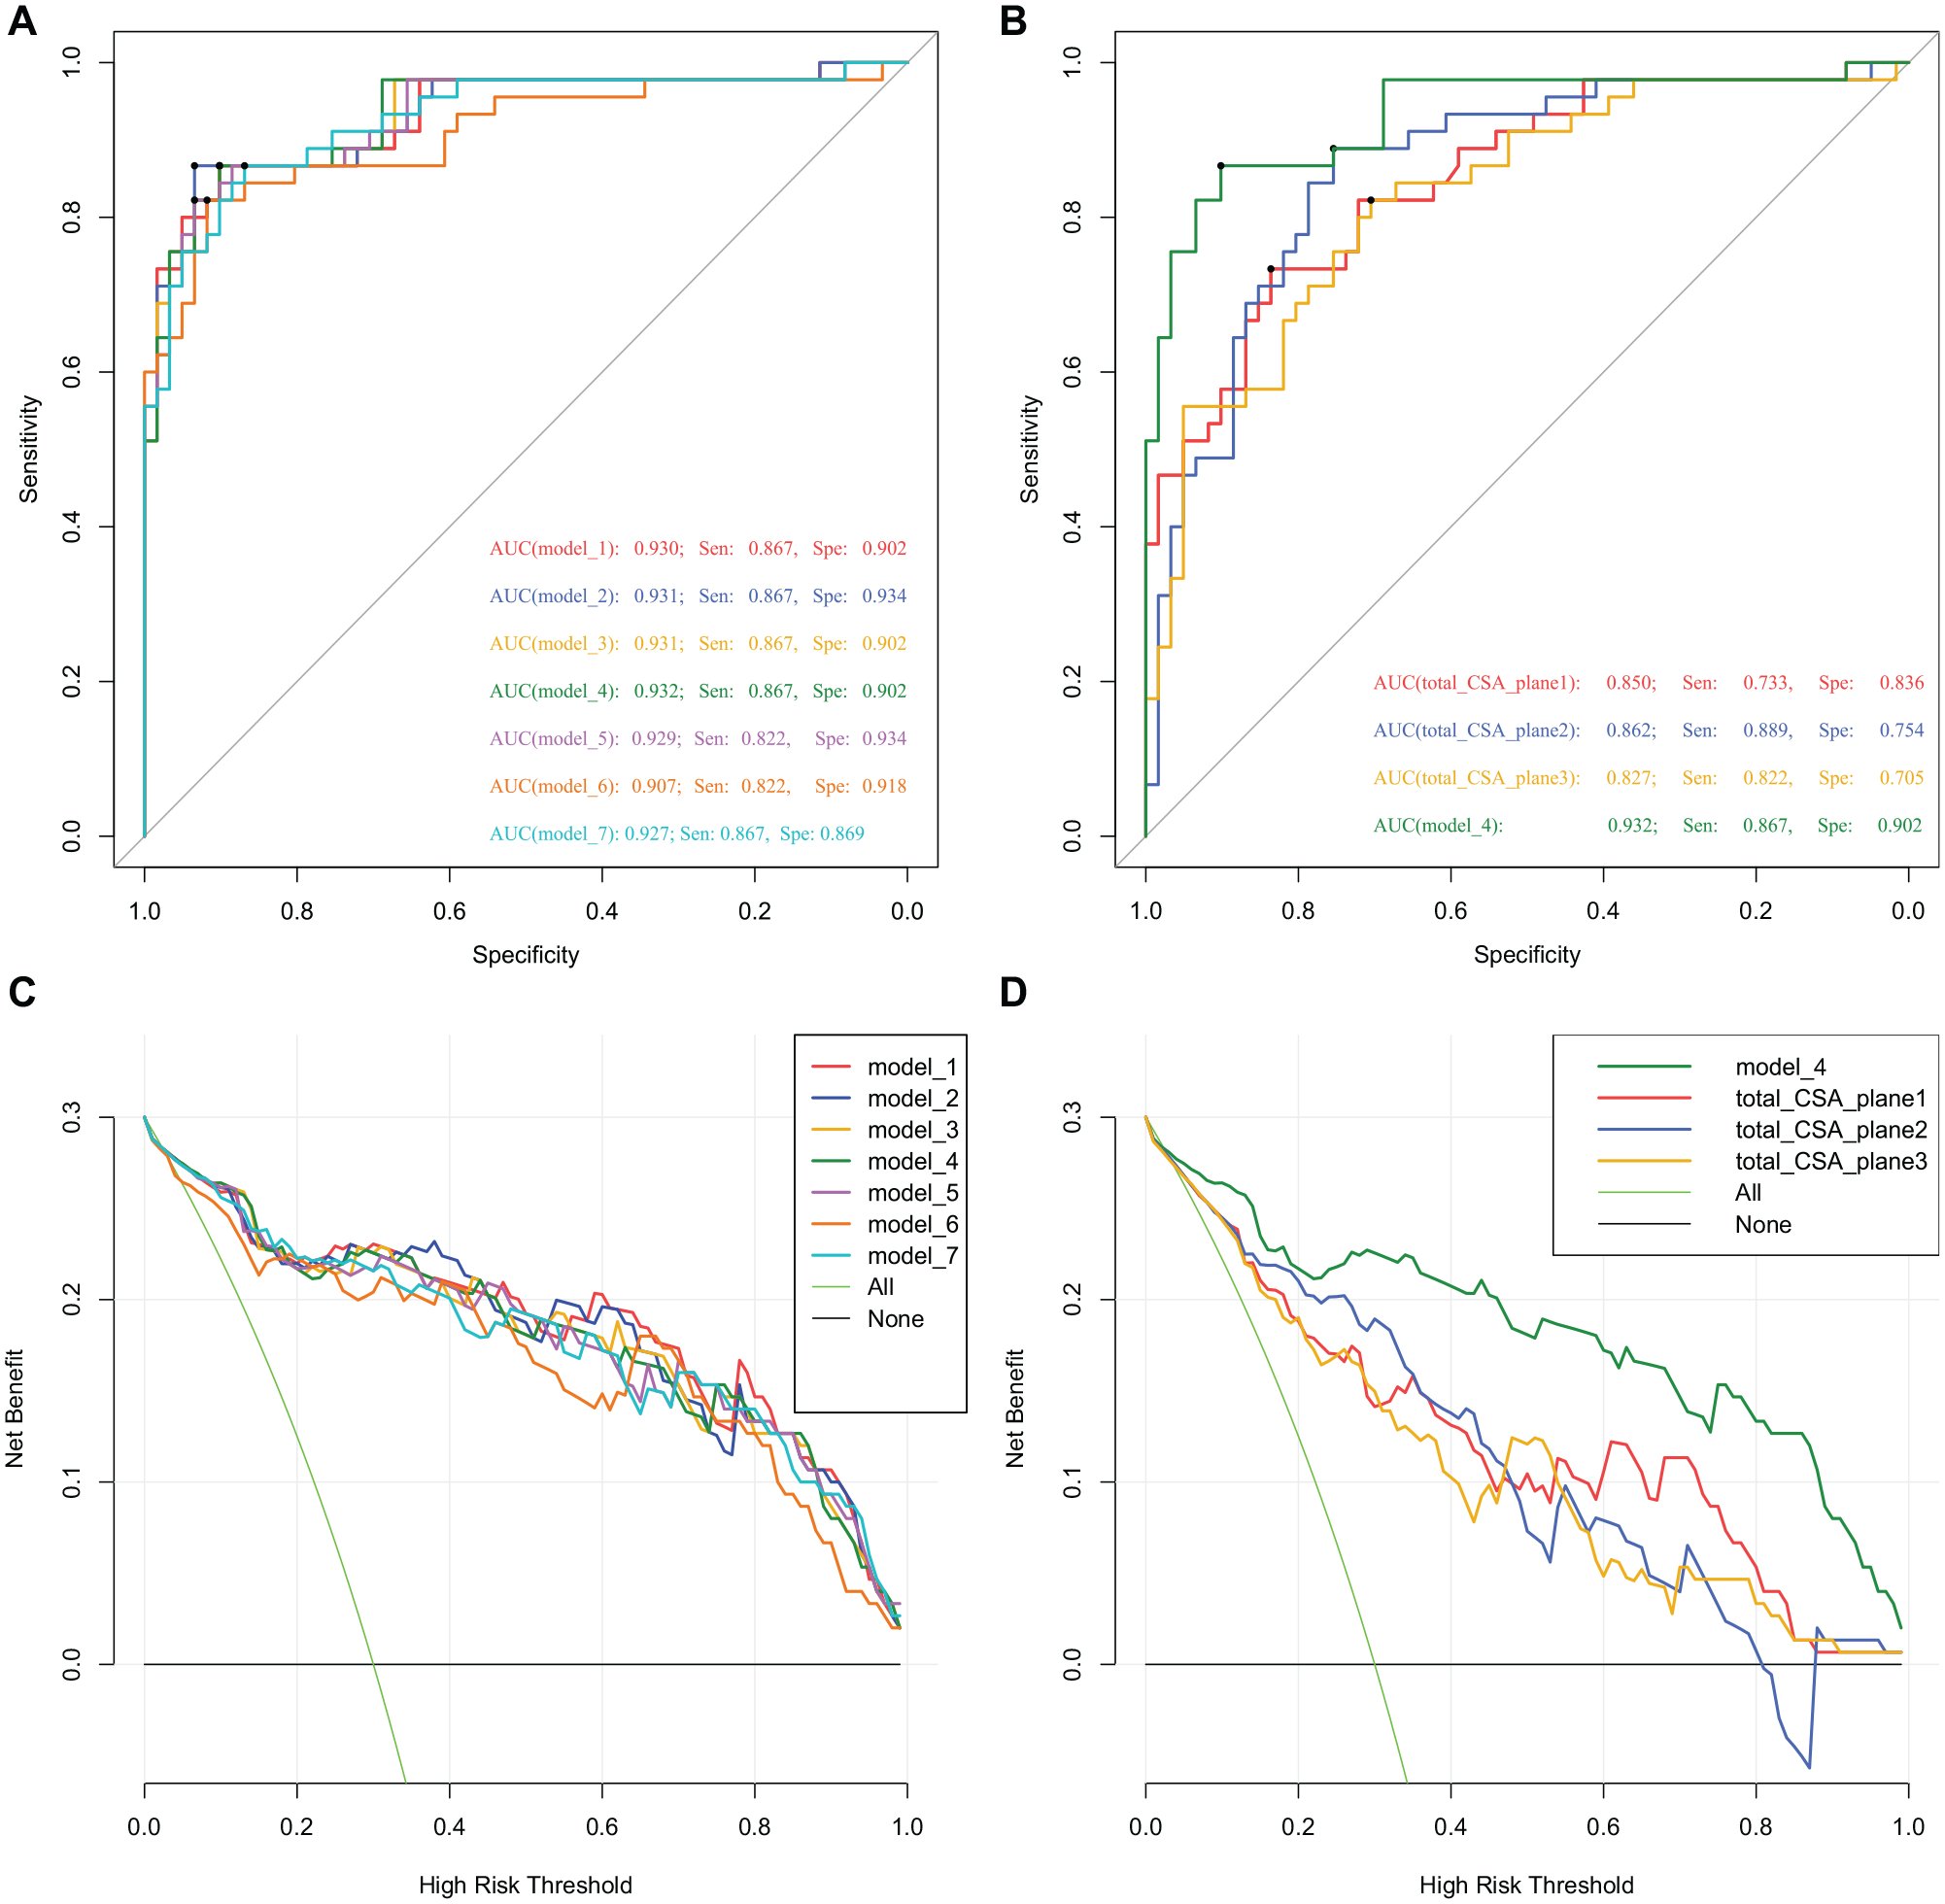
Receiver operating characteristic (ROC) curves and decision curve analysis (DCA) of 7 models. (A) ROC curve of the 7 models. (B) ROC curve of model 4 and total cross-sectional area (CSA). (C) DCA of the 7 models. (D) DCA of model 4 and total CSA. DCA showed that models 1 to 7 achieved good clinical application value and model 4 achieved a higher clinical application value and better clinical practicability than total CSA. AUC, area under the ROC curve; Sen, sensitivity; Spe, specificity.
Considering the predictive performance and convenient clinical application, model 4 (the HTD model) is recommended. A web-based dynamic probability calculator (https://cmuxwn.shinyapps.io/DynNomapp/) of the HTD model is presented in Figure 7. We also provided a web-based dynamic probability calculator (https://sysxwn.shinyapps.io/HTdiameter/) of the other 6 models, which could facilitate real-time individualized prediction. To obtain the best diagnostic performance, the cutoff values for the predicted probabilities in models 1 to 7 were 65%, 60%, 63%, 65%, 65%, 63%, and 60%, respectively. When the probability calculated by the HTD model was >65%, the sensitivity and specificity of predicting 4-strand HT graft diameter ≥8 mm were 86.7% and 90.2%, respectively. On the basis of these cutoff values, patients with a HT graft diameter ≥8 could be identified to the greatest extent possible.
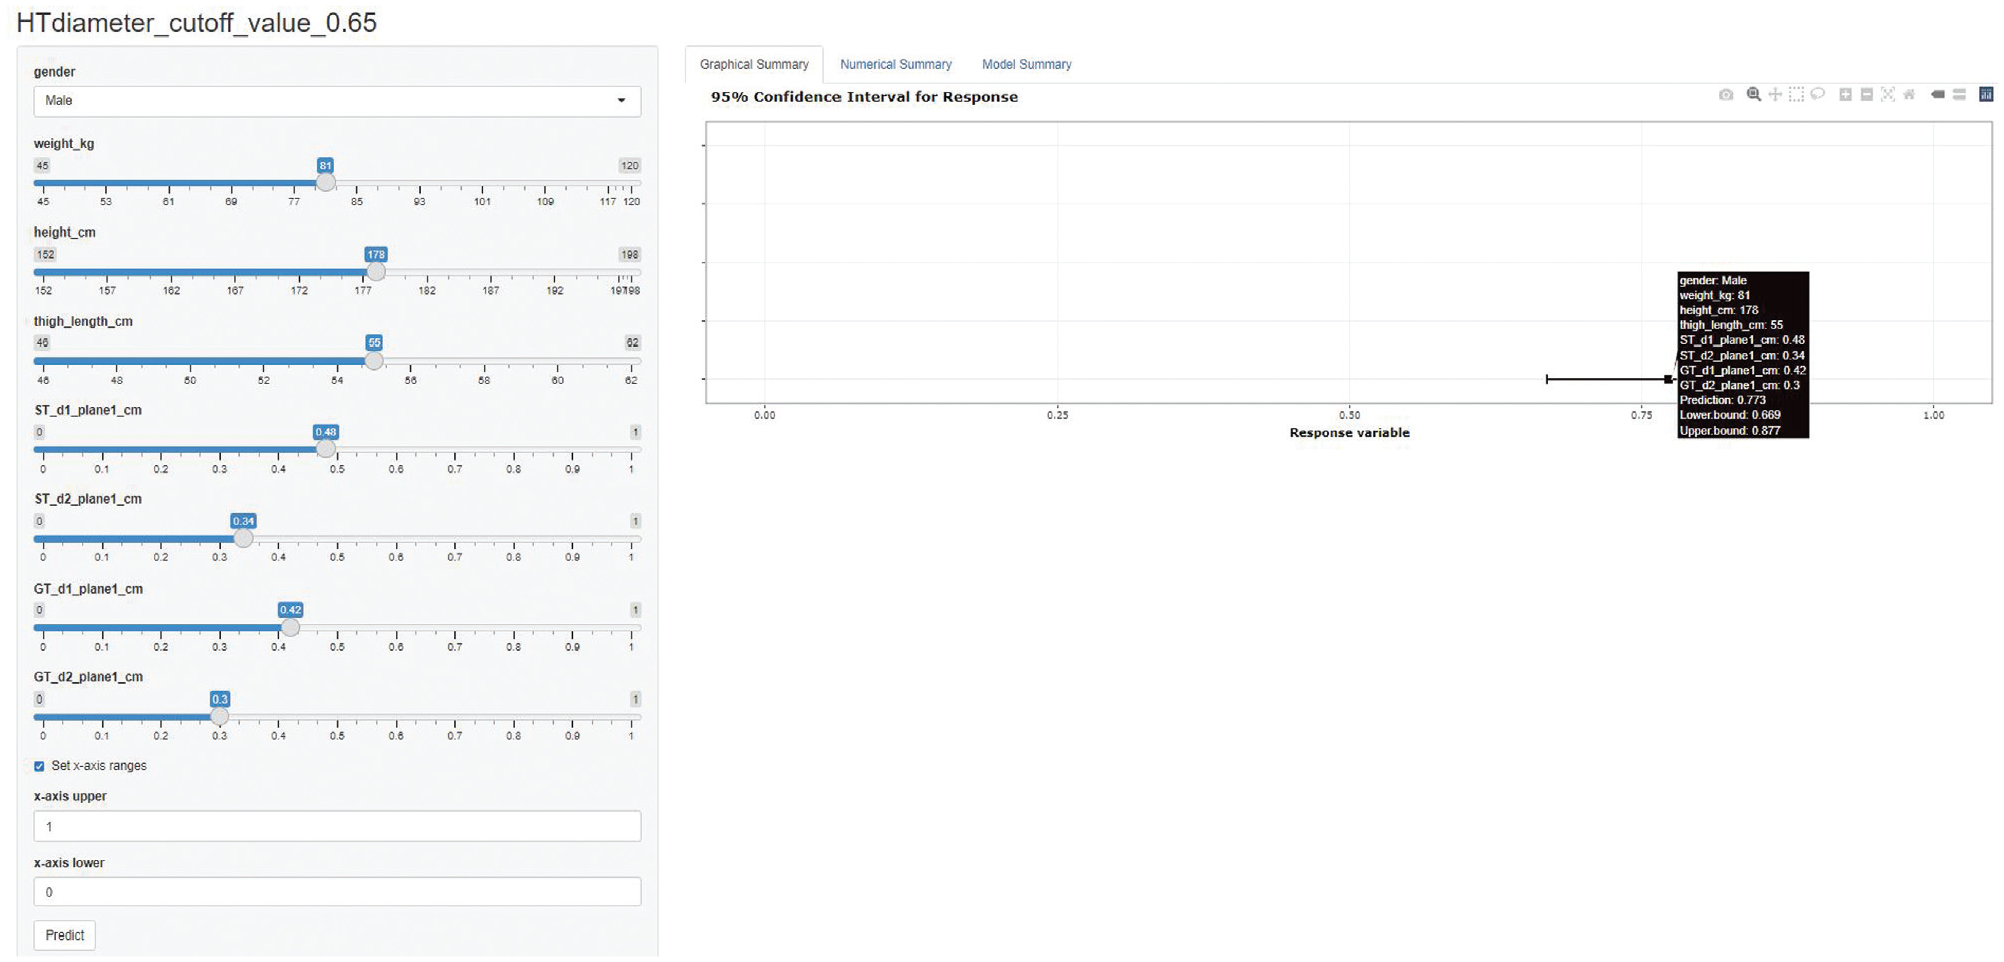
Screenshot of the web-based dynamic nomogram (the HTD model) used to predict hamstring tendon diameter (https://cmuxwn.shinyapps.io/DynNomapp/). d1, long diameter; d2, short diameter; GT, gracilis tendon; HT, hamstring tendon; ST, semitendinosus tendon.
Discussion
Inadequate HT diameter is an important risk factor for postoperative failure and the need for ACLR revision surgery.27,35 The ability to predict and avoid undersized HT grafts enables the surgeon to consider using alternative grafts and assists in preoperative planning. Considering the high variability of the size in autologous HT, a reliable prediction tool (HTD model) for intraoperative HT autograft diameter has been provided in this study. To the best of our knowledge, this is also the first web-based prediction tool (https://cmuxwn.shinyapps.io/DynNomapp/) of HT graft diameter based on a large sample. Compared with previous studies, this study included more patient characteristics and imaging measurements. A comprehensive evaluation of HT graft size and accurate prediction can be achieved by combining patient characteristics with MRI measurements. Our findings suggested that sex, weight, height, thigh length, and ST-GT diameter (measured in plane 1 of an MRI scan) were convenient and reliable indicators that could provide satisfactory prediction performance in determining the HT graft diameter. This online tool yields a total score based on specific values of each variable and provides predicted probabilities. The features avoid the variation associated with relying on the CSA threshold to estimate HT diameter.
Anthropometric parameters were the earliest indexes used to assess correlations with HT graft diameter, but the results varied widely among studies.2,4,21,25 Tuman et al 30 found that height, weight, age, and sex were related to HT graft diameter, and height was the best predictor of HT diameter. Others suggested that smaller graft diameter was related to female sex or age.13,21 In our clinical practice, a strong correlation has been found between sex, height, and the intraoperative diameter of the HT graft. To fully evaluate the role of anthropometrics and patient characteristics in predicting HT graft diameter, we included more relevant indicators (Tables 1-4). The advantage of LASSO regression was that the number of independent variables tended to decrease gradually as the penalty coefficient (lambda) increased. This assisted us in understanding the variation in the contribution of each variable in the prediction process and facilitated the selection of appropriate indicators. The statistical analysis result showed that height, weight, sex, and thigh length were independent and reliable predictors, which validated our past clinical experience. Thigh length was identified as a promising predictor in this study, which has been rarely emphasized in previous studies.
Although some anthropometric parameters could be used as a guide for preoperative assessment of HT graft diameter, reliance on these graft parameters alone is not recommended owing to suboptimal diagnostic performance.7,23 Consequently, increasing attention has been paid to using MRI to predict the diameter of autologous HT graft, of which CSA is the most commonly used measurement. To obtain the HT graft diameter >8 mm, Grawe et al 8 suggested that the total CSA of ST-GT should be >22 mm2. Hanna et al 10 reported that the minimum CSA of ST-GT on MRI to achieve a graft size of 8 mm was 17.2 mm2. Previous studies8,10-12,17 reported a large variation in threshold value for CSA (16.9-28.1 mm2), this wide range of values was not conducive for clinicians to select. Our study found that the magnification of an MRI scan significantly affected the measurement of CSA, suggesting that CSA was not a stable indicator in predicting HT graft diameter. Better stability could be obtained by measuring ST-GT diameters on MRI scans at either ×2 or ×4 magnification. The intraclass correlation coefficients were statistically significant and ranged between 0.765 and 0.831 for tendon diameter in the 3 planes. Compared with the total CSA, superior prediction performance was observed when measuring the long and short diameters of ST-GT in plane 1.
The choice of measurement plane also affected the final prediction results. In our clinical practice, various results have been obtained using different measurement planes recommended by previous studies for CSA.11,12,23 It was difficult to reach a consensus on the optimal plane of CSA measurement. Because the morphology of the tendon varies considerably in different planes, obtaining a nearly elliptical cross-section is essential for accurate measurements. After hundreds of observations, we found that certain previously recommended measurement planes were not applicable to certain patients.11,23 Patients with shorter tendinous tissue of ST-GT did not present a complete and easily measured CSA at a high level of measurement plane. Patients whose tendons branched at or below the tibiofemoral joint line were not suitable for a lower level of measurement plane. To accommodate dynamic changes of tendon morphology in different planes, 3 measurement planes were identified in which the ST and GT could achieve a complete and approximately elliptical cross-section. This was particularly important for accurate measurements and reliable predictions. Based on the unique variable screening advantage of LASSO regression, plane 1 was considered as a measurement plane that could achieve stable and accurate prediction. This result was supported by logistic regression.
Eventually, 7 models were established based on the LASSO and logistic regression, and model 4 (the HTD model) was recommended considering its predictive performance and convenient clinical application. We found that the combination of multiplane and multi-indicator strategy could improve prediction accuracy. Our study attempted to find reliable measurement planes and indicators. This was the result of a comprehensive analysis based on a larger sample and the inclusion of more variables. After conducting a dynamic analysis of the variation in contribution of different indicators to the model, we ultimately identified reliable plane and stable indicators that allowed for accurate prediction to be achieved. Previous studies used coronal imaging as a reference to determine the level of the axial measurement plane.10,12,32 The HTD model allows clinicians to determine the measurement plane from only the axial image. The measurement of ST-GT diameter based on a recommended plane (plane 1) allows clinicians to easily achieve accurate and reliable preoperative prediction without a commercially available region of interest tool.
The web-based prediction tool described here provides individualized risk estimation to help doctors predict HT autograft diameter. Our study has some limitations. First, developing a prediction model based on multiple statistical analysis methods could increase the number of models. We should not simply pursue the models with better prediction performance and neglect the importance of the predictors. A comprehensive assessment of the performance of predictors in different models could help us to better identify accurate and reliable predictors. Second, considering the limited sample size in the current research, it was challenging to support some excellent machine learning and deep learning algorithms to fully leverage their greater predictive value and performance. In future work, we will continue to collect samples and incorporate more advanced algorithms to further enhance the performance of this prediction model. Third, we recommend using 3.0-T MRI for measurements; for hospitals that have only low-field MRI, the measurement results may affect the performance of this prediction tool.
Conclusion
The study provided a novel prediction tool for intraoperative HT autograft diameter. Sex, weight, height, thigh length, and the diameter of ST-GT (plane 1) were reliable predictors that could assist clinicians in accurately identifying patients with potentially undersized HT grafts and making appropriate clinical decisions.
Supplemental Material
sj-pdf-1-ajs-10.1177_03635465231205304 – Supplemental material for A Web-Based Prediction Tool to Improve Identification of Patients With Undersized Hamstring Tendon Autograft in Anterior Cruciate Ligament Reconstruction
Supplemental material, sj-pdf-1-ajs-10.1177_03635465231205304 for A Web-Based Prediction Tool to Improve Identification of Patients With Undersized Hamstring Tendon Autograft in Anterior Cruciate Ligament Reconstruction by Wennan Xu, Chengxiao Liu, Huaming Peng, Jingsong Wang, Zhengzheng Zhang, Bin Song, Weiping Li and Chuan Jiang in The American Journal of Sports Medicine
Footnotes
Submitted February 26, 2023; accepted August 23, 2023.
One or more of the authors has declared the following potential conflict of interest or source of funding: This study was supported by Guangdong Basic and Applied Basic Research Foundation (2021A1515012337, 2019A1515011684); National Natural Science Foundation of China (82172416, 81802172); Guangdong Science and Technology Collaborative Innovation Center for Sports (2019B110210004). AOSSM checks author disclosures against the Open Payments Database (OPD). AOSSM has not conducted an independent investigation on the OPD and disclaims any liability or responsibility relating thereto.
References
Supplementary Material
Please find the following supplemental material available below.
For Open Access articles published under a Creative Commons License, all supplemental material carries the same license as the article it is associated with.
For non-Open Access articles published, all supplemental material carries a non-exclusive license, and permission requests for re-use of supplemental material or any part of supplemental material shall be sent directly to the copyright owner as specified in the copyright notice associated with the article.