
Abstract
Background:
Bioengineered cartilage is a developing therapeutic to repair cartilage defects. The matrix must be rich in collagen type II and aggrecan and mechanically competent, withstanding compressive and shearing loads. Biomechanical properties in native articular cartilage depend on the zonal architecture consisting of 3 zones: superficial, middle, and deep. The superficial zone chondrocytes produce lubricating proteoglycan-4, whereas the deep zone chondrocytes produce collagen type X, which allows for integration into the subchondral bone. Zonal and chondrogenic expression is lost after cell number expansion. Current cell-based therapies have limited capacity to regenerate the zonal structure of native cartilage.
Hypothesis:
Both passaged superficial and deep zone chondrocytes at high density can form bioengineered cartilage that is rich in collagen type II and aggrecan; however, only passaged superficial zone–derived chondrocytes will express superficial zone–specific proteoglycan-4, and only passaged deep zone–derived chondrocytes will express deep zone–specific collagen type X.
Study Design:
Controlled laboratory study.
Methods:
Superficial and deep zone chondrocytes were isolated from bovine joints, and zonal subpopulations were separately expanded in 2-dimensional culture. At passage 2, superficial and deep zone chondrocytes were seeded, separately, in scaffold-free 3-dimensional culture within agarose wells and cultured in redifferentiation media.
Results:
Monolayer expansion resulted in loss of expression for proteoglycan-4 and collagen type X in passaged superficial and deep zone chondrocytes, respectively. By passage 2, superficial and deep zone chondrocytes had similar expression for dedifferentiated molecules collagen type I and tenascin C. Redifferentiation of both superficial and deep zone chondrocytes led to the expression of collagen type II and aggrecan in both passaged chondrocyte populations. However, only redifferentiated deep zone chondrocytes expressed collagen type X, and only redifferentiated superficial zone chondrocytes expressed and secreted proteoglycan-4. Additionally, redifferentiated deep zone chondrocytes produced a thicker and more robust tissue compared with superficial zone chondrocytes.
Conclusion:
The recapitulation of the primary phenotype from passaged zonal chondrocytes introduces a novel method of functional bioengineering of cartilage that resembles the zone-specific biological properties of native cartilage.
Clinical Relevance:
The recapitulation of the primary phenotype in zonal chondrocytes could be a possible method to tailor bioengineered cartilage to have zone-specific expression.
Cell-based bioengineered cartilage is a developing therapeutic to treat cartilage defects. For tissue engineering approaches to be successful, the bioengineered tissues must be mechanically competent to withstand high compressive loads and disperse those loads to the subchondral bone. Additionally, the tissue matrix must have a low coefficient of friction at its surface.10,46 These properties are attained by zone-specific molecule expression in native articular cartilage by superficial zone (SZ), middle zone (MZ), and deep zone (DZ) chondrocytes. 10 To attain these mechanical properties in bioengineered cartilage, cells must express cartilage matrix and zone-specific molecules. The cells used must produce tissue rich in cartilage matrix molecules collagen type II (COL2) and aggrecan (ACAN). 10 In addition, cells should produce matrix that contains collagen type X (COLX) restricted to the deeper zones. This allows for integration into the subchondral bone by controlling the mineralization and calcification of the matrix to allow integration at the osteochondral interface.2,11,12 Chondrocytes at the surface of the bioengineered tissue must also produce molecules such as lubricin/proteoglycan-4 (PRG4), which lubricates the surface, establishing a low coefficient of friction,33,35,46 and clusterin (CLU), which serves as a cytoprotective molecule protecting cells at the surface from high oxidative stress and mechanical forces.25,44
Current methods of cell-based cartilage repair, such as autologous chondrocyte implantation techniques, use 2-dimensional monolayer expansion of chondrocytes on tissue culture polystyrene to increase cell numbers.21,24,29,37,38 During monolayer expansion, chondrocytes undergo dedifferentiation. In the dedifferentiation process, cells become larger and elongated, reorganize filamentous (F-)actin into stress fibers, decrease the expression of cartilage matrix molecules (COL2 and ACAN), and increase the expression of fibroblast matrix molecules collagen type I (COL1) and tenascin C (TNC).5,15,26,30,32 Additionally, monolayer expansion decreases the expression of zone-specific molecules (PRG4 and COLX).7,29 Zonal chondrocytes expanded in monolayer have the ability to reexpress zone-specific matrix molecules when encapsulated within agarose or alginate.7,40 These findings suggest that passaged zonal chondrocytes have phenotypic memory, or the ability to reexpress their primary phenotype in 3-dimensional (3D) culture under defined culture conditions. Previously, it was shown that a scaffold-free system can generate bioengineered tissue that is rich in COL2 and ACAN via culturing passaged full-thickness chondrocytes in 3D scaffold-free culture and supplementing with a chondrogenic media cocktail. 29 Although cells produced PRG4, the levels were lower than those in native cartilage.6,29
Another challenge of current cell-based bioengineering approaches is that the isolation and expansion of chondrocytes from full-thickness cartilage result in a small proportion of passaged SZ chondrocytes (SZCs) at the end of cell culture expansion. The SZ of cartilage is the first zone lost during cartilage wear and metabolic degeneration.36,48 Therefore, donor-site cartilage may have a limited population of SZCs to begin with. In addition, SZCs have poor attachment to tissue culture flasks and proliferate slower compared with DZ chondrocytes (DZCs) and MZ chondrocytes (MZCs). 43 Thus, it remains to be determined whether mechanically competent bioengineered cartilage can be formed by passaged chondrocytes with a limited representation of SZCs. It is also not fully understood whether the presence of chondrocytes originating from both the SZ and the DZ is necessary to form bioengineered cartilage that can produce a lubricating surface and withstand high compressive loads.
In this study, we tested the hypothesis that both passaged SZCs and DZCs would form bioengineered cartilage that is rich in COL2 and ACAN, whereas only passaged SZCs and DZCs would reexpress the zone-specific molecules PRG4 and COLX, respectively. To test this hypothesis, SZCs and DZCs were separately expanded in monolayer culture. After 2 passaging events, chondrocytes were placed in 3D redifferentiation culture. The ability of passaged SZCs and DZCs to reexpress cartilage and zone-specific molecules in bioengineered cartilage was then examined. Further understanding of the phenotypic memory of zonal chondrocytes could allow for novel methods that generate cartilage tissue resembling native cartilage, thus taking one step further toward functional tissue engineering of cartilage repair constructs. Abbreviations used in this article are defined in Table 1.
Abbreviations Used
Methods
Cell Isolation and Monolayer Expansion
SZ and DZ cartilage was collected from the metacarpophalangeal joints of calves aged 6 to 9 months via manual microdissection as previously described. 8 In brief, SZ tissue was carefully harvested from the first approximately 20% of the tissue to enrich for SZCs. Next, the MZ was harvested by removing the next approximately 50% of the tissue. Finally, DZ tissue was harvested by removing the next 30% of remaining tissue, paying careful attention to avoid subchondral bone areas in order to enrich isolation of DZCs. Chondrocytes were isolated from the tissue via serial enzymatic digestion with 0.5% protease (Sigma Aldrich) and 0.1% collagenase (Roche) for 45 minutes and 14 to 17 hours, respectively. Zonal subpopulations were seeded at 1500 cells/cm2 and serially passaged in expansion media (Hams F-12 media; Corning) supplemented with 5% fetal bovine serum (GenClone; Genesee Scientific) and 1% antibiotic-antimycotic (Corning). Chondrocytes were cultured until approximately 80% to 90% confluent (~12 days), and then they were detached using trypsin-ethylenediamineteraacetic acid (EDTA) (GenClone) and designated P1. Zonal subpopulations were reseeded in monolayer (1.5 × 10³ cells/cm2) and cultured until approximately 80% to 90% confluent (~8 days), and then they were detached using trypsin-EDTA and designated P2.
3D Redifferentiation Culture
P2 chondrocytes were seeded at high density in 3D scaffold-free culture within agarose molds in expansion media, as previously described. 29 In brief, molten agarose was poured into the wells of a 12-well culture plate. Once the agarose was solidified, a well was created using an 8-mm biopsy punch. P2 chondrocytes were seeded within these wells (Appendix Figure A1, available in the online version of this article). After 24 hours, the expansion media were removed and replaced with redifferentiation media defined as Dulbecco’s modified Eagle medium (GenClone) supplemented with ITS+ Premix (6.25 µg/mL insulin, 6.25 µg/mL transferrin, 6.25 µg/mL selenium, 1.25 mg/mL bovine serum albumin, and 5.35 ng/mL linoleic acid) (Corning), 0.1 µM dexamethasone (Sigma Aldrich), 40 µg/mL proline (Sigma Aldrich), 110 µg/mL pyruvate, and 100 µg/mL ascorbic acid (Sigma Aldrich). Media were replenished every 2 days until harvest at days 11 and 21.
Cell Area and Circularity
At each passage, chondrocyte subpopulations were seeded in monolayer (2.5 × 10³ cells/cm2) and cultured in expansion media. After 48 hours, cells were washed once with phosphate buffered saline (PBS) without calcium or magnesium (PBS-/-; GenClone) and fixed in 4% paraformaldehyde (Electron Microscopy Sciences) for 10 minutes at room temperature. Cells were incubated with ethidium homodimer (Thermo Fisher) at 37°C for 30 minutes or rhodamine phalloidin (Biotium) at room temperature for 60 minutes. Images were acquired using a Leica Biosystems fluorescent DM IL microscope or a Zeiss LSM880 laser scanning confocal fluorescence microscope, and FIJI (ImageJ; National Institutes of Health) analysis was used to quantify cell area and circularity as previously described.16,31 At least 3 image fields were analyzed, totaling a minimum of 30 cells per condition, and the experiment was repeated 3 times.
Immunocytochemistry
At each passage, chondrocyte subpopulations were seeded in monolayer (2.5 × 10³ cells/cm2) and cultured on glass slides for 48 hours, washed once with PBS-/-, and fixed in 4% paraformaldehyde (in PBS) for 10 minutes at room temperature. Cells were permeabilized with 10% goat serum in 0.2% Triton/PBS for 30 minutes. F-actin was visualized by incubating samples with phalloidin-598 (1:20) or rhodamine phalloidin (1:50), in a solution of 3% goat serum in 0.2% Triton/PBS for 1 hour at room temperature. Cells were counterstained with 4′,6-diamidino-2-phenylindole (1:1500 in PBS) or Hoechst 33342 (Biotium) (1:500) for 5 minutes, washed with PBS-/-, and mounted using Permafluor Mountant (Thermo Fisher Scientific). Confocal microscopy was performed using a NikonC1si laser scanning confocal microscope (Nikon Instruments) or a Zeiss LSM880 laser scanning confocal fluorescence microscope using a ×20 objective. Z-stack images were acquired using a 0.7-µm step size.
Cell Attachment
At passage 0 (P0) and P2, 5.0 × 10⁴ cells/cm2 were seeded in monolayer in expansion media. After 24 hours, the media were removed, and cultures were washed with PBS-/- to remove nonadherent cells. Samples were harvested in papain digestion solution (40 µg/mL papain in 20 mM ammonium acetate, 1 mM EDTA, and 2 mM dithiothreitol at pH 6.2) and digested for 48 hours at 65°C. DNA content after attachment was compared with the DNA content of initial cell aliquots. DNA content was quantified as described below (see DNA Assay).
Expansion Yield
At each passage, the number of cells was counted via hemocytometer. The expansion yield fold was calculated, where Ny is the cell yield after each passage and Ni is the initial number of cells seeded. 45

RNA Extraction and Reverse Transcription Polymerase Chain Reaction
Total RNA was extracted using TRIzol (Sigma Aldrich) and reverse transcribed using Superscript III Reverse Transcriptase (Life Technologies) according to the manufacturer’s directions and as described previously. 9 Relative real-time reverse transcription polymerase chain reaction (PCR) and fluorescent detection were performed using Express SYBR GreenER (Life Technologies) and the LightCycler 96 Real-Time PCR system (Roche) using gene-specific primers (Appendix Table A1, available online). The Pfaffl method was used to calculate mean relative quantification values (ie, normalized relative quantity) using 18s rRNA as the endogenous housekeeping gene. 34
Histology
Tissues were fixed in 10% buffered formalin (pH 7.4) overnight at 4°C, washed with PBS, and stored in 30% sucrose overnight at 4°C. Tissues were then snap-frozen in optimal cutting temperature (OCT) solution (Tissue-Tek) and cryosectioned. Eight-micron sections were stained with hematoxylin and eosin or toluidine blue and mounted with Micromount (Leica Biosystems).
Immunostaining
Tissues were fixed in 4% paraformaldehyde overnight at 4°C, washed with PBS-/-, and stored in 30% sucrose overnight at 4°C. Tissues were then snap-frozen in OCT solution and cryosectioned. Eight-micron sections were digested with a solution of 0.4% pepsin (Sigma Aldrich) in ×1 Tris-buffered saline (pH 2), blocked with 20% goat serum, and then incubated overnight at 4°C with antibodies listed in Appendix Table A2A (available online). Tissues were subsequently incubated with secondary antibody (Appendix Table A2B, available online) for 1 hour at room temperature and counterstained with a solution of 4′,6-diamidino-2-phenylindole (1 µg/mL) in PBS. Tissues were washed 3 times with PBS-/- between incubations. Tissues were then mounted with PermaFluor aqueous mounting medium (Thermo Fisher Scientific) and glass coverslips. Confocal microscopy was performed using a NikonC1si laser scanning confocal microscope or a Zeiss LSM880 laser scanning confocal fluorescence microscope with a ×20 objective. Z-stack images were acquired using 0.7-µm slices.
Biochemistry
Tissues were digested in papain solution (40 µg/mL papain in 20 mM ammonium acetate, 1 mM EDTA, and 2 mM dithiothreitol at pH 6.2) for 48 hours at 65°C. Glycosaminoglycan (GAG) content and hydroxyproline content were determined from digested samples and expressed relative to DNA content. For GAG content, samples were diluted in 1% bovine serum, and the standard curve was generated using chondroitin sulphated sodium salt. Dimethylmethylene blue dye was added to the samples to form the GAG-dimethylmethylene blue complex, and absorbance was measured at λ = 525 nm. For hydroxyproline content, samples were mixed 1:1 with 6N HCl and incubated at 100°C for 18 hours. After neutralizing with 5.7N NaOH, samples were diluted in dH2O, and the standard curve was generated using L-hydroxyproline. For each sample and standard, 0.05N chloramine T, 3.15N perchloric acid, and Ehrlich Reagent was added. Samples were incubated at 60°C, and the absorbance was measured at λ = 560 nm.
DNA Assay
DNA content in papain digested samples was quantified using the Hoechst 33258 dye-binding assay. The DNA standard curve was generated using calf thymus DNA (Sigma Aldrich) diluted in PBS-/-. Absorbance was measured using fluorescent spectrophotometry (excitation, λ = 355 nm; emission, λ = 460 nm).
Enzyme-Linked Immunosorbent Assay
PRG4 accumulation in tissue culture media samples was determined via indirect enzyme-linked immunosorbent assay (ELISA), as described previously. 39 In brief, culture media samples were absorbed to ELISA plates. After blocking, plates were incubated with the primary antibody mAb 3A4 reactive with PRG4 (2 µg/mL) (MABT401; Millipore), washed 3 times with 0.1% Tween (in PBS-/-), and incubated with anti-mouse horseradish peroxidase–conjugated secondary antibody. Finally, 3,3′,5,5′-tetramethylbenzidine substrate was added. The reaction was stopped with 2M H2SO4, and samples were read at 450 nm. Purified full-length recombinant human PRG4 standards were used to calculate PRG4 concentrations within the media samples. 1 Data were normalized to total DNA content (see DNA Assay).
Mechanical Testing
Mechanical testing was performed using a Mach-1 micromechanical tester (Biomomentum) equipped with a 1-kg load cell and 16-bit A/D card (full-scale signal discretized into 65k levels, 0.05 g resolution, and 2.5 kHz sample rate) to compare the SZ- and DZ-derived tissues. Although the surface of the cultures is largely flat (and parallel to the bottom surface), the developed tissues can have slight undulations present across the surface. For this reason, we opted to use indentation testing to determine tissue mechanical properties. Thicknesses of the constructs were determined using the needle probe method, 14 and they were measured twice at different locations near the center of the construct and averaged. Construct mechanical properties, including bulk modulus, were determined using the Hayes double indentation method13,19 using 2 plane-ended indenters (2 and 4 mm), indenting the samples to 10% strain at a rate of 10% per second. Constructs were allowed to equilibrate ~20 minutes between indentations.
Line Scan Analysis
FIJI ImageJ software was used for line scan analysis. In brief, immunofluorescence TIFF images of matrix proteins were uploaded into ImageJ. Channels were split only to show the protein of interest. A 250-pixel width line was traced across the image and saved as a region of interest. The intensity was measured along the region of interest for both SZ and DZ day 21 images for a given protein. Intensity values were plotted as a function of distance.
Statistical Analysis
All experiments were conducted ≥3 times, and each independent experiment was performed with cells that were pooled from multiple legs. Each condition in independent experiments was conducted in triplicate. Data collected from experiments were pooled. To detect differences between 2 groups, we used t tests. For ≥3 groups, an analysis of variance was used to determine whether differences existed between group means, followed by planned comparisons using the Bartlett correction method to detect differences between groups of interest using GraphPad Prism (GraphPad Software Inc, Boston, MA). Group comparisons for each set of gene expression data are shown in Appendix Table A3 (available online). Data are presented as mean ± SD.
Results
Monolayer Expansion of SZCs and DZCs Led to Morphological Changes
For cell number expansion, an equivalent number of freshly isolated (primary; P0) SZCs and DZCs were seeded onto culture vessels. Once DZCs reached 80% to 90% confluency, both SZC and DZC populations were removed from culture vessels. At this point, cells were deemed as P1. Compared with P1 SZCs, a larger number of P1 DZCs were removed from culture vessels as indicated by the expansion yield from P0 to P1 (Figure 1A). However, after the second passaging event (P1 to P2), a similar number of P2 DZCs and SZCs were harvested from culture vessels. No difference was noted in the expansion yield fold between SZCs and DZCs from P1 to P2.
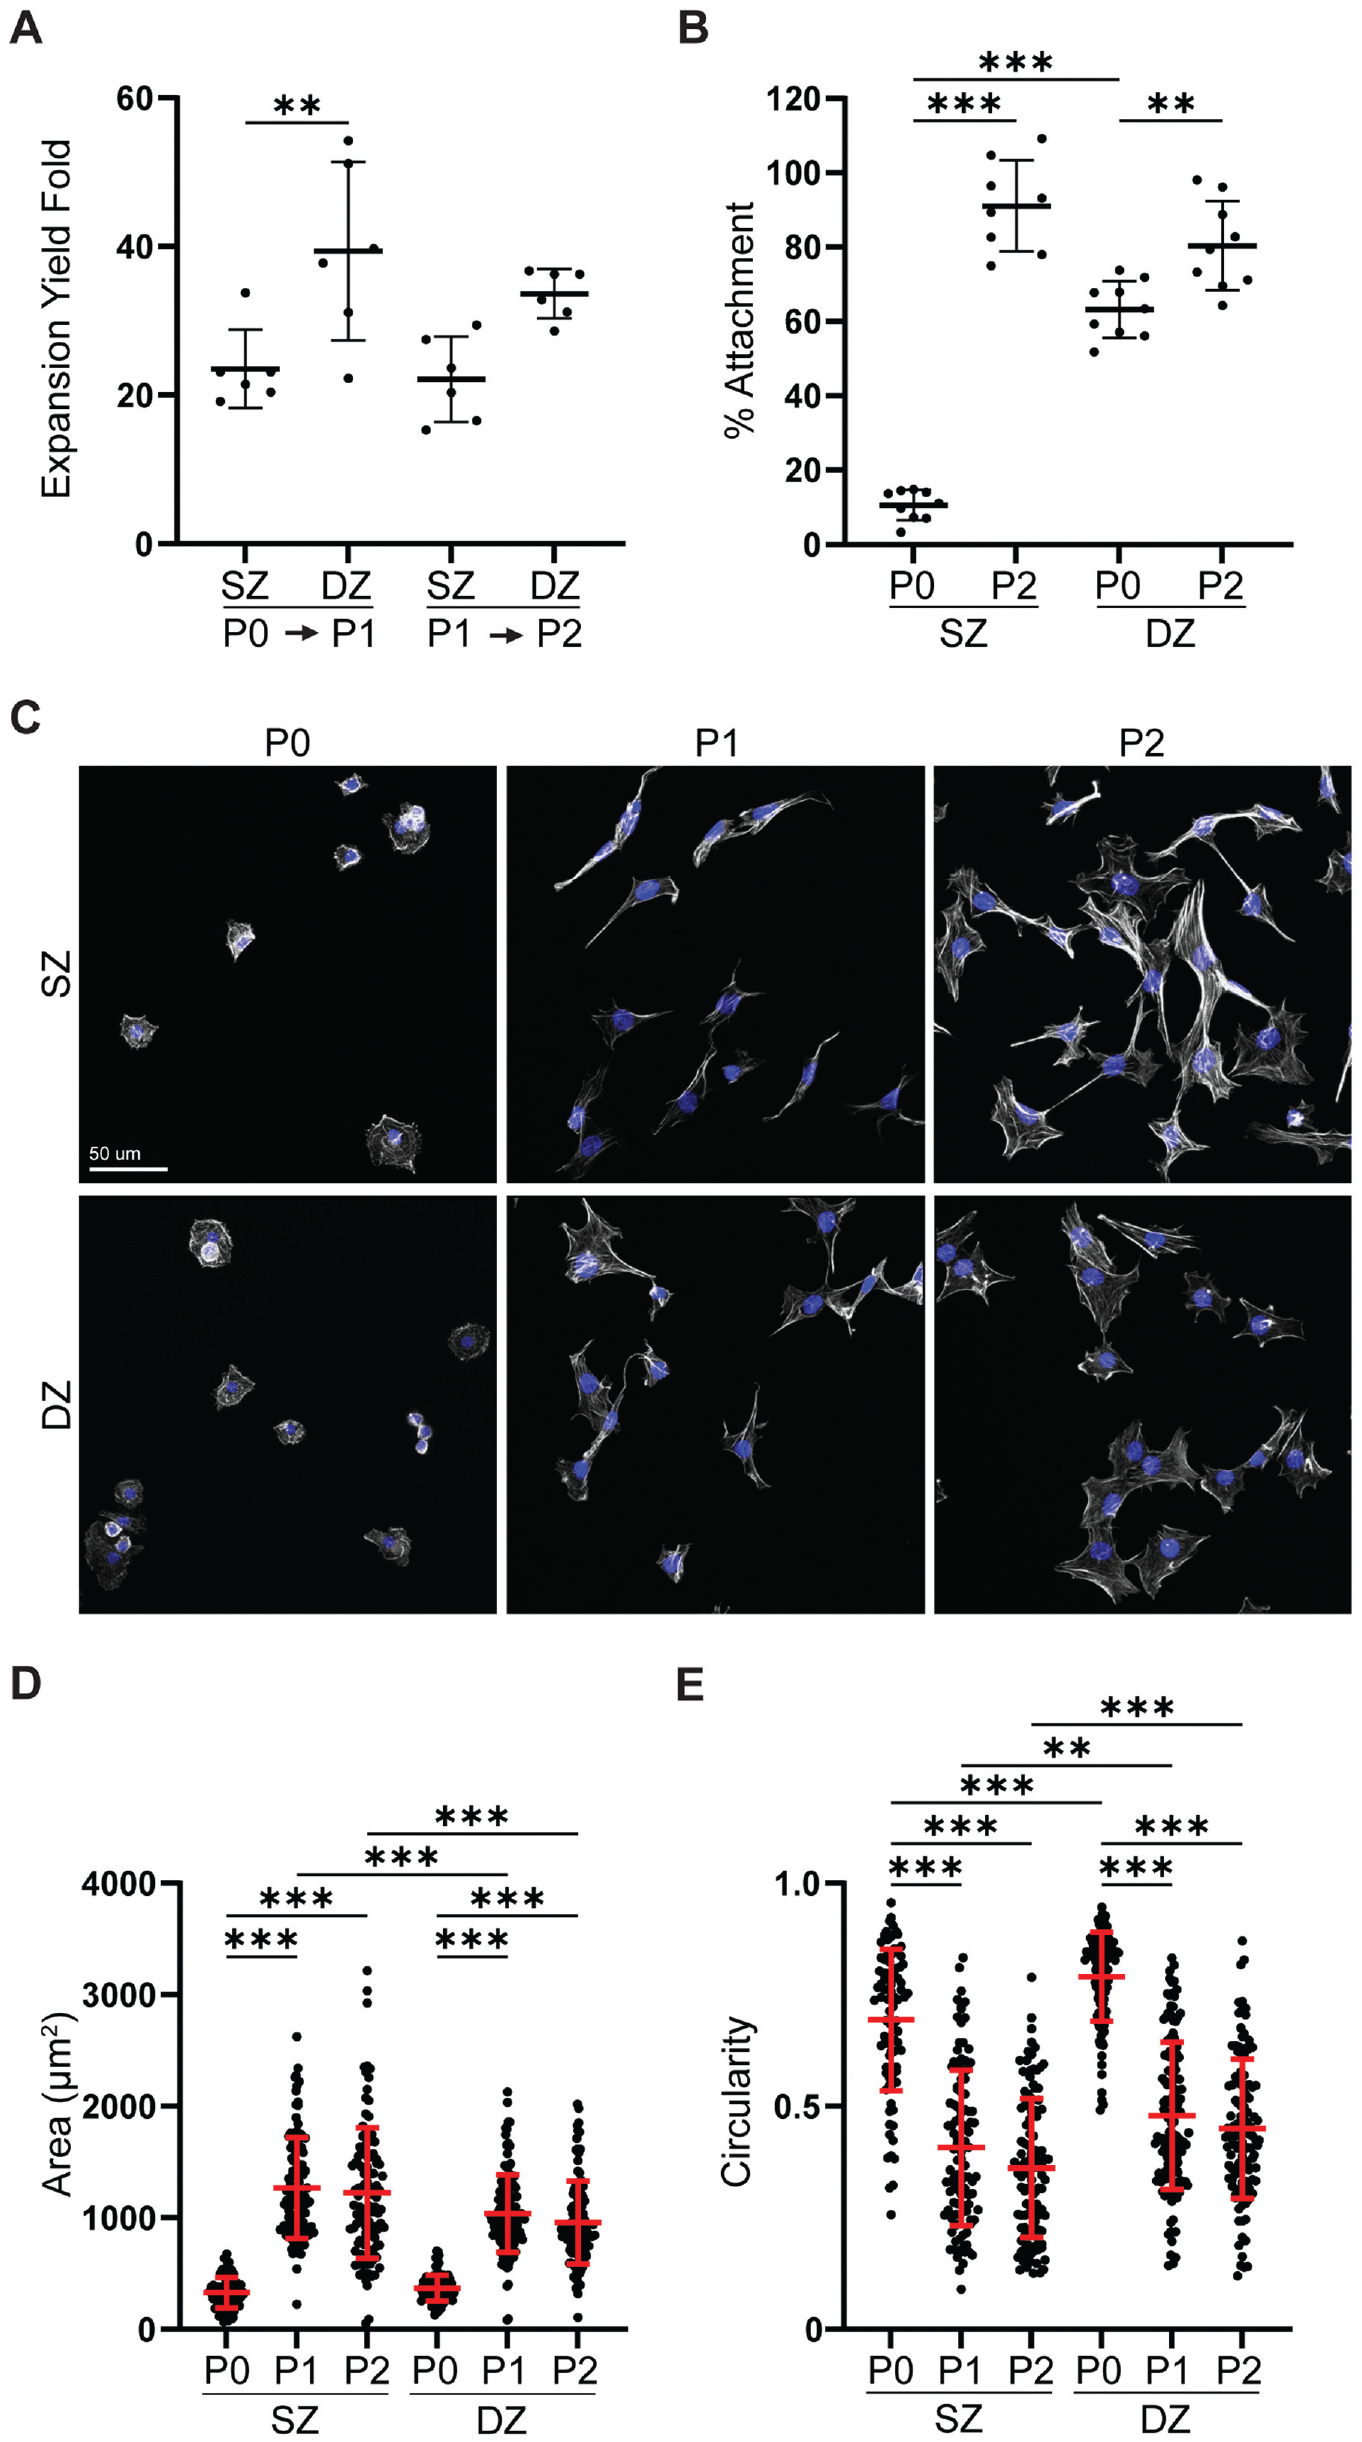
Effects of monolayer expansion on SZCs and DZCs. (A) Calculated expansion yield fold at each passage and (B) percentage attachment of P0 and P2 SZCs and DZCs. (C) Confocal microscopy showing F-actin organization and cell shape (gray, phalloidin for F-actin; blue, Hoechst for nuclei). (D) Area and (E) circularity of passaged SZCs and DZCs. DZ, deep zone; DZC, deep zone chondrocyte; SZ, superficial zone; SZC, superficial zone chondrocyte; P0, Passage 0; P1, Passage 1; P2, Passage 2. Data represented as mean ± standard deviation. **P < .01. ***P < .001.
The observed differences in fold expansion between SZCs and DZCs from P0 to P1 could be due to differences in P0 cell attachment. Therefore, percentage attachment was evaluated by seeding an equivalent number of SZCs and DZCs on culture vessels and determining the proportion of cells that remained on the culture vessel after 24 hours (Figure 1B). P0 SZCs had lower attachment than DZCs (10.5% ± 3.8% vs 63.3% ± 7.2%, respectively). However, by P2, there was no difference in attachment between SZCs and DZCs.
To characterize the effect of monolayer expansion on SZC and DZC cell morphology, we examined the circularity and area of P0, P1, and P2 cells (Figure 1, C -E). At P0, both SZCs and DZCs were round, and there was no difference in area between SZCs and DZCs (Figure 1, C and D). At P0, SZCs were slightly more elongated than DZCs (Figure 1, C and E). By P1, cells exhibited morphological changes. Both SZCs and DZCs spread as indicated by increased cell area (Figure 1D) and decreased circularity (Figure 1E). Passaged SZCs were larger and more elongated than DZCs at both P1 and P2. The morphological changes observed between P0 and P2 were accompanied by changes in F-actin organization. P0 SZCs and DZCs displayed cortical F-actin, but by P1 both SZCs and DZCs contained F-actin stress fibers (Figure 1C).
Passaging SZCs and DZCs Led to the Loss of Chondrogenic and Zone-Specific Gene Expression Between P0 and P2
To evaluate the effect of monolayer expansion on chondrogenic and zone-specific gene expression, we examined the mRNA levels at P0 and P2 in SZCs and DZCs. In terms of the chondrogenic gene COL2 (Figure 2A), no significant differences were found in mRNA levels at P0 between SZC and DZC. In addition, there was no difference in SRY-box transcription factor 9 (SOX9), a known transcription factor of ACAN and COL2,22,47 between primary SZCs and DZCs (Appendix Figure A2A, available online). As zonal subpopulations were expanded to P2, COL2 mRNA levels decreased for both SZCs and DZCs compared with P0. At P2, COL2 mRNA levels were higher in the DZC compared with SZC subpopulation. In terms of the chondrogenic gene ACAN (Figure 2A), DZCs expressed higher mRNA levels compared with SZCs at P0. As zonal subpopulations were passaged, ACAN mRNA levels decreased.
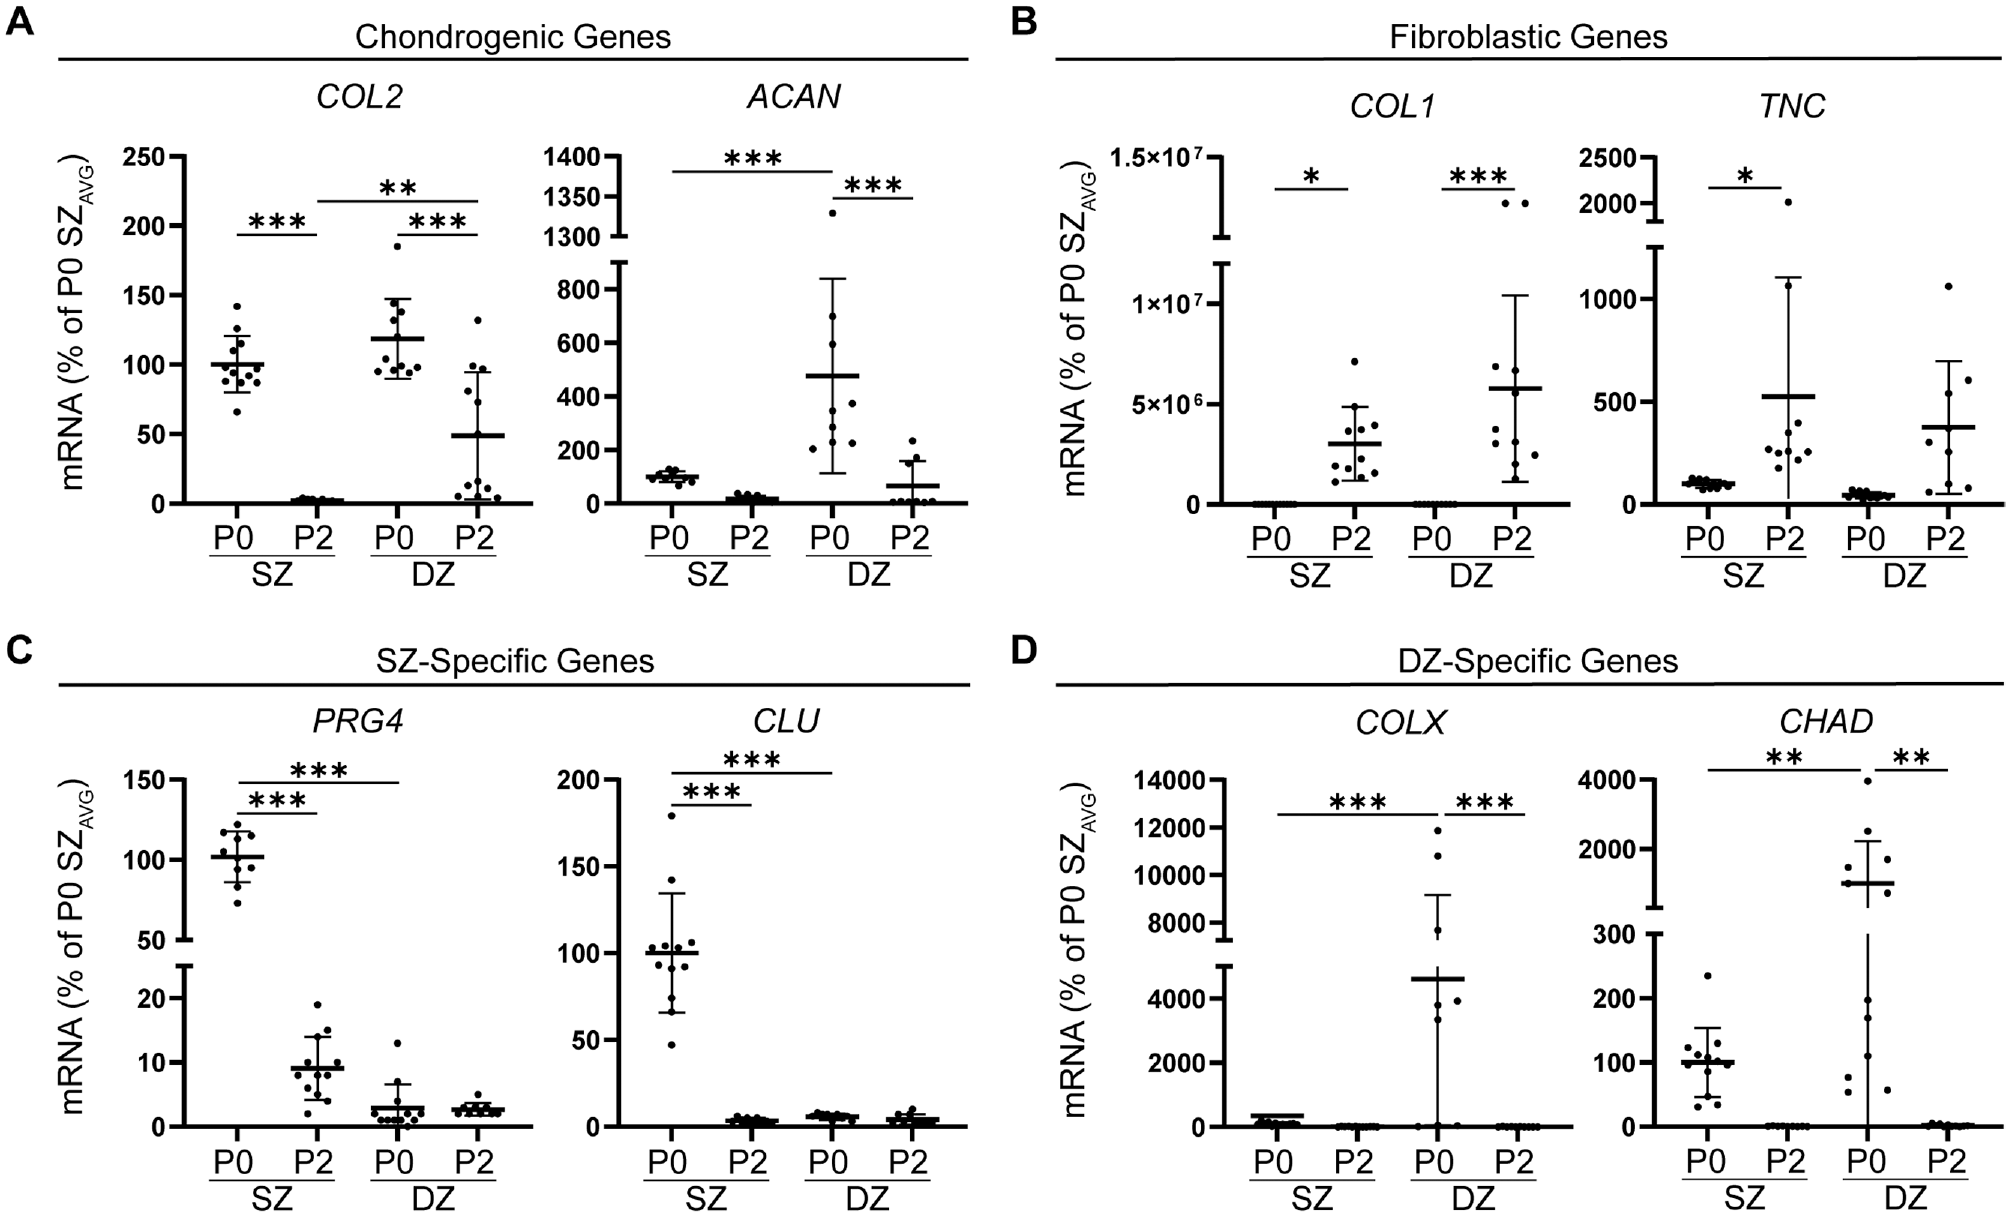
Effects of passaging on chondrogenic, fibroblastic, and zone-specific mRNA levels. Real-time reverse transcription polymerase chain reaction demonstrating (A) a decrease in chondrogenic mRNA levels and (B) increased fibroblastic mRNA levels. Passaging decreased mRNA levels of (C) SZ-specific genes PRG4 and CLU and (D) DZ-specific genes COLX and CHAD. The mRNA levels were expressed as a percentage of P0 SZ mRNA levels. ACAN, aggrecan; CLU, clusterin; COL1, collagen type I; COL2, collagen type II; COLX, collagen type X; DZ, deep zone; PRG4, proteoglycan-4; SZ, superficial zone; TNC, tenascin C, P0, Passage 0; P2, Passage 2; AVG, average. Data represented as mean ± standard deviation. *P < .05. **P < .01. ***P < .001.
This trend was not significant in SZCs; however, in DZCs, there was a decrease in ACAN mRNA levels by P2, compared with P0. No difference was found in ACAN mRNA levels at P2 between SZCs and DZCs.
In addition to finding decreased chondrogenic mRNA levels, we noted an increase in fibroblastic matrix genes (Figure 2B). At P0, both SZCs and DZCs had low levels of COL1 and TNC mRNA. As zonal subpopulations were passaged to P2, COL1 increased in both SZCs and DZCs, compared with P0; however, TNC mRNA levels were significantly increased in SZCs. No differences were seen in COL1 or TNC mRNA levels between SZCs and DZCs at P0 or P2.
With regard to SZ-specific genes (Figure 2C), P0 SZCs expressed higher PRG4 and CLU mRNA levels compared with DZCs. Monolayer expansion of the chondrocytes from P0 to P2 decreased PRG4 and CLU mRNA levels in SZCs. The mRNA levels for PRG4 and CLU were low at P0 and remained low at P2. By P2, no differences were seen in PRG4 or CLU mRNA levels between SZ and DZ subpopulations.
Conversely, at P0, DZCs expressed significantly higher levels of DZ-specific gene COLX mRNA compared with SZCs (Figure 2D). Monolayer expansion from P0 to P2 decreased COLX mRNA levels in DZCs, with no significant effect on SZC levels as COLX expression remained low. By P2, no significant differences were seen in COLX mRNA levels between SZCs and DZCs. Similarly, P0 DZCs had high expression for chondroadherin (CHAD) mRNA levels, whereas limited levels were seen in P0 SZCs. By P2, CHAD mRNA levels had significantly decreased in DZCs.
Passaging SZCs and DZCs led to significantly decreased chondrogenic and zone-specific mRNA levels and increased fibroblastic gene mRNA levels. By P2, no significant differences in expression levels were seen between SZ and DZ cells for all genes tested, with the exception of COL2, which remained significantly higher in the DZ subpopulation.
Redifferentiation of P2 SZCs and DZCs in Adherent Agarose Mold Culture Led to Reexpression of Chondrogenic and Zone-Specific Genes
To determine the effect of redifferentiation culture conditions on SZC and DZC phenotypes, we seeded P2 SZCs and DZCs in 3D within agarose molds and maintained them in culture media known to promote P2 full-thickness chondrocyte redifferentiation. 29 Real-time reverse transcription PCR was used to analyze mRNA levels of passaged SZCs and DZCs in 3D adherent agarose mold (adAM) culture as compared with P2 cells seeded in monolayer culture. In terms of cartilage matrix genes (Figure 3A), although trends were seen toward increased SZC COL2 mRNA levels in redifferentiation culture, these trends were not statistically significant. Conversely, redifferentiated DZCs showed an increase of COL2 expression by day 10 of redifferentiation. By day 20 of culture, DZC COL2 mRNA levels decreased and were similar to P2 DZCs in monolayer culture. The redifferentiated SZCs showed no significant change in ACAN mRNA levels at day 10 or day 20 compared with P2 monolayer levels. Although no significant increase in ACAN mRNA levels was seen in the redifferentiated DZCs at day 10 or day 20, there was a trend toward increased mRNA levels from P2 to day 20 of redifferentiation.
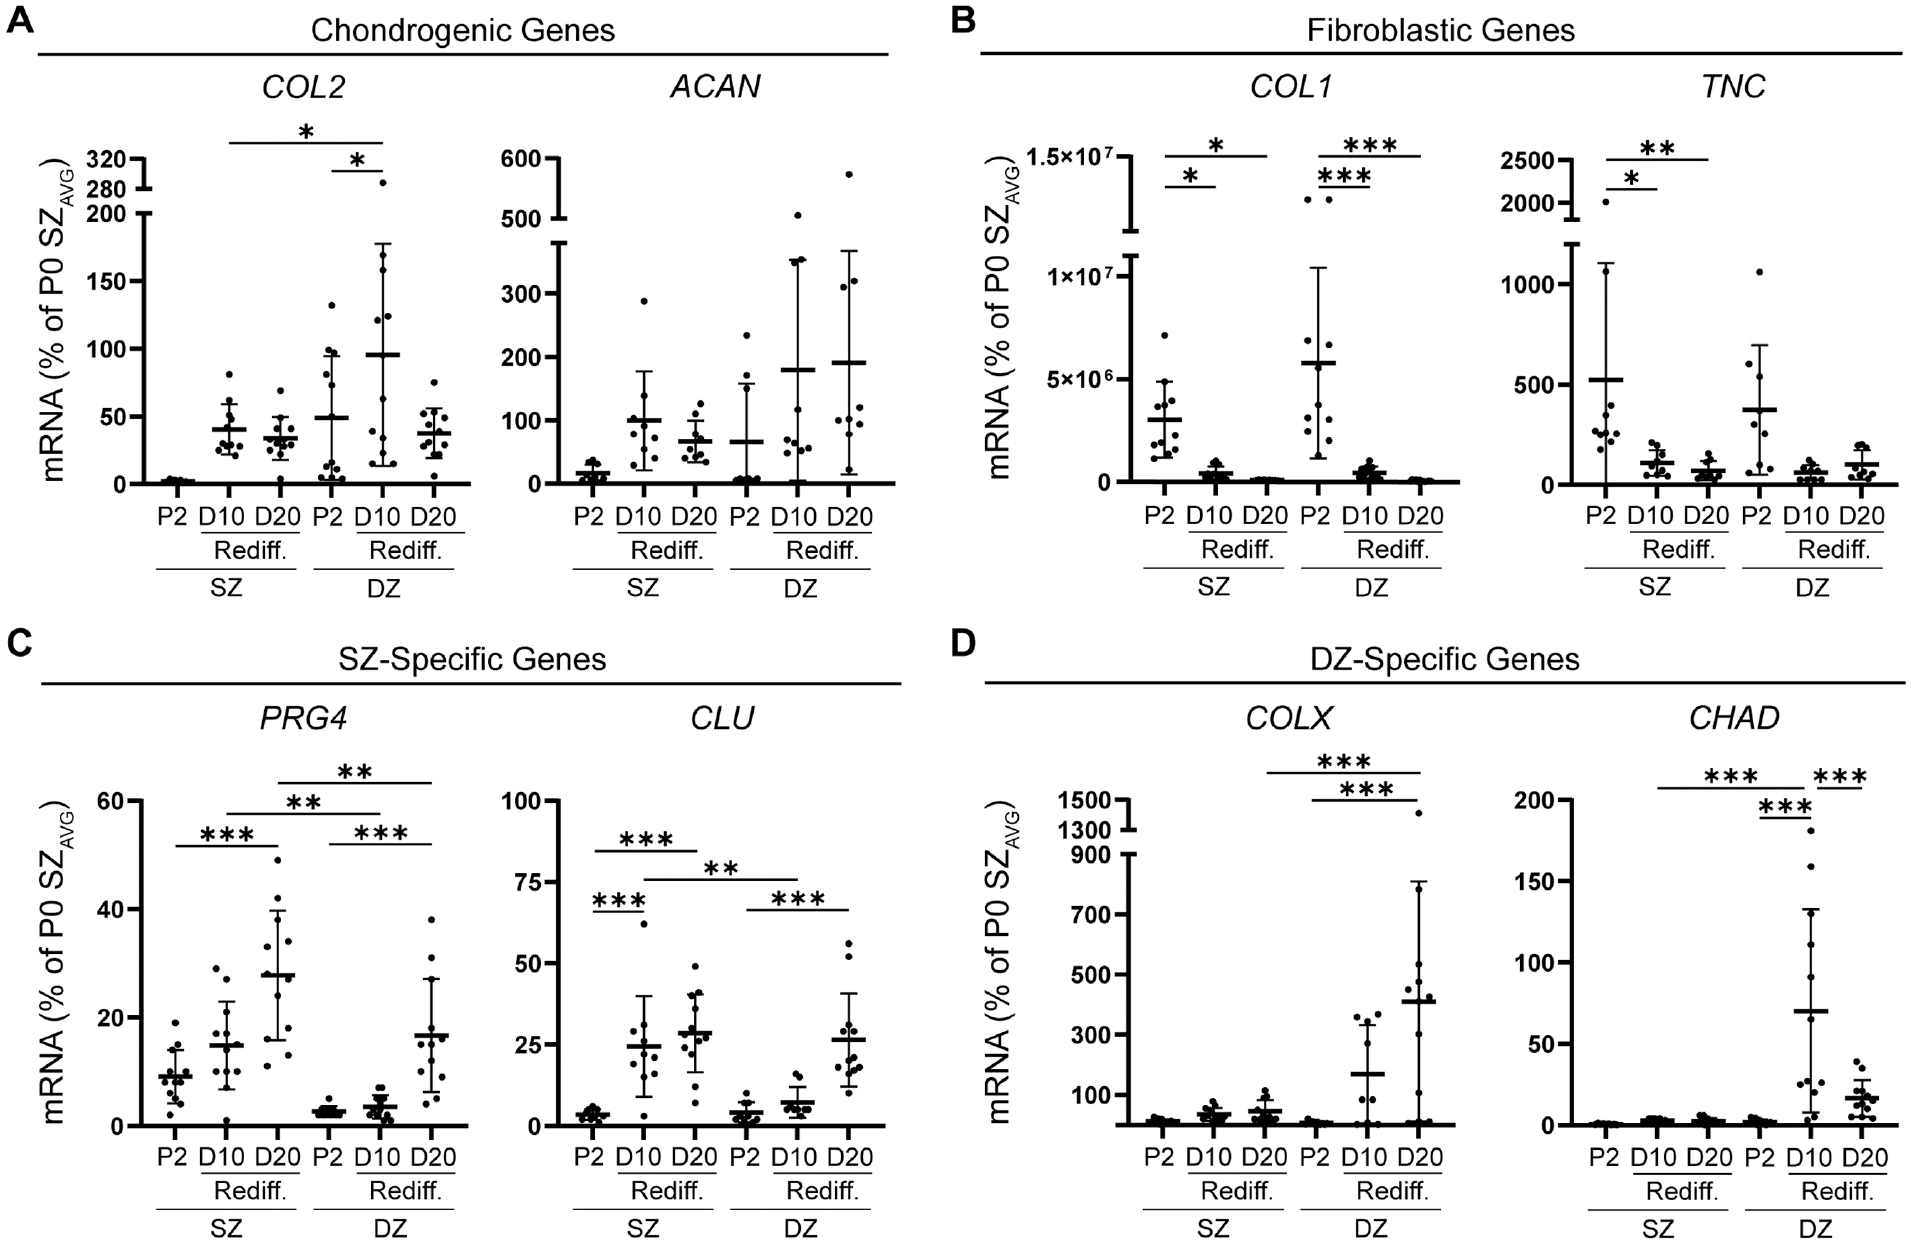
Effect of redifferentiating (Rediff) SZCs and DZCs on chondrogenic and zone-specific gene expression. Real-time reverse transcription polymerase chain reaction demonstrating (A) reexpression of chondrogenic genes and (B) a decrease in fibroblastic mRNA levels after redifferentiation of P2 SZCs and DZCs. In addition, redifferentiation showed reexpression of mRNA levels of (C) SZ-specific genes in P2 SZCs and (D) a DZ-specific gene in P2 DZCs. mRNA levels are expressed as a percentage of SZ P0 mRNA levels. ACAN, aggrecan; CLU, clusterin; COL1, collagen type I; COL2, collagen type II; COLX, collagen type X; D, day; DZ, deep zone; DZC, deep zone chondrocyte; PRG4, proteoglycan-4; SZ, superficial zone; SZC, superficial zone chondrocyte; TNC, tenascin C; P0, Passage 0; P2, Passage 2; AVG, average. Data represented as mean ± standard deviation. *P < .05. **P < .01. ***P < .001.
The mRNA levels of fibroblastic markers COL1 and TNC (Figure 3B) decreased after redifferentiation. At day 10 and day 20, both SZCs and DZCs showed decreased COL1 mRNA levels compared with the P2 monolayer condition. SZCs had a decrease in TNC mRNA levels by day 10, which was maintained at day 20. No significant changes were found in TNC mRNA levels for DZCs at either day 10 or day 20 compared with P2. Redifferentiation culture of passaged SZCs and DZCs resulted in reacquisition of the zonal chondrocyte phenotype. SZ-specific molecules were reexpressed during adAM culture (Figure 3C), as indicated by increased PRG4 and CLU mRNA levels. For PRG4, no significant increase was seen in mRNA levels after 10 days of redifferentiation culture of SZCs. However, after 20 days of culture, PRG4 mRNA levels were elevated 3.1-fold compared with P2. Redifferentiated DZCs showed no difference in PRG4 mRNA levels at day 10, whereas levels increased by day 20. Redifferentiated SZCs maintained elevated PRG4 mRNA levels at day 10 and day 20 compared with the respective DZ condition. Additionally, SZCs showed increased CLU mRNA levels at both day 10 and day 20 compared with P2 SZCs. Although redifferentiated DZCs had no increase in CLU mRNA levels at day 10, there was an increase by day 20 compared with P2 DZCs. Reexpression of the DZ-specific molecule COLX or CHAD (Figure 3D) was not observed during the redifferentiation of SZCs in adAM cultures at day 10 or day 20. Conversely, there was an increase in COLX and CHAD mRNA levels at day 10 during redifferentiation of passaged DZCs compared with DZ P2 levels. At day 20, redifferentiated DZCs had significantly higher COLX mRNA levels compared with SZCs.
The redifferentiation of P2 SZCs and DZCs not only led to reacquisition of the primary chondrocyte mRNA levels but, notably, led to the reacquisition of zone-specific markers by SZCs and DZCs.
Redifferentiated P2 DZCs Produced Thicker Tissue That Was More Resistant to Compression Than the Tissue Produced By Redifferentiated P2 SZCs
To evaluate the ability of P2 SZCs and DZCs to form matrix, we harvested and examined tissues generated in adAM cultures. Toluidine Blue staining (Figure 4A) of histological sections showed the presence of proteoglycans in both SZC- and DZC-derived tissue at day 11 and day 21.
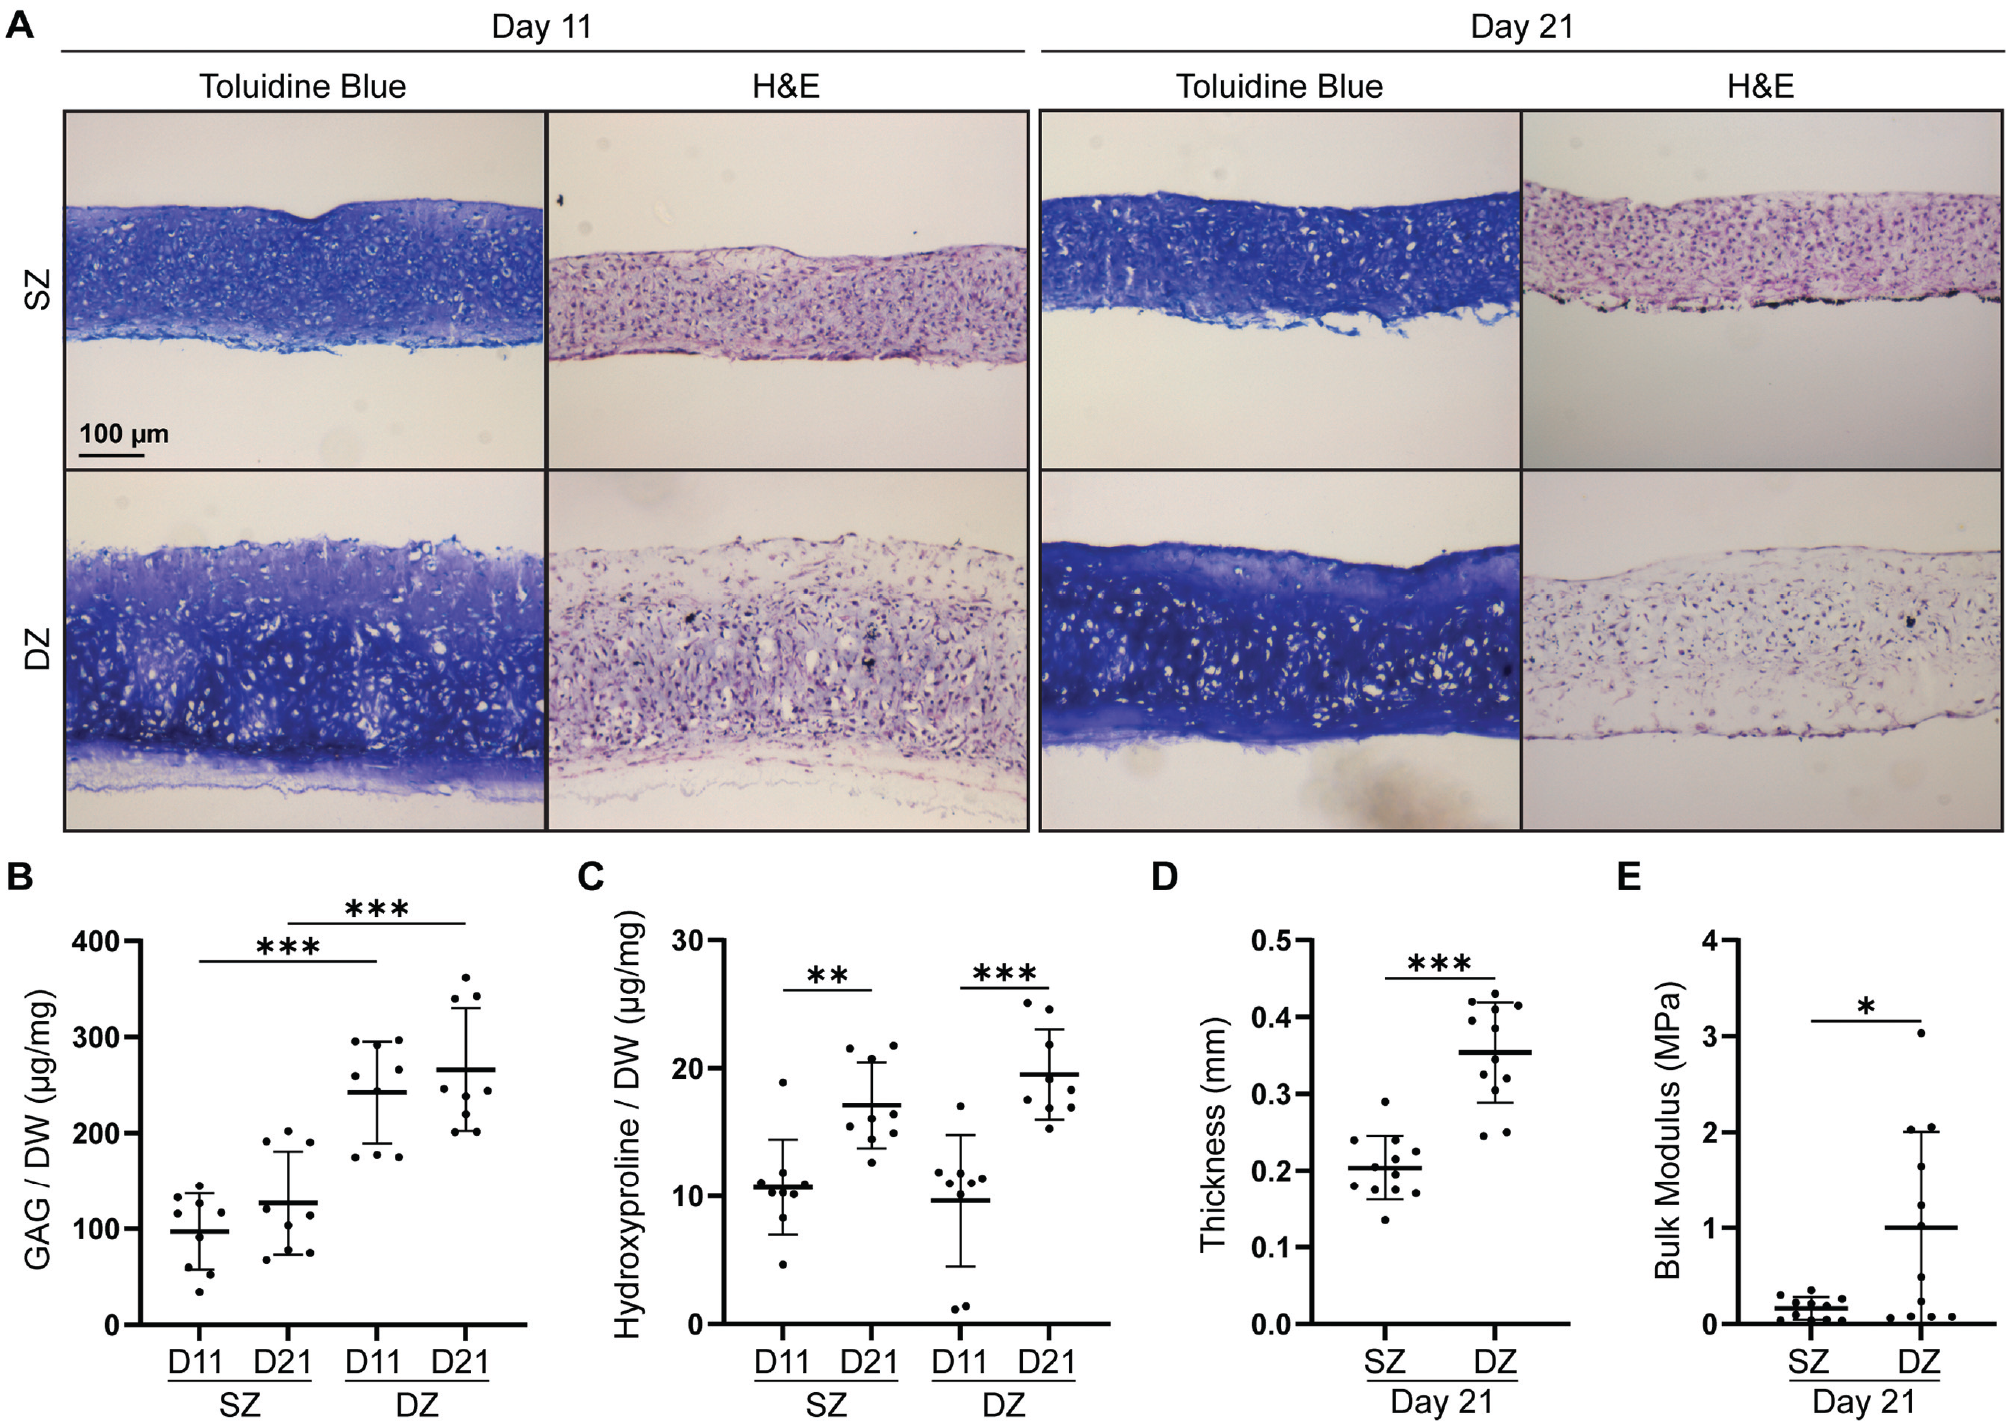
Matrix accumulation and mechanical properties of redifferentiated P2 SZCs and DZCs. (A) Toluidine Blue and H&E staining of passaged SZCs and DZCs at 11 and 21 days of redifferentiation. (B) GAG and (C) collagen accumulated per DW at 11 and 21 days. Mechanical indentation testing outputs for (D) thickness and (E) bulk modulus of tissues at day 21. D, day; DW, dry weight; DZ, deep zone; DZC, deep zone chondrocyte; GAG, glycosaminoglycan; H&E, hematoxylin and eosin; SZ, superficial zone; SZC, superficial zone chondrocyte; P2, Passage 2. Data represented as mean ± standard deviation. *P < .05. **P < .01. ***P < .001.
Hematoxylin and eosin staining showed production of extracellular matrix at both time points by both zonal chondrocytes. GAG content (Figure 4B) showed that redifferentiated P2 DZCs accumulated more GAGs per dry weight of the tissue compared with SZCs at both day 11 and day 21. No difference in collagen content (Figure 4C) was found between SZ- and DZ-derived tissues. A greater amount of collagen was noted in both SZ and DZ tissues at day 21 compared with day 11.
Tissues produced by P2 DZCs were more robust compared with those produced by P2 SZCs. On day 21, DZC-derived tissues were thicker (0.31 ± 0.033 mm) than the SZC-derived tissues (0.276 ± 0.046 mm) (Figure 4D). In addition, on day 21, mechanical testing showed that the bulk modulus of DZC-derived tissues (4.3 ± 0.9 MPa) was significantly higher than that of SZC-derived tissues (0.9 ± 0.25 MPa) (Figure 4E).
P2 Zonal Chondrocytes Can Be Induced to Promote Chondrogenic Macromolecule Accumulation and Reexpress Zone-Specific Protein Accumulation
To evaluate matrix protein production by zonal chondrocytes, we used fluorescence microscopy to examine specific protein expression. SZ and DZ tissues showed accumulation of both COL2 and ACAN at both day 11 and day 21 (Figure 5A). Line scan analysis showed similar fluorescent intensity levels for ACAN staining, whereas DZ tissues had higher fluorescent intensity levels of COL2 compared with SZ tissues. Line scan analysis also showed greater staining for COL2 at the tissue edges (Appendix Figure A3, available online). Both SZ and DZ tissues showed similar expression of SOX9 at both day 11 and day 21 (Appendix Figure A2B, available online). To confirm the reduction of fibroblast matrix molecule expression, we stained tissues for COL1. It was found that COL1 decreased by day 21 (Figure 5B). Line scan analysis showed that COL1 staining was limited but SZ tissue had higher fluorescent intensity levels compared with DZ tissue (Appendix Figure A3, available online). This demonstrated that both passaged SZCs and DZCs are capable of producing cartilage matrix molecules with limited production of fibroblastic matrix molecules.
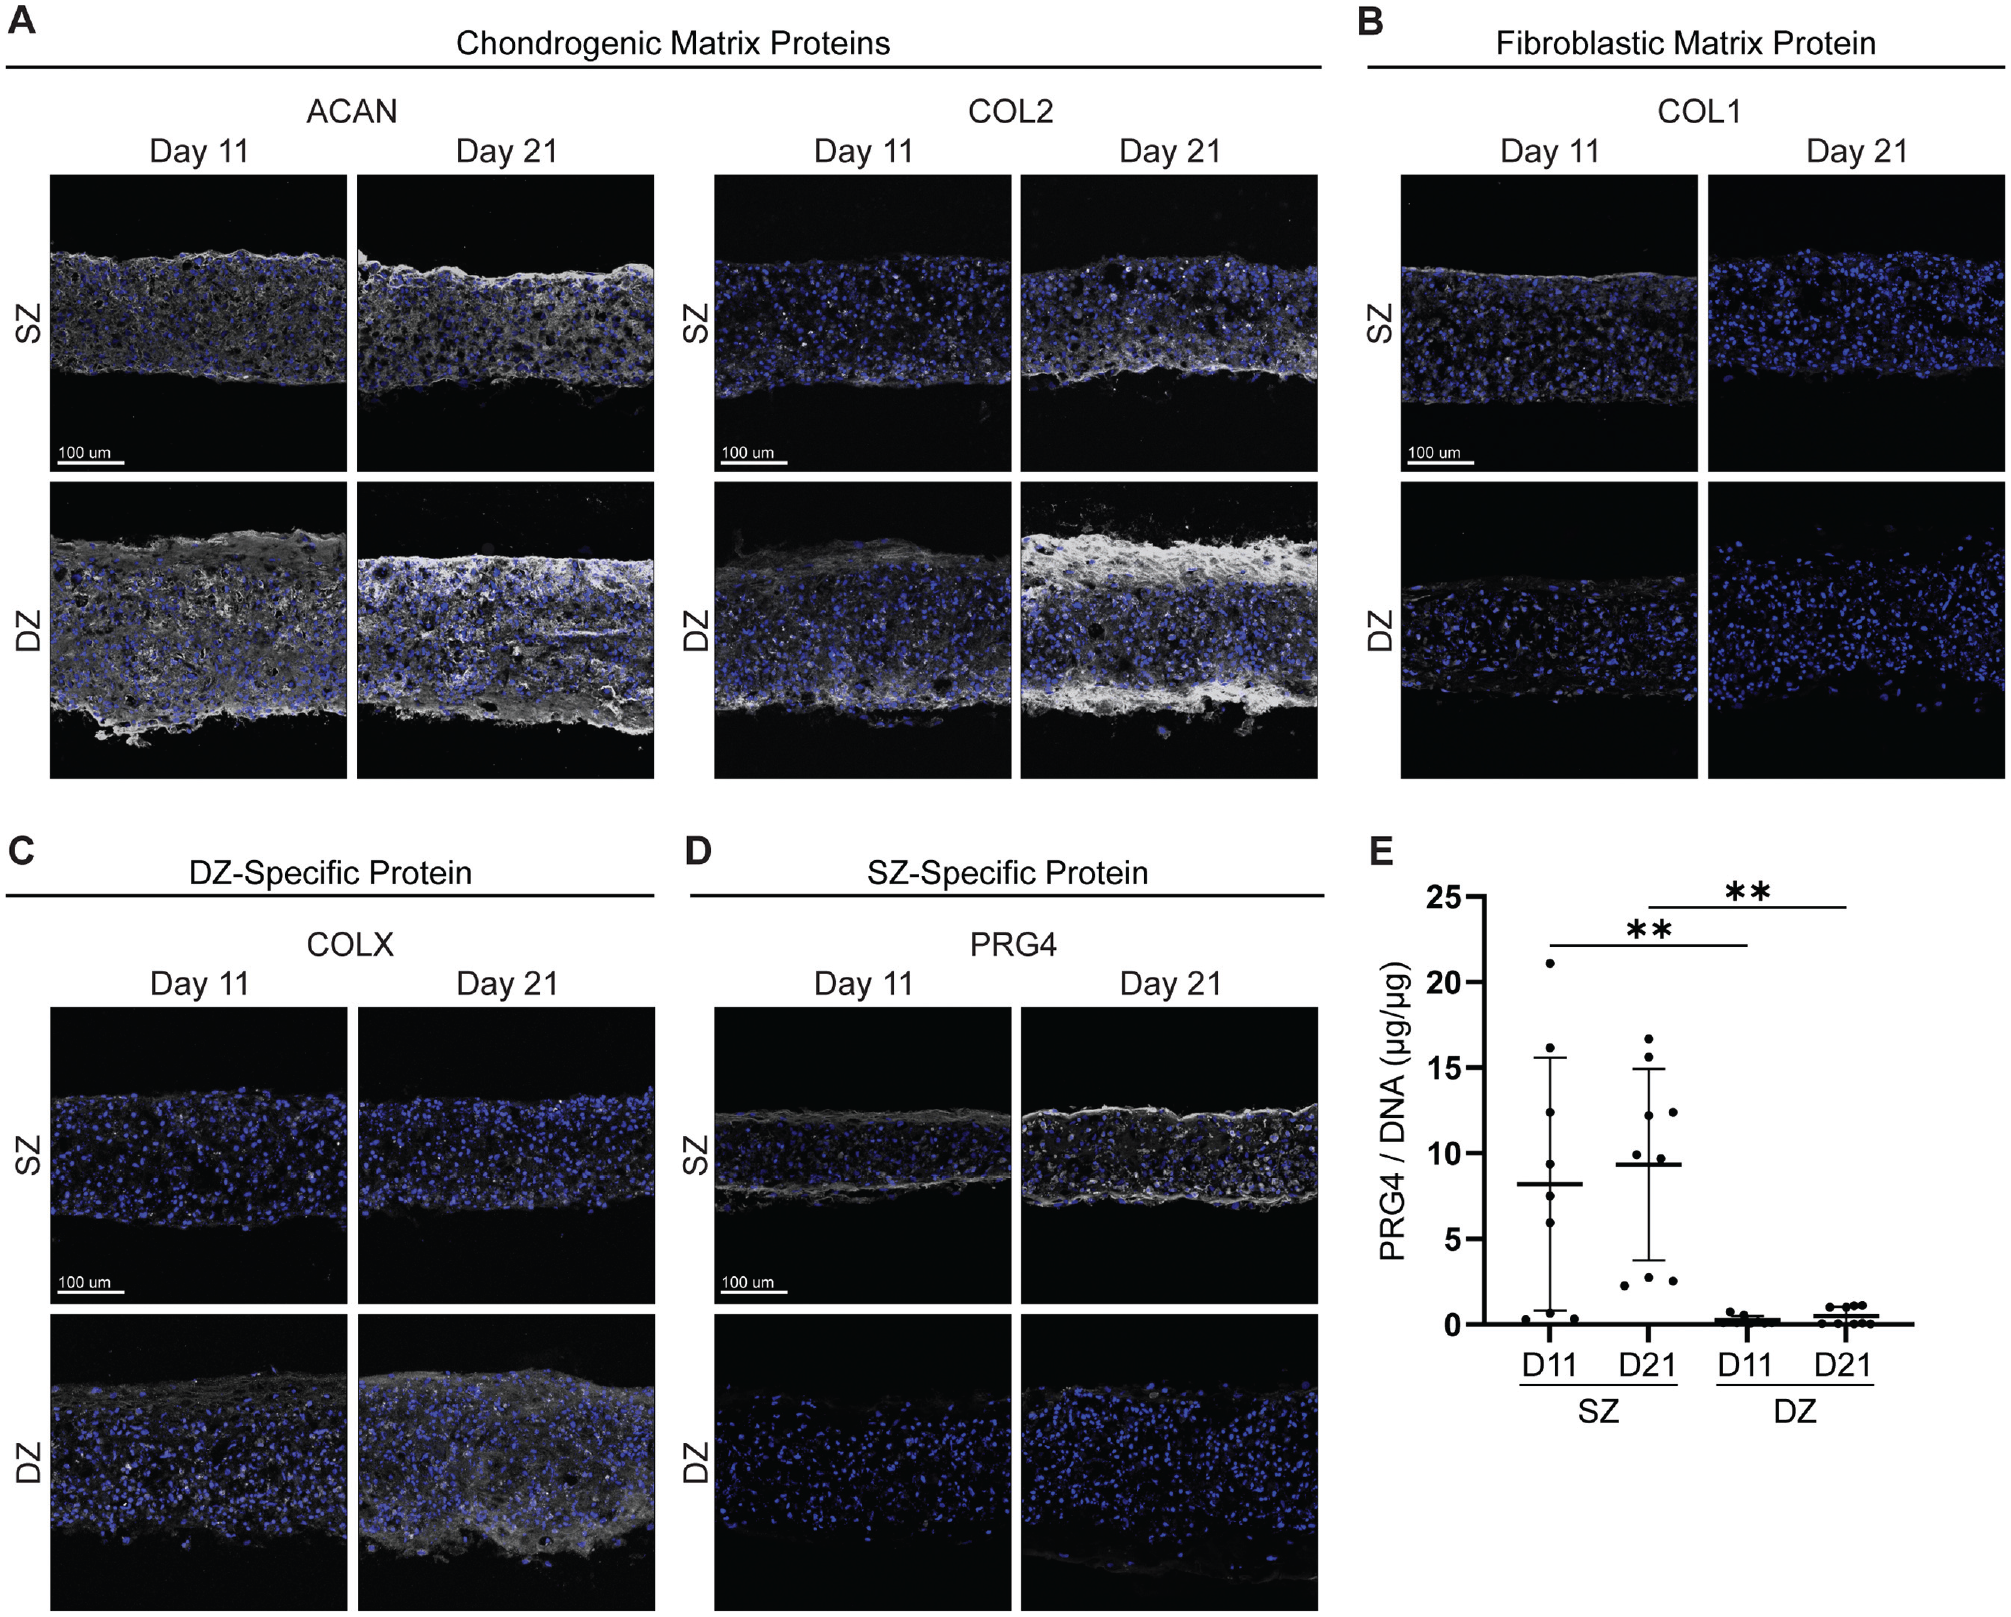
Matrix and zone-specific protein accumulation of redifferentiated P2 SZCs and DZCs. Confocal microscopy images showing (A) matrix accumulation of ACAN and COL2 and (B) decreased matrix accumulation of COL1, a marker of fibroblastic differentiation. Reacquisition of (C) DZ-specific protein COLX and (D) SZ-specific protein PRG4. Specific proteins are shown in grayscale, and tissues were counterstained with Hoechst for nuclei (blue). (E) PRG4 secretion of SZ and DZ tissue at days 11 and 21. ACAN, aggrecan; COL1, collagen type I; COL2, collagen type II; COLX, collagen type X; D, day; DZ, deep zone; DZC, deep zone chondrocyte; PRG4, proteoglycan-4; SZ, superficial zone; SZC, superficial zone chondrocyte; P2, Passage 2. Data represented as mean ± standard deviation. **P < .01.
Staining for DZ-specific protein COLX revealed that DZCs, but not SZCs, have the ability to produce a matrix rich in COLX (Figure 5C). This was further supported via line scan analysis, as DZ tissues had higher fluorescence intensity levels compared with SZ tissues (Appendix Figure A3, available online). Tissues stained for SZ-specific protein PRG4 showed an accumulation of PRG4 primarily at the tissue edges and within the matrix of the SZ-derived tissue, confirmed by both heat mapping of PRG4 fluorescence and line scan analysis, whereas DZ-derived tissue showed little to no accumulation in the matrix (Figure 5D and Appendix Figure A4, available online). To determine whether PRG4 was secreted by redifferentiated cells, we used ELISA and found that the media from SZCs contained 8.2 ± 7.3 µg PRG4/µg DNA and 9.3 ± 5.6 µg PRG4/µg DNA at day 11 and day 21, respectively (Figure 5E). This was substantially higher than PRG4 in the media of redifferentiated DZCs at day 11 and day 21, respectively. The day 11 and day 21 values are representative of the PRG4 secreted during days 9 to 11 and days 19 to 21, respectively. These findings indicate that the production and expression of PRG4 and COLX require a population of P2 SZCs and DZCs, respectively.
Discussion
This study determined that separately expanding SZCs and DZCs led to dedifferentiation of both subpopulations resulting in nearly identical phenotypic characteristics by P2. Placing P2 cells from passaged subpopulations in 3D redifferentiation culture resulted in zone-specific gene reexpression and the generation of cartilage-like tissue with zone-specific properties. This lends support for the hypothesis that both SZCs and DZCs can form bioengineered cartilage rich in COL2 and ACAN and that SZ- and DZ-derived passaged cells have a memory of their primary phenotype, which allows for zone-specific molecule reexpression of PRG4 and COLX, respectively.
In this study, both SZCs and DZCs exhibited dedifferentiation including loss of zone-specific expression and alterations in cell morphology. The loss of zone-specific expression is consistent with previous findings.5,15,29-32 In particular, previous literature used single-cell RNA sequencing to demonstrate that 7 clusters (ie, subpopulations) of chondrocytes exist in uncultured (primary) chondrocytes. 18 However, after monolayer expansion, only 1 population of chondrocytes can be identified. 20 Intriguingly, despite similarities in gene expression between passaged SZCs and DZCs after monolayer expansion, morphological differences exist between passaged cell subpopulations. Although both subpopulations increase in size and elongate after monolayer expansion, SZCs at P2 are larger and more elongated than DZCs at P2. Thus, passaged zonal cells are morphologically distinguishable. This indicates that although gene expression is similar between the passaged subpopulations, these cells are not entirely identical.
Further supporting that passaged zonal subpopulations are not identical, we found that P2 zonal subpopulations can be stimulated to produce tissues with zone-specific characteristics. This is consistent with findings in previous literature that passaged subpopulations of zonal cells encapsulated in agarose hydrogels 7 and in pellet culture 40 produced matrix rich in articular cartilage and retained zone-specific protein expression. The finding that cells can be redifferentiated to reexpress cartilage matrix and zone-specific molecules may be surprising. It has been shown that extensive monolayer passaging of fibroblasts results in mechanical memory of cells to stiff substrates, leading to retention of a profibrotic phenotype despite moving to a new environment (ie, soft substrates).4,23 In chondrocytes, it has been demonstrated that monolayer expansion results in altered chromatin structure that prevents redifferentiation. 41 The ability to redifferentiate chondrocytes has been shown to be influenced by methylation of histone, H3K9. It was determined that increasing the H3K9me3 level reorganizes chromatin in passaged cells, leading to native chromatin conformations that allow for redifferentiation. It has been shown that 3D culture can alter H3K9me3 levels and activity via F-actin reorganization and cytoskeletal relaxation. 49 Although the expression of H3K9me3 was not analyzed in the present study, previous studies have shown reorganization of F-actin stress fibers into cortical F-actin by 3D culture,29,30 which could lead to epigenetic modification. Presumably, monolayer expansion and 3D redifferentiation culture result in closed and open chromatin conformations in promoter regions for zone-specific genes, respectively. The exact mechanisms by which 3D redifferentiation promotes open conformations of certain gene promoter regions in some zonal subpopulation (ie, COLX promoter in DZC) but not in others are not known. A further understanding of the epigenetic regulation of gene expression during differentiation of passaged zonal subpopulations could provide insight into additional enhancement of zone-specific properties but is beyond the scope of the current study.
Nevertheless, the zonal molecular expression levels in P2 cells were recapitulated by 3D redifferentiation, leading to biomechanical differences in generated tissues. This study shows that tissues derived from passaged DZCs had a higher GAG content compared with SZC-derived tissue, which was accompanied by increased compressive strength. This is in keeping with the composition and zone-specific mechanical properties of native chondrocytes. In native cartilage, the relatively high proteoglycan content contributes to a compressively stronger DZ compared with the other zones.3,10 In addition, the P2 DZCs exclusively expressed and produced COLX in redifferentiation culture, similar to native cartilage. COLX is crucial in the integration between cartilage and the underlying bone by contributing to ossification of the matrix while also facilitating dispersion loads between the cartilage and underlying bone.2,11 The expression and production of COLX suggest that passaged DZ cells produce tissue that may more readily integrate with bone. However, we did not test other essential molecules required for potential integration into subchondral bone, such as alkaline phosphatase and runt-related transcription factor 2. The reexpression of other critical DZ molecules requires further validation. This could be further examined in an in vivo model. Nevertheless, reacquiring properties exhibited by the DZ in native cartilage can be achieved via redifferentiation of passaged DZCs.
This study has shown that P2 SZCs exclusively express and secrete PRG4. PRG4 expression by SZCs is essential because it reduces the friction coefficient at the articulating surface required for proper joint movement.17,35,46 Our previous study demonstrated that passaged chondrocytes isolated from full-thickness bovine chondrocytes were able to express and secrete PRG4. 29 However, the PRG4 released into the media by passaged full-thickness chondrocytes (2.6 µg/µg PRG4/DNA on day 20) 29 was lower than that released by SZ passaged chondrocytes (9.3 µg/µg PRG4/DNA on day 21) shown here. The reduced PRG4 secretion in redifferentiated passaged full-thickness cells may be the result of poor SZC attachment after isolation, as the results of the current study (Figure 1E) confirmed previous findings that SZCs attached poorly to polystyrene compared with DZCs. 43 Together, these findings suggest that having an adequate number of passaged SZCs is an important consideration for the generation of functional bioengineered cartilage. This issue is also compounded by the findings that SZCs are the first to be lost during osteoarthritis.36,48 Thus, donor-site cartilage used for clinical application may have a smaller starting number of SZCs. Enriching SZC populations, by developing methods to improve SZC attachment and/or separate expansion of SZCs, may aid in establishing sufficient PRG4 levels.
Intriguingly, PRG4 accumulation in the SZ-derived tissue was primarily localized at tissue surfaces (Appendix Figure A4, available online), similar to the localization of PRG4 at the articular surface of native articular cartilage. The exact mechanism leading to surface PRG4 localization in 3D redifferentiation tissues is unknown, but several factors could play roles. It has been shown that mechanical stimulation can induce PRG4 expression, 28 leading to the possibility that the cellular forces generated by cell attachment to polystyrene at the basal surface may stimulate PRG4 production by cells at the bottom of tissues. Additionally, high oxygen access can induce PRG4 expression, 27 and therefore the increased availability for oxygen at the top surface of tissues could allow for greater accumulation of PRG4. Line scan analysis (Appendix Figure A4, available online) showed PRG4 expression in the middle region, albeit not as high as at the surface, although it is not currently known whether this PRG4 diffuses to the surface. Further understanding of the mechanism driving PRG4 localization could allow for better re-creation of a SZ in bioengineered cartilage.
A limitation of this study is that only SZCs and DZCs of articular cartilage were evaluated. The intended exclusion of MZCs from analysis allowed for the isolation and enrichment of SZCs and DZCs to gain a better understanding of their ability to retain their chondrogenic phenotype and zone-specific expression. However, the MZ and MZCs have important characteristics. The MZ of articular cartilage serves as a transition between the SZ and DZ and is the first resistance to compressive loads during articulation. 10 Additionally, previous work found that coculturing MZCs with SZCs can stimulate the production of PRG4. 6 Intriguingly, it has been shown that tissue-engineered cartilage with a mixed population of SZCs and MZCs produces a lower coefficient of friction at the surface compared with tissue derived strictly from SZCs. 33 Exploring the capabilities of MZCs to retain their zone-specific phenotype and produce MZ-derived tissue during redifferentiation is worthy of future investigation.
In this study, we examined the redifferentiation potential of bovine chondrocyte subpopulations. Human cells were not used in the present study; however, this study provides a conceptual framework that could be applied to assess the redifferentiation capabilities of healthy or diseased human chondrocyte zonal subpopulations. In addition, this study used chondrocytes harvested from 6- to 9-month-old calves, in which the cartilage is still developing and does not fully represent adult cartilage. It has been previously shown that human chondrocytes from older individuals (>70 years of age) have less chondrogenic potential indicated by low SOX9 expression compared with chondrocytes from younger individuals (17-43 years of age). Additionally, chondrocytes from older individuals proliferate more slowly. 42 This finding could have clinical implications because harvested chondrocytes typically come from older patients. However, subjecting old chondrocytes to on-agarose suspension culture was found to “rejuvenate” the chondrocytes and enhance repair tissue formation. Within the 3D culture system, the chondrocytes experience a more native-like environment, promoting cell rounding and potentially restoring chondrocyte phenotype. 42 Future studies should further address the difference between tissue formed by maturing and matured cartilage and the ability to rejuvenate older chondrocytes.
This study showed that passaged SZCs and DZCs seem to have a phenotypic memory of their primary state. Passaging zonal chondrocyte subpopulations allows for tailoring the molecular expression in bioengineered cartilage such that the SZ and DZ tissues can reacquire the zone-specific PRG4 and COLX, respectively, while maintaining production of hyaline cartilage matrix that is rich in COL2 and ACAN. These biological properties resemble those of native articular cartilage and are crucial in reconstituting the mechanical properties sustaining compressive and shearing loads of native cartilage tissue. Our findings may facilitate bioengineering of cartilage tissue with zonal structure, which has been one of the major challenges in this field. This progress contributes to functional tissue engineering that would ultimately translate to clinical application of cartilage restoration therapy. With appropriate biological and mechanical attributes, the engineered tissue may result in better clinical outcome compared with current cell-based therapy. This could be an important step in the continued improvement of bioengineered cartilage and could lead to potential alternatives to osteochondral grafts.
Supplemental Material
sj-pdf-1-ajs-10.1177_03635465241230031 – Supplemental material for Passaged Articular Chondrocytes From the Superficial Zone and Deep Zone Can Regain Zone-Specific Properties After Redifferentiation
Supplemental material, sj-pdf-1-ajs-10.1177_03635465241230031 for Passaged Articular Chondrocytes From the Superficial Zone and Deep Zone Can Regain Zone-Specific Properties After Redifferentiation by Elizabeth E.R. Davis, Thomas J. Manzoni, Vanessa J. Bianchi, Joanna F. Weber, Po Han Wu, Suresh C. Regmi, Stephen D. Waldman, Tannin A. Schmidt, Alvin W. Su, Rita A. Kandel and Justin Parreno in The American Journal of Sports Medicine
Footnotes
Submitted August 26, 2023; accepted November 1, 2023.
One or more of the authors has declared the following potential conflict of interest or source of funding: T.A.S. has a patent on rhPRG4, holds equity in Lubris BioPharma LLC, and is a paid consultant for Lubris LLC. AOSSM checks author disclosures against the Open Payments Database (OPD). AOSSM has not conducted an independent investigation on the OPD and disclaims any liability or responsibility relating thereto.
This work was supported by the Delaware INBRE program from the National institute of General Medical Sciences - NIGMS (P20 GM103446) to J.P., a NSERC Discovery Grant (RGPIN-2016-06088) to R.A.K., an American Orthopedic Society for Sports Medicine Steven P. Arnoczky Young Investigator Grant to A.W.S. and J.P., and a University of Delaware Chemistry and Biology Interface NIH fellowship (5T32GM133395-03) to T.M.
References
Supplementary Material
Please find the following supplemental material available below.
For Open Access articles published under a Creative Commons License, all supplemental material carries the same license as the article it is associated with.
For non-Open Access articles published, all supplemental material carries a non-exclusive license, and permission requests for re-use of supplemental material or any part of supplemental material shall be sent directly to the copyright owner as specified in the copyright notice associated with the article.