
Abstract
Background:
Many studies have examined the prevalence of acetabular version (AV) and femoral version (FV) abnormalities and their effect on patient-reported outcomes (PROs) after hip arthroscopy for femoroacetabular impingement syndrome (FAIS), but few have explored the prevalence and influence of combined version (CV) abnormalities.
Purpose:
To (1) describe the distribution of AV, FV, and CV in the largest cohort to date and (2) determine the relationship between AV, FV, and CV and PROs after hip arthroscopy for FAIS.
Study Design:
Cohort study; Level of evidence, 3.
Methods:
Patients were identified who underwent primary hip arthroscopy for FAIS between 2012 and 2018 and received computed tomography containing the pelvis and transcondylar knee slices. AV and FV were assessed on computed tomography, with CV calculated as their sum. PROs were collected preoperatively and 2 years postoperatively. The distributions of AV, FV, CV, and combinations thereof were described based on published ranges. The relationships between version measurements and PROs were analyzed based on a given measurement's distance from a normative value, defined as the mean within the study population (eg, relative acetabular anteversion [AAr]). These relationships were first assessed using univariate natural (restricted) cubic regression splines to account for nonlinearity. The relationship between each relative version group (to the mean) and PROs was then assessed using multiple linear regression, with the other 2 version measurements held constant.
Results:
In total, 566 patients were included (66.4% female; mean age, 32.6 ± 11.9 years; mean body mass index, 25.2 ± 5.1). The mean follow-up was 28.0 months. The mean AV, FV, and CV were 17.1°± 5.2°, 12.1°± 9.2°, and 29.3°± 11°, respectively. Univariate natural cubic regression splines demonstrated that AAr had a significant negative association with 4 of 5 PROs preoperatively and 3 of 5 PROs 2 years postoperatively (P≤ .018). All other relative version groups did not have a significant relationship with any PRO at either time point (P > .05). The association between AAr and relatively worse PROs was maintained after controlling for relative FV and CV via multiple linear regression, particularly in patients with relative femoral retroversion.
Conclusion:
FV and CV, as distinct measures, are not associated with outcomes after hip arthroscopy for FAIS. AAr is associated with worse preoperative status and less improvement at 2 years postoperatively, particularly in patients with relative femoral retroversion.
Keywords
Imaging findings increasingly have been assessed as potential determinants of clinical success after hip arthroscopy for femoroacetabular impingement syndrome (FAIS). The majority of imaging investigations have examined the effect of radiographic parameters—such as alpha angle, lateral center-edge angle (LCEA), Tönnis angle, and Tönnis grade—on patient-reported outcomes (PROs) and survivorship.4,9,43 However, FAIS is a 3-dimensional problem that may not be assessed adequately with 2-dimensional parameters on standard planar radiography.
Many patients with FAIS undergo computed tomography (CT) and/or magnetic resonance imaging (MRI), which provide a greater 3-dimensional understanding of femoral and acetabular morphology. Information derived from these modalities can aid in surgical planning, and CT- and MRI-based measurements like acetabular version (AV) and femoral version (FV) may even assist in determining which surgical procedures are performed (eg, hip arthroscopy vs periacetabular osteotomy). Relatedly, there has also been significant interest in the effect of AV, FV, and combined version (CV)—otherwise known as the McKibbin index, 54 and calculated as the sum of AV and FV—on PROs after hip arthroscopy for FAIS.
Previous studies have estimated the prevalence of version abnormalities in patients undergoing hip preservation surgery45,47,55; however, sparse data exist on the effects of version on clinical results, and systematic reviews examining the influence of abnormal AV and FV on hip arthroscopy outcomes have reported mixed findings.67,73,74 Even less data exist regarding the effect of CV.
The purpose of the present study was (1) to report the distributions of AV, FV, and CV in a large cohort of patients undergoing hip arthroscopy for FAIS and (2) to examine the relationship between deviations in version from normative values and PROs. We hypothesized that deviations in AV, but not FV or CV, would be associated with relatively worse clinical outcomes.
Methods
Patient Selection
This study was approved by the institutional review board to prospectively collect and retrospectively analyze clinical outcomes and imaging data from patients who underwent primary hip arthroscopy for FAIS by the senior author (S.J.N.) between January 2012 and April 2018. Included patients were required to have clinical and radiographic evidence of symptomatic FAIS, failed nonoperative management (eg, physical therapy, oral anti-inflammatory drugs, and/or intra-articular cortisone injections), a minimum 2-year postoperative follow-up, and CT imaging of the full pelvis and both femurs, including transcondylar slices of the femur at the level of the knee for FV assessment. Only patients with CT scans were included in the study because evidence has demonstrated that there may be significant differences between FV as measured on CT versus MRI,6,8,17,24,69 with CT demonstrating greater reliability. 6 Patients were excluded if they had evidence of Tönnis grade >1 osteoarthritis, developmental hip disorder (eg, Legg-Calvé-Perthes disease and slipped capital femoral epiphysis), or hip dysplasia more severe than borderline (LCEA <20°). Those who underwent revision hip arthroscopy or simultaneous gluteus medius and/or minimus repair were also excluded (Figure 1).

CONSORT (Consolidated Standards of Reporting Trials) patient selection flow diagram, with inclusion and exclusion criteria. CT, computed tomography; FAIS, femoroacetabular impingement syndrome; LCEA, lateral center-edge angle.
Quantification and Classification of AV, FV, and CV
CT-based AV and FV measurements were made by an orthopaedic surgeon and a trained biomedical engineer under the supervision of the senior author. Central AV measurements were made on a single transverse slice at the level of the femoral head center using a modified version of the method originally described by Visser et al.2,70-72,75 The femoral head center was identified by marking a best-fit circle around the femoral head on the coronal slice in which the diameter of the femoral head was the largest. On the corresponding axial slice, a baseline was made connecting the posterior aspects of the bilateral ischia, followed by a perpendicular line extending anteriorly. Another line was then made connecting the anterior and posterior margins of the acetabular rim. AV was measured as the angle between the 2 lines. AV was defined as positive if the lines intersected anteriorly and negative if they intersected posteriorly (Figure 2).
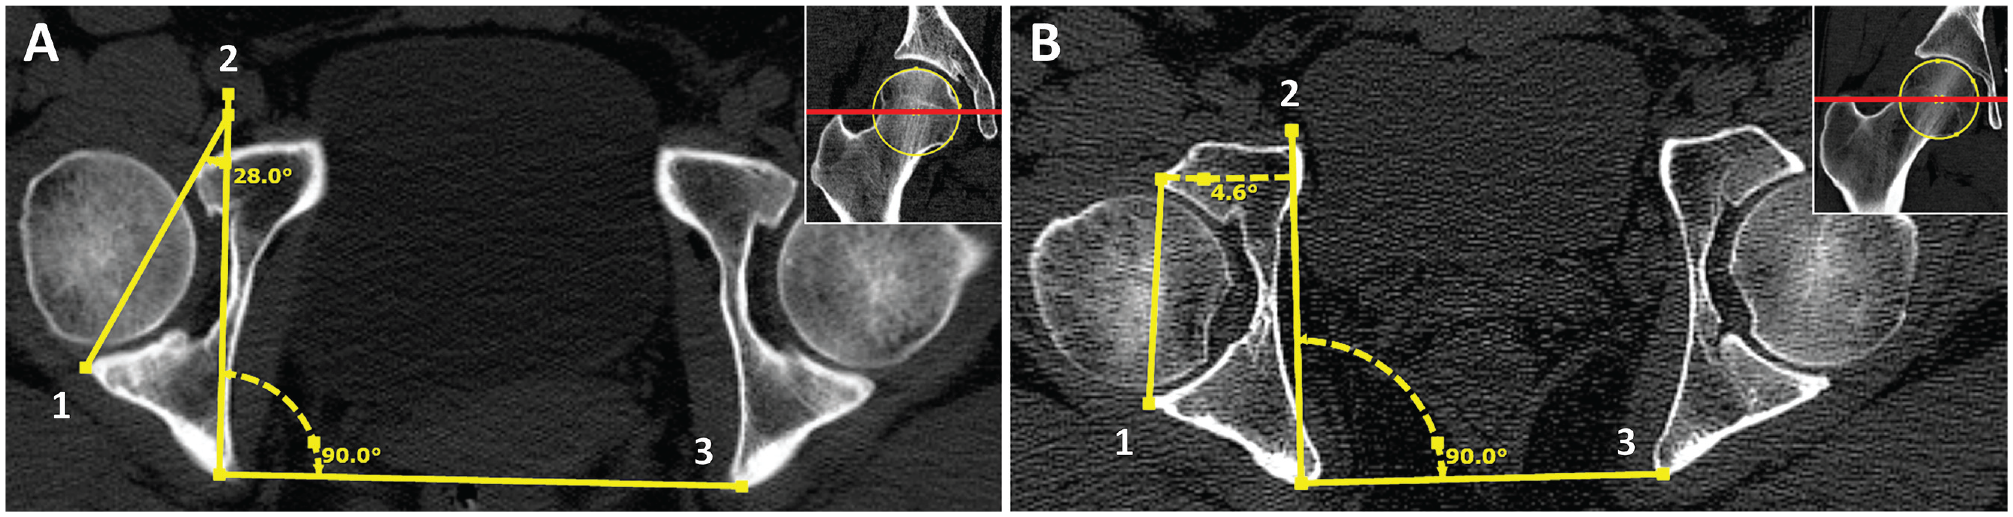
Pelvic computed tomography scans demonstrating (A) excessive acetabular anteversion and (B) relative acetabular retroversion. Central acetabular version was measured as the angle between (1) a line connecting the anterior and posterior margins of the acetabular rim and (2) a perpendicular line extending anteriorly from (3) a baseline connecting the posterior aspects of the bilateral ischia. Axial slices are at the level of the femoral head center (inset images).
FV was measured in the manner described by Hernandez et al, 30 who determined that the ideal slice on which to establish the femoral head-neck axis is the section through the femoral neck in which the superior border of the greater trochanter is included.7,35,42,65,66,68 Therefore, the most superior slice was chosen that best showed the femoral head, femoral neck, and greater trochanter. A second slice was selected in which the femoral condyles were most clearly visible, and the 2 images were superimposed on one another. The femoral head center was identified by marking a best-fit circle around the femoral head, and a line was drawn from the femoral head center through the center of the femoral neck. A second line, representing the posterior condylar axis, was drawn connecting the posterior aspect of each femoral condyle. FV was measured as the angle between these 2 lines. FV was defined as positive if the lines intersected laterally and negative if they intersected medially (Figure 3).
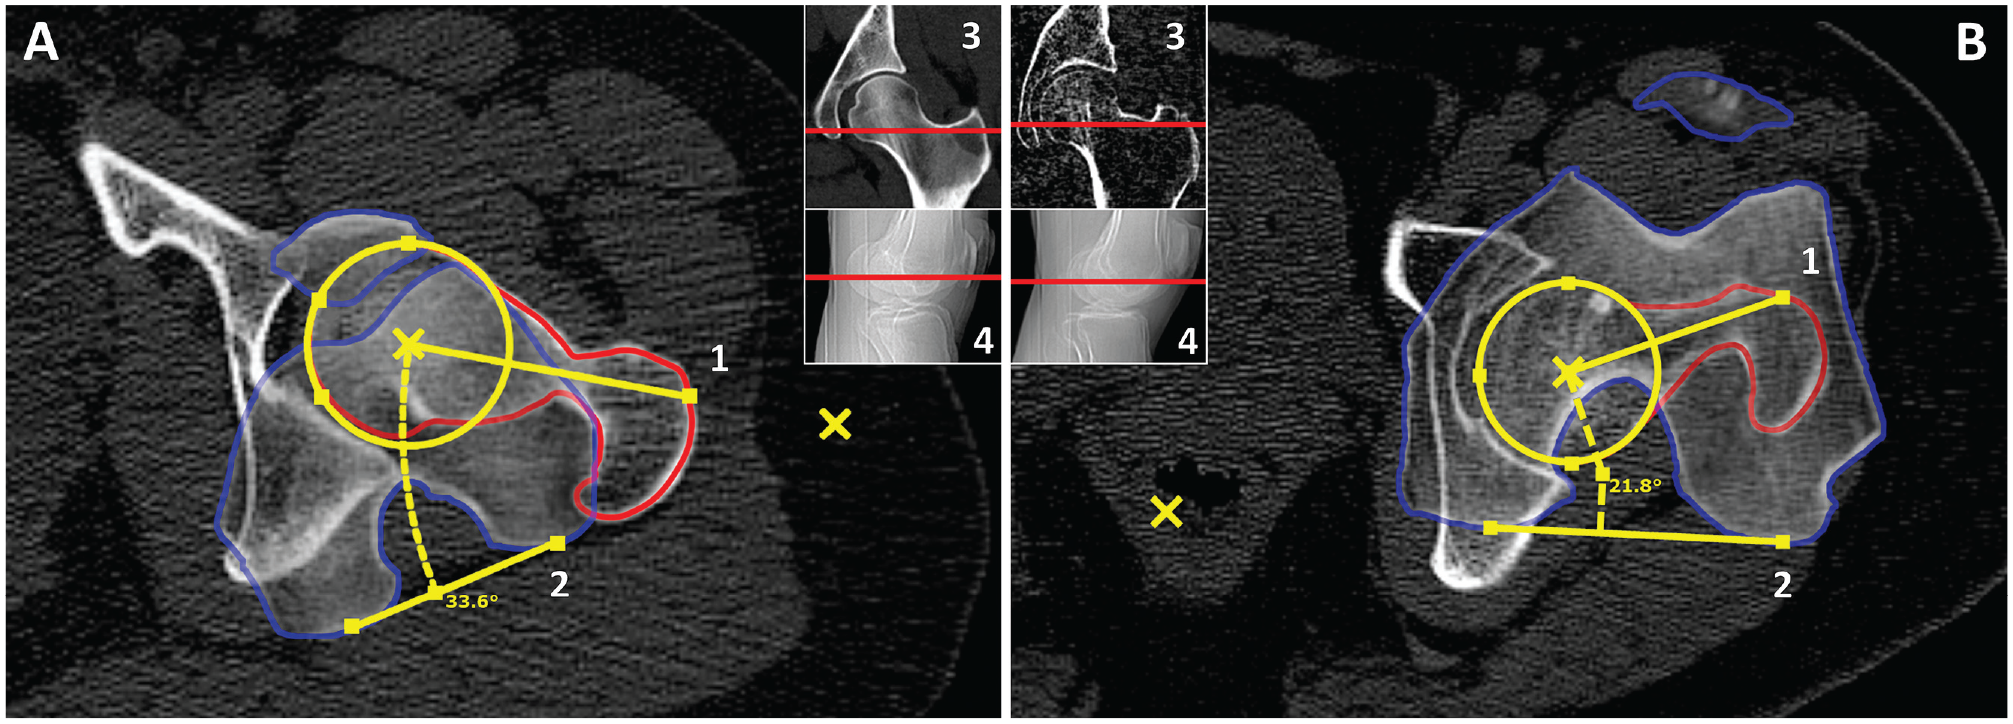
Pelvic computed tomography (CT) scans demonstrating (A) excessive femoral anteversion and (B) femoral retroversion. A section from the same CT scan in which the femoral condyles were clearly visible was superimposed on the section containing the femoral head and neck and greater trochanter. Femoral version was measured as the angle between (1) a line passing through the centers of both the femoral head and the femoral neck and (2) a line connecting the posterior aspect of each femoral condyle. The insets show the levels of the (3) hip and (4) knee slices.
CV was calculated as the sum of AV and FV.20,45,47,54,62,70 The absolute definitions of version utilized throughout the paper are noted in Table 1. The normal ranges for AV and FV were based on the published literature, ‡ and the upper and lower limits of normal for CV were defined as the sum of these limits for AV and FV.45,70 The normal ranges for AV and FV described above also best correspond to the means and standard deviations found not only in the present patient cohort but also in published studies that utilized the same measurement techniques. §
Version Definitions and Cutoffs a

The term “relative” denotes relative to the mean, with values below the mean considered relative retroversion and values above the mean considered relative anteversion. The cutoff values used to define the relative ranges represent the mean of each version measurement among the full cohort (N = 566).
Patient-Reported Outcomes
PROs were assessed preoperatively and at a minimum of 2 years postoperatively using secure electronic data collection platforms (OBERD; PatientIQ). PRO measures included the Hip Outcome Score Activities of Daily Living (HOS-ADL) and Sports-Specific (HOS-SS) subscales,51-53 modified Harris Hip Score (mHHS),11,26 12-item international Hip Outcome Tool (iHOT-12),23,58 and visual analog scale for pain (VAS pain).
Surgical Technique
All hip arthroscopies were performed by a single fellowship-trained hip surgeon (S.J.N.) using published techniques.22,25 In short, the interportal portion of a T-capsulotomy was first created to establish access to the central compartment. With access established, acetabuloplasty, chondral lesion debridement to stable margins, and labral debridement or repair—depending on the labral condition—were performed as appropriate. The vertical portion of the T-capsulotomy was then created for treatment of cam deformity. Cam resection was performed to address abnormal femoral bony morphology, followed by dynamic examination under direct arthroscopic visualization and fluoroscopic guidance to confirm complete resection of bony impingement. Both the vertical and the horizontal limbs of the T-capsulotomy were repaired using a suture-shuttling device, starting at the base of the vertical portion. Rehabilitation was performed as previously described. 48 Because the current study was retrospective, changes in surgical management based on AV, FV, or CV were not investigated as an intervention, and all patients underwent the same treatment.
Statistical Analysis
Continuous variables are reported as mean ± standard deviation. Categorical variables are reported as percentages.
Published normal ranges were used to visualize the distribution of AV, FV, and CV within our cohort. However, the relationships between version measurements and PROs were analyzed based on a given measurement's distance from a normative value, defined in this case as the mean of that measurement within the study population. For outcome analyses, measurements were therefore defined as relative retroversion if below the mean and relative anteversion if above the mean, with the relative nature of these definitions denoted by a lowercase “r” (Table 1).
Outcomes were analyzed relative to normative values due to the heterogeneity of measurement methods and normal ranges for AV and FV described in the literature. The reported upper and lower limits of normal for central (equatorial) AV range from 6° to 15° and 20° to 32°, respectively, ‖ with some studies describing anything >0° as nonpathological. 34 Many studies do not describe a normal range but rather a single cutoff value, ranging from 8° to 15°, that divides anteverted (above) from retroverted (below) acetabula.12,14,16,28,29,38,46,63 The reported upper and lower limits of normal for FV range from −2° to 10° and 14° to 25°, respectively, ¶ and reported cutoff values range from 10° to 25°.19,39,50,67 Furthermore, different FV measurement methods can lead to significantly different results within the same study population, with studies reporting differences as high as 11° to 17.6° based strictly on landmark selection.7,35,65,66,68
The relationships between AV, FV, and CV and each PRO measure (HOS-ADL, HOS-SS, mHHS, iHOT-12, and VAS pain at both the preoperative and 2-year postoperative time points) were initially assessed using univariate natural (restricted) cubic regression splines with a single interior knot at the mean of the version measurement in question to examine the association between each measurement's distance from the mean and patients’ pain and functionality while accounting for potential nonlinearity. Multiple linear regression was then utilized to assess the independent relationship between each version measurement and PROs while controlling for the other 2 version measurements as covariates. The absolute values of the distances of AV, FV, and CV from their respective means were utilized as independent variables, and each PRO measure was used as the dependent variable. Six multiple linear regression models were calculated for each PRO measure at each time point: one each to examine independently the association between relative acetabular anteversion (AAr), relative acetabular retroversion (ARr), relative femoral anteversion (FAr), relative femoral retroversion (FRr), relative combined anteversion (CAr), and relative combined retroversion (CRr) and PROs with the other 2 measurements held constant. Based on the results of these multiple linear regression models, a subanalysis was performed examining 4 subgroups: AAr + FAr, AAr + FRr, ARr + FAr, and ARr + FRr.
Normality was assessed with skewness and kurtosis, with absolute skew >2 and/or absolute kurtosis >7 indicating nonnormality. 76 The strength of the association between AV and FV versus CV was assessed using the Pearson correlation coefficient (Pearson r), as was the relationship between AV and LCEA. Preoperative and 2-year postoperative PROs were compared with 2-sided paired-samples t tests. In the multiple linear regression models, the direct relationship between version measurements and PROs was assessed using the unstandardized (B) coefficient. The relative strength of the association between version measurements and PROs was assessed with the standardized (β) coefficient. Effect size was assessed with Cohen f2, with 0.02, 0.15, and 0.35 representing small, medium, and large effect sizes, respectively. 15 Multicollinearity was assessed with the variance inflation factor (VIF), with a VIF of 1 indicating no correlation between independent variables and a VIF >5 indicating significant multicollinearity.33,57
Statistical significance was determined by an a priori alpha level of .05. All statistical analyses were performed using SPSS Version 28.0 (IBM Corp) and R statistical software Version 4.2.2 (R Foundation for Statistical Computing). 60
Results
Patient and Surgical Characteristics
A total of 566 patients were included in the study (66.4% female; mean age, 32.6 ± 11.9 years; mean body mass index, 25.2 ± 5.1) (Table 2). The mean duration of clinical follow-up was 28.0 months. All patients underwent femoroplasty and capsular plication, 97.0% underwent labral repair and synovectomy, and 95.2% underwent acetabuloplasty. Although every patient did not undergo the exact same set of surgical procedures, when patients were divided into retroversion, normal version, and anteversion groups based on published ranges of AV, FV, and CV, there were no significant differences in operative procedures performed (P≥ .109). The proportion of patients who underwent each surgical procedure was also similar between relative version groups (P≥ .198) (Appendix Table A1, available in the online version of this article).
Preoperative Characteristics Among Full Cohort a

Mean values are presented as mean ± SD. BMI, body mass index.
Radiographic Parameters
The mean preoperative Dunn lateral alpha angle, LCEA, and Tönnis angle (acetabular index) were 61.0°± 12.3°, 31.6°± 6.2°, and 6.3°± 4.4°, respectively. The majority of patients (74.6%) demonstrated cam morphology, defined as an alpha angle >50°. Borderline acetabular dysplasia (LCEA 20°-24.9°) was found in 14.2% of patients, normal LCEA (25°-39.9°) in 77.2%, and pincer morphology (LCEA ≥40°) in 8.7%. Tönnis grade 0 was seen in 94.4% of patients (Appendix Table A3, available online).
When patients were divided into AV, FV, and CV groups based on published ranges, the mean LCEA was significantly lower in patients with AA compared with those with AR (AA: 29.5°± 7.0° vs AR: 31.6°± 6.1°; P = .003). There was no significant difference in the overall distribution of patients with borderline acetabular dysplasia, normal LCEA, and pincer impingement (P = .096); however, when looking at each LCEA group independently, there were significantly more patients with borderline dysplasia among the AA group than among the AR group (AA: 26.2% vs AR: 4.9%; P = .022). Comparisons between relative version groups demonstrated similar findings (LCEA: 30.6°± 5.9° [AAr] vs 32.6°± 6.2° [ARr], P < .001; borderline dysplasia: 18.1% [AAr] vs 10.3% [ARr], P = .010).
CT-Based Version Assessments
The mean values for AV, FV, and CV were 17.1°± 5.2° (range, 2.6° to 31.2°), 12.1°± 9.2° (range, –37.9° to 38.8°), and 29.3°± 11° (range, –10.7° to 64.6°), respectively. AV, FV, and CV were normally distributed. NAV was seen in 84.3% of patients, NFV in 61.1%, and NCV in 84.6%. The distribution of AV + FV + CV subgroups is summarized in Figure 4 (additional information can be found in Appendix Table A3, available online).
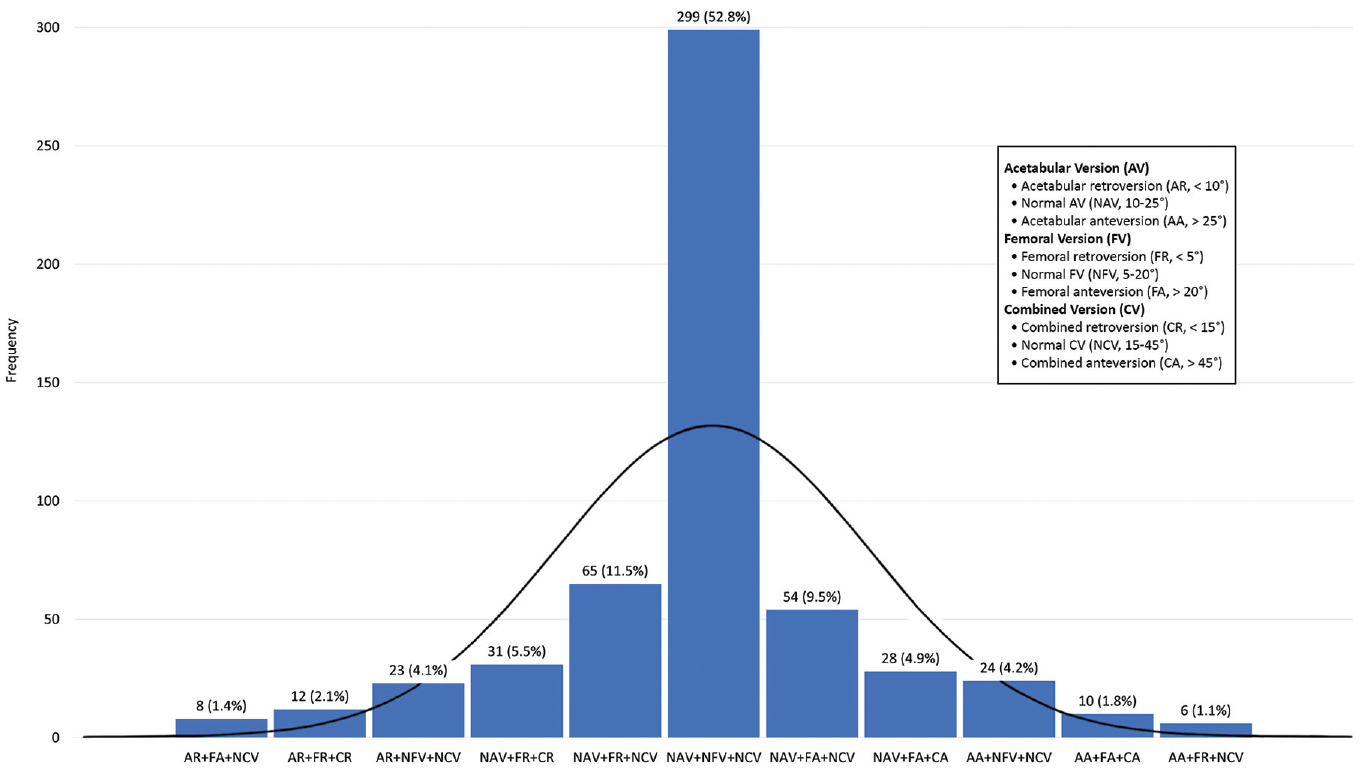
The distribution of combined version (CV; McKibbin index) subgroups with prevalence >1%. The subgroups were based on patients’ acetabular version (AV), femoral version (FV), and CV measurements, in that order, using published normal ranges. The black line represents a normal curve for the sample. Values are number of patients and frequency.
The association between FV and CV (r = 0.880) was stronger than the association between AV and CV (r = 0.554) (Figure 5). AV demonstrated a significant negative correlation with LCEA (r = −0.174; P < .001).
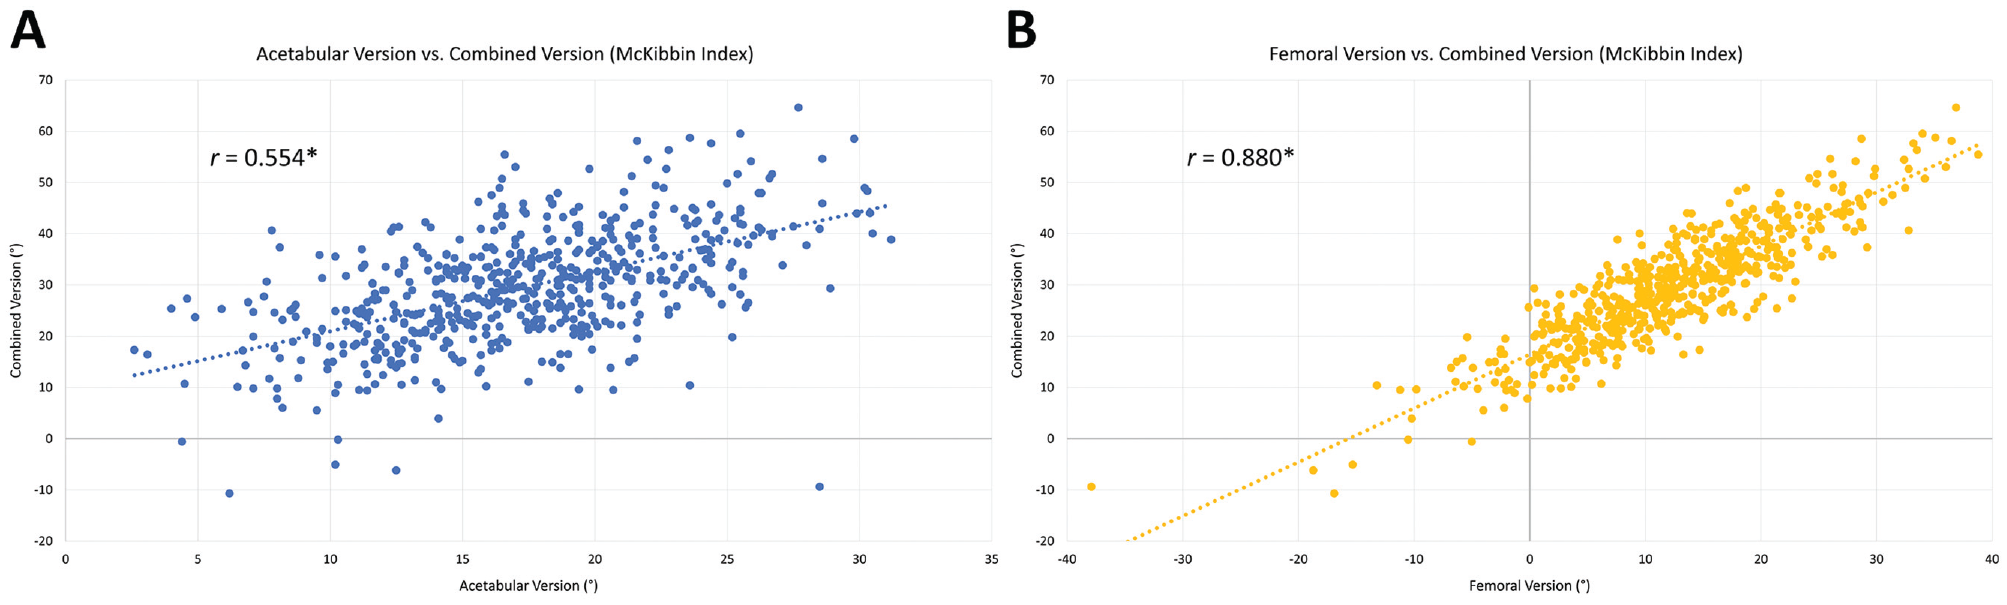
Correlations between (A) acetabular and (B) femoral version and combined version (McKibbin index). r represents the Pearson correlation coefficient. *Significant at P < .001.
Patient-Reported Outcomes
PRO scores were normally distributed both preoperatively and at 2 years postoperatively. Two-year postoperative PRO scores were significantly higher than preoperative scores for all PRO measures, regardless of version measurement (P < .001 for all PRO measures across all version groups, both based on published ranges and relative to the mean) (Appendix Table A7, available online).
Univariate natural cubic regression splines demonstrated that AAr had a significant negative association with all PROs both preoperatively and at 2 years postoperatively (P≤ .018) (Figure 6) except preoperative iHOT-12 and 2-year postoperative iHOT-12 and HOS-SS scores (P≥ .098). All other relative version groups did not have a significant relationship with any PRO at either time point (P > .05). The association between AAr and relatively worse PROs was maintained after controlling for FV and CV relative to the mean via multiple linear regression, with AAr demonstrating a significant negative association with all PROs (P≤ .043) except preoperative HOS-SS and iHOT-12 and 2-year postoperative HOS-SS scores (P≥ .083) (Table 3). This pattern of significance was maintained after further controlling for age and sex, which were found to differ between relative AV groups (Appendix Table A6, available online). AAr had an unstandardized (B) coefficient with an absolute value ≥1 for most of the PRO measures with which it had a significant relationship, meaning that for every 1° increase in AV, PRO scores would be expected to decrease (or increase, in the case of VAS pain) by ≥1 points.
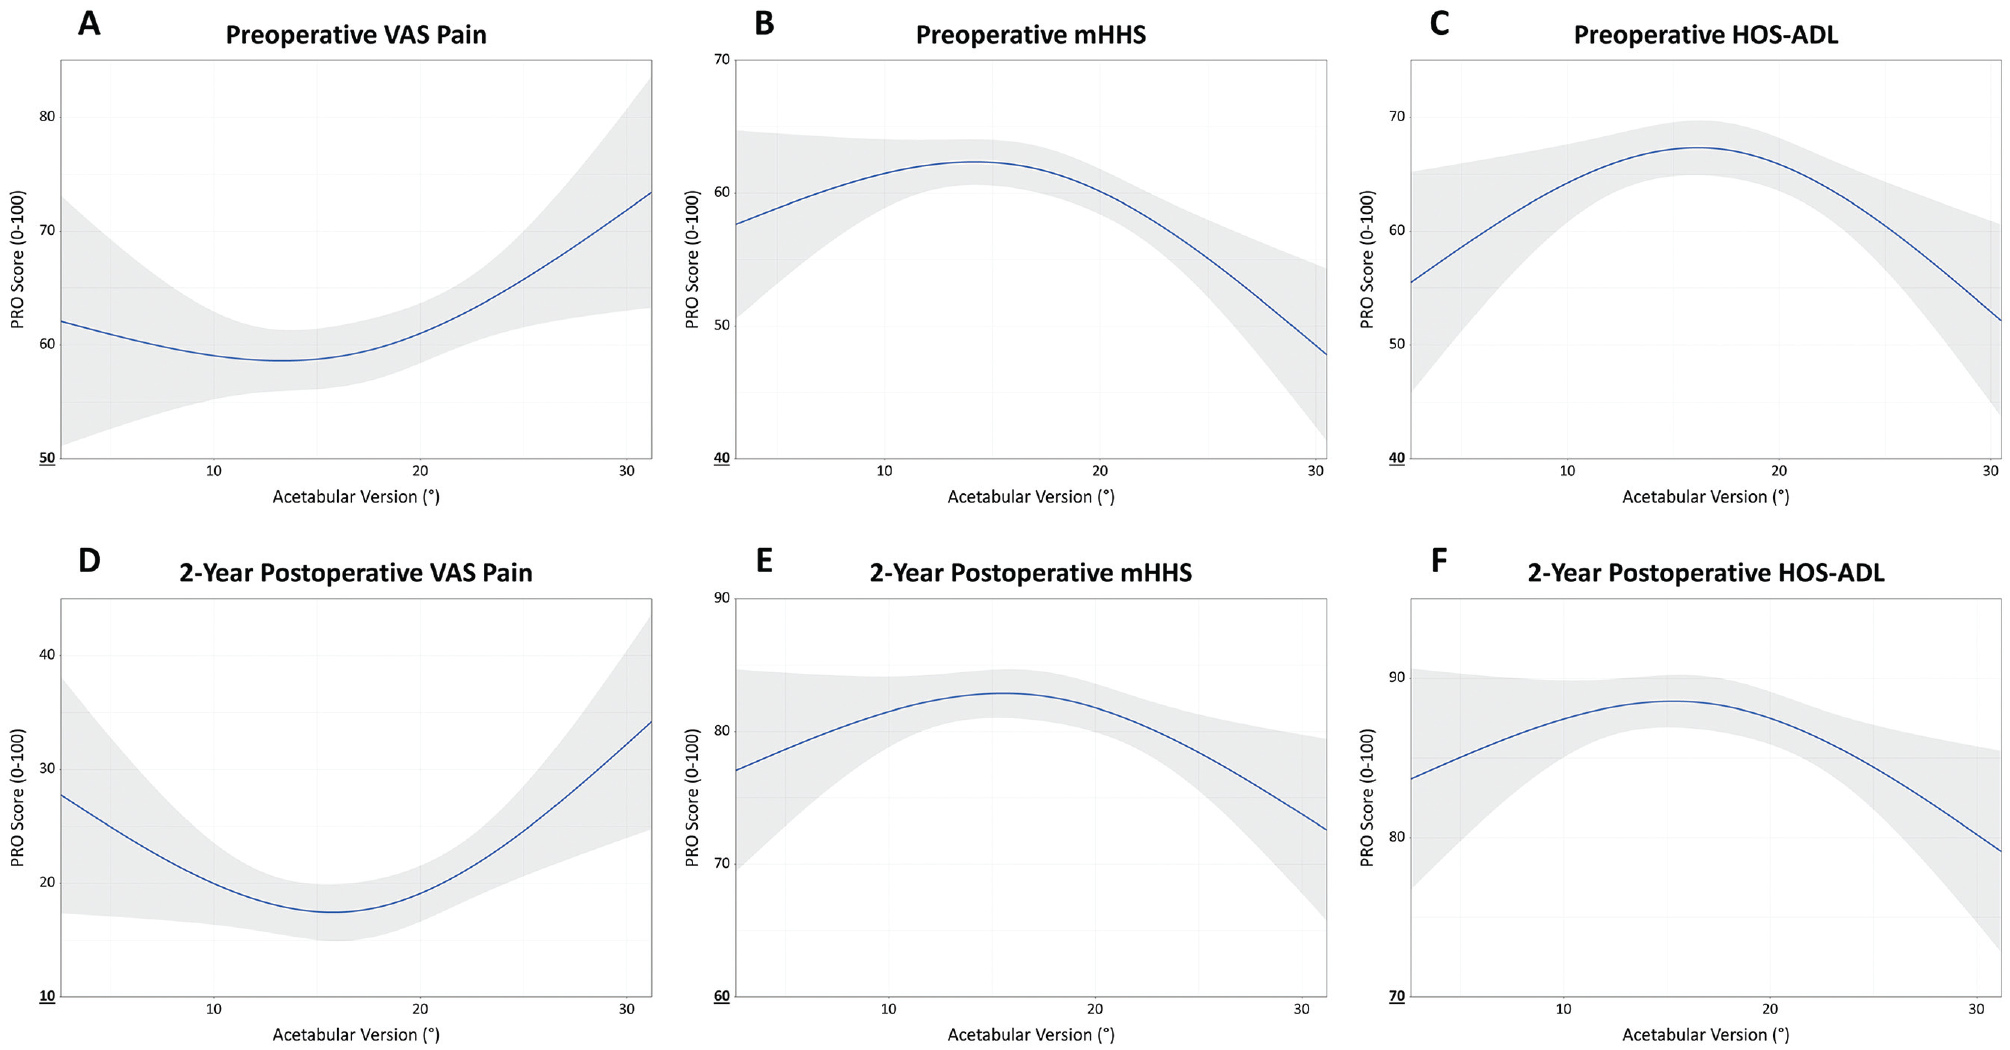
Univariate natural (restricted) cubic splines demonstrating the relationship between acetabular version and (A-C) preoperative and (D-F) 2-year postoperative patient-reported outcome (PRO) scores. HOS-ADL, Hip Outcome Score Activities of Daily Living subscale; mHHS, modified Harris Hip Score; VAS Pain, visual analog scale for pain.
Results of Multiple Linear Regression Models Assessing the Relationship Between Relative Acetabular Anteversion and Patient-Reported Outcomes While Controlling for Relative Femoral and Combined Version a

“Relative” indicates version measurements relative to the mean. ADL, Activities of Daily Living subscale; HOS, Hip Outcome Score; iHOT-12, 12-item international Hip Outcome Tool; mHHS, modified Harris Hip Score; PRO, patient-reported outcome; SS, Sports-Specific subscale; VAS pain, visual analog scale for pain.
Significant at P < .05.
Small to moderate effect size (between 0.02 and 0.15).
No significant associations were found when examining patients with ARr or FAr using multiple linear regression (P > .05). Among patients with FRr, relative FV was not found to be a significant predictor of outcomes; rather, relative AV was found to be a significant negative predictor for preoperative VAS pain, mHHS, and HOS-ADL scores and 2-year postoperative VAS pain and mHHS scores (P≤ .044). Relative AV was likewise found to be a significant negative predictor of outcomes among both patients with CAr and patients with CRr, albeit to a lesser degree than among patients with FRr. Across all linear regression models, relative FV and CV were only found to be significant negative predictors on 2 occasions. The VIF was ≤3.817 for all regression analyses, indicating no significant multicollinearity.
Subgroup Analysis
On subgroup analysis, relative AV was only found to have a significant relationship with PROs among patients with coexisting FRr. In patients with FRr, concomitant AAr had a significant negative association with preoperative mHHS and HOS-ADL scores and 2-year postoperative VAS pain, mHHS, and iHOT-12 scores (P≤ .017). Interestingly, ARr was also found to have a significant negative association with PROs in patients with FRr—preoperative HOS-ADL and 2-year postoperative HOS-ADL and HOS-SS scores (P≤ .045)—although it demonstrated a significant relationship with fewer PRO measures than AAr did.
Discussion
The most important findings from the present study were that (1) patients improved significantly from preoperatively to 2 years postoperatively regardless of version group; (2) neither FV nor CV, as a distinct measure, is associated with PROs after hip arthroscopy for FAIS; (3) FV has a greater effect on CV than AV does; (4) acetabular anteversion relative to the mean is associated with both worse baseline status preoperatively and less improvement at 2 years postoperatively, particularly among patients with coexisting FRr; and (5) ARr does not appear to have a substantial relationship with clinical outcomes, except perhaps in patients with concomitant FRr, in whom it may demonstrate a mild negative association.
Hip arthroscopy for FAIS has previously been shown to demonstrate excellent outcomes at short-, medium-, and long-term follow-up. A 2019 study by Beck et al 5 examining postoperative outcomes among 976 patients at a minimum 2-year follow-up found significant pre- to postoperative improvement in all PROs, and a 2020 study by Nwachukwu et al 59 reported significant improvement across all PRO measures in a cohort of 283 patients at 1, 2, and 5 years postoperatively. In a recent 2024 study, Allahabadi et al 1 demonstrated that these significant improvements were enduring up to 10 years postoperatively among a cohort of 94 patients who underwent hip arthroscopy for FAIS with contemporary techniques, including chondrolabral refixation, osteochondroplasty, and routine capsular closure. The present study reaffirms these studies’ findings, with patients reporting significant improvement in all PROs between the preoperative and 2-year postoperative time points, even in the setting of different anatomic variations of the hip.
Previous studies have examined the effect of CV, also known as the McKibbin index, on clinical outcomes after hip arthroscopy for FAIS. Fabricant et al 20 studied the effects of FV and CV on short-term outcomes in 243 patients and found no relationship between CV and postoperative PROs, although they did find that patients with FR demonstrated significantly less improvement compared with patients with NFV. A later study by Ramkumar et al 61 used machine learning to investigate the relationship between radiographic indices and short-term postoperative PROs in 1735 patients, finding that neither FV nor CV was predictive of 1-year or 2-year clinical results. The present study builds on these previous studies as the first, to our knowledge, evaluating the independent relationships between AV, FV, and CV and postoperative outcomes after hip arthroscopy for FAIS while controlling for the other 2 version measurements as covariates via multiple linear regression. It is also the first, to our knowledge, to examine the effect of the interaction between AV and FV on outcomes via subgroup analyses, as opposed to evaluating just their sum (CV) as a standalone measure.
Similar to previous studies, the current study found that neither FV nor CV was independently associated with PROs after hip arthroscopy for FAIS. One reason most studies have found no relationship between FV and outcomes may be that FV does not act independently. While isolated FV deviations were not significantly associated with PROs in the present study, only patients with FRr were affected by AV deviations, particularly AAr, whereas those with FAr were not. The complexity of these relationships underscores the importance of looking beyond CV when assessing the influence of version on postoperative outcomes. For example, a patient with FRr and AAr would likely have NCV, so the synergistic effect of their FV and AV abnormalities may be overlooked if one were to examine the effect of CV in isolation. The current study also demonstrates that CV is more substantially a reflection of FV (r = 0.880) than a balanced reflection of AV (r = 0.554) and FV, likely because of the greater variability in FV than AV. Consequently, the effect of CV on clinical results—or the lack thereof—may predominantly reflect the influence of FV, which has demonstrated inconsistent relationships with postoperative outcomes.20,21,27,61,67,73,74
The dependence of FV on other morphological factors to affect clinical results is consistent with previous investigations, such as those by Chaharbakhshi et al 13 and Marland et al, 50 which found that patients with borderline acetabular dysplasia (LCEA 18°-25°) and coexisting FA (FV >20°) had worse postoperative outcomes than those with normal acetabular coverage (LCEA >25°). These studies reinforce the idea that the effect of FV on outcomes after hip arthroscopy for FAIS may be neither straightforward nor independent; rather, FV may contribute to a more complex relationship with clinical outcomes that also includes AV and LCEA, among other potential morphological factors. In fact, AV and LCEA may act similarly in this regard by reducing acetabular coverage, with the current study even finding an inverse relationship between the 2 measurements. Accordingly, more research is required to elucidate the nature of these various relationships and how this greater understanding may be used to improve outcomes.
Another way the present study builds on previous research is the unique manner in which the analyses were performed. The use of normative values derived from the study population eliminated the potential confounding effects of differences between the present study's patient cohort and patient cohorts found in the published literature, including differences in measurement methods. Furthermore, by analyzing outcomes based on a measurement's distance from the mean, rather than dividing the present cohort into normal and abnormal, the current study was able to assess the effect of FV, CV, and AV across the full range of measurements, even among patients who would otherwise be considered normal. Evaluation of absolute measurements would have identified few differences between groups and missed important findings regarding the deleterious effect of deviations from normative values on clinical results (Appendix Tables A4 and A5, available online).
Using this strategy, we found acetabular anteversion relative to the mean to be predictive of poorer PROs, both preoperatively and postoperatively, with a dose-response relationship between increasingly large deviations and increasingly worse PROs. Interestingly, relatively few studies have examined the relationship between AV and PROs in patients undergoing hip arthroscopy for FAIS, 74 and more prospective studies are needed that evaluate the effect of acetabular orientation on clinical outcomes. Of the existing studies, all have evaluated AR 74 ; the present study is the first, to our knowledge, evaluating how AAr may affect PROs. In the current study, AAr was an independent negative predictor of both preoperative and 2-year postoperative PROs, even after controlling for FV and CV abnormalities. To provide an example illustrating the magnitude of AAr's association, this study identified an unstandardized (B) coefficient of −1.341 for preoperative mHHS, meaning that a patient with an AV of 24°—approximately 7° above the mean but still within the normal range of 10° to 25°—would be expected to have a preoperative mHHS score 9.21 points lower than if they had a mean AV, or a decrease of well over one-half a standard deviation (14.12). This effect appeared to be most pronounced in patients with coexisting FRr, even though concomitant femoral retroversion traditionally has been thought to compensate for excessive acetabular anteversion. On the other hand, ARr did not appear to have a substantial influence on PROs, except perhaps in patients with FRr. One reason for the detrimental effect of AAr on clinical outcomes may be that higher degrees of anteversion result in loss of anterior femoral head coverage and/or microinstability, which can lead to abnormal joint contact forces and excessive pressure on the articular cartilage and labrum.
The present study contributes to the literature in several ways. It is the first to investigate how deviations in version measurements from normative values—not just absolute values of AV, FV, and CV, often arbitrarily divided into groups—may affect clinical outcomes after hip arthroscopy for FAIS. More importantly, it is the first to report a relationship between AAr and relatively worse PROs. Beyond the influence of version measurements on postoperative results, the current study also presents the largest patient cohort among studies examining the distributions of AV, FV, and/or CV in patients undergoing hip preservation surgery, demonstrating that AV, FV, CV, and combinations thereof were all normally distributed among 566 patients undergoing hip arthroscopy for FAIS.
Other, smaller studies have described the distributions of version measurements in patients who underwent hip preservation surgery. Lerch et al 45 examined 333 symptomatic patients with hip pain and FAIS and found that 72% had a normal McKibbin index (CV), defining NAV and NFV as 10° to 25° and NCV as 20° to 50°. This proportion of patients with a normal McKibbin index is less than the present study's finding of 84.6% of patients with NCV. A different study by Lerch et al 47 that included 538 hips found that 32% had both NAV and NFV, again defining each as 10° to 25°, whereas the current study found that 52.8% of patients fell into this group. One reason for these differences may be that the present study defined NFV as 5° to 20°, rather than the more conservative 10° to 25° used by Lerch et al. Additionally, the current study excluded patients with dysplasia more severe than borderline, who may have had more substantial version abnormalities, particularly of the femur. 56 The literature clearly displays wide variability in the way version abnormalities are defined. # One benefit of the version cutoffs used in the present study is that they resulted in a normal distribution of version measurements, as well as subgroups thereof. Use of these cutoff values, therefore, may make data analysis and interpretation easier in future studies that rely on dividing their cohort into discrete groups.
Approximately 2 of 5 of patients had abnormal FV in the current study, and approximately 1 of 6 had abnormal AV, which is somewhat less than the proportions reported in previous literature. A recent systematic review and meta-analysis by Arshad et al 3 found that about one-half of hips with symptomatic FAIS have an FV abnormality, and about one-third have an AV abnormality. This may, again, be at least partially attributable to differences in the way normal FV was defined (5°-20° in the present study vs 10° to 25° in this meta-analysis). Additionally, the current study had a high proportion of patients with cam morphology (74.6%), defined as an alpha angle >50°, compared with pincer morphology due to severe acetabular overcoverage (8.7%), defined as an LCEA ≥40°, which has been shown to have differential effects on AV and FV.3,55,64
Given the outsized influence of FV measurements on CV measurements and the complex relationship between version measurements and postoperative outcomes, including the synergistic effect of AV and FV abnormalities, it appears that CV by itself may not accurately depict underlying femoroacetabular bony morphology or clearly predict clinical outcomes after hip arthroscopy for FAIS. Consequently, we advise caution in using CV as a measure in isolation without considering AV and FV individually.
Limitations
Several limitations exist in the present study. First, the definitions of normal version were based on a review of the literature. However, not all previous studies used the same cutoff values, so comparisons to other studies with different definitions of normal version may be limited. For this reason, among others, the present study examined the relationships between clinical outcomes and deviations in version measurements from their respective means within the study population. Nevertheless, the current study's cohort may not necessarily accurately represent other patient populations. The present study only examined patients undergoing hip arthroscopy for FAIS, so the version distributions described in this paper may not be applicable to patients with asymptomatic FAIS or those without any identifiable hip pathology. There was some variation between individual patients in the exact surgical procedures performed; however, when patients were divided into retroversion, normal version, and anteversion groups based on AV, FV, and CV, there were no statistically significant between-group differences, nor were there significant differences between relative version groups. The present study excluded patients with dysplasia more severe than borderline, defined as LCEA <20°. While this decision reduced confounding, the results may not be representative of patients with more abnormal hip morphology. Finally, PROs were only evaluated preoperatively and at short-term follow-up, and the relationships between version and other clinical findings, such as range of motion, 40 return to sport/function, and failure rates, were not evaluated. Longer-term studies examining the effect of version on PROs, as well as studies examining the influence of version on other clinical results, are needed.
Conclusion
FV has a greater effect on CV than does AV, and both FV and CV as distinct measures are not associated with clinical outcomes after hip arthroscopy for FAIS. Acetabular anteversion relative to normative values is a predictor of worse preoperative status and less improvement at 2 years postoperatively, particularly in patients with FRr. ARr does not appear to have a substantial relationship with clinical results, except perhaps a mild negative association in patients with FRr.
Supplemental Material
sj-pdf-1-ajs-10.1177_03635465241303704 – Supplemental material for Exploring the Relationship Between Combined, Acetabular, and Femoral Version on Postoperative Outcomes 2 Years After Hip Arthroscopy for Femoroacetabular Impingement Syndrome
Supplemental material, sj-pdf-1-ajs-10.1177_03635465241303704 for Exploring the Relationship Between Combined, Acetabular, and Femoral Version on Postoperative Outcomes 2 Years After Hip Arthroscopy for Femoroacetabular Impingement Syndrome by Jordan H. Larson, Sachin Allahabadi, Daniel Kaplan, Reagan Chapman, Omair Kazi, Christopher M. Brusalis and Shane J. Nho in The American Journal of Sports Medicine
Footnotes
Submitted March 1, 2023; accepted May 17, 2024.
One or more of the authors has declared the following potential conflict of interest or source of funding: S.A. has received support for education from Smith & Nephew. C.M.B. has received support for education from Smith & Nephew and hospitality payments from Exactech. S.J.N. has received research support from AlloSource, Arthrex Inc, Athletico, DJ Orthopedics, Linvatec, Miomed, Smith & Nephew, and Stryker; consulting fees from Ossur and Styker; and royalties from Ossur. AOSSM checks author disclosures against the Open Payments Database (OPD). AOSSM has not conducted an independent investigation on the OPD and disclaims any liability or responsibility relating thereto.
Notes
References
Supplementary Material
Please find the following supplemental material available below.
For Open Access articles published under a Creative Commons License, all supplemental material carries the same license as the article it is associated with.
For non-Open Access articles published, all supplemental material carries a non-exclusive license, and permission requests for re-use of supplemental material or any part of supplemental material shall be sent directly to the copyright owner as specified in the copyright notice associated with the article.