
Abstract
Background:
Countermovement jump (CMJ) analyses can predict ulnar collateral ligament (UCL) injuries in professional baseball pitchers, yet a biomechanical determinant linking CMJ analytics to UCL sprains is unknown.
Purpose/Hypothesis:
The purpose of this study was to evaluate CMJ parameters in collegiate pitchers with high and low elbow varus torque (EVT) and investigate multilinear regression relationships between CMJ and EVT kinetics. It was hypothesized that pitchers with greater EVT would have greater CMJ measures, and CMJ kinetics would explain the variance in EVT kinetics.
Study Design:
Descriptive laboratory study.
Methods:
Analyses of 19 Division I collegiate baseball pitchers (age, 19.9 ± 1.5 years; body height, 1.87 ± 0.08 m; body mass, 90.0 ± 13.4 kg) were performed with integrated ball release speed, 3-dimensional motion capture, and ground reaction force (GRF) technology. A 1-way between-participant analysis of variance was used to compare CMJ and ball velocity metrics, while Pearson correlations (r) were used to evaluate the association between EVT and CMJ kinetic variables. An alpha level of .05 indicated statistical significance for all tests that included effect size calculations (η2) for mean differences.
Results:
The EVT rate of torque development (EVTRTD) was significantly greater in pitchers with a higher EVT (high EVT: 605 ± 74 vs low EVT: 353 ± 103 N·m·s−1; P < .001; η2 = 0.41). CMJ data were similar between groups, yet correlation models indicated that changes in peak CMJ GRF (r = 0.60, P < .001) and power (r = 0.53, P < .05) can explain variance in EVTRTD.
Conclusion:
Compared with absolute EVT, CMJ kinetics were more associated with the rate of EVT in collegiate pitchers.
Clinical Relevance:
Therefore, as it relates to injury surveillance, identifying pitchers who display increases in peak GRF, concentric impulse, and peak CMJ power may provide early detection in protecting athletes from elbow valgus overload.
Relating to future performance projections in Major League Baseball (MLB), an interesting parallel has emerged between injury risk in 4-year collegiate pitchers and draft projectability, as future wins above replacement (WAR) projections are the worst in 4-year collegiate pitchers compared with all other positional designations and educational categorizations (junior college and high school). 2
One may speculate that the reduced value returned to MLB teams on signing bonuses paid to 4-year collegiate pitchers may be the result of surgical survivorship. The survivorship of primary ulnar collateral ligament repair (UCLR) is <5 years, with less desired outcomes for revision surgeries (secondary UCLRs), which may implicate the lack of WAR from 4-year collegiate pitchers due to the inability to maintain performance upon reaching the MLB level. 3 This statistic is further supported by the fact that 86% of MLB pitchers experienced their UCLR as professional pitchers, while only 14% of pitchers in the MLB had UCLR as amateurs, indicating a lower prevalence of pitchers with UCLR making it through the competitive ranks of professional baseball. 3 Recent epidemiological research has demonstrated that among amateurs, approximately 5 pitchers in every 100 require UCL surgery. 22 Given that there are 16 million baseball players across all competitive levels in the United States, and estimating that 40% of the rosters are pitchers, an estimated >345,000 throwing arm surgeries occur annually.22,24 A rough financial estimate of the annual economic burden per year for medical care and rehabilitation for throwing arm surgery is $30,000 per athlete. The total economic burden of throwing arm surgeries in the United States equates to >$10 billion spent nationally per annum at the amateur level.22,24 Because of the economy of this epidemic, science has advanced medical procedures at a much greater rate than preventing surgery, and therefore a greater effort should be focused on surveillance approaches that can be initiated without cost, expertise, or time-based barriers.
Recent evidence suggests that ulnar collateral ligament (UCL) injuries of the elbow in baseball pitchers can be predicted by countermovement jump (CMJ) properties such as how athletes’ eccentrically load, produce peak CMJ force, and impart concentric impulse to jump as high as possible. 15 These key metrics are evaluated noninvasively with force plates, and as it relates to applied sports performance, force plate usage in strength and conditioning practice presents a more universal technology-integrated environment compared with biomechanics laboratories offering services to the athletic community. Through force plate analyses, coaches are capable of prescribing training based on ground reaction force (GRF) signatures to remediate loading that includes transitional or explosive jump properties, yet the question remains of whether force plate data can truly be associated with UCL injury risk by presenting a biomechanical connection to elbow valgus overload in the pitching delivery. The purpose of this study was to present a biomechanical link between medial elbow loading in collegiate pitchers and their jump characteristics captured through force plate analyses. We hypothesized that a positive association would be found between jump kinetics and elbow varus torque (EVT) to indicate a mechanistic connection that substantiates previous work describing UCL injury risk through GRF signatures in CMJ.
Methods
Participants
This study was reviewed by the institutional review board of Louisiana Tech University and determined to be exempt from full review as it presented minimal risk to study participants. Nineteen Division I collegiate baseball pitchers (age, 19.9 ± 1.5 years; body height, 1.87 ± 0.08 m; body mass, 90.0 ± 13.4 kg) volunteered for this study, and they attended both pitching and CMJ tasks. 19 In both tasks, a 3-dimensional (3D) motion capture (12 cameras; model Minus M1; Qualisys) sampled at 240 Hz, and 2 embedded force platforms (600 × 900 mm; model 6090-15; Bertec) sampled GRFs from each foot at 2880 Hz.
CMJ Task Setup and Data Collection
Pitchers started with the standardized total body-active, dynamic warm-up for 10 minutes (Appendix, available in the online version of this article) before performing maximal effort bilateral CMJs. Pitchers were instructed to perform a lower body countermovement with a double-arm arm swing and jump as high as possible from 2 force plates while touching the horizontal vanes of a jumping device (Vertec; Rogue Fitness HQ) with their dominant (throwing) hand. CMJ kinematics and kinetics were recorded over 3 jumps on dual force plates or until the participants failed to achieve a higher jump height than the third trial. No specific instruction was given about the posture or foot position at landing. The 3D motion capture system recorded full-body kinematics from 30 reflective markers (Plug-In-Gait marker set; 12.5 mm in diameter) (Figure 1C).
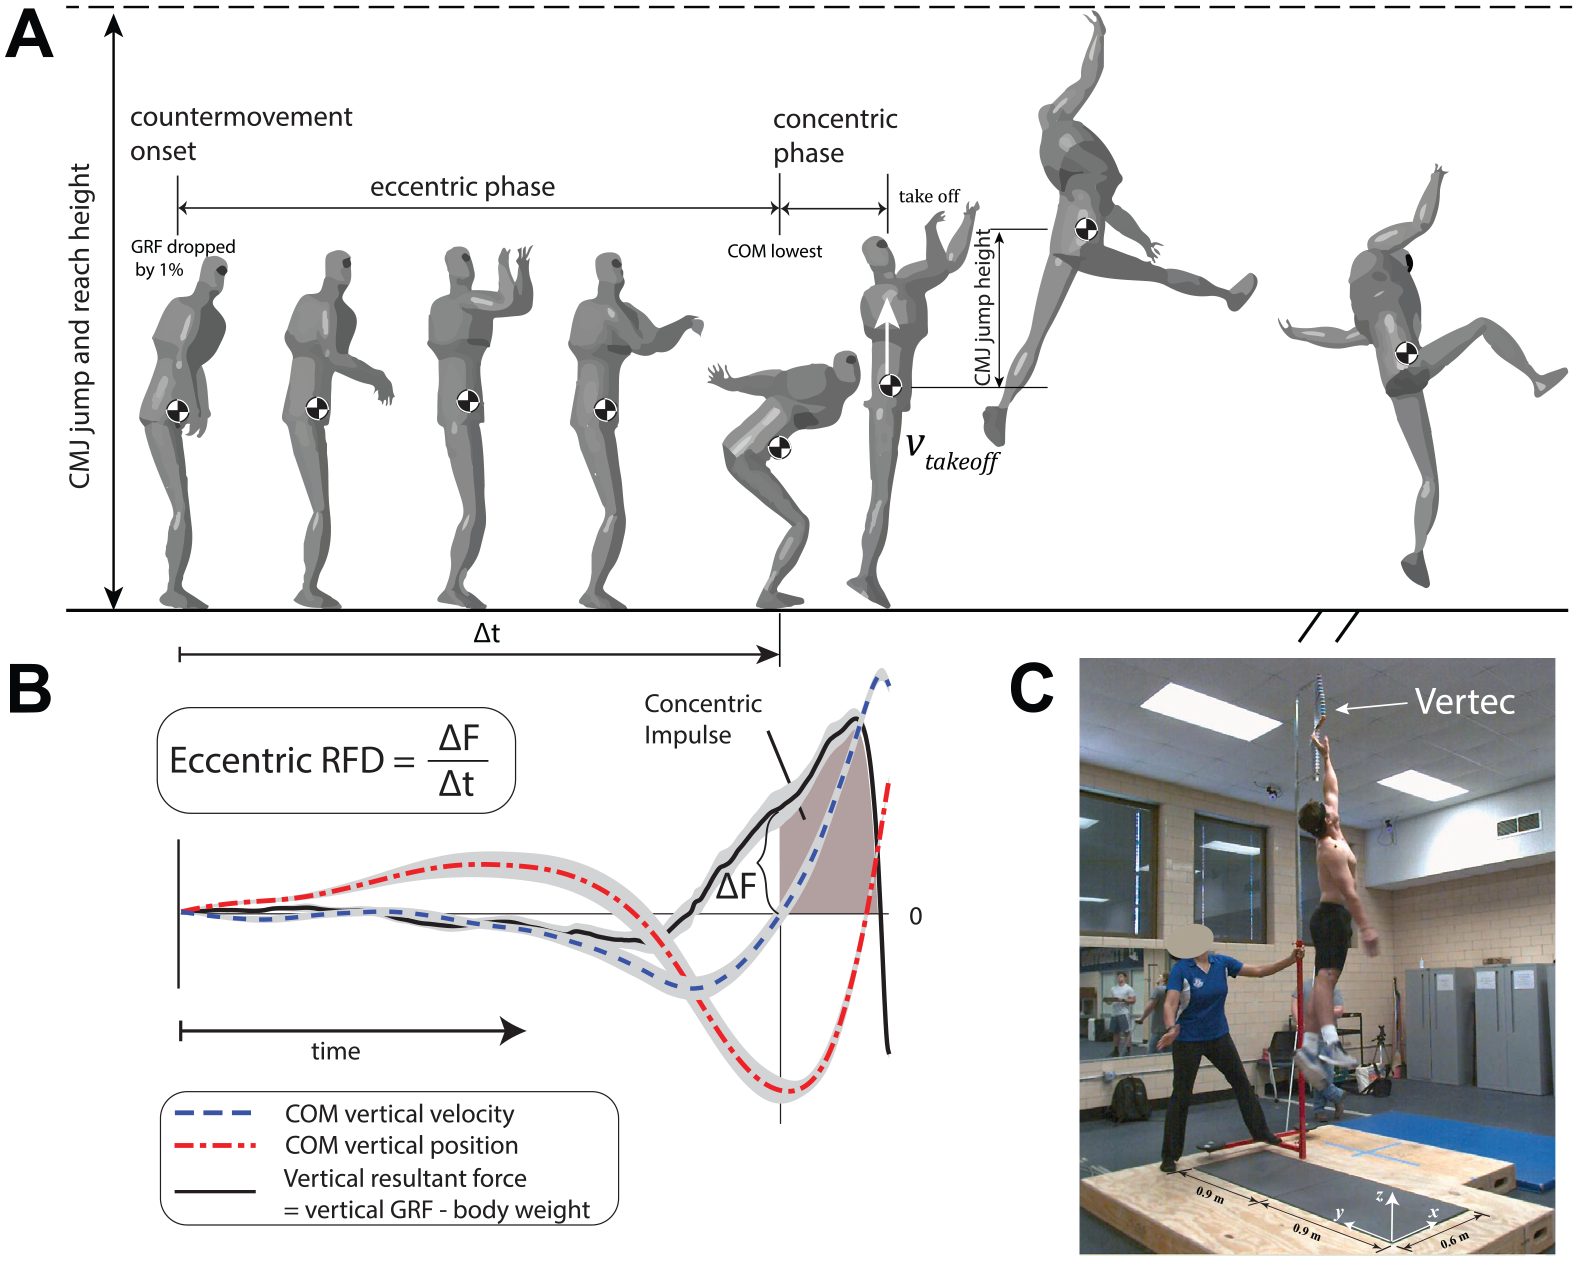
Countermovement jumping test. (A) Definitions of different phases in jumping. (B) Definitions of concentric impulse and eccentric rate of force development (EccRFD). (C) Participants jumped to reach the vanes (i.e., thin flat) of the jumping device. In panel B, each curve represents the mean of all participants. The shaded area around each curve represents the mean ± standard error.
Pitching Task Setup and Data Collection
One week after the CMJ test, participants completed the pitching tests. Before data collection, participants completed a standardized rotator cuff warm-up with 5-lb dumbbells for 2 to 3 minutes. Then, participants finished their individualized throwing routine (<15 minutes) before pitching (Appendix, available online). During pitching, participants threw 4-seam fastballs from a custom-built wooden pitching mound with 2 embedded force plates to capture the GRFs from both the drive (back) and stride (front) legs. The pitching mound had a pitching rubber and the proper slope toward home plate matching a regulation game mound. One force plate was embedded in front of and horizontally in line with the pitching rubber to record forces from the drive leg. The other force plate was embedded in the area where pitchers were expected to land with their stride foot when pitching.
The fastball’s velocity was recorded by a ball tracking device (Pitching 2.0; Rapsodo) that was placed 4.72 m (15.5 ft) in front of home plate to identify whether a thrown pitch was a strike or ball. Five replicated strikes were recorded from each participant, and the median velocity of the 5 strikes was used for calculation. The 3D motion capture system recorded full-body kinematics from 29 reflective markers (12.5 mm in diameter) (see the Appendix, available online). The markers were modified from a Plug-In-Gait marker set with 2 markers on the glove during pitching.
Calculations
In both CMJ and pitching tasks, inverse kinematics and dynamics were performed with a multi-rigid-body human model.17,18 The model includes 40 degrees of freedom (DOF) and 15 segments (Figure 1A). Briefly, the human model has a head, upper and lower trunks, upper and lower arms, hands, upper and lower legs, and feet. The upper and lower trunks are connected by a 3-DOF ball-and-socket joint; the neck, shoulders, hips, and wrists are also ball-and-socket joints with 3 DOF. Elbows and knees are 1-DOF hinge joints allowing extension/flexion. The ankles allow the movements of dorsiflexion/plantarflexion, inversion/eversion, and internal/external rotation. Additionally, the upper trunk has 3 translational coordinates relative to the origin and 3 rotational coordinates quantified by Euler angles. For each participant, the anthropometric parameters (i.e., moments of inertia, location of the center of mass (COM) for each body segment, and joint location) were determined by allometric scaling of a reference human model. 9
We calculated joint angles (i.e., Euler angles in the order of roll, pitch, and yaw) at each time sample using inverse kinematics. 9 The inverse kinematics algorithm iteratively searched for joint angles that minimized a cost function (i.e., the sum of squares of the positional differences between measured markers and markers calculated from joint angles). We later verified that any time series of joint angles had no abrupt change between 2 consecutive frames. The COM location of the whole body was calculated as a weighted mean of all instantaneous COMs of each body segment. During inverse dynamics, the mass and moment inertia of the glove and baseball were included. The glove and baseball were assumed as rigid bodies and were welded into the 2 hands, respectively. From inverse dynamics, the net moments of force (N·m) were computed for all joints using the Kane method.9,10 We reported the moment of the elbow (i.e., EVT) of the pitching arm from right-handed participants. 5 All left-handed participants were converted to right-handed. EVT and specific jump kinetics were normalized to body weight.
The pitching phase starts from the instant when the body is at the position of peak knee height (0%) to ball release (100%). The instant of foot contact and maximum external rotation (MER) of the shoulder were also marked. 4 In baseball research, the only shoulder displacements that are relevant are shoulder abduction and adduction (frontal plane humeral motion), shoulder internal and external rotation (axial rotation of the humerus), and horizontal abduction and adduction (transverse movement of the humerus behind and in front of the mediolateral axis of the trunk).12,13 Pitchers threw from a regulation distance (18.4 m/60 ft 6 inches) to track pitching kinematics from which peak EVT was derived through inverse dynamics calculated for the trial represented by the median fastball velocity. 5 During pitching, the EVT rate of torque development (EVTRTD) was also calculated, indicating the rate of loading on the medial elbow to peak EVT from lowest to highest values (Figure 2).
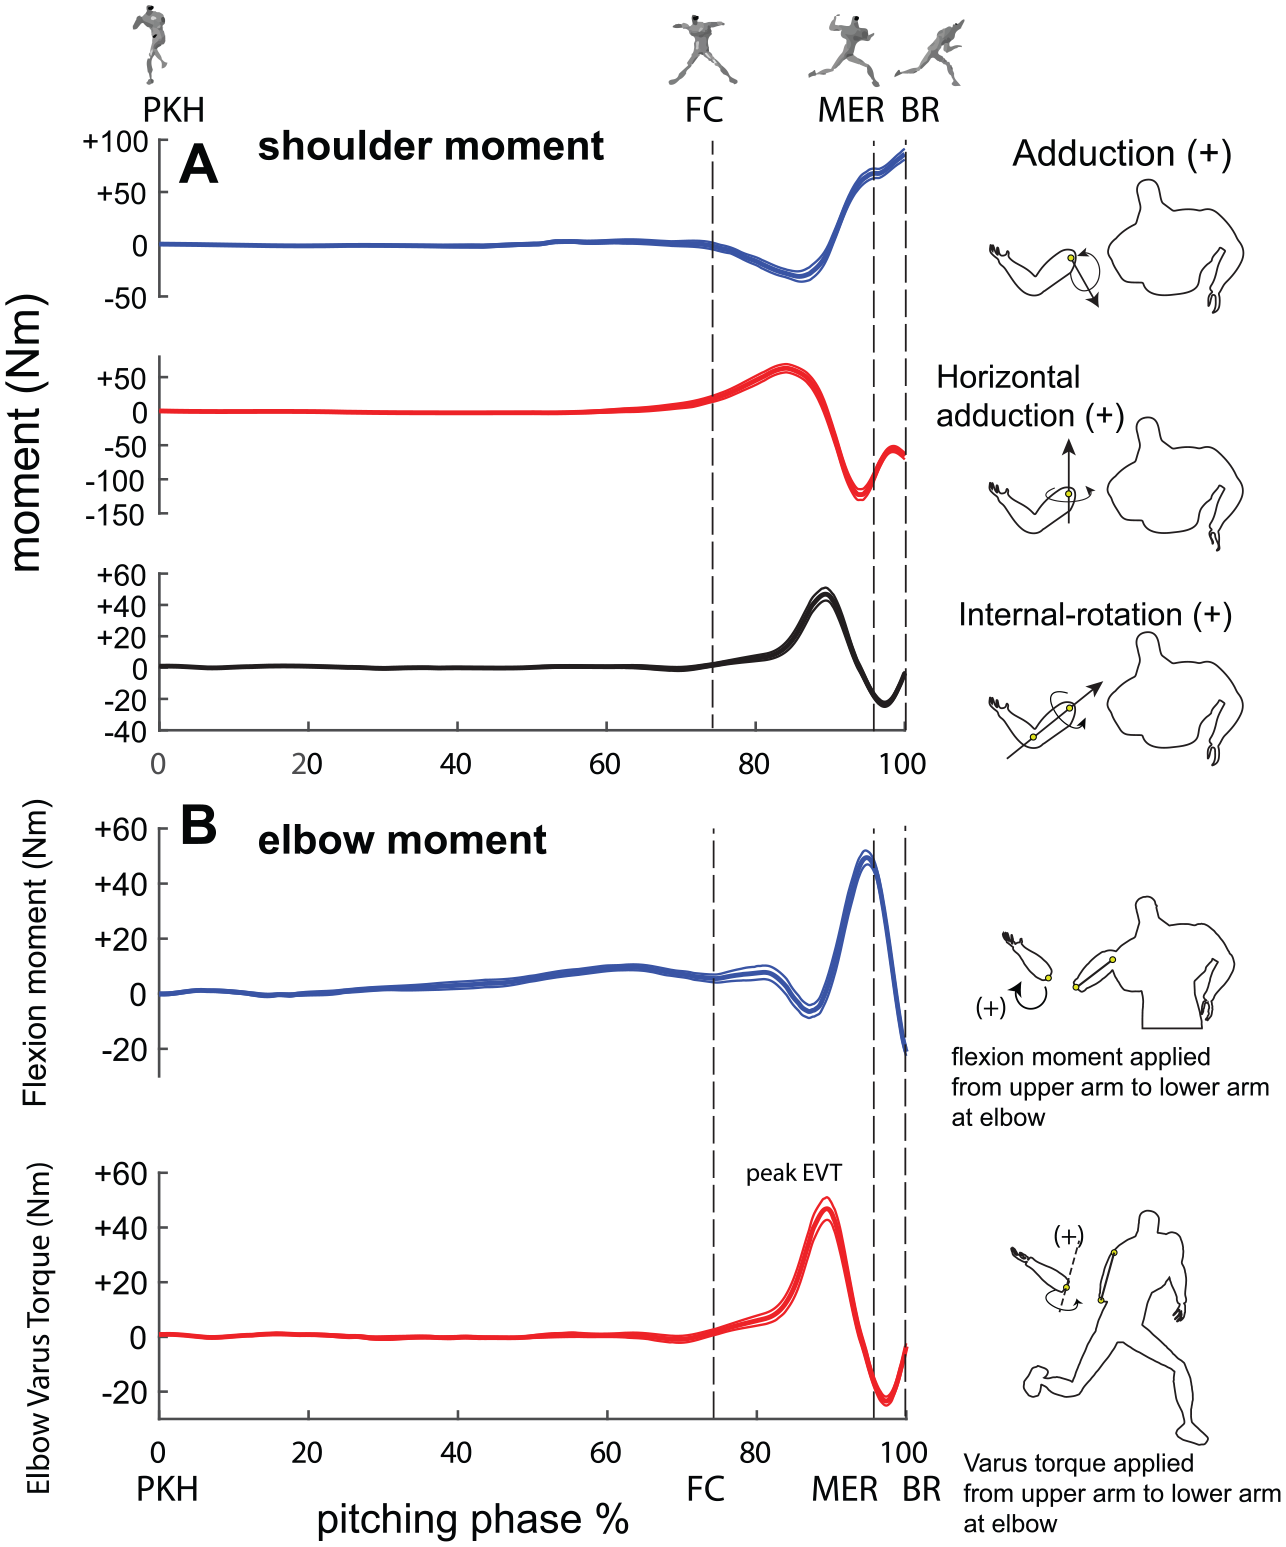
Kinetic data from the upper extremities during pitching. (A) Moment/torque at the shoulder. (B) Moment/torque at the elbow. The elbow varus torque rate of torque development (EVTRTD) is calculated by using the difference between the highest and lowest EVTs divided by the duration. All 5 replicated trials for each participant were first averaged, and all 19 participants were then averaged. Values are shown as mean ± standard deviation.
The CMJ started when the vertical GRF dropped by 1% of the body weight (Figure 1A, CMJ onset). From CMJ onset to the instant COM was reached, the lowest point was defined as the eccentric phase, which was followed by the concentric phase until takeoff. We calculated absolute and normalized peak CMJ GRFs, absolute and normalized peak powers (i.e., dot product of COM velocity and GRF), eccentric rate of force development (EccRFD), and concentric impulse (Figure 1B). In the CMJ test, the trajectory of the COM was tuned by measured GRF to increase consistency between kinematic and kinetic measures. 14 The CMJ jump height was calculated by using the apex of the COM during the flight phase minus COM height at takeoff (Figure 1A). The CMJ jump-and-reach height was measured through countermovement jump-and-reach testing (Vertec; Rogue Fitness HQ). The jump-and-reach Vertec apparatus provided visual reinforcement and competitive feedback to participants in attempting to increase the height of their jump from previous trials.
Statistical Analysis
A 1-way between-participant analysis of variance compared jump kinetics data, jump height, and ball velocity metrics between high- and low-EVT groups. Effect size (η2) calculations indicated the magnitude difference in jump properties between the 2 EVT groups. Specifically, we ranked 19 participants from low to high based on the value of the EVT. Then, 9 participants with EVT values greater or lower than the median were selected for the high or low groups, respectively. Pearson product-moment correlations (r) were undertaken to determine significant bivariate relationships between CMJ variables and EVT properties. Based on the absolute value of r, we used the following scale to interpret the clinical meaningfulness of correlations,16,21 i.e., negligible [0.00, 0.10), weak [0.10, 0.40), moderate [0.40, 0.55), moderate high [0.55, 0.70), strong high [0.70, 0.90), and very strong high [0.90, 1.00]. Statistically significant associations were determined by an alpha level of .05.
Results
In the CMJ test, absolute peak power was not significantly greater in pitchers with higher EVT (Table 1). No other CMJ variables were found to be significantly different between groups (Table 1). For example, fastball velocities were not significantly different when thrown in the laboratory setting.
CMJ Variables Between Pitchers Separated by High- and Low-EVT Groups a
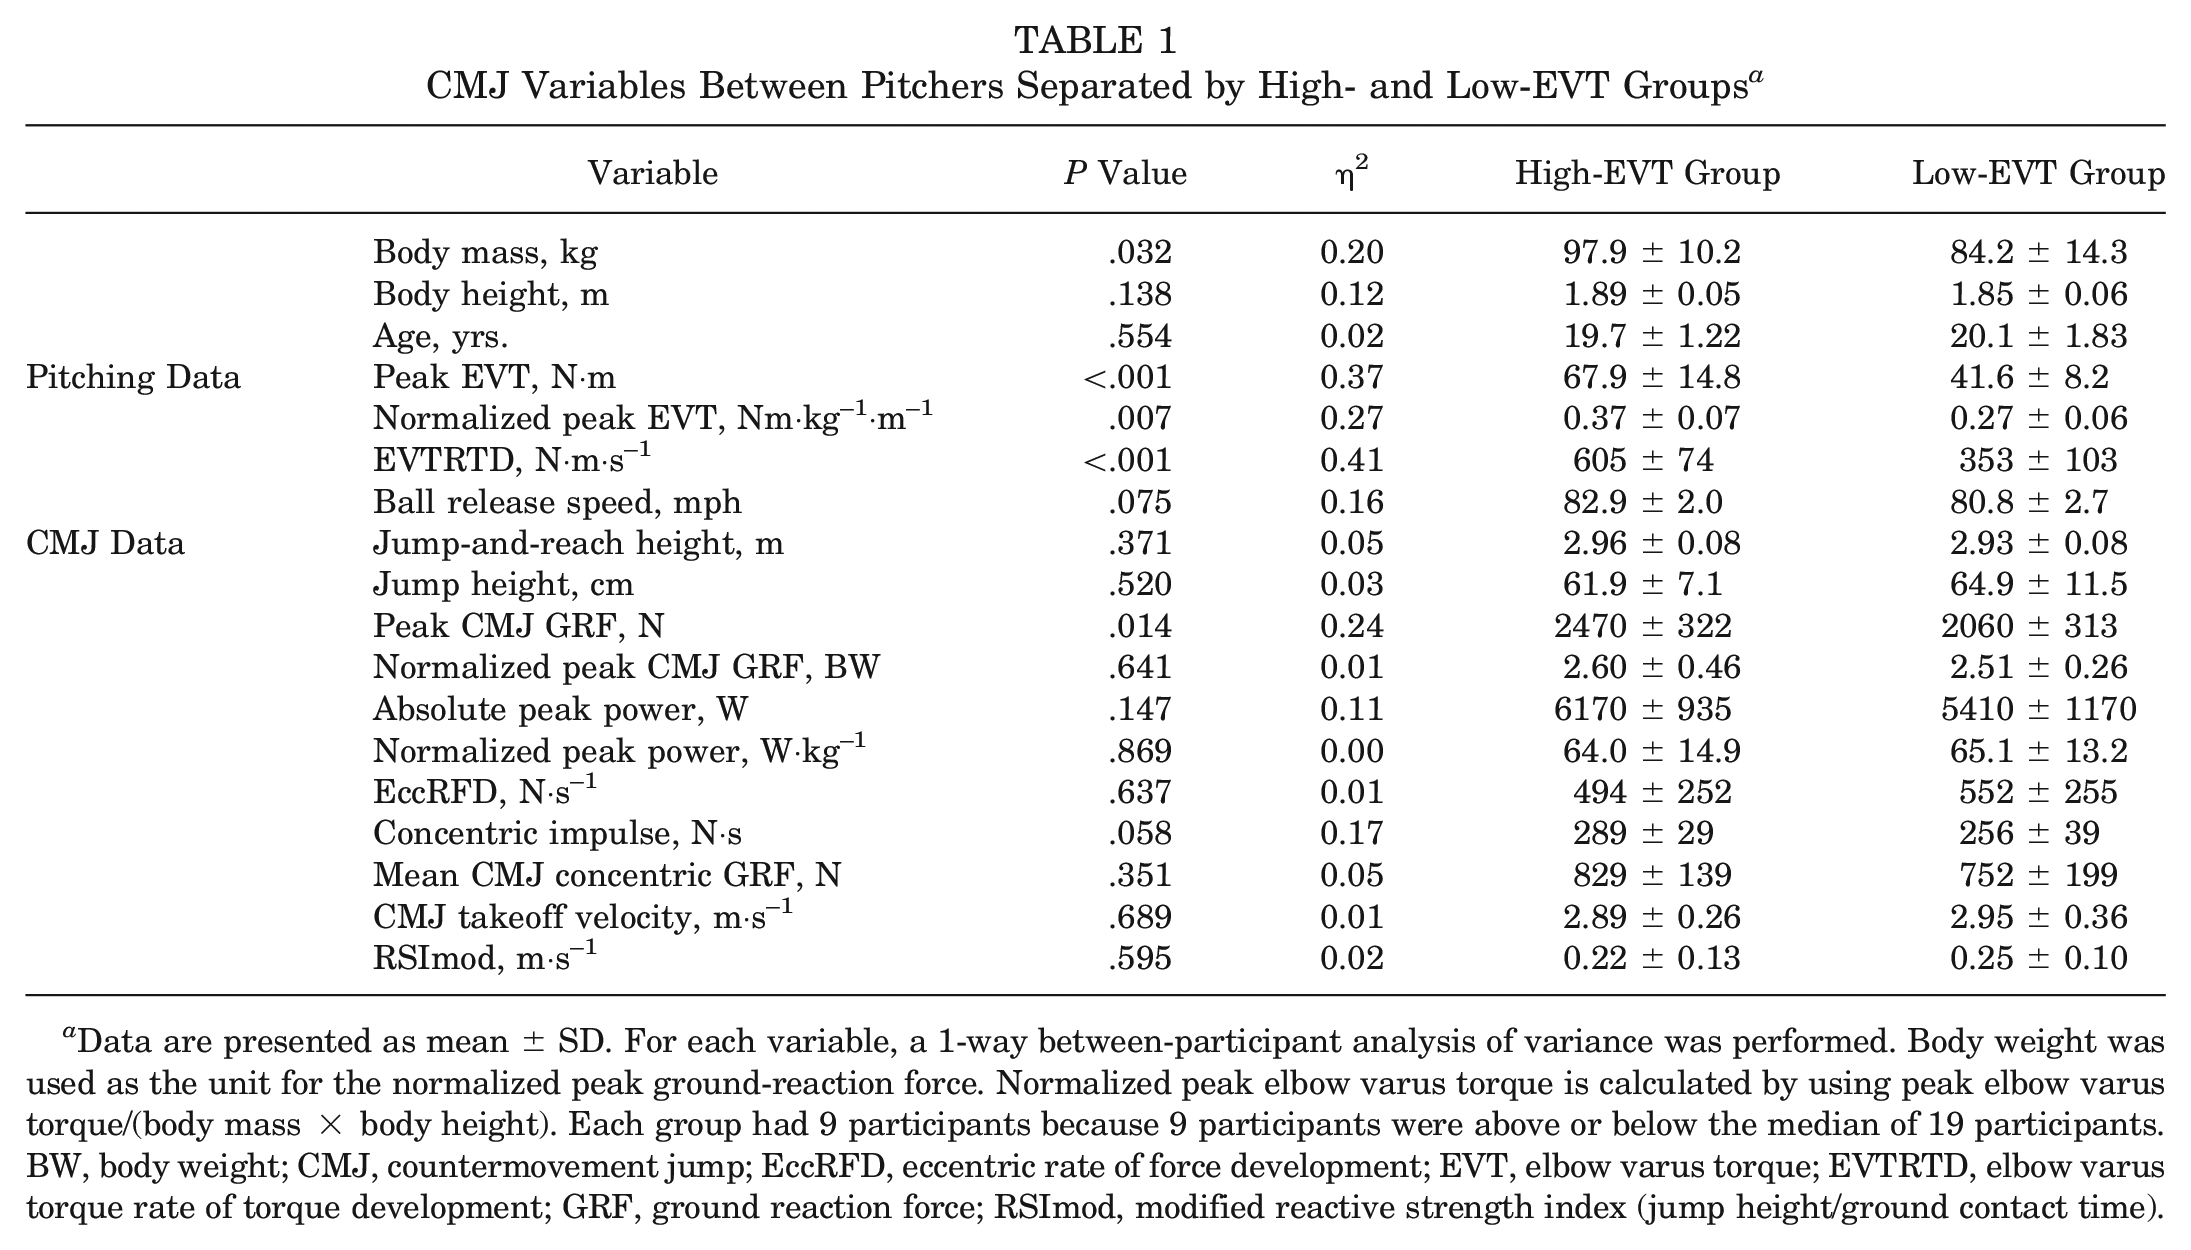
Data are presented as mean ± SD. For each variable, a 1-way between-participant analysis of variance was performed. Body weight was used as the unit for the normalized peak ground-reaction force. Normalized peak elbow varus torque is calculated by using peak elbow varus torque/(body mass × body height). Each group had 9 participants because 9 participants were above or below the median of 19 participants. BW, body weight; CMJ, countermovement jump; EccRFD, eccentric rate of force development; EVT, elbow varus torque; EVTRTD, elbow varus torque rate of torque development; GRF, ground reaction force; RSImod, modified reactive strength index (jump height/ground contact time).
Several statistically significant correlations were identified between the variables. Peak EVT indicated a moderately high correlation to normalized peak EVT (r = 0.83; P < .001) (Figure 2B) and EVTRTD (r = 0.76; P < .001), and it indicates that kinetic properties and rates of torque are associated. Normalized peak EVT and EVTRTD demonstrated a moderately high correlation with one another (r = 0.70; P < .001). For ball release speed, a moderately high correlation was identified for EVTRTD (r = 0.58; P < .05). With respect to associations involving CMJ and EVT metrics, peak EVT demonstrated a moderate correlation with concentric impulse (r = 0.47; P < .05), while EVTRTD had the most associations as indicated by peak CMJ GRF (r = 0.60; P < .001), concentric impulse (r = 0.54; P < .05), and absolute peak power (r = 0.53; P < .05) (Table 2).
Correlation Matrix Including CMJ and Elbow Varus Kinetics Data a
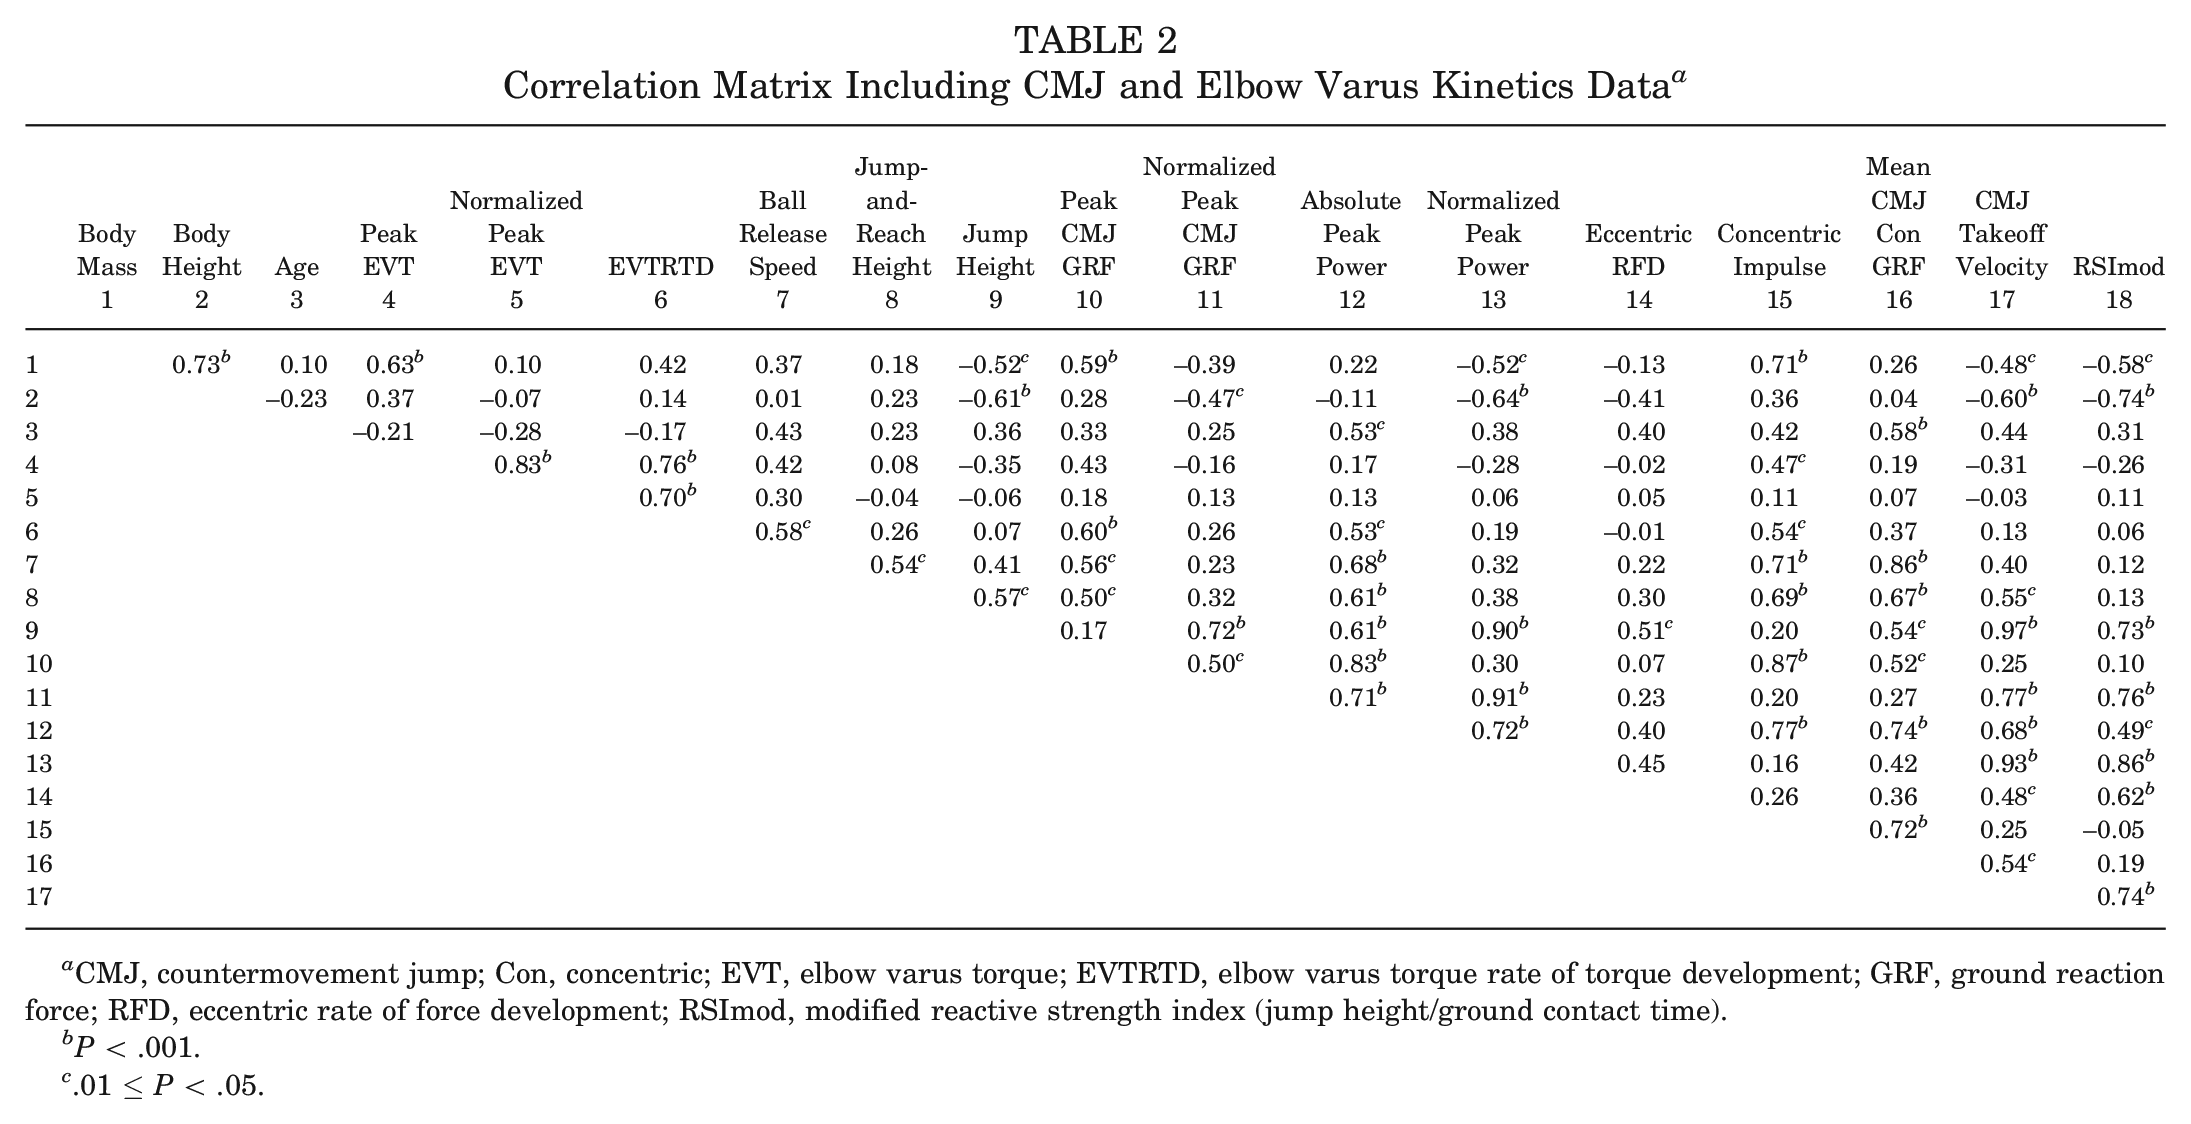
CMJ, countermovement jump; Con, concentric; EVT, elbow varus torque; EVTRTD, elbow varus torque rate of torque development; GRF, ground reaction force; RFD, eccentric rate of force development; RSImod, modified reactive strength index (jump height/ground contact time).
P < .001.
.01 ≤ P < .05.
Discussion
Because of the ease of implementation, relatively low cost, and widespread use, CMJ analyses may offer a consistent and low-cost approach to monitoring UCL injury risk in competitive pitchers by detecting changes in lower body force, impulse, and peak power. Thus, we evaluated the potential of determining UCL injury mechanisms through CMJ analysis to explore jump performance differences between collegiate baseball pitchers with high and low EVT. This study contributes further to previous work that examined the predictive strength of CMJ kinetics in identifying athletes at greater risk of UCL surgical repair. 15 From the jump variables assessed, our hypothesis was only partially supported as no significant differences were found between high- and low-EVT groups in the time application of force through concentric impulse, EccRFD, or absolute or normalized peak power in CMJ (Table 1).
Research predicting UCL reconstruction risk and CMJ metrics demonstrated that pitchers are 3-fold more susceptible to experiencing an elbow injury if they display unbalanced GRF production in their impulse momentum properties. 15 In this previous work, a principal component analysis was performed that integrated EccRFD, mean concentric GRF, concentric CMJ impulse, and jump height to determine injury detection from CMJ data. Specifically, pitchers who had low impulse and high rates of force production, as well as pitchers with high impulse and low force production, were at a greater risk of UCL injury. Researchers further expressed that pitchers with high rates of force have distal joints with a more restricted range of motion that may precipitate elbow valgus overload for the medial elbow stabilizers and the UCL. 15 Anatomic assessment for elbow laxity was not presented in the study, 15 yet as it relates to UCL sprains, UCL laxity indicates joint insufficiency. As a result, lack of stiffness for the medial elbow dictates the potential for greater opening of the medial elbow under ultrasound, which can give rise to a greater risk of partial- and full-thickness tears. 7 Therefore, the previous study’s inference needs to be reconsidered as ultrasonographic evidence indicates that lack of stiffness or tensile strength is a strong determinant for medial elbow opening and increased tension in the UCL leading to failure. 7 Furthermore, in linking the previous study’s results with the current investigation, none of the previously published variables were related to increased EVT in collegiate pitchers, as impulse and force properties were similar. As a result, an unclear mechanistic connection remains in connecting medial elbow injuries to unbalanced impulse and force production.
When compared with low-EVT pitchers, pitchers with high EVT in the current study did not have higher impulse paired with lower force production. The nonsignificance found in this scenario presents less clarity in how a potential mechanism between a high rate of force development in jumping and EVT in pitching interact to predict surgical UCL cases. The rate of force development in the CMJ had been considered a measure of physical strength, and in connection with the current study, no significant differences were seen. Therefore, as it relates to perceived strength through EccRFD, weaker pitchers as determined by CMJ kinetics did not experience greater EVT or rates of EVT to withstand when pitching in a laboratory setting.
Previous work strengthened their predictive approach to computing UCL injury risk by accounting for pitcher age, weight, and workload as potential covariates. 15 The new regression equation indicated a low-EccRFD (a third variable) isolated cohort to expose pitchers to be at greater risk that was independent of mean GRF and impulse imbalances. 15 The EccRFD did not differ between EVT groups in the current research. Thus, the collegiate pitcher’s ability to coordinate eccentric deceleration of their COM in transitioning to concentric contraction may not be characteristic of heightened EVT being the kinetic variable that is associated with greater injury or risk of the UCL. 1
CMJ peak power reflects the rate of change of CMJ work. CMJ peak power among baseball players can be calculated through regression estimations,6,20 where both computations involve CMJ height and body mass data as explanatory variables.8,11 Here, the relationship between elbow valgus overload and the CMJ seems intuitive as a potential mechanism for UCL sprains in baseball pitchers due to elevated CMJ peak power. In reference to estimated peak power calculations, the influence of jump height and body mass infers that heavier athletes who can jump the same height or higher have greater absolute power.8,11 Additionally, if two athletes have the same body mass, the one who jumps higher has greater peak power. Larger athletes also have greater segment masses. In physics, force is calculated as mass multiplied by its acceleration, and therefore, a larger athlete has the potential for greater elbow loads that can be associated with throwing at greater fastball velocities. Despite these postulates, no statistical differences were seen in the current study in CMJ peak power in relation to athletes with high and low EVT while pitching in a laboratory setting.
Fastball velocity, attributed to being more explosive with more powerful stretch-shortening capabilities for the throwing arm, has the potential to have a higher angular acceleration of the throwing arm that may be increased both in MER (layback) and after ball release. Combined throwing arm acceleration and throwing arm mass, as previously discussed, has the potential to elicit greater EVT. In this study, ball release speed while pitching in a laboratory setting was not found to be significantly higher in pitchers with greater EVT who had greater absolute CMJ peak power. These findings are in agreement with previous work on fastball velocity indicating no significant relationships between individuals’ EVT and throwing velocities. 23 In contrast, the current study found a significant association between the rate of EVT and ball release speed (r = 0.58; P < .05) (Table 2), making the relationship between ball release speed and risk of injury more plausible versus absolute EVT from previous work. 1 In addition to fastball velocity, the rate of EVT in pitchers could be partially predicted by CMJ concentric impulse, peak CMJ GRF, and CMJ absolute peak power, whereas only concentric impulse showed a statistically significant association with peak EVT in the current study.
As it relates to injury surveillance, observing routine changes in lower body power is logistically easier to screen athletes with high accuracy, especially given the inability to examine changes in EVT with validated 3D motion capture systems, such as optical tracking. If pitchers are gaining body mass and lean body mass, jumping more explosively, and throwing at faster velocities, a more thorough examination involving throwing arm dynamometry, changes in elbow joint mobility, and stress ultrasound to examine the tissue properties of the UCL could be warranted in preventing elbow valgus overload.
Limitations
There are a few limitations to interpreting our results. First, our study involved a homogeneous group of baseball pitchers, whereas previous work integrated pitchers at various professional competitive levels, ages, and body sizes with greater sample sizes. 15 As a result, the data presented are characteristic of collegiate pitchers who typically have a training age of at least 1 year, while athletes at lower levels, such as high school, may be untrained and yield different results. Second, our research design differed from previous work as we integrated 2 force plates that captured GRFs independently for each leg, which may affect comparisons with previous research that used only 1 force platform shared between lower body limbs. 15 Third, pitchers were also provided visual encouragement in the current study to jump as high as possible using a commonly used measuring apparatus to capture CMJ height, whereas previous research connecting CMJ characteristics to UCL injury did not. 15 Fourth, the current study used the dual-force-plate data from the trial with the best CMJ height, whereas previous work used single-force-plate data from the mean of the best 3 of 6 CMJ height trials. 15 Despite these methodological differences, the potential of screening lower body power generation may prevent UCL injuries as it appears to have the potential to be a surrogate measure to denote heightened throwing velocities and EVT. Future work is needed to examine how a change in lower body power affects EVT magnitudes versus combined mean data. With larger data collection, force plate analyses may affect injury prevention at a greater rate than 3D motion capture, as the opportunity for more universal monitoring and screening is vast and not limited to laboratory settings, making assessments less costly and time-consuming than 3D motion analysis using research-grade equipment.
Another limitation of the study is the small sample size of the collegiate pitchers included in the research. Results in bisecting high and low groups could differ with greater statistical power and across different competitive cohorts (i.e., professional, college, high school, and youth). To account for all participants within a homogeneous cohort of competitive pitchers, correlation and regression analyses were undertaken for association of varus torque characteristics to complement mean tests and increase sample size. The use of correlation and regression is limited to only examining linear relationships, whereas the variables may represent nonlinear relationships. Using the Bayesian approach or nonparametric models, one can test nonlinear relationships without specifying a specific functional form.
Conclusion
Compared with absolute EVT, CMJ kinetics were associated with the rate of EVT in collegiate pitchers. Therefore, as it relates to injury surveillance, based on this study as well as previous work, identifying pitchers who display increases in peak GRF, concentric impulse, and CMJ peak power may provide early detection in protecting athletes from elbow valgus overload.
Supplemental Material
sj-pdf-1-ajs-10.1177_03635465251322913 – Supplemental material for An Inferential Investigation Into Countermovement Jump Determinants of Ulnar Collateral Ligament Injuries in Collegiate Baseball Pitchers
Supplemental material, sj-pdf-1-ajs-10.1177_03635465251322913 for An Inferential Investigation Into Countermovement Jump Determinants of Ulnar Collateral Ligament Injuries in Collegiate Baseball Pitchers by Mu Qiao, Ryan L. Crotin and David J. Szymanski in The American Journal of Sports Medicine
Footnotes
Acknowledgements
The authors thank the Louisiana Tech University baseball team, both players and staff, for their dedication to sports science excellence and high performance in baseball. Similarly, special thanks to Vishesh Singh and Jessica Szymanski for their effort and involvement in data collection. The authors also thank Dr. Paula Brown for proofreading and editing.
One or more of the authors has declared the following potential conflict of interest or source of funding: R.L.C. is the executive vice president of ArmCare.com, a company that has built a technology focused on identifying throwing arm strength qualities to determine fatigue levels, recovery of the throwing, and workload management. AOSSM checks author disclosures against the Open Payments Database (OPD). AOSSM has not conducted an independent investigation on the OPD and disclaims any liability or responsibility relating thereto.
References
Supplementary Material
Please find the following supplemental material available below.
For Open Access articles published under a Creative Commons License, all supplemental material carries the same license as the article it is associated with.
For non-Open Access articles published, all supplemental material carries a non-exclusive license, and permission requests for re-use of supplemental material or any part of supplemental material shall be sent directly to the copyright owner as specified in the copyright notice associated with the article.