
Abstract
Background:
Multiple 2-dimensional magnetic resonance imaging (MRI) studies have indicated that the size of the labrum adjusts in response to altered joint loading. In patients with hip dysplasia, it tends to increase as a compensatory mechanism for inadequate acetabular coverage.
Purpose:
To determine the differences in labral contribution to the joint surface among different hip deformities as well as which radiographic parameters influence labral contribution to the joint surface using a deep learning–based approach for automatic 3-dimensional (3D) segmentation of MRI.
Study Design:
Cross-sectional study; Level of evidence, 4.
Methods:
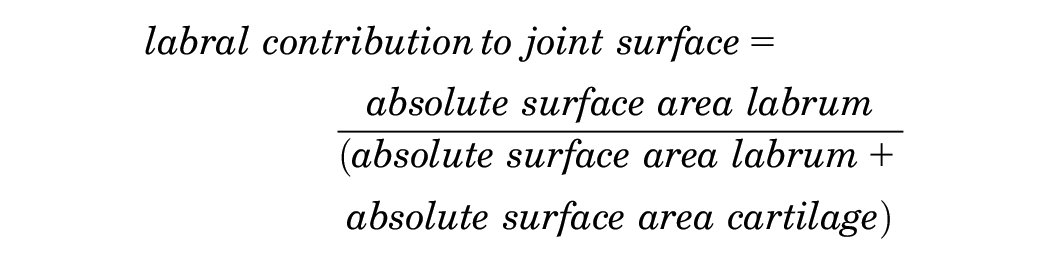
This retrospective study was approved by the local ethics committee with waiver for informed consent. A total of 98 patients (100 hips) with symptomatic hip deformities undergoing direct hip magnetic resonance arthrography (3 T) between January 2020 and October 2021 were consecutively selected (mean age, 30 ± 9 years; 64% female). The standard imaging protocol included proton density–weighted turbo spin echo images and an axial-oblique 3D T1-weighted MP2RAGE sequence. According to acetabular morphology, hips were divided into subgroups: dysplasia (lateral center-edge [LCE] angle, <23°), normal coverage (LCE, 23°-33°), overcoverage (LCE, 33°-39°), severe overcoverage (LCE, >39°), and retroversion (retroversion index >10% and all 3 retroversion signs positive). A previously validated deep learning approach for automatic segmentation and software for calculation of the joint surface were used. The labral contribution to the joint surface was defined as follows: labrum surface area/(labrum surface area + cartilage surface area). One-way analysis of variance with Tukey correction for multiple comparison and linear regression analysis was performed.
Results:
The mean labral contribution of the joint surface of dysplastic hips was 26% ± 5% (95% CI, 24%-28%) and higher compared with all other hip deformities (P value range, .001-.036). Linear regression analysis identified LCE angle (β = −.002; P < .001) and femoral torsion (β = .001; P = .008) as independent predictors for labral contribution to the joint surface with a goodness-of-fit R2 value of 0.35.
Conclusion:
The labral contribution to the joint surface differs among hip deformities and is influenced by lateral acetabular coverage and femoral torsion. This study paves the way for a more in-depth understanding of the underlying pathomechanism and a reliable 3D analysis of the hip joint that can be indicative for surgical decision-making in patients with hip deformities.
The size of the labrum varies among different hip deformities and has been attributed to altered joint loading.5,23,24,28 More specifically, the labrum seems to adapt to hip joint instability, which can result from insufficient acetabular coverage of the femoral head or increased femoral torsion.11,23,32 On the other hand, the labrum is decreased in patients with increased acetabular coverage, that is, pincer femoroacetabular impingement. 28 Therefore, a stabilizing effect of the femoral head in dysplastic hips has been attributed to the increased labrum. 6 Resection of the labrum in dysplastic hips can potentially have a destabilizing effect. 15 In hips with sufficient or excessive acetabular coverage, the stabilizing effect of the labrum is negligible, with its predominant function being the sealing effect. 10
Identifying the predominant hip deformity in patients with borderline or mixed pathologies can be challenging. Next to evaluation of osseous hip morphology with standard parameters (eg, lateral center-edge [LCE] angle to quantify acetabular coverage), differences in morphology of the labrum, 14 the iliocapsularis muscle, 4 or damage pattern of the cartilage and labrum1,13 have also been shown to be beneficial for identifying the underlying pathomechnism of the hip. However, labrum morphology has been evaluated in 2-dimensional (2D) magnetic resonance imaging (MRI) scans only.2,14,18,28 The contribution of the labrum to the joint surface was only evaluated in 1 cadaveric study, which did not account for different hip deformities. 25 Three-dimensional evaluation of the labrum, including the contribution to the joint surface, can only be reliably performed with 3-dimensional (3D) MRI models of hip labrum and cartilage. Until recently, manual segmentation was required to generate 3D models of the hip joint to extract 3D morphological information about hip cartilage and labrum. These manual segmentations have to be performed by an expert reader and are very time-consuming and tedious. While it has been shown that automatic segmentation of cartilage is feasible, the same process has not been applied to the labrum. Deep learning methods such as convolutional neural networks have the potential to overcome these shortcomings and to allow for a fully automated segmentation approach.
A deep learning method using convolutional neural networks has been trained and validated to automatically segment hip labrum and cartilage by our institution. This approach allows for accurate segmentation of the labrum with a mean Dice similarity coefficient of 0.82, and 0.93 for cartilage.16,20 The training data included a wide variety of acetabular deformities. This approach allows, for the first time, a reliable and 3D analysis of hip labrum and cartilage and calculation of the labral contribution to the joint surface. With this deep learning–based algorithm for automatic 3D segmentation of MRI we asked: What are the differences in labrum and cartilage contribution to the joint surface among different hip deformities? In addition, we asked: Which patient and radiographic parameters influence the labral contribution to the joint surface?
Methods
This retrospective study was approved by the ethics committee of the local state medical council of Bern (approval No. KEK 2022-00618) with a waiver for informed consent.
Patients
The institutional picture archiving and communication system of the radiology department of Bern University Hospital was queried for direct hip magnetic resonance (MR) arthrograms acquired between January 2020 and October 2021. Inclusion criteria were a complete MRI scan according to the institutional routine protocol, including a 3D T1-weighted magnetization prepared 2 rapid gradient echo (MP2RAGE) sequence; age >18 years; and a symptomatic hip deformity (Figure 1). Symptomatic hip deformity was defined by hip pain, positive impingement, or apprehension test assessed by a senior orthopaedic surgeon in the presence of an osseous hip deformity. This resulted in a consecutive series of 195 patients (197 hips). Exclusion criteria were previous hip surgery, osteoarthritis (Tönnis grade ≥2), pediatric hip deformities, posttraumatic deformity, avascular necrosis of the femoral head, and insufficient image quality such as motion artifacts or extra-articular contrast agent. This resulted in a total of 98 patients (100 hips), which previously have been used for validation of the deep learning method (Figure 1). 16 According to their acetabular morphology assessed on anteroposterior pelvic radiographs, patients were divided into 5 subgroups: hip dysplasia with an LCE angle <23°, normal acetabular coverage with an LCE angle ranging from 23° to 33°, acetabular overcoverage with an LCE angle of 33° to 39°, and severe acetabular overcoverage with an LCE angle >39°. 26 In addition, acetabular retroversion was defined by a positive crossover sign, positive ischial spine sign, positive posterior wall sign, and a retroversion index >10%.9,19
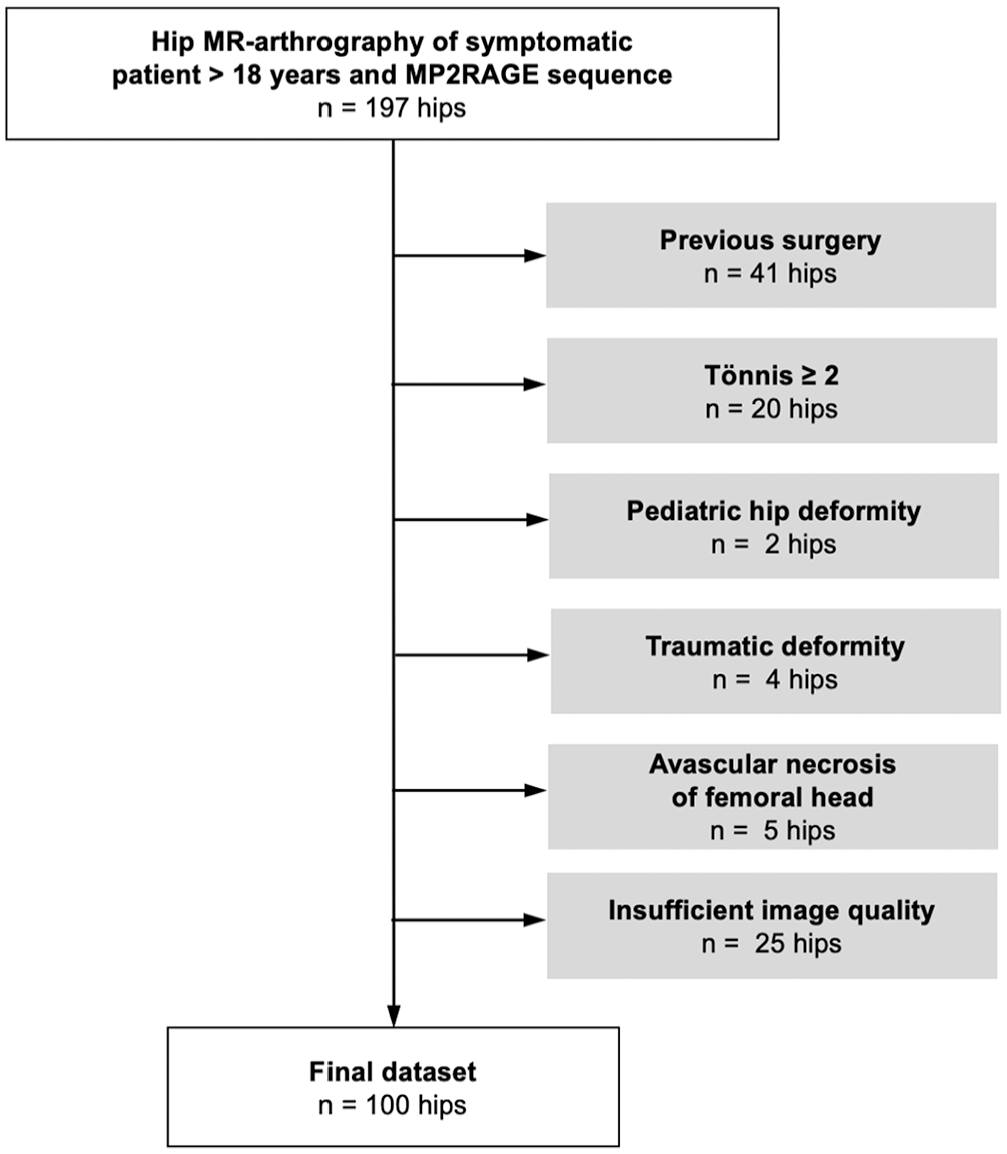
Flowchart of patient inclusion and exclusion. MP2RAGE, magnetization prepared 2 rapid gradient echo; MR, magnetic resonance. This figure was adapted from Meier et al 16 under the Creative Commons license http://creativecommons.org/licenses/by/4.0/.
Imaging Technique
Patients underwent conventional radiographic imaging in a standardized manner 27 as part of the routine diagnostic setup, including anteroposterior pelvic and axial radiographs in the supine position.
Direct hip MR arthrography was performed on a 3-T unit (Magnetom Skyra; Siemens Healthineers) under fluoroscopic guidance with injection of 1 to 2 mL of iodinated contrast agent (iopamidol, 200 mg/mL; Iopamiro 200, Bracco), 2 to 5 mL of local anesthetic (ropivacaine hydrochloride, 2 mg/mL; Ropinaest, GebroPharma), and 15 to 20 mL of diluted MR contrast agent (gadopentetate dimeglumine, 2 mmol/L; Magnevist, Bayer Healthcare). The standard imaging protocol included multiplanar proton density–weighted turbo spin echo images of the hip in coronal, sagittal, and radial image orientation and an axial-oblique 3D T1-weighted MP2RAGE sequence. 21 The T1-weighted MP2RAGE sequence was used for automatic segmentation of 3D hip models16,20 and had the following parameters: repetition time, 5000 milliseconds; echo time, 3.4 milliseconds; inversion times, 400/2500 milliseconds; acquisition matrix, 192 × 192; reconstruction matrix, 384 × 384; field of view, 173 mm; flip angles, 4° and 5°; slice thickness, 1 mm; and bandwidth, 250 Hz/Px.
Deep Learning Approach for Automatic Segmentation
A previously validated approach for automatic segmentation of hip cartilage and labrum was used to generate the corresponding 3D models of hip cartilage and labrum.16,20 The deep learning approach was based on a 3D U-net with application of the nnU-net framework from Isensee et al. 7 The deep learning approach was trained on 80 cases and tested on 20 unseen cases, which showed excellent segmentation performance with a mean Dice similarity coefficient for the labrum of 0.82 ± 0.05 (95% CI, 0.80-0.85) and a mean Dice coefficient for the cartilage of 0.93 ± 0.04 (95% CI, 0.92-0.95). 16 The training data included a wide variety of acetabular deformities, for example, hip dysplasia and femoroacetabular impingement with a cam deformity, pincer deformity, acetabular retroversion, or a combination. For 3D visualization and automatic metric calculation, a previously validated in-house-built software was used. 20
Three-Dimensional Morphological Parameters
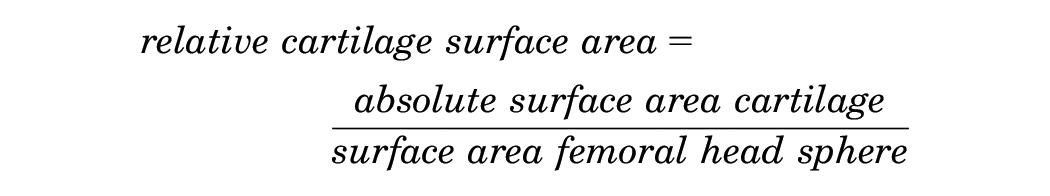
The joint-facing surface area based on the 3D models of hip cartilage and labrum was measured using the abovementioned in-house-built software with a dedicated tool for automatic surface area calculation. 20 The absolute surface area was calculated in square millimeters for the labrum and the cartilage. To account for differences in size of the hip joint, the relative surface areas for the labrum and cartilage were calculated:

To answer our research question of how much the labrum contributes to the overall joint surface, the labral contribution of the joint surface was calculated as follows:
Statistical Analysis
Data were tested for normality using the Kolmogorov-Smirnov test. Patient and radiographic parameters were compared between groups using the 1-way analysis of variance (ANOVA) with Tukey correction for multiple comparisons for continuous variables and the Kruskal-Wallis test with Dunn correction for multiple comparisons for binary data. Morphological parameters were compared between groups using the 1-way ANOVA with Tukey correction for multiple comparison. Simple linear regression analysis was performed to assess linear relationships between patient or radiographic parameters and labral contribution to the joint surface. Patient and radiographic parameters that showed a significant linear relationship with labral contribution to the joint surface in the simple linear regression analysis were included into the multiple linear regression analysis. Parameters that showed high multicollinearity (variance inflation factor [VIF], >2.5 8 ) were reduced to 1 parameter only. A type 1 error rate of 0.05 was used to determine statistical significance. Statistical analysis was performed with GraphPad Prism (Version 10.0; GraphPad Software).
Results
Patient and radiographic characteristics are summarized in Table 1. The mean relative labral surface area did not differ among hip deformities (P = .695) (Figure 2, Table 2). The mean relative labral surface area ranged from 8% to 10% of the femoral head sphere surface. The relative cartilage surface area differed among hip deformities (P < .001) (Figure 2, Table 2). The mean relative cartilage surface area in dysplastic hips was 28% ± 3% (95% CI, 27%-29%), which was less than that of all other hip deformities (P value range, <.001-.013) (Figure 2). Conversely, the mean relative cartilage surface area in hips with severe overcoverage was 35% ± 3% (95% CI, 32%-37%), which was greater than that of hips with overcoverage, retroversion, and dysplasia (P value range, <.001-.032) (Figure 2, Table 2). No difference in cartilage surface area was found between normal hips and hips with severe overcoverage (P = .055) or normal hips and hips with retroversion (P = .920).
Patient and Radiographic Characteristics for the 5 Study Groups With Different Acetabular Morphologies a
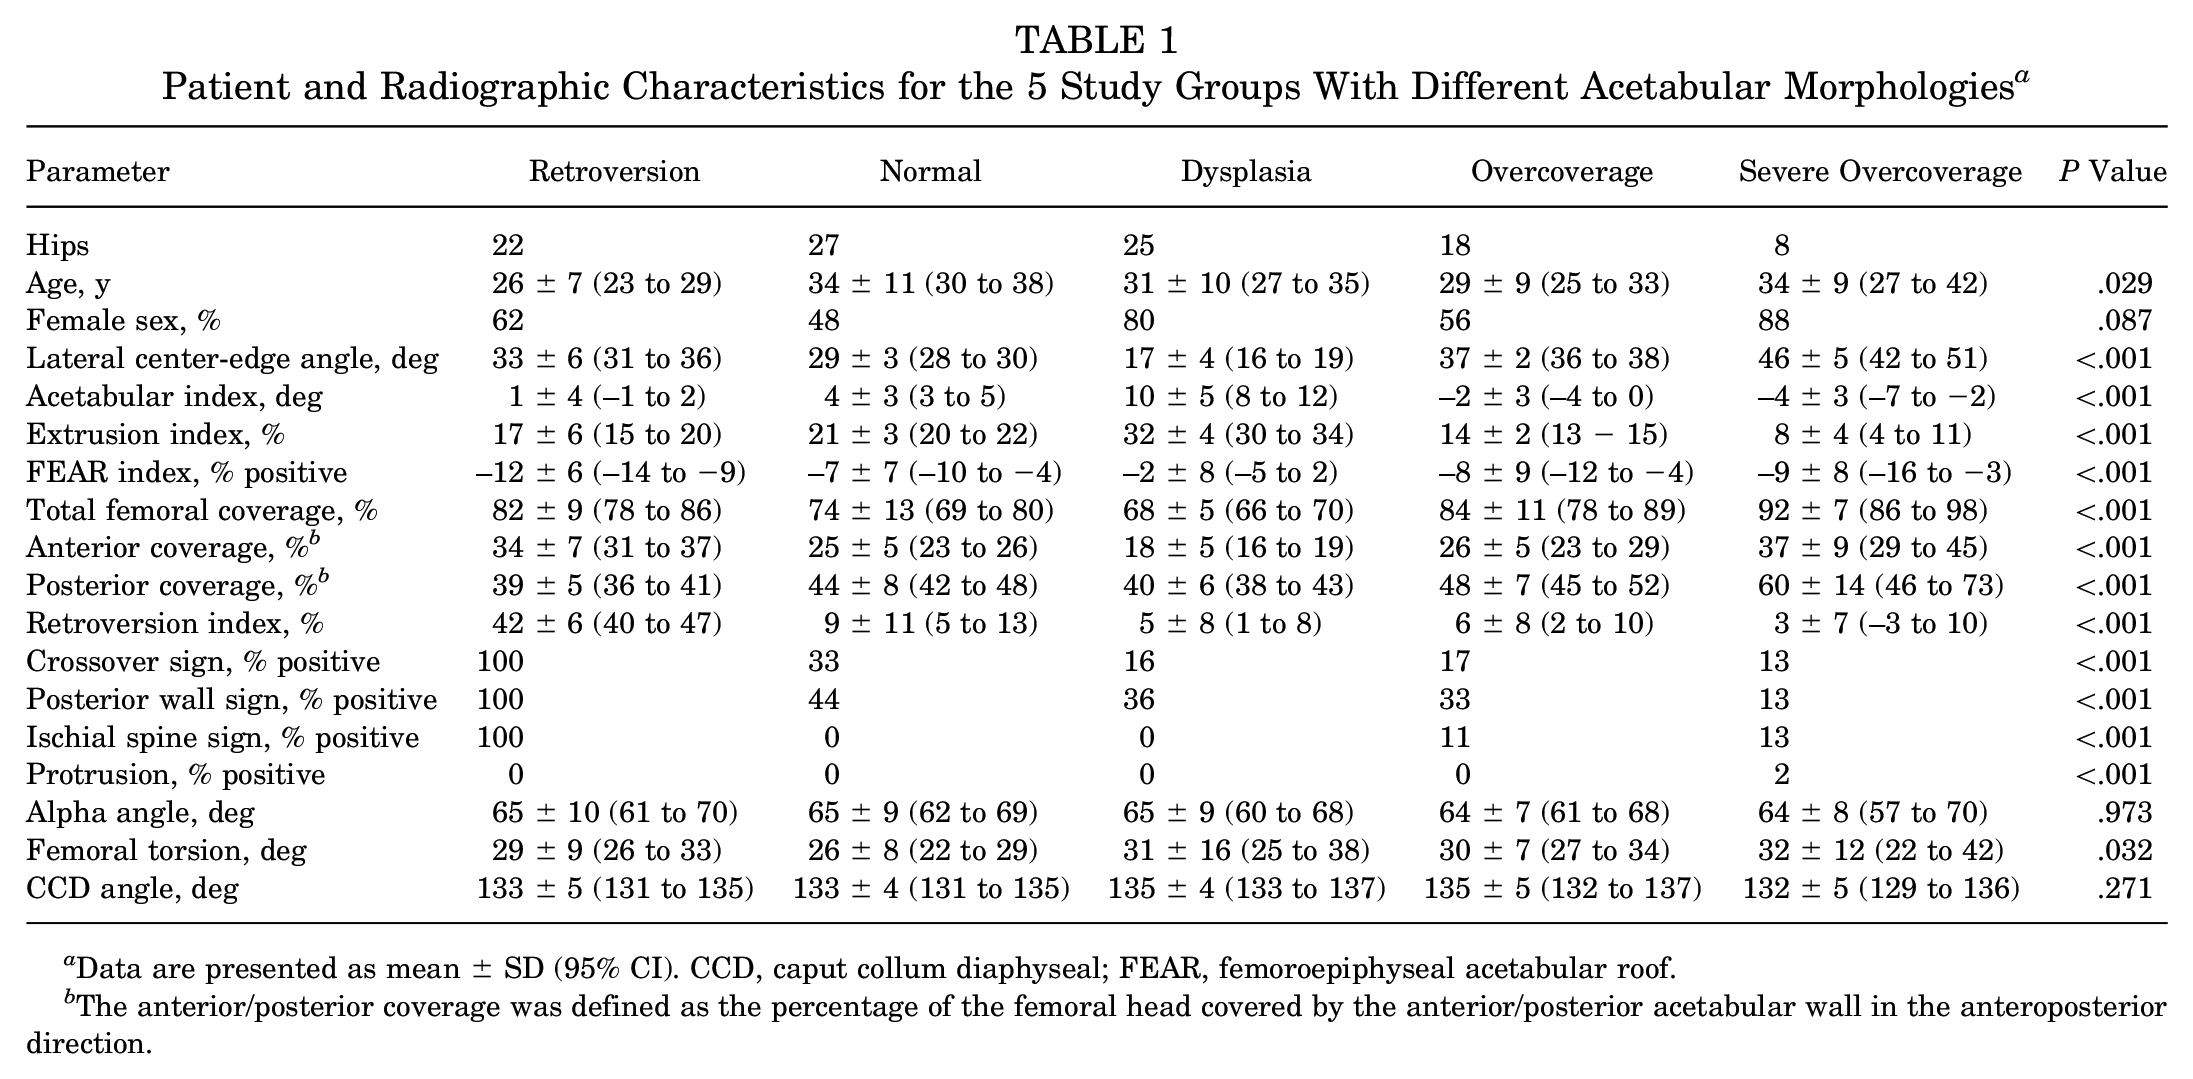
Data are presented as mean ± SD (95% CI). CCD, caput collum diaphyseal; FEAR, femoroepiphyseal acetabular roof.
The anterior/posterior coverage was defined as the percentage of the femoral head covered by the anterior/posterior acetabular wall in the anteroposterior direction.
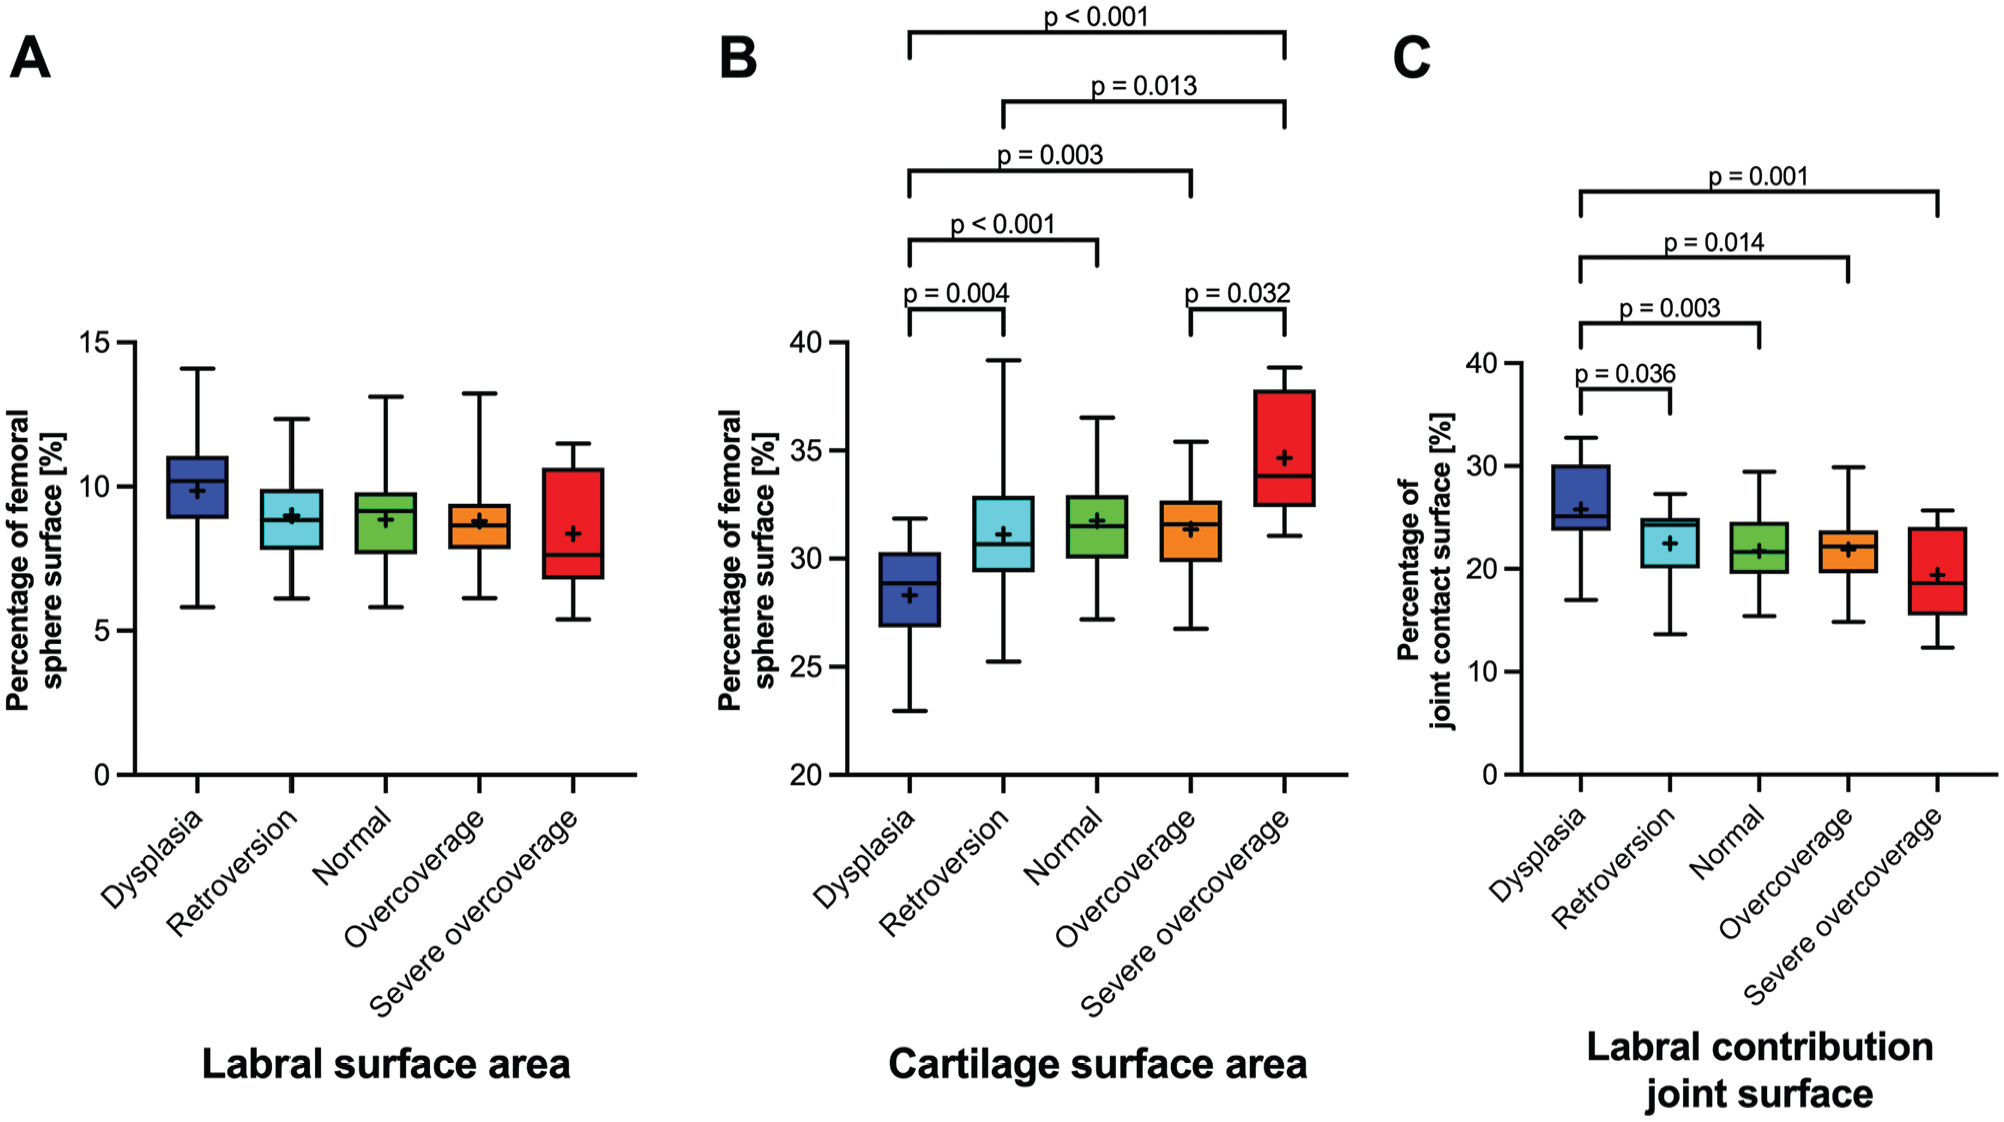
(A) Compared among hips with different acetabular deformities, the labral surface area did not differ. (B) In contrast, the cartilage surface area was decreased in dysplastic hips compared with all other deformities (P value range, <.001-.013). In hips with severe overcoverage, the cartilage surface area was increased compared with all other deformities (P value range, <.001-.032) except for normal hips (P = .055). (C) The mean labral contribution to the joint surface in dysplastic hips was 26% and increased compared with all other hip deformities (P value range, .001-.036) with a labral contribution to the joint surface ranging from 19% to 23%.
Comparison of Surface Area Cartilage and Labrum and Labral Contribution to Joint Surface Among the 5 Study Groups With Different Acetabular Morphologies a
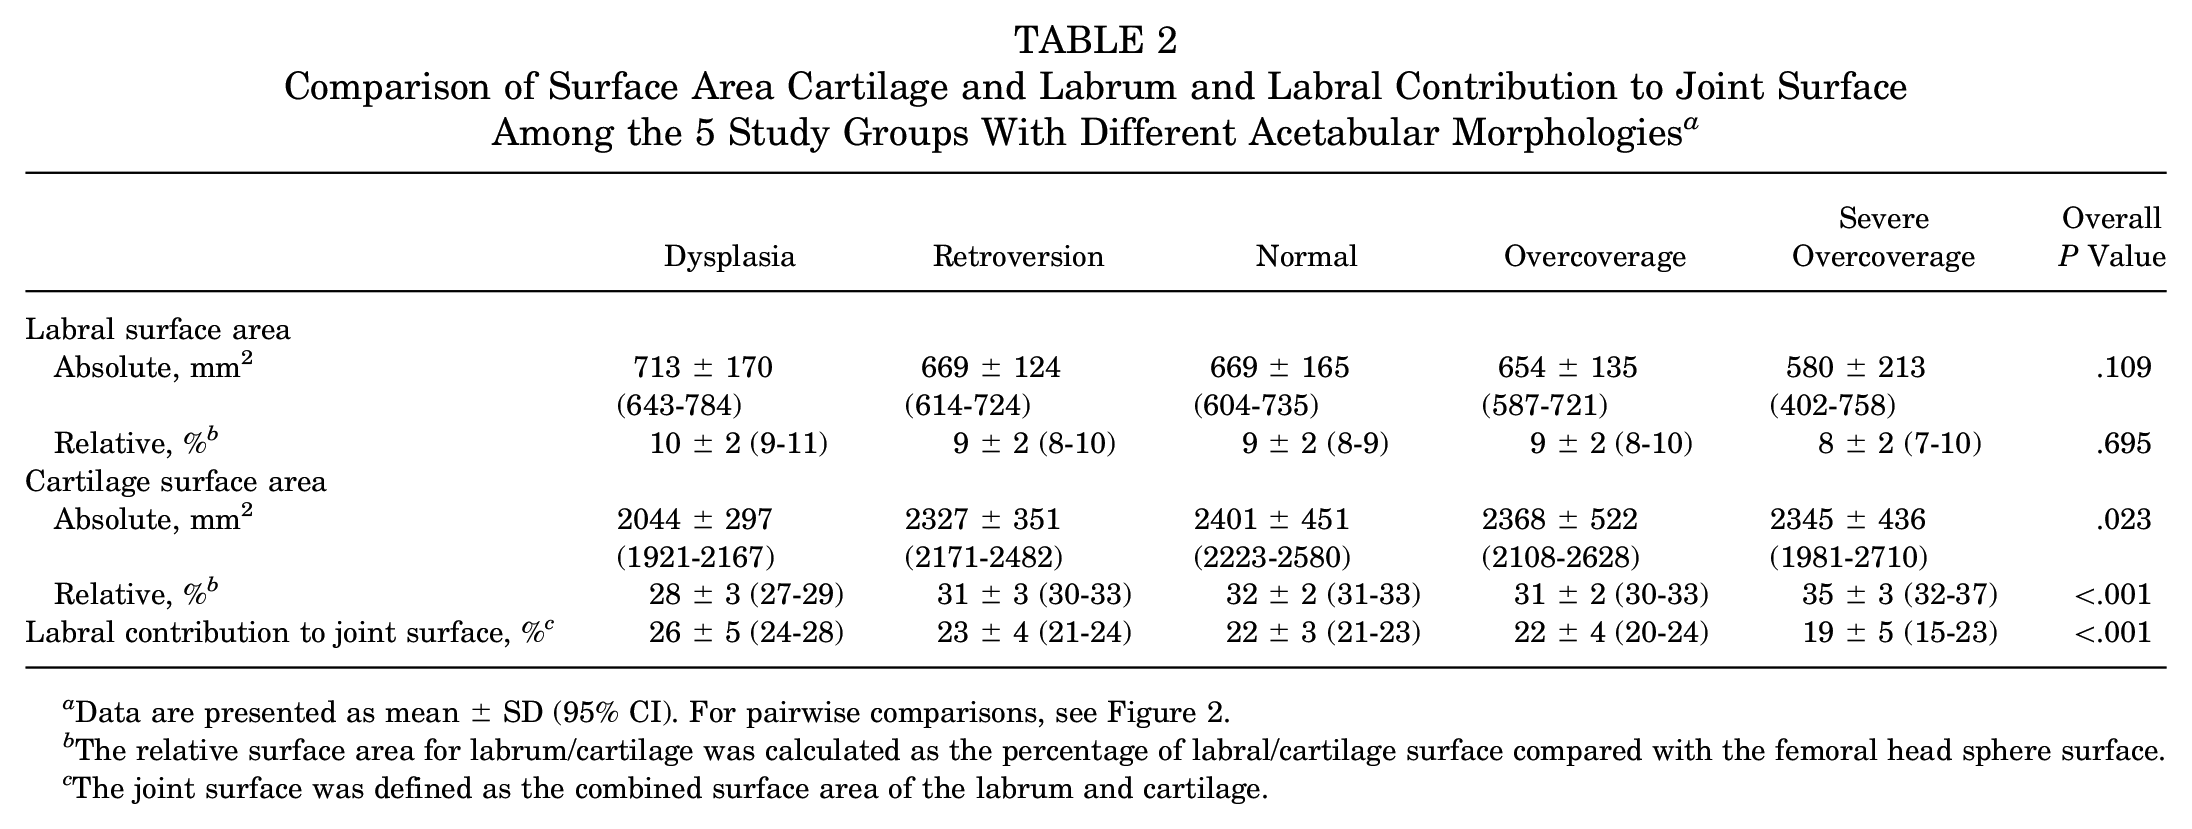
Data are presented as mean ± SD (95% CI). For pairwise comparisons, see Figure 2.
The relative surface area for labrum/cartilage was calculated as the percentage of labral/cartilage surface compared with the femoral head sphere surface.
The joint surface was defined as the combined surface area of the labrum and cartilage.
The labral part of the joint surface differed among hip deformities (P < .001). The mean labral part of the joint surface of dysplastic hips was 26% ± 5% (95% CI, 24%-28%) and increased compared with all other hip deformities (P value range, .001-.036) (Figure 2).
Simple regression analysis showed a significant linear relationship between the labral contribution to the joint surface and parameters of acetabular coverage, that is, LCE (R = −0.55; P < .001), acetabular index (R = 0.41; P < .001), and extrusion index (R = 0.55; P < .001), as well as femoral torsion (R = 0.25; P = .013) (Figure 3), which was measured according to Murphy et al.17,22 Multiple linear regression analysis revealed a high multicollinearity (VIF range, 3-28) among parameters for acetabular coverage. The highest multicollinearity was found for LCE, with a VIF of 28 (Table 3). Multiple linear regression analysis including only one of the acetabular parameters (LCE) showed a significant linear relationship between labral contribution to the joint surface and LCE (β = −.002; P < .001) as well as femoral torsion (β = .001; P = .008) with a moderate goodness of fit (R 2 = 0.35) (Table 3).
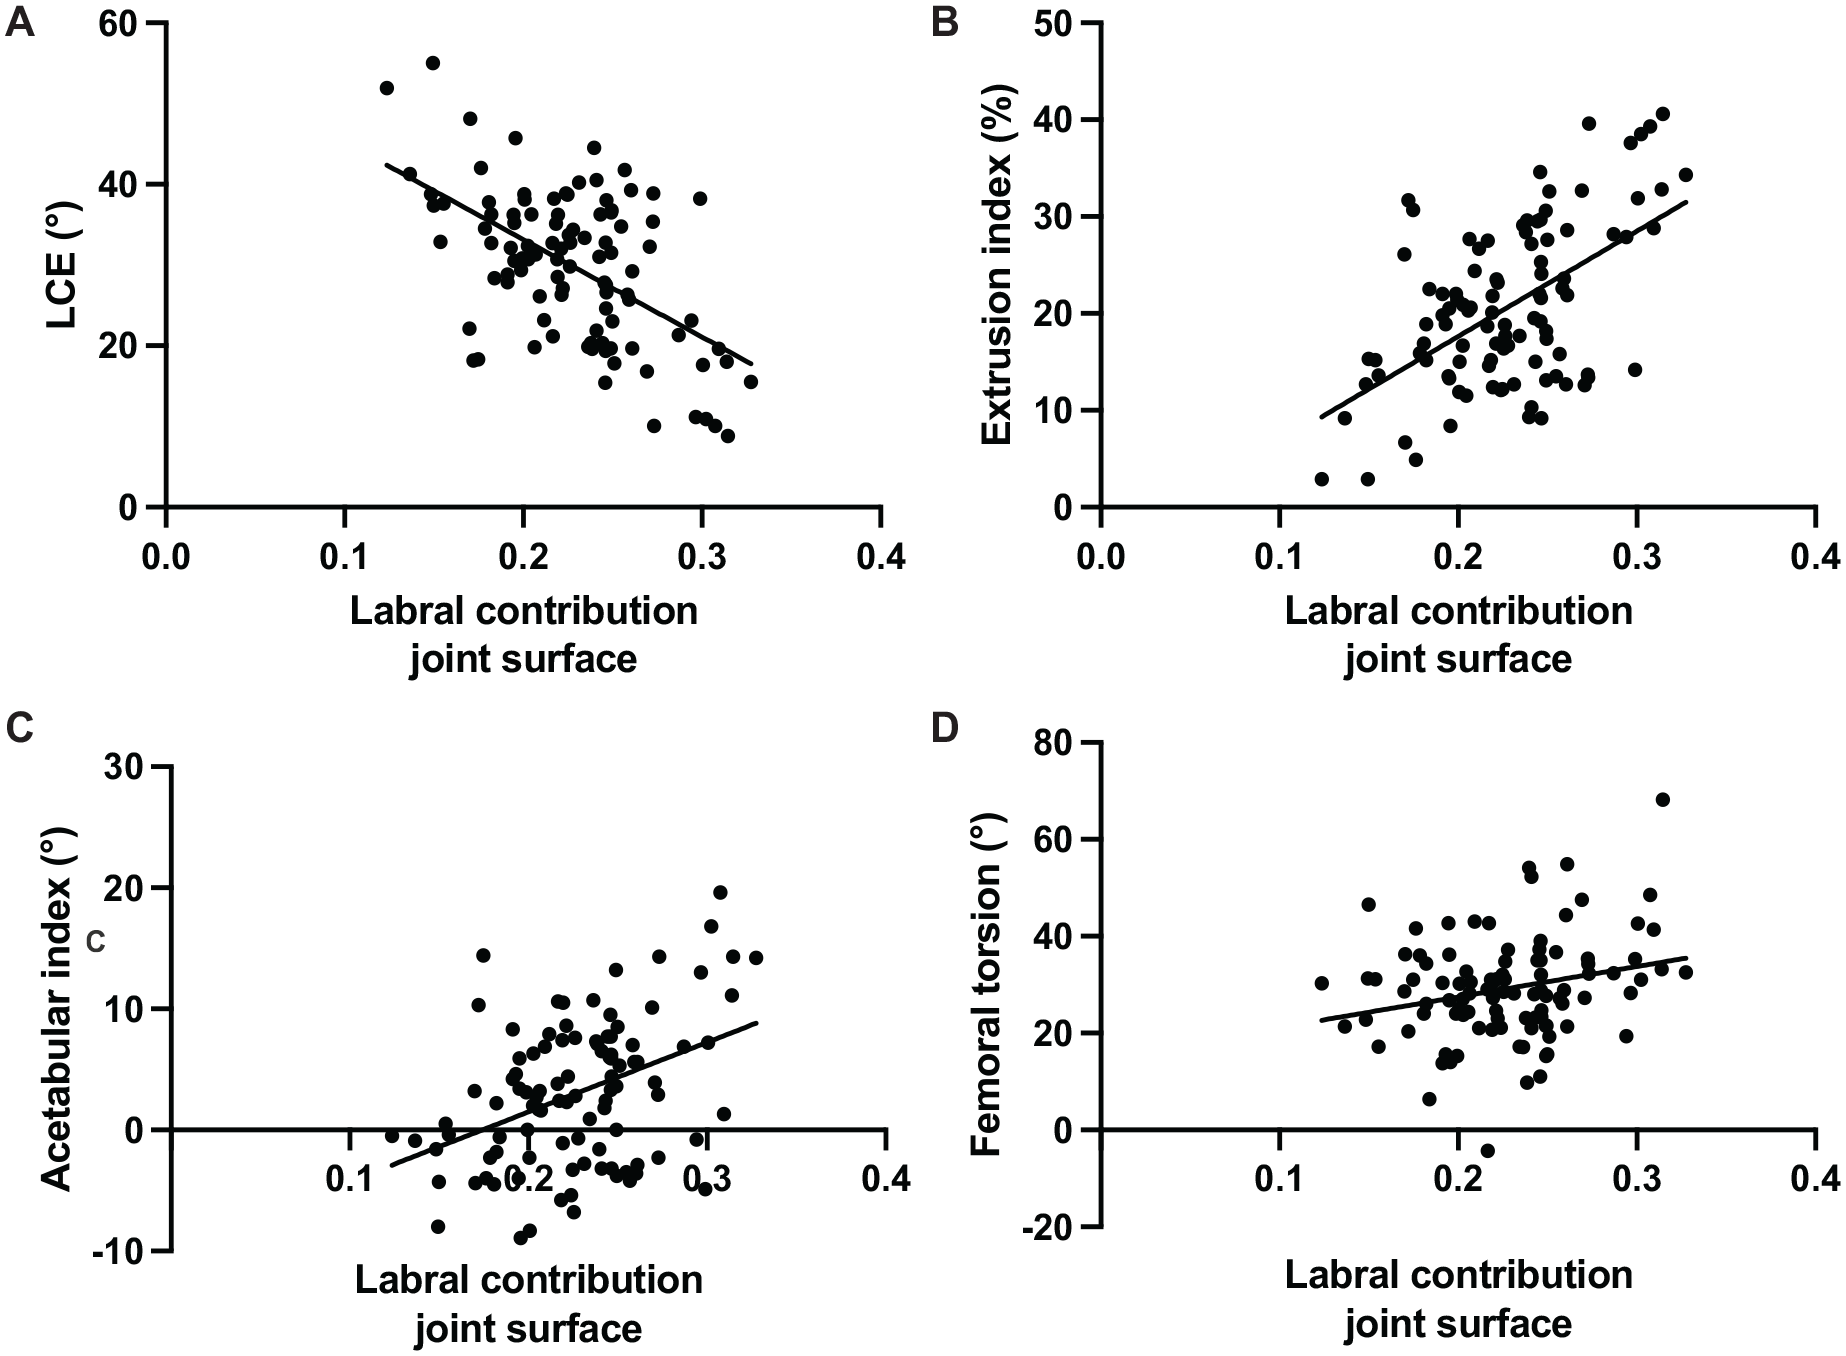
Simple regression analysis showed a moderate linear relationship (R value range, 0.4-0.59) between the labral contribution to the joint surface and parameters for acetabular coverage, including (A) lateral center-edge (LCE) angle, (B) extrusion index, and (C) acetabular index. (D) A low linear relationship (R < 0.4) was found between the labral contribution to the joint surface and femoral torsion.
Regression Analysis of Patient and Radiographic Parameters for Labral Part of Joint Surface a
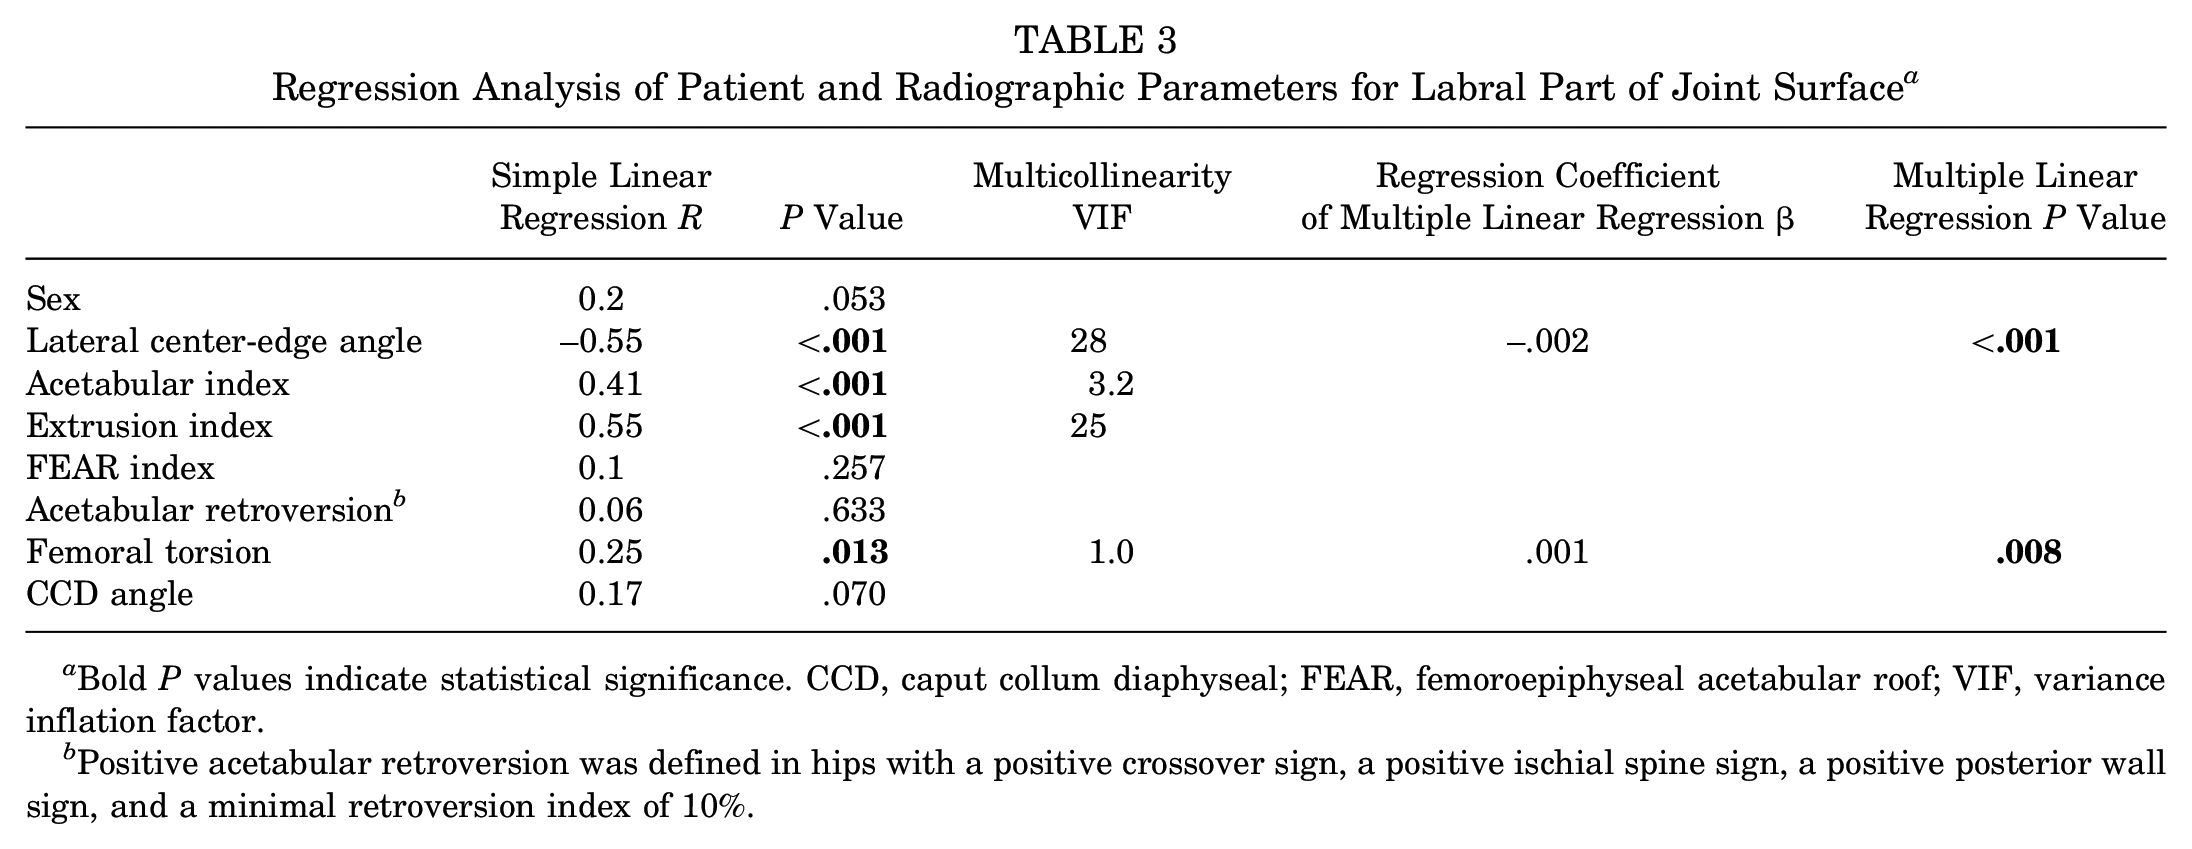
Bold P values indicate statistical significance. CCD, caput collum diaphyseal; FEAR, femoroepiphyseal acetabular roof; VIF, variance inflation factor.
Positive acetabular retroversion was defined in hips with a positive crossover sign, a positive ischial spine sign, a positive posterior wall sign, and a minimal retroversion index of 10%.
Discussion
The most important finding of this study is that the labral contribution to the joint surface is significantly increased in dysplastic hips compared with all other hip deformities (Table 2, Figures 2 and 4). This finding is in line with previous studies reporting an adaptation of the labrum to altered joint loading.5,28 Numerous studies12,14,28 have investigated 2D morphological parameters such as cross-sectional area or thickness of the labrum and have shown hypertrophy in dysplasia2,12,14,28 or hypotrophy in hips with protrusion. 28 However, some studies have shown a normal-size labrum or even a decreased size in everted labrum in dysplasia. 30 In the literature, the surface area of the labrum was evaluated in only 1 cadaveric study with 3D approximation showing a mean area of 8.0 cm2 (corresponding to 28% of the labral contribution to the joint surface) (Table 4). Hip deformities were not included in the evaluation of the labral surface area. 25 In the current study, labrum morphology was evaluated for the first time using deep learning for automatic 3D MRI segmentation, which allowed calculation of the surface area of 3D labrum and cartilage.
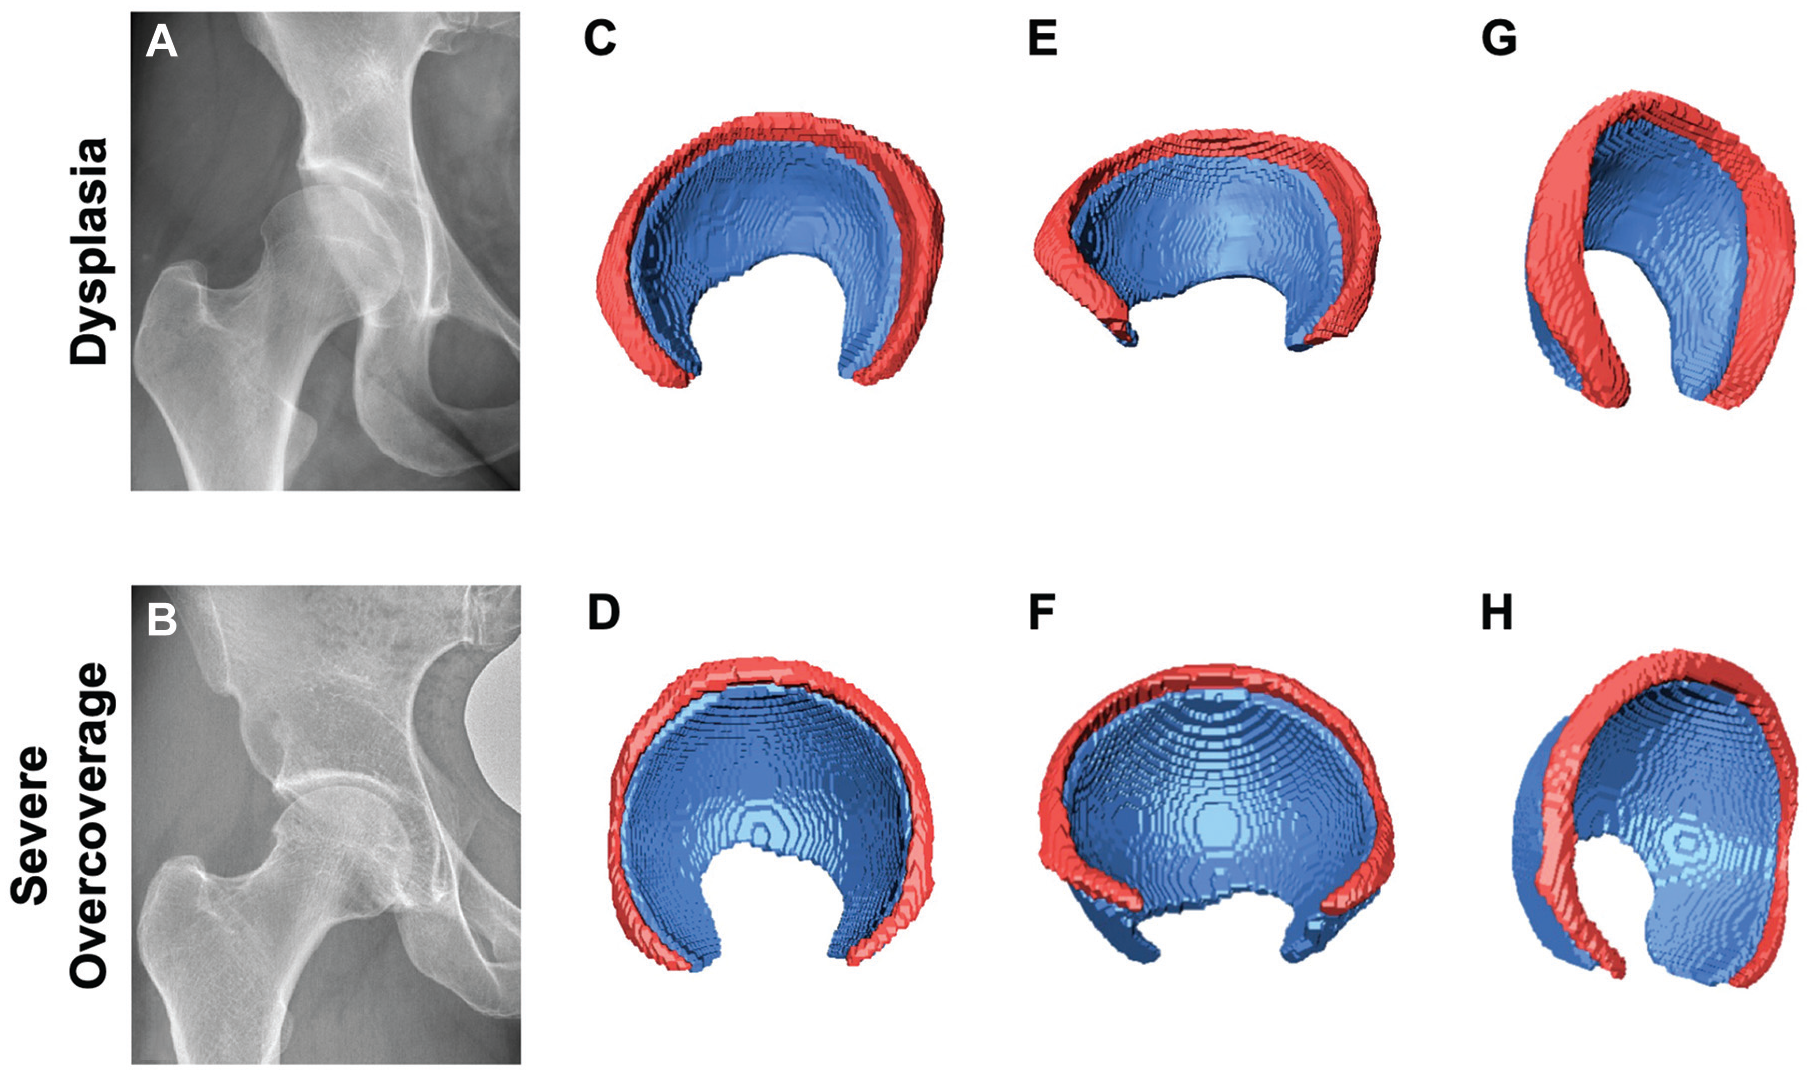
The labral contribution to the joint surface differed most between (A) hip dysplasia and (B) hips with severe acetabular overcoverage. Automatic segmentation of magnetic resonance imaging using a deep learning approach for labrum (red) and cartilage (blue) in (C) hip dysplasia and (D) a hip with severe acetabular overcoverage. In hip dysplasia, (E, G) the labrum contributed 33% to the joint surface, whereas (F, H) the labrum contributed 18% to the joint surface in the hip with severe acetabular overcoverage.
Selected Literature on Labrum and Cartilage Surface Area a
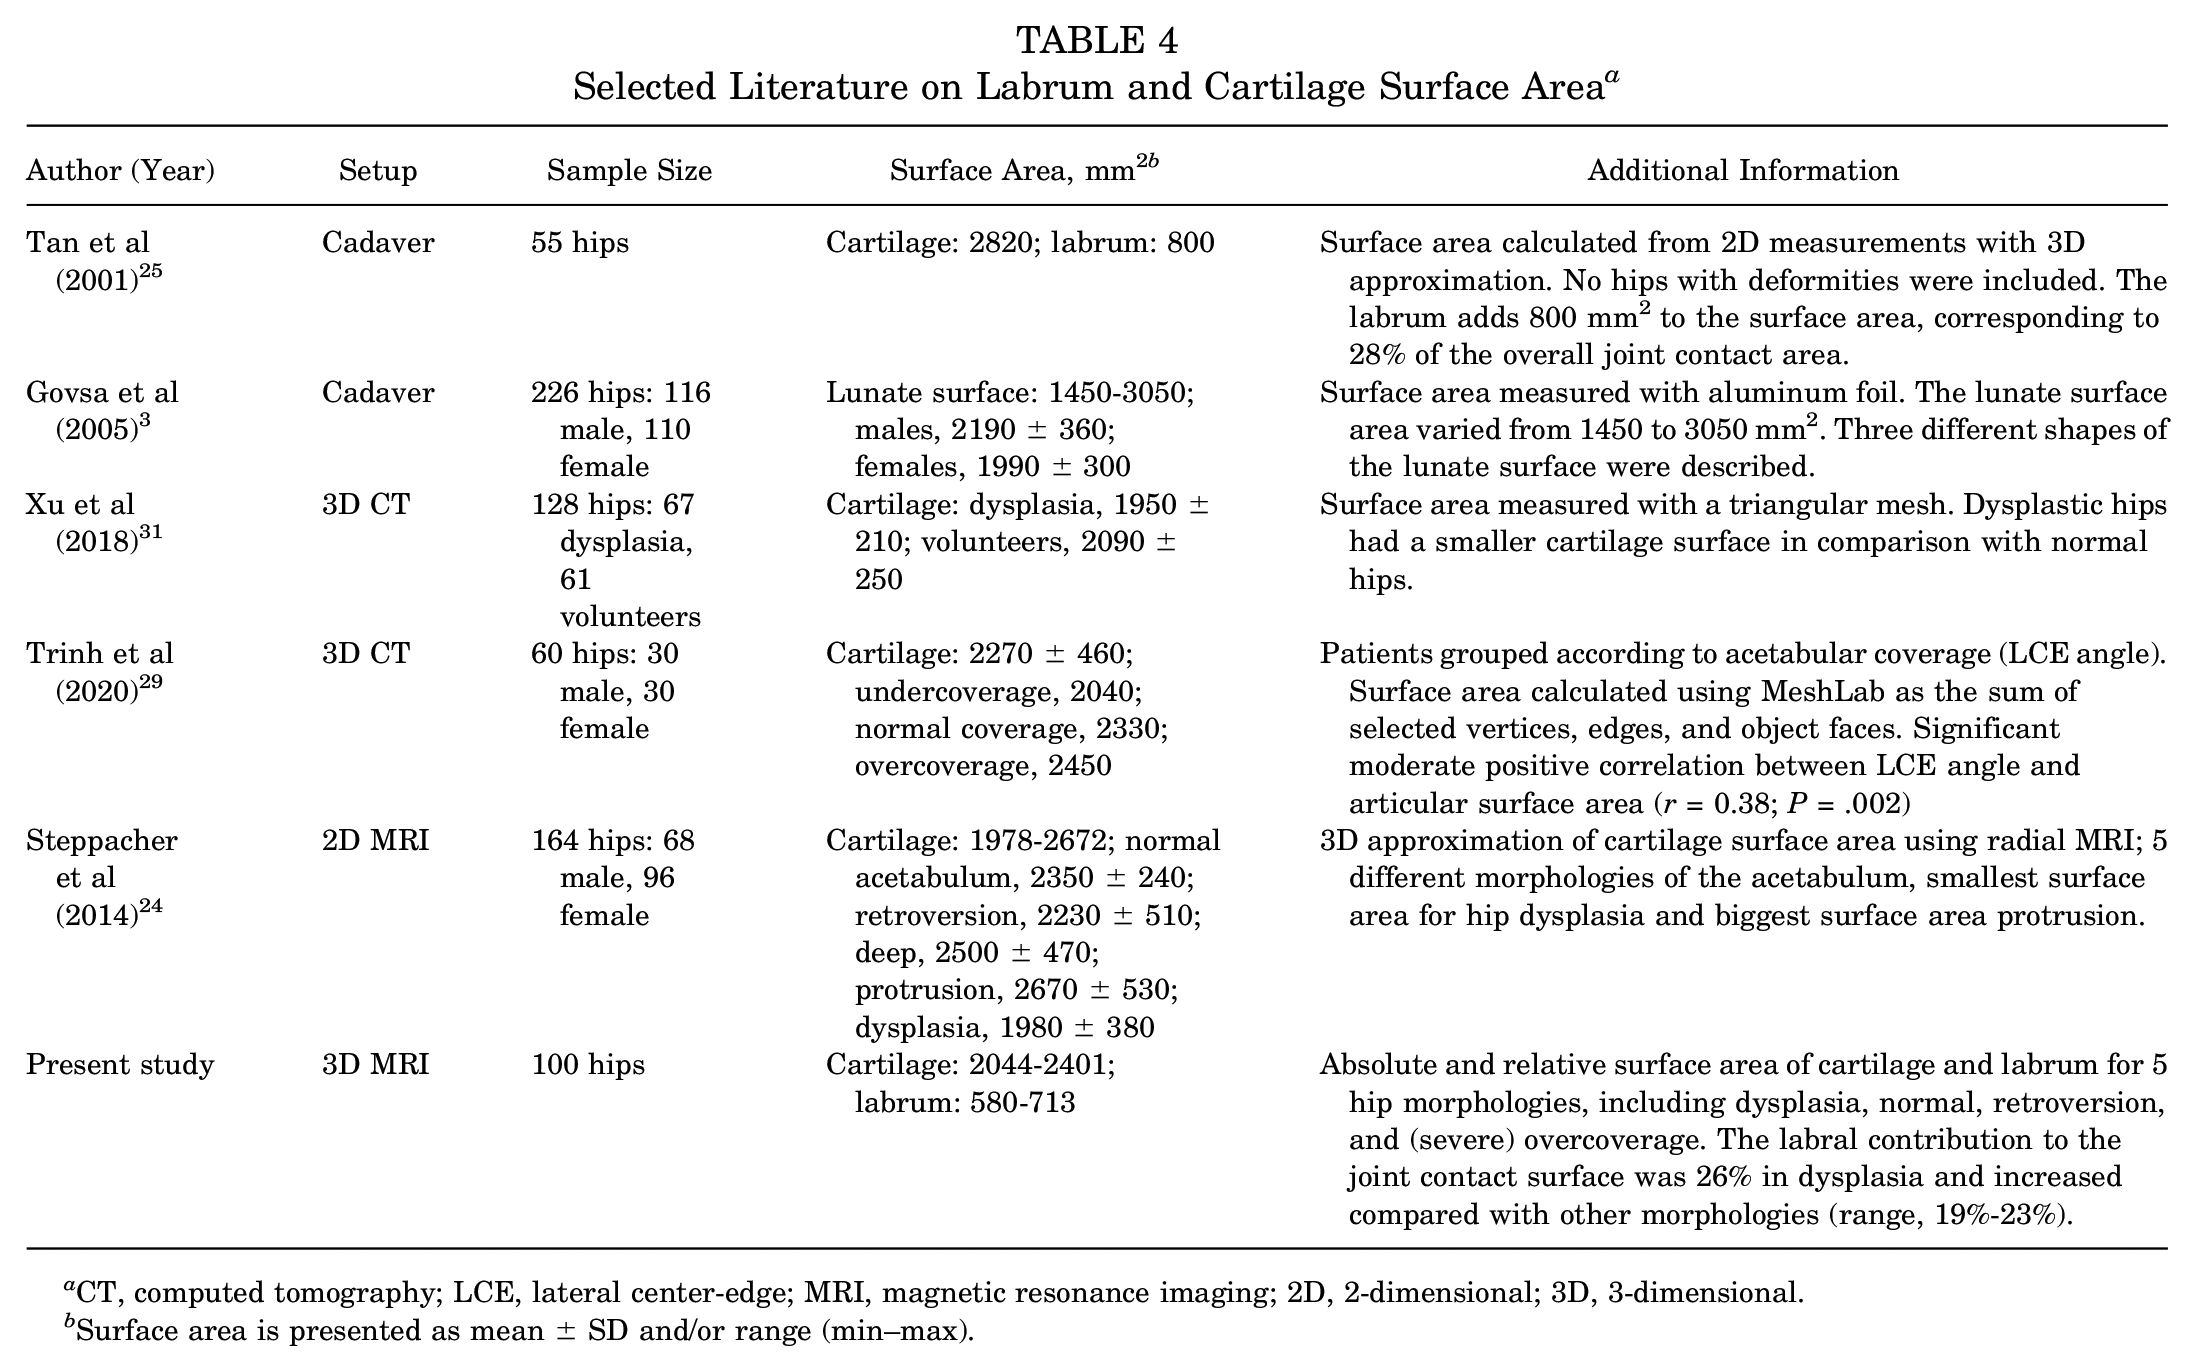
CT, computed tomography; LCE, lateral center-edge; MRI, magnetic resonance imaging; 2D, 2-dimensional; 3D, 3-dimensional.
Surface area is presented as mean ± SD and/or range (min–max).
The second finding of the study was that the labral contribution to the joint surface is influenced by the acetabular coverage and femoral torsion: an increased labral part of the joint surface was found with decreased acetabular coverage or increased femoral torsion (Table 3). Previous reports based on 2D MRI have shown an increasing size of the labrum with decreasing acetabular coverage. A moderate correlation between the LCE angle and size of the labrum (R value range, −0.5 to −0.7)2,18,28 was reported, which is in line with the current results (R = −0.55) (Table 3). These results indicate that standard radiographic parameters, such as the LCE angle, which are used to guide surgical decision-making, are only moderately representative of the labral contribution to the joint surface. This highlights the need for a more sophisticated tool for preoperative imaging to demask the underlying pathology, such as instability or femoroacetabular impingement. No association of the labrum morphology and femoral torsion has been reported. As revealed by the multilinear regression analysis in our study (Table 3), an increased labral contribution to the joint surface could be shown with increased femoral torsion. The identification of femoral torsion as an independent predictor for the labral contribution to the joint surface, as revealed by the multilinear regression analysis in our study, underscores the notion that hip instability is a complex pathomechanism not only associated with hip dysplasia.
An additional finding of this study was that cartilage surface area differed among different hip deformities (Table 2, Figure 2). The mean cartilage surface area in hip dysplasia was 2044 mm2 (28% of the femoral head sphere) and significantly decreased compared with all other deformities (all P < .05). In hip protrusion, the mean cartilage surface area was 2345 mm2 (35% of the femoral head sphere) and significantly increased compared with hip dysplasia, retroversion, and overcoverage (all P < .05). Of note, hips with acetabular retroversion showed a comparable cartilage surface area to hips with normal acetabular coverage. This is of clinical importance because rim trimming in hips with acetabular retroversion could result in a deficient acetabular surface area, resulting in hip dysplasia.
Similar findings were reported by Steppacher et al, 24 who measured the size of the lunate surface in patients with different hip deformities. They too reported significant differences in the size of the lunate surface between the different deformities investigated, with a decreased surface area of the lunate surface in patients with hip dysplasia and an increased lunate surface in patients with severe overcoverage. In addition, the surface area of hips with retroversion was significantly smaller compared with that of normal hips. 24 In contrast to the present study, these measurements were performed 2 dimensionally using the inner and outer center-edge angle and the width of the lunate surface. 24
This study has several limitations. The first and foremost limitation is the limited sample size. Nevertheless, division into subgroups according to hip deformities was possible. Further subdivision according to sex was not possible. The current study represents the largest patient series of automatic 3D segmentation of hip cartilage and labrum. In addition, sample size in the subgroups was not balanced, with only 8 hips in the severe overcoverage group (Table 1). This is explained by the consecutive patient selection and the differences in prevalence of the included hip deformities in the population. Another limitation of the present study is the fact that we evaluated the size of the joint surface but not the shape. Future studies should investigate whether differences in shape exist among hip deformities.
Conclusion
Three-dimensional MRI morphological analysis showed that the labral contribution to the joint surface differs among hip deformities and is influenced by lateral acetabular coverage and femoral torsion. It seems that the labrum adapts to instability of the hip joint due to either insufficient acetabular coverage or increased femoral torsion. Therefore, the labrum seems to have a stabilizing effect in these deformities. This is of diagnostic value because an increased labrum on MRI could be indicative for instability due to hip dysplasia or increased femoral torsion. This study paves the way for a more in-depth understanding of the underlying pathomechanism and a reliable 3D analysis of the hip joint that can be used for surgical decision-making.
Footnotes
Submitted February 8, 2024; accepted March 7, 2025.
One or more of the authors has declared the following potential conflict of interest or source of funding: This project was funded by the Swiss National Science Foundation (grant No. 320030_205091) as well as the Department of Teaching and Research, Insel Gruppe AG (84802159). F.S. has received speaking fees from Geistlich. AOSSM checks author disclosures against the Open Payments Database (OPD). AOSSM has not conducted an independent investigation on the OPD and disclaims any liability or responsibility relating thereto.