
Abstract
Background:
Changes in systemic biomarkers of chondral metabolism have been identified after anterior cruciate ligament (ACL) reconstruction. Patients with extremely high biomarker concentrations (outlier patients) are often observed and may represent a group at high risk for posttraumatic arthritis. It is unclear if outlier status changes over time, and if it can be explained by patient, injury, and surgical factors.
Purpose:
To evaluate outlier status changes over time for 3 biomarkers of chondral metabolism after ACL injury and reconstruction and describe factors associated with outlier status.
Study Design:
Cohort study; Level of evidence, 2.
Methods:
Patients from a prospective longitudinal study were included. Urine and serum samples were taken immediately before primary ACL reconstruction and at 6 and 12 months postoperatively. A total of 666 patients provided samples (mean age, 24.9 years; 60.5% male). Concentrations of urinary C-terminal cross-linked telopeptide of type 2 collagen (u-CTX-II), serum N-propeptide of collagen 2A (s-PIIANP), and serum matrix metalloproteinase 3 (s-MMP-3) were measured using immunoassays. Outlier status was defined as values above quartile 3 plus 1.5 times the interquartile range for each biomarker. Multivariable logistic regression models were developed with biomarker outlier status as the dependent variable and patient, injury, and surgical factors as explanatory variables.
Results:
At the baseline time point, the proportion of outliers was 9.29% for u-CTX-II, 1.97% for s-PIIANP, and 12.42% for s-MMP-3. Outlier patients at baseline were commonly also outliers at one or both of the future time points in terms of u-CTX-II (88.3%) and s-MMP-3 (82.93%). In contrast, for s-PIIANP outlier patients at baseline, only 15.38% were outliers at a future time point. It was uncommon for nonoutlier patients at baseline to become an outlier at either of the future time points (u-CTX-II: 6.83%; s-PIIANP: 2.32%; s-MMP-3: 2.08%). Patient and surgical factors had poor ability to discriminate between outlier and nonoutlier patients for s-PIIANP (Tjur R2 = 0.056) and s-MMP-3 (Tjur R2 = 0.013). However, for u-CTX-II (Tjur R2 = 0.598), younger age, shorter time from injury to surgery, lower body mass index, and male sex were independently associated with outlier u-CTX-II concentrations at baseline.
Conclusion:
Outlier patients were observed when measuring all 3 systemic biomarkers of chondral metabolism after ACL reconstruction. For s-PIIANP and sMMP-3, outlier status was poorly explained by patient or surgical factors, but for u-CTX-II, outlier status could, in part, be explained by patient and surgical factors. These results support longitudinal biomarker analyses, given that outlier status can change over time, and this may not be identified in cross-sectional study designs.
Injury to the anterior cruciate ligament (ACL) is an established risk factor for posttraumatic osteoarthritis (OA) of the knee.24,25,41,42 The population with ACL injuries is unique, as despite this elevated risk of future OA, there is typically a low prevalence of OA at the time of injury in this young and active patient population.25,41-43 The lead time between injury and disease onset makes the population with ACL injuries an attractive group in which to try to identify markers of preclinical disease activity. Such markers may in turn allow better risk stratification or potentially facilitate targeted interventions to mitigate OA risk.22,23
Local (synovial fluid) and systemic (serum and urinary) biomarkers of chondral metabolism are an emerging area of research interest after ACL injury and reconstruction. ‡‡ Biomarkers reflecting many different metabolic pathways are available 30 ; however, in the context of OA, biomarkers evaluating type 2 collagen metabolism are commonly advocated.5,15,30 Biomarkers of type 2 collagen metabolism have been shown to differ between the population with ACL injuries and control patients.8,14,15,20,39
C-terminal cross-linked telopeptide of type 2 collagen (CTX-II), a marker of type 2 collagen degradation; N-propeptide of collagen 2A (PIIANP), a marker of type 2 collagen synthesis; and matrix metalloproteinase 3 (MMP-3), a mediator in chondral matrix degradation, have been investigated or are thought to hold promise as biomarkers of posttraumatic OA after ACL injury. §§ A common observation in this emerging body of literature is the presence of patients with extremely high, or outlier, biomarker concentrations.2,11,16,18,27,33 The implications of outlier patients are important. In pilot testing for this current series, the inclusion of a single outlier patient tripled the mean urinary CTX-II (u-CTX-II) concentration for the entire pilot cohort of 22 patients. 6 Outliers can make data presentation and interpretation challenging, with dramatically different mean and median values being reported due to skewing of the data set. Logarithmic transformation of data is commonly used to manage these data.8,10,19,37
Outlier patients may, however, be a very important group in this line of research. Outliers could represent patients with extreme levels of disease activity and those at the highest risk of future OA. When considering conceptual OA models proposing phasic, nonlinear OA disease activity (Figure 1),23,35 outlier status may be very important and occur due to sampling at times of extreme activity. On the other hand, it is also possible that patients have intrinsically different biomarker concentrations and outlier status may not necessarily be pathological at the individual patient level. Either way, understanding this group of outlier patients is important. It is unclear what differentiates these patients from nonoutlier patients and how outlier status evolves with time after ACL reconstruction.
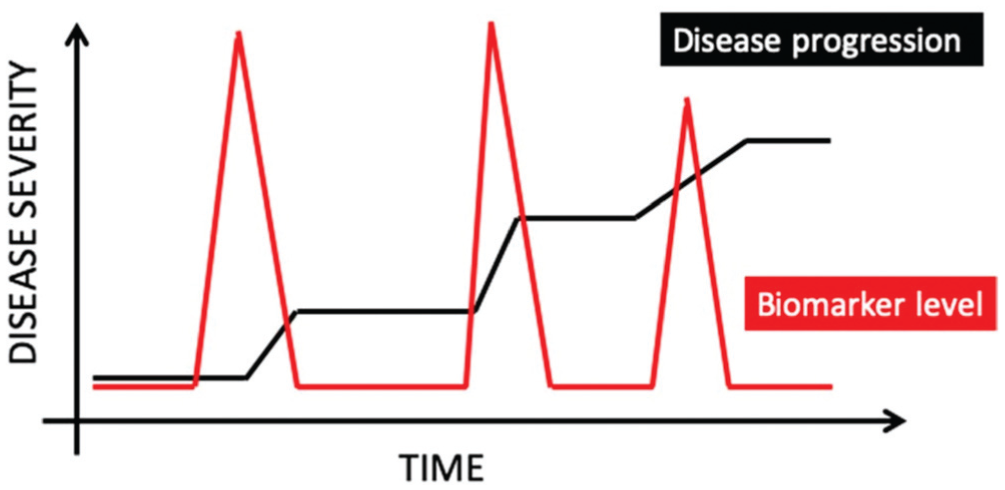
Outlier status may reflect patients with high levels or peaks in disease activity. Reproduced with permission from Kraus VB, Karsdal MA. Osteoarthritis: Current Molecular Biomarkers and the Way Forward. Calcif Tissue Int. 2021;109(3):329-338. © Springer Science and Business Media, LLC, part of Springer Nature 2020. 22
The aim of this study was to explore the group of patients with ACL reconstruction with outlier values in terms of 3 biomarkers of chondral metabolism (u-CTX-II, serum PIIANP [s-PIIANP], and serum MMP-3 [s-MMP-3]). Specific aims were to determine if outlier patients at baseline (time of surgery) remained an outlier on repeat testing at the 6-month and 12-months postoperative time points, and if patient, injury, or surgical factors could help differentiate between outlier and nonoutlier patients.
Methods
Ethical Approval
Human Research Ethics Committee approval was obtained for this study (Epworth HealthCare 57012).
Participants
The study population was from a prospective longitudinal investigation of 692 knees in 683 patients undergoing ACL reconstruction at a private orthopaedic clinic in Melbourne, Australia. Inclusion criteria for the longitudinal study were all patients aged between 14 and 45 years with a primary ACL injury requiring reconstructive surgery. Exclusion criteria were multiple ligament knee injuries requiring surgical attention and inability for the patient to return for the required follow-up. Nine patients had both of their knees included in the study. The longitudinal study protocol planned for urine and blood samples to be taken immediately preoperatively (baseline) and at the 6- and 12-month postoperative time points. From the longitudinal study, 666 patients (97.5%) provided blood and/or urine samples at a minimum of 1 time point, forming the current study cohort. Patient characteristics are presented in Table 1.
Patient Characteristics (N = 666) a
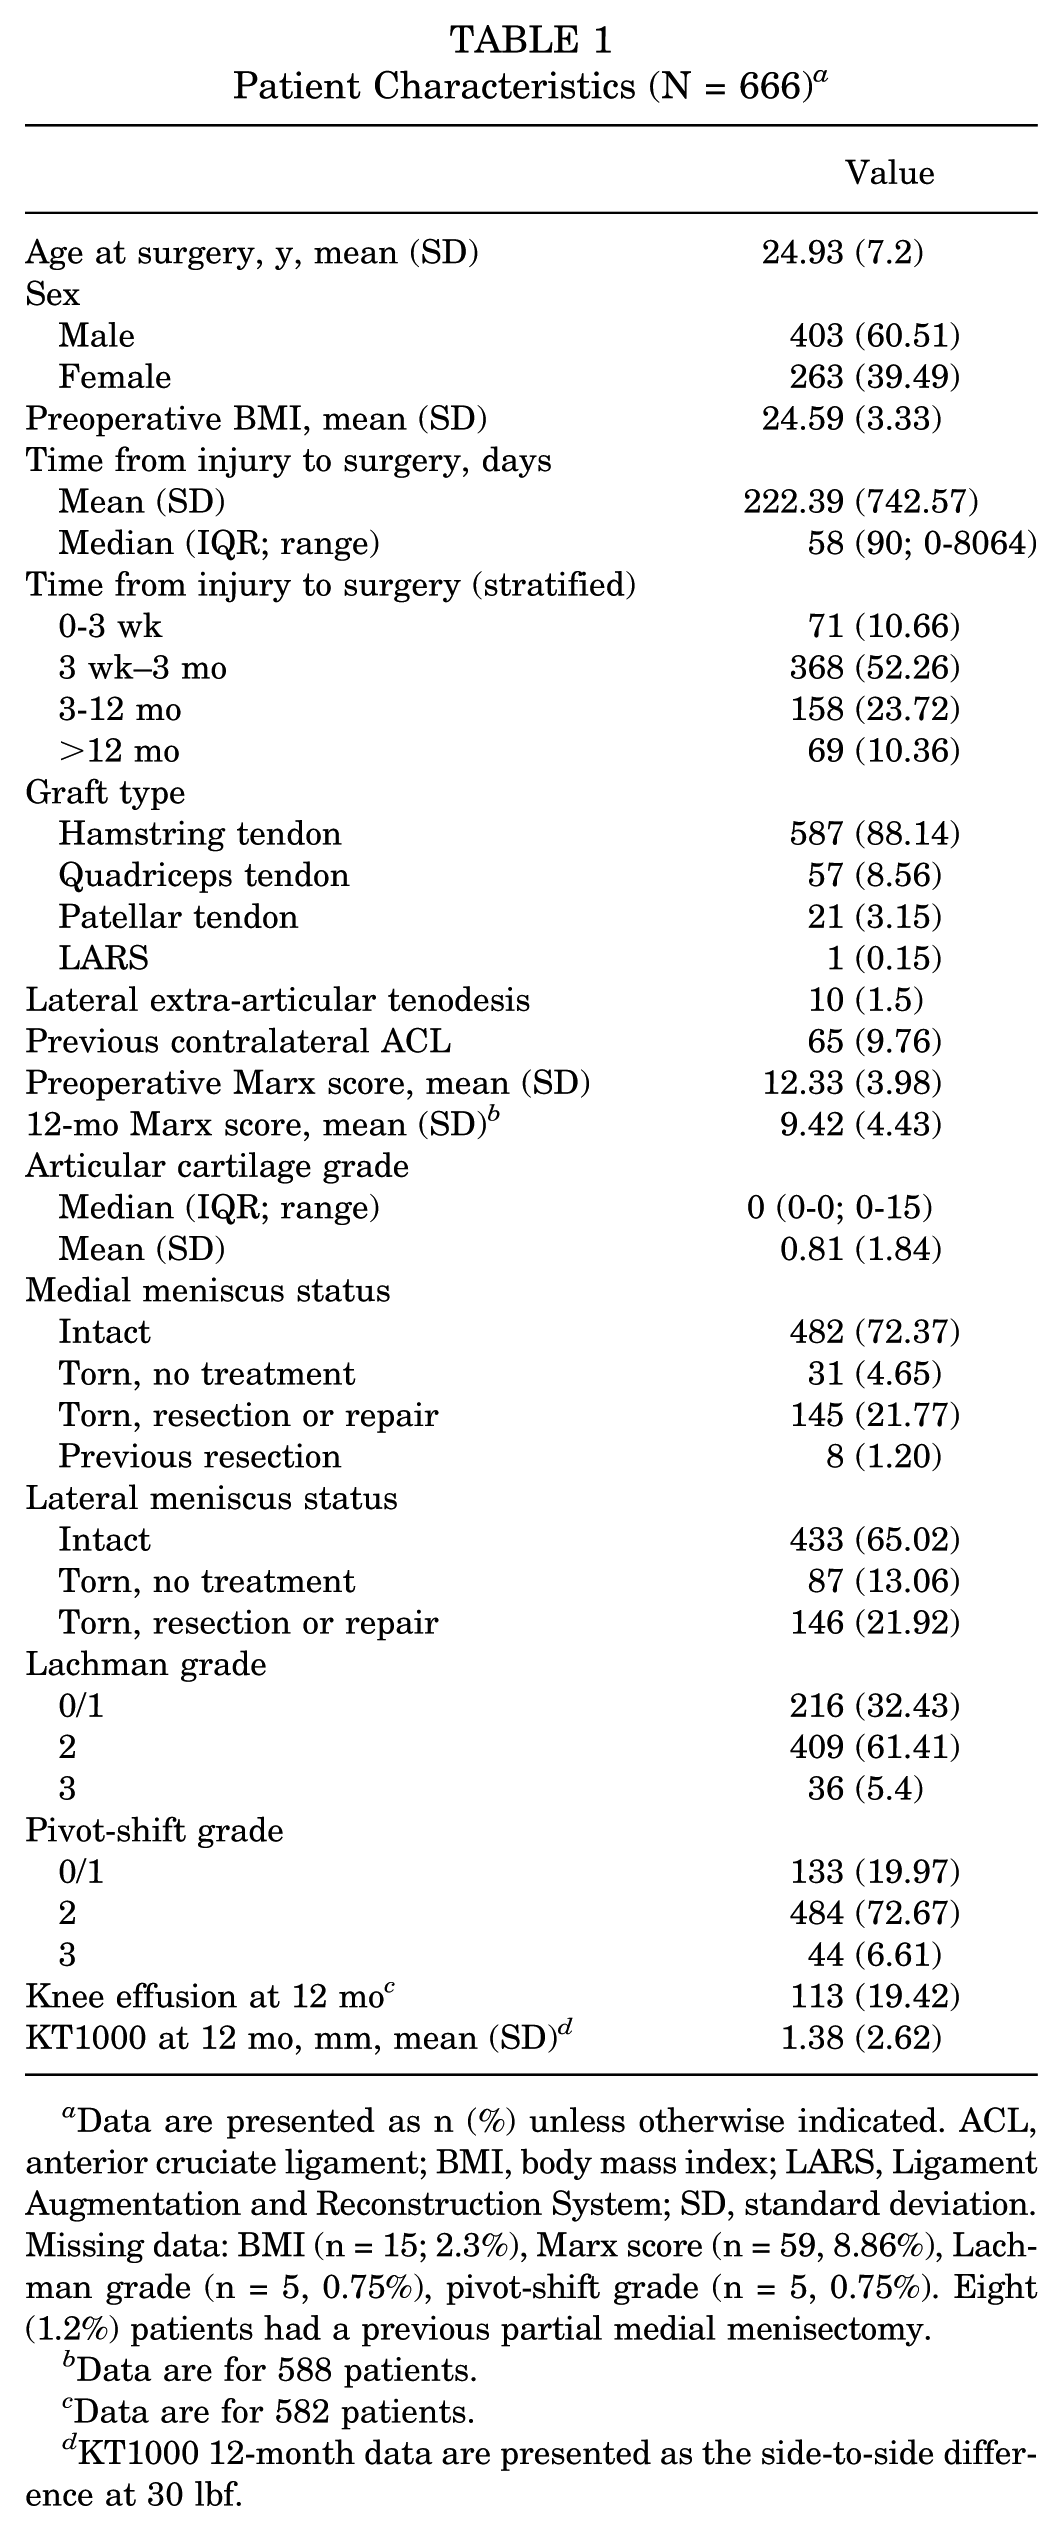
Data are presented as n (%) unless otherwise indicated. ACL, anterior cruciate ligament; BMI, body mass index; LARS, Ligament Augmentation and Reconstruction System; SD, standard deviation. Missing data: BMI (n = 15; 2.3%), Marx score (n = 59, 8.86%), Lachman grade (n = 5, 0.75%), pivot-shift grade (n = 5, 0.75%). Eight (1.2%) patients had a previous partial medial menisectomy.
Data are for 588 patients.
Data are for 582 patients.
KT1000 12-month data are presented as the side-to-side difference at 30 lbf.
Surgical Details
Anatomic single-bundle ACL reconstruction was performed with anteromedial portal femoral tunnel drilling. Graft type and intraoperative meniscal status are detailed in Table 1. A modified Ellison extra-articular tenodesis was performed selectively based on surgeon assessment of the risk of reinjury and knee laxity (Table 1). During the first 12 months postoperatively, the following complications were observed: superficial wound infection (n = 3), restricted range of motion (n = 19), a new meniscal tear (n = 4), ACL graft rupture (n = 12), contralateral ACL rupture (n = 2), and pulmonary embolus (n = 1).
Pre- and Intraoperative Data Collection
A preoperative questionnaire was completed by all participants. Patient data included age, sex, body mass index (BMI), and the Marx Activity Rating Scale (MARS) score. Time from injury to surgery and previous contralateral ACL injury were recorded. Operative details were recorded by the treating surgeon at the time of surgery on a standardized data collection sheet. Lachman and pivot-shift grades were recorded under anesthesia using the International Knee Documentation Committee grading system. 16 Grades 0 and 1 were combined for analysis given the very low numbers of grade 0 recordings for both the Lachman and pivot-shift tests. Chondral status was assessed arthroscopically at the time of surgery using a modified International Cartilage Regeneration & Joint Preservation Society classification system, recording the grade but not subgrade of chondral injuries. 7 To account for both the severity and extent of chondral disease in the knee, the maximum grade (range, 0-4) on each surface (ie, tibial and femoral) in each compartment (medial, lateral, and patellofemoral) was tallied. This created a 30-point ordinal scale used for analysis called the “articular cartilage grade.” The medial and lateral menisci were scored as “torn” or “not torn.” To differentiate between less severe and more severe meniscal injuries, data were analyzed as “meniscus intact,” “meniscus torn with no treatment,” and “meniscus torn with a repair or partial menisectomy,” the latter reflecting more significant injuries. These 11 variables were used as explanatory variables in the data analysis.
Biomarker Collection and Storage
Samples were collected and stored based on recommendations from the Biomarkers Working Group. 22 Baseline blood samples were taken on admission to the hospital or at induction of anesthesia and were always taken before commencement of the ACL reconstruction. Six- and 12-month samples were taken by a research assistant at the follow-up clinic appointment. Serum samples were collected in a serum separating tube and immediately inverted gently 3 to 5 times and then left to clot at room temperature. These were subsequently centrifuged at 2500g for 10 minutes and stored in 2-mL cryovial aliquots at −80°C.
Baseline urine samples were taken on admission to hospital on the day of surgery. Repeat urine samples were taken at 6 and 12-month follow-up appointments. Urine samples were never a first morning void. Samples were taken at differing time points during the day due to logistical reasons. Samples were centrifuged at 1300g for 10 minutes to remove debris and stored in 1.5-mL cryovial aliquots at −80°C. All specimens were stored in a −80°C freezer with continuous temperature monitoring and alarm.
Of the 683 patients included in the longitudinal study, 666 (97.5%) had blood and/or urine samples at ≥1 time points, forming the study cohort. In total, 547 (82.1%) had blood samples at all 3 time points and 552 (82.9%) had urine samples at all 3 time points. Sample collections rates at each time point are summarized in Table 2.
Sample Collection Rates
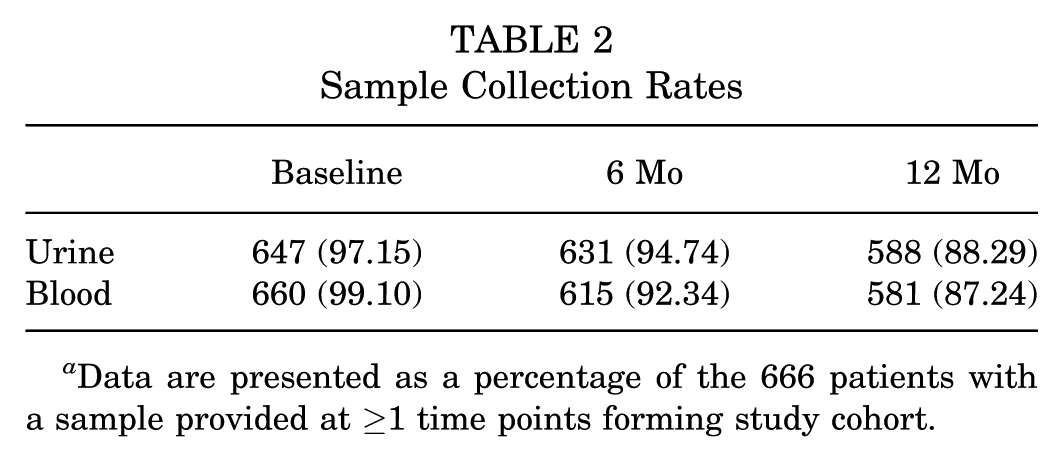
Data are presented as a percentage of the 666 patients with a sample provided at ≥1 time points forming study cohort.
Biomarker Testing and Analysis
All testing was performed in duplicate in accordance with the manufacturer’s instructions. Urine CTX-II concentrations were measured with a commercially available competitive enzyme-linked immunosorbent assay (ELISA; CartiLaps IDAC10F1 ELISA; Immunodiagnostic Systems Holdings Ltd). The intra-assay coefficient of variation (CV) was 2.76%, and the interassay CV was 3.47%. Concentrations of urine CTX-II were subsequently normalized to urinary creatinine measured using a commercially available colorimetric assay (EIACUN; Thermo Fisher Scientific). Corrected values are presented as nanograms of CTX-II per millimoles of creatinine. Serum PIIANP concentrations were measured using a commercially available competitive ELISA (MBS109368; MyBioSource). The intra-assay CV was 5.03%, and the interassay CV was 8.7%. Serum concentrations of MMP-3 were measured with a commercially available sandwich ELISA (ELH-MMP3; RayBiotech Life Inc). One patient had an MMP-3 value below the lower limit of quantification (300 pg/mL), and this data point was excluded. The intra-assay CV was 7.21%, and the interassay CV was 8.72%.
Outlier Thresholds
No patients were considered a “low-value outlier” for any biomarker at any time point. Given this, “outlier” is used to refer to “high-value outlier” throughout the paper. Per definition, in terms of u-CTX-II, at the baseline, 6-month, and 12-month time points, the outlier thresholds were 6332 ng/mmol Cr, 2728 ng/mmol Cr, and 2224 ng/mmol Cr, respectively. For s-PIIANP, at the baseline, 6-month, and 12-month time points, the outlier thresholds were 45.7 ng/mL, 58.9 ng/mL, and 57.8 ng/mL, respectively. For s-MMP-3, at the baseline, 6-month, and 12-month time points, the outlier thresholds per the definition were 76.7 ng/mL, 91.3 ng/mL, and 93.98 ng/mL, respectively
Statistical Analysis
Summary statistics are presented as described. Biomarker data commonly follow a right-skewed distribution. Although outliers could theoretically be high or low outliers, because of this distribution, the more common scenario is for high-value outliers, which is the focus of this investigation. For completeness, however, low-value outliers were also assessed for. Outlier status was therefore defined as Q1 − 1.5 interquartile range or Q3 + 1.5 IQR for each biomarker, as has been used in biomarker investigations in other patient populations. 21 It has been demonstrated that biomarker concentrations change over time after ACL injury and reconstruction.8,14,29,36,39 Because of this, the outlier definition was applied to each time point (as opposed to applying the numeric outlier threshold from the baseline time point to the 6 and 12 months postoperative time points). A logistic regression model with outlier status as the dependent variable and the patient and surgical data points as explanatory variables was developed for each biomarker at the baseline and 12-month time points. A 2-tailed approach was used. Tjur R2 values were calculated for each model. Tjur R2 represents the mean difference in predicted probabilities between the positive and negative outcome groups, serving as a measure of how well the model distinguishes between these groups (in this case, outlier and nonoutlier patients). It is scored between 0 and 1, with 1 representing best possible performance. A sensitivity analysis was performed to explore the effect of a previous contralateral injury by rerunning the models with this patient group excluded. Statistical significance was set at a P value <.05.
Results
The number and proportion of patients identified as outliers in terms of each biomarker at each time point are detailed in Table 3.
Number and Proportion of Outlier Patients at Each Time Point a
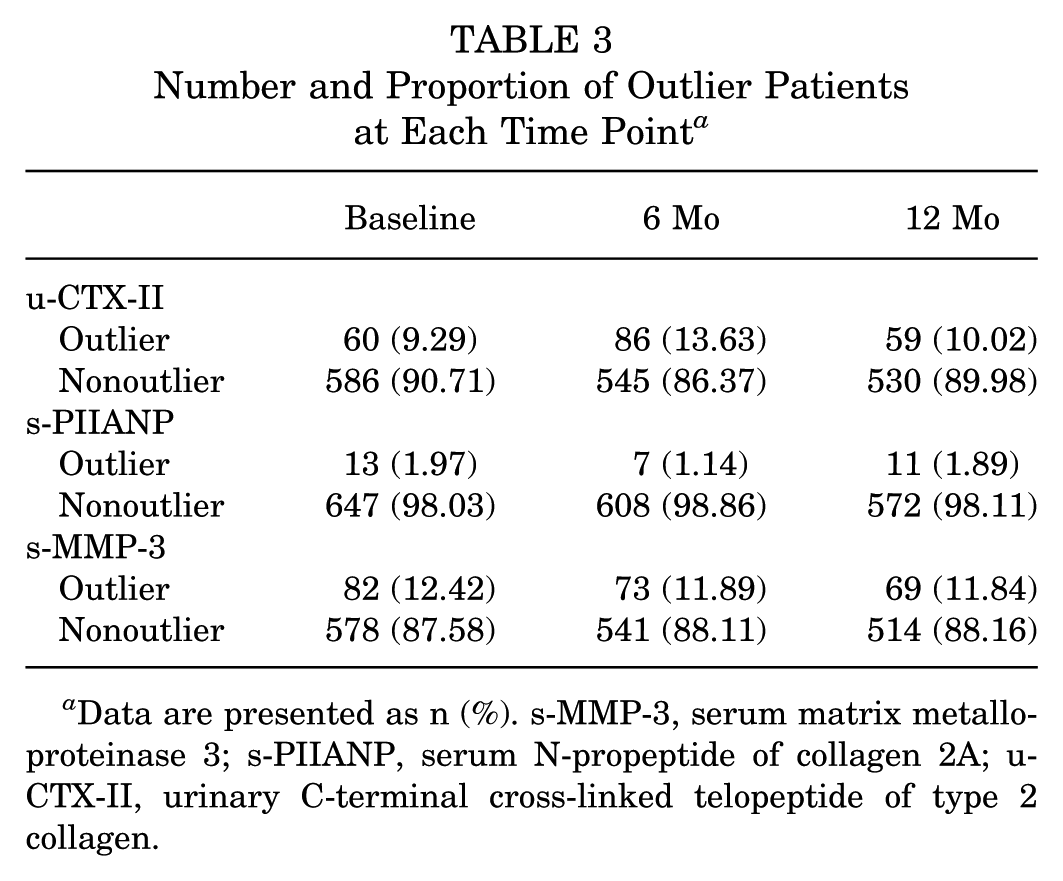
Data are presented as n (%). s-MMP-3, serum matrix metalloproteinase 3; s-PIIANP, serum N-propeptide of collagen 2A; u-CTX-II, urinary C-terminal cross-linked telopeptide of type 2 collagen.
Figures 2 to 4 demonstrate the outlier status for each biomarker, at each time point graphically.
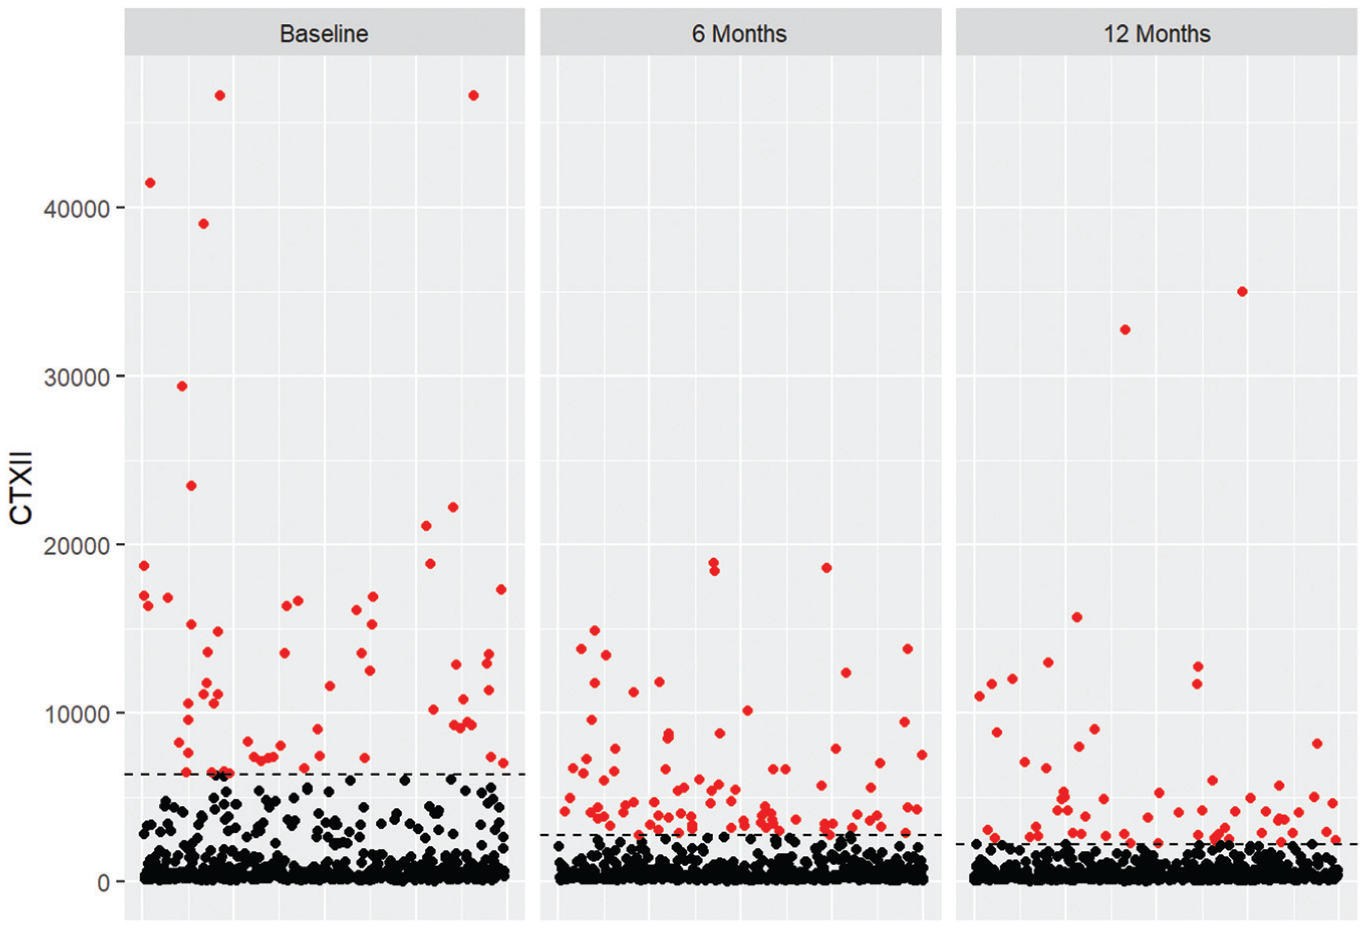
Scatterplot of urinary C-terminal cross-linked telopeptide of type 2 collagen (CTXII) concentrations (in ng/mmol Cr) at the baseline, 6-month, and 12-month time points. Red dots represent outlier patients, and the horizontal dotted line represents the outlier threshold at each time point.
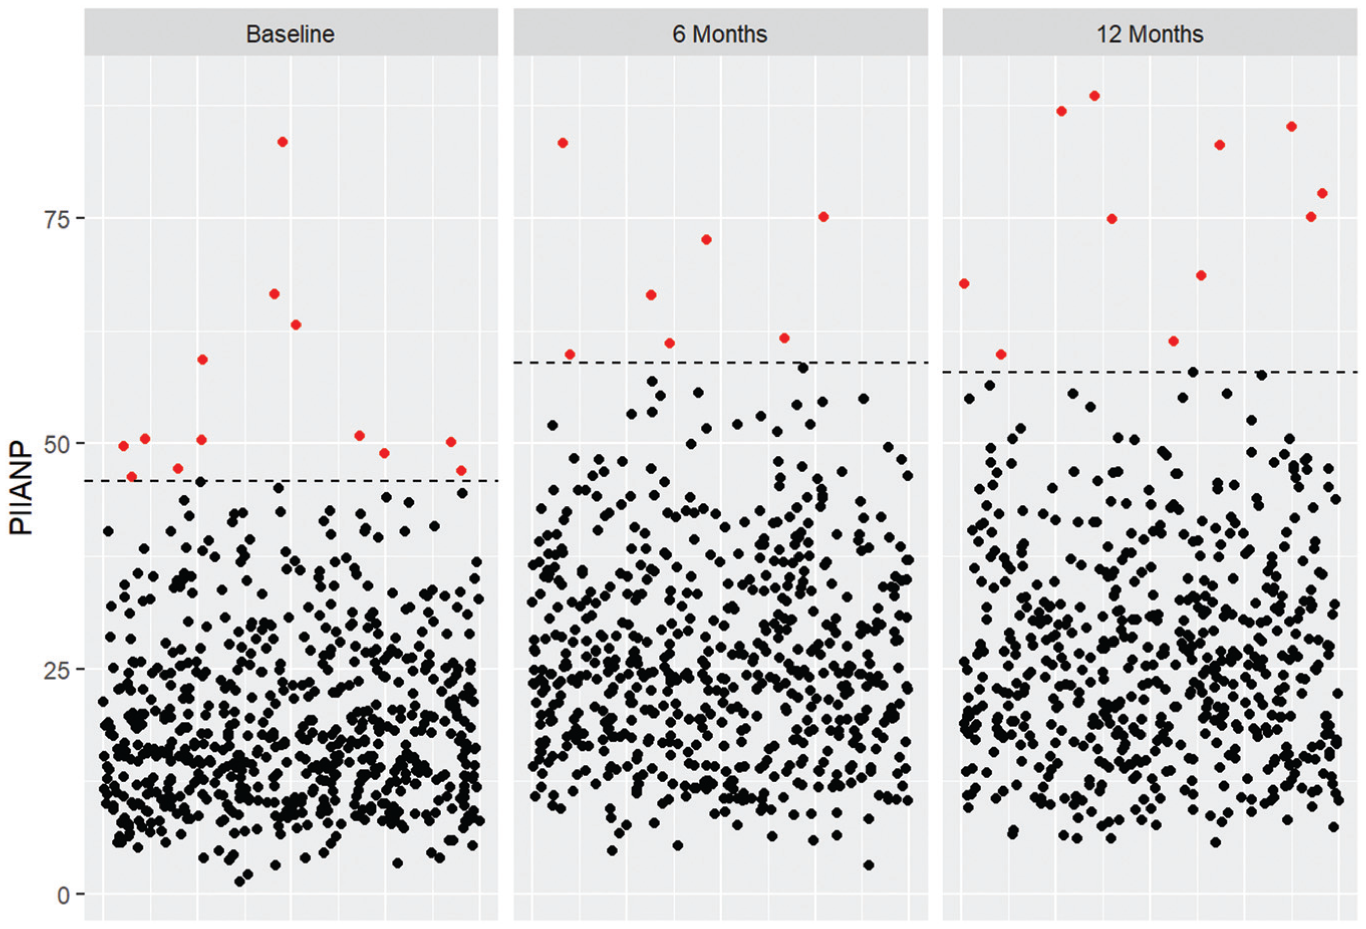
Scatterplot of serum N-propeptide of collagen 2A (PIIANP) concentrations (in ng/mL) at the baseline, 6-month, 12-month time points. Red dots represent outlier patients, and the horizontal dotted line represents the outlier threshold at each time point.
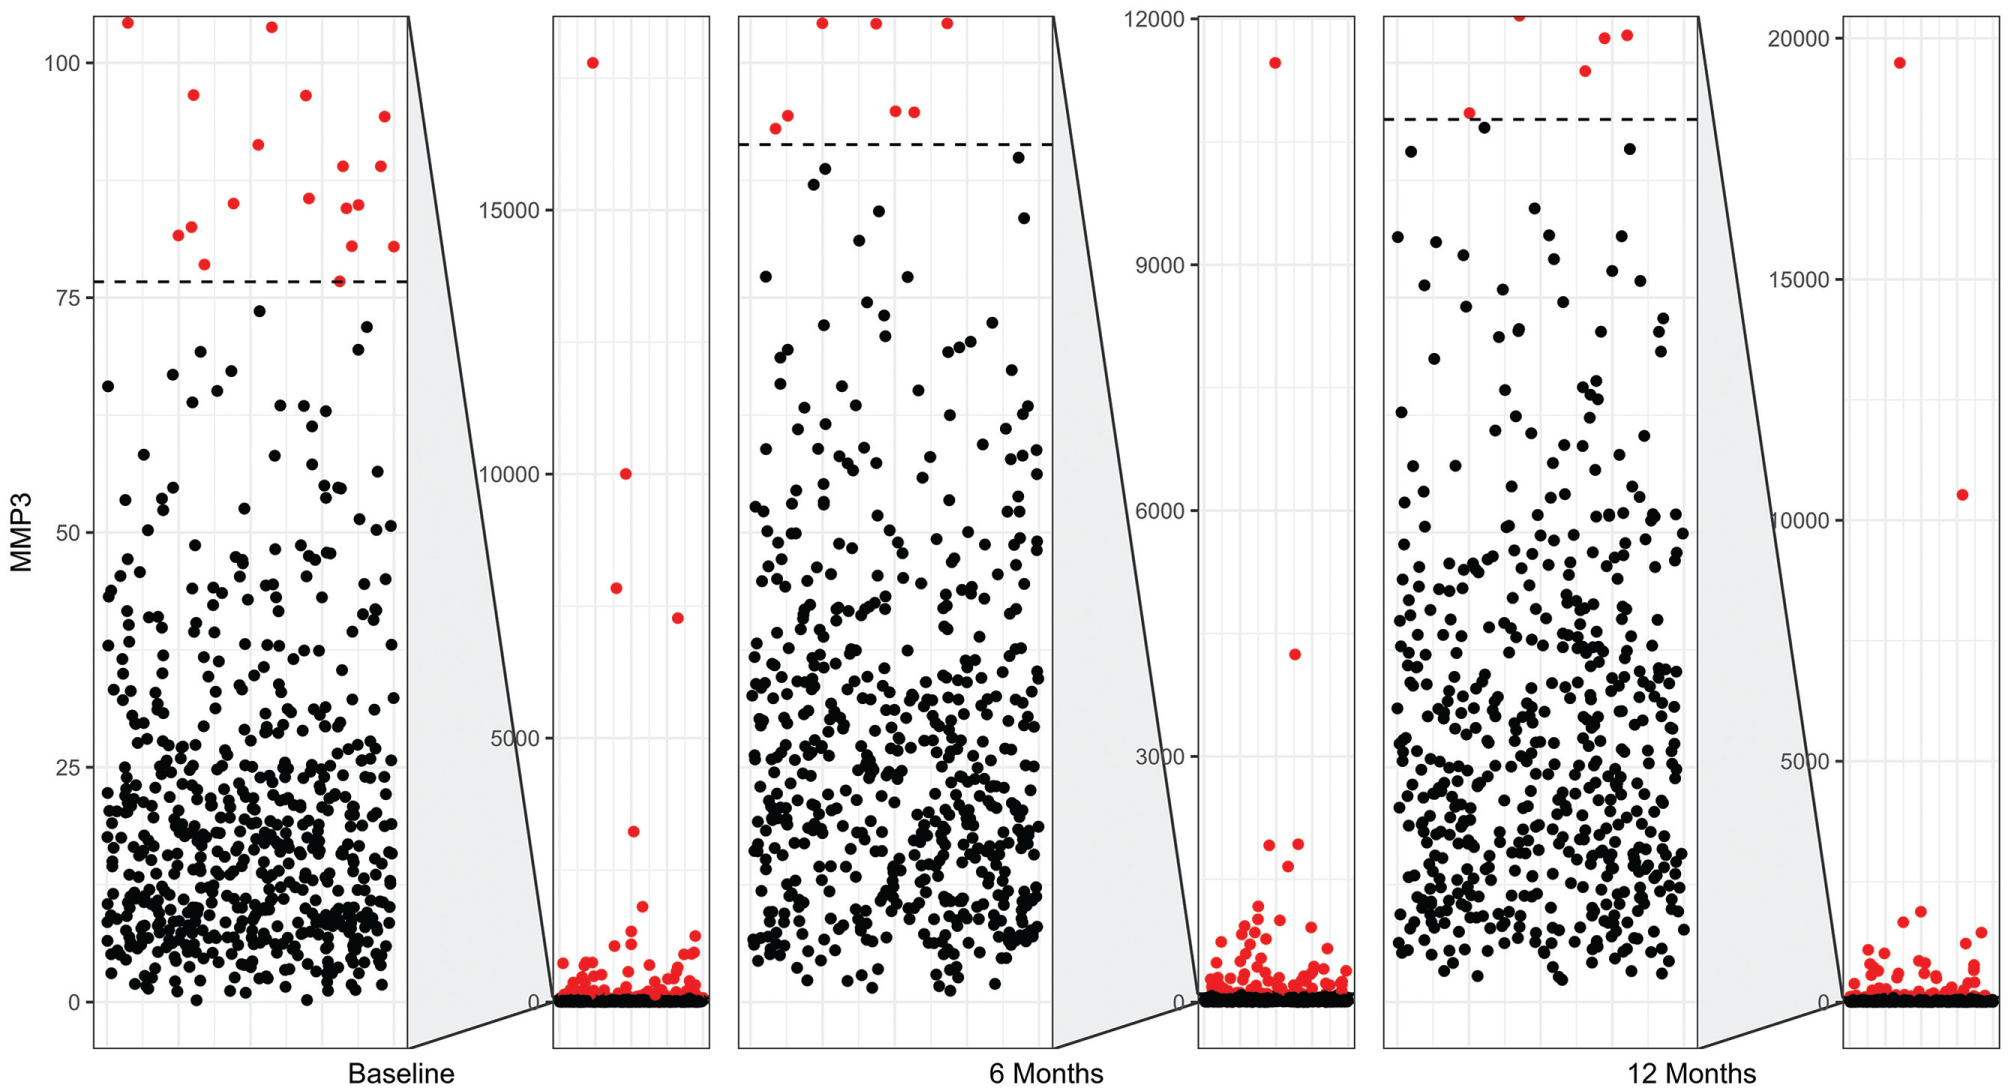
Composite scatterplot of serum matrix metalloproteinase 3 (MMP3) concentrations (in ng/mL) at the baseline, 6-month, and 12-month time points. Red dots represent outlier patients. The left-hand portion for each time point is a zoomed-in view focusing on the nonoutlier patients. The right-hand portion has the same structure as Figures 2 and 3. Because of the y-axis scaling to accommodate extreme outliers, the nonoutlier patients appear condensed at the bottom of the right-hand portion as a single black line on the right-hand portion of the composite for each time point.
Change in Outlier Status Over Time
Change in outlier or nonoutlier status with measurement at subsequent time points is presented in Table 4.
Change in Outlier or Nonoutlier Status Stratified by Biomarker and Time Point a
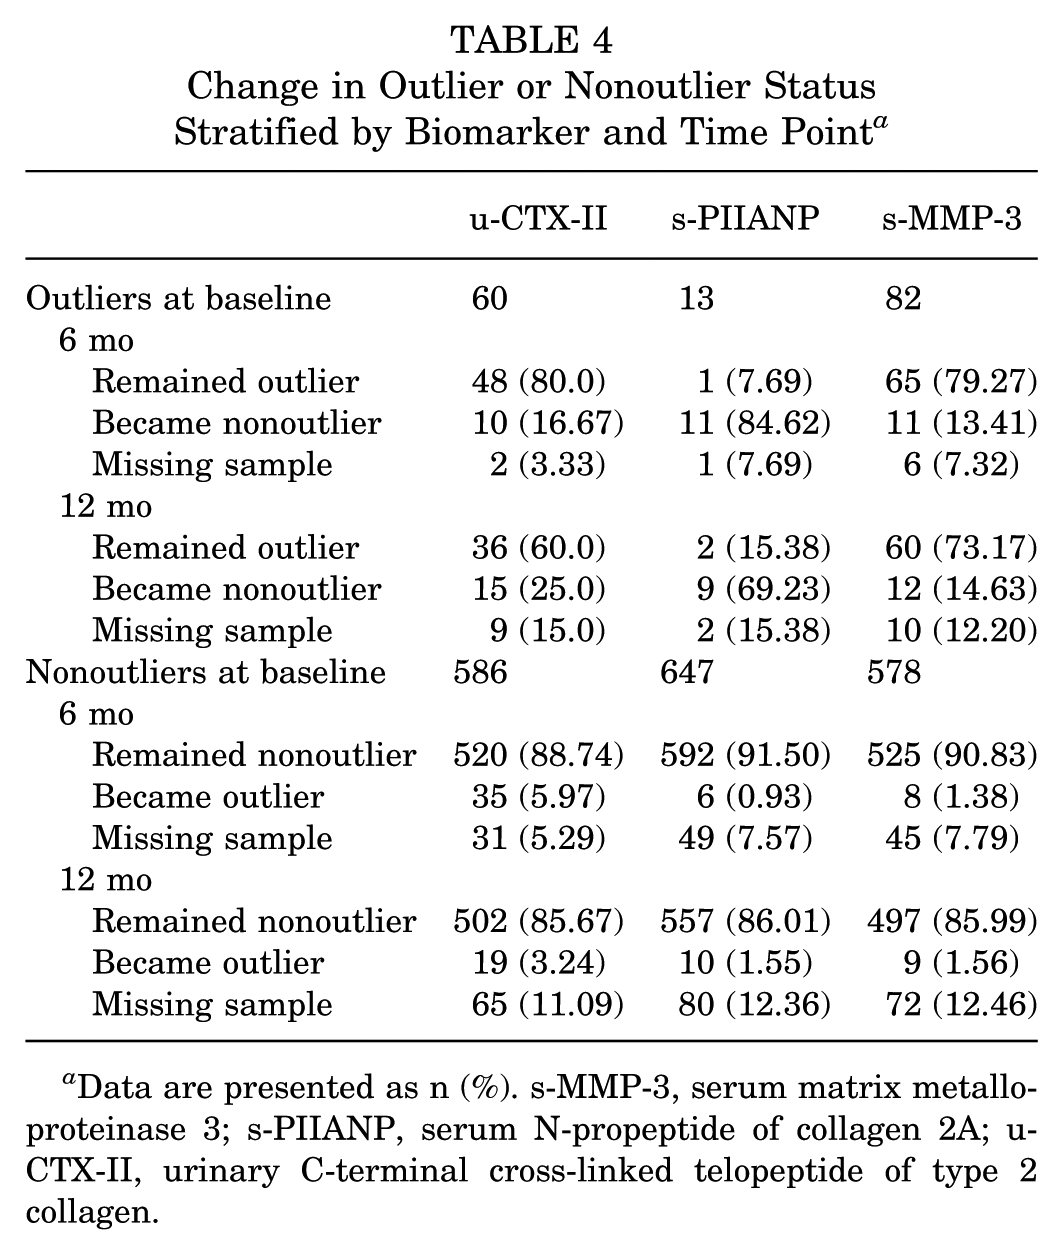
Data are presented as n (%). s-MMP-3, serum matrix metalloproteinase 3; s-PIIANP, serum N-propeptide of collagen 2A; u-CTX-II, urinary C-terminal cross-linked telopeptide of type 2 collagen.
Outlier Status in Multiple Biomarkers
At the baseline, 6-month, and 12-month time points, 10 (1.5%), 11 (1.7%), and 14 (2.1%) patients were an outlier for >1 biomarker, respectively. This was most often observed for the combination of s-MMP-3 and u-CTX-II. No patient was an outlier for all 3 biomarkers at any time point, nor was any patient an outlier for both s-MMP-3 and s-PIIANP at any time point (Figure 5).
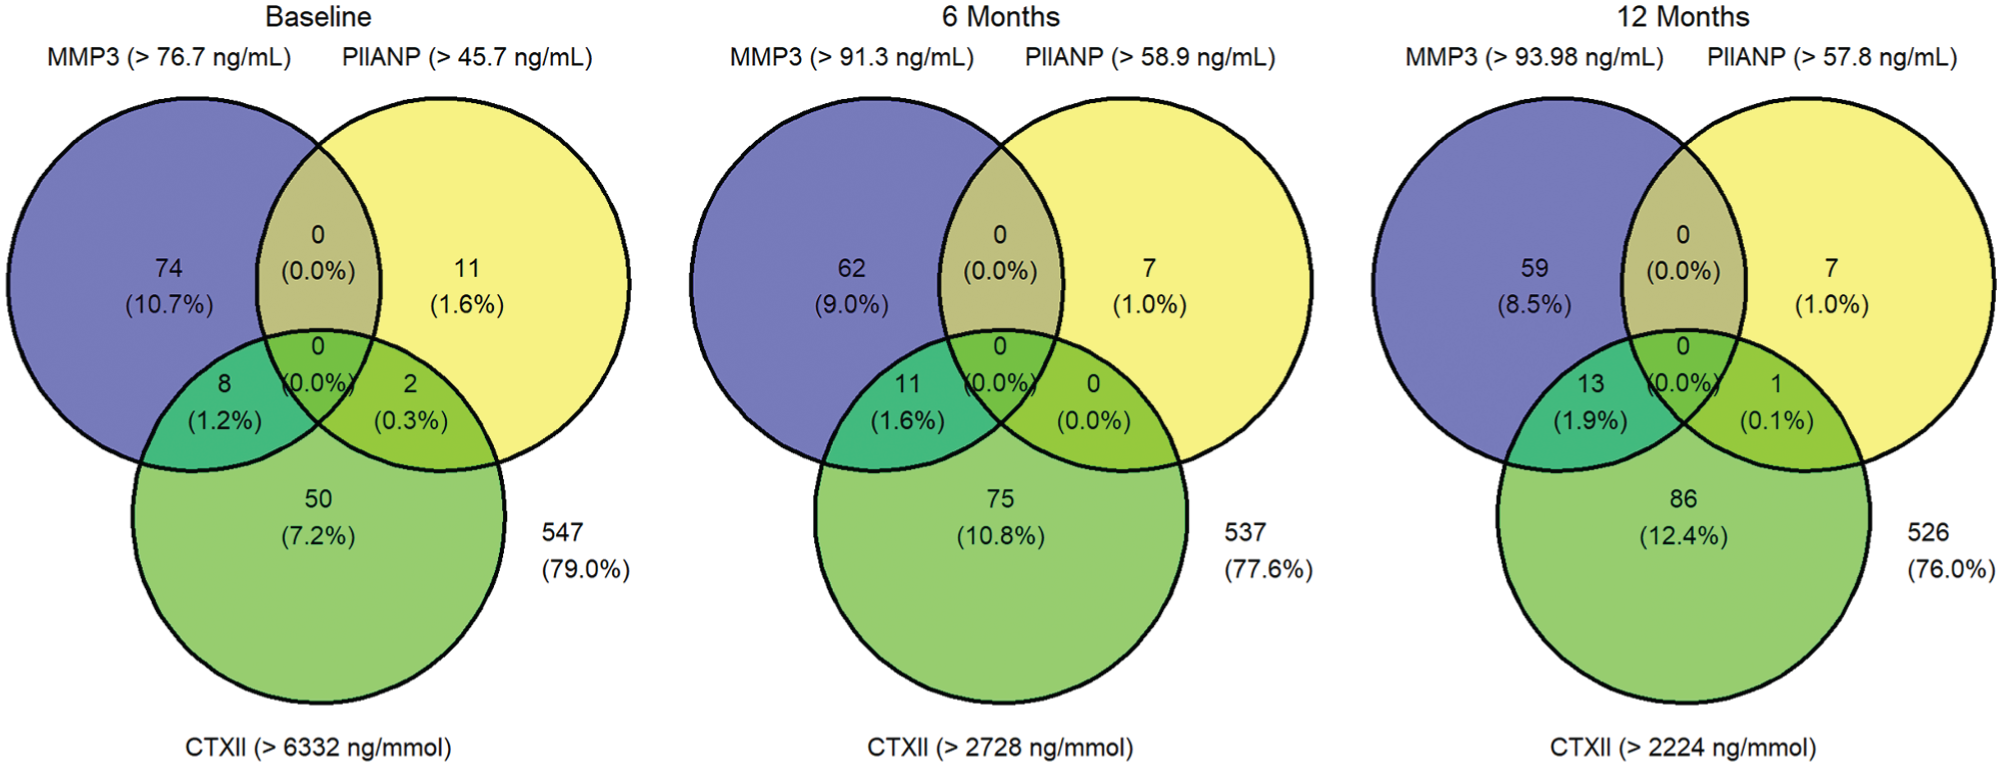
Venn diagrams showing patients who were outliers in >1 biomarker at a given time point. Percentages refer to all patients providing a sample at each specified time point. The outlier threshold at each time point is given in parentheses. CTXII, urinary C-terminal cross-linked telopeptide of type 2 collagen; MMP3, serum matrix metalloproteinase 3; PIIANP, serum N-propeptide of collagen 2A.
Factors Associated With Outlier Status at the Baseline Time Point
Results from the logistic regression model to distinguish between outlier patients versus nonoutlier patients based on the explanatory variables are presented in Tables 5 and 6 for the baseline and 12-month time points, respectively. In terms of serum MMP-3 and serum PIIANP, the baseline model had very poor ability to distinguish between outlier and nonoutlier patients with Tjur R2 values of 0.013 and 0.056, respectively. The model performed better at distinguishing between urinary CTX-II outlier and nonoutlier patients, with a Tjur R2 value of 0.598.
Logistic Regression Model for Outlier Status at the Baseline Time Point a
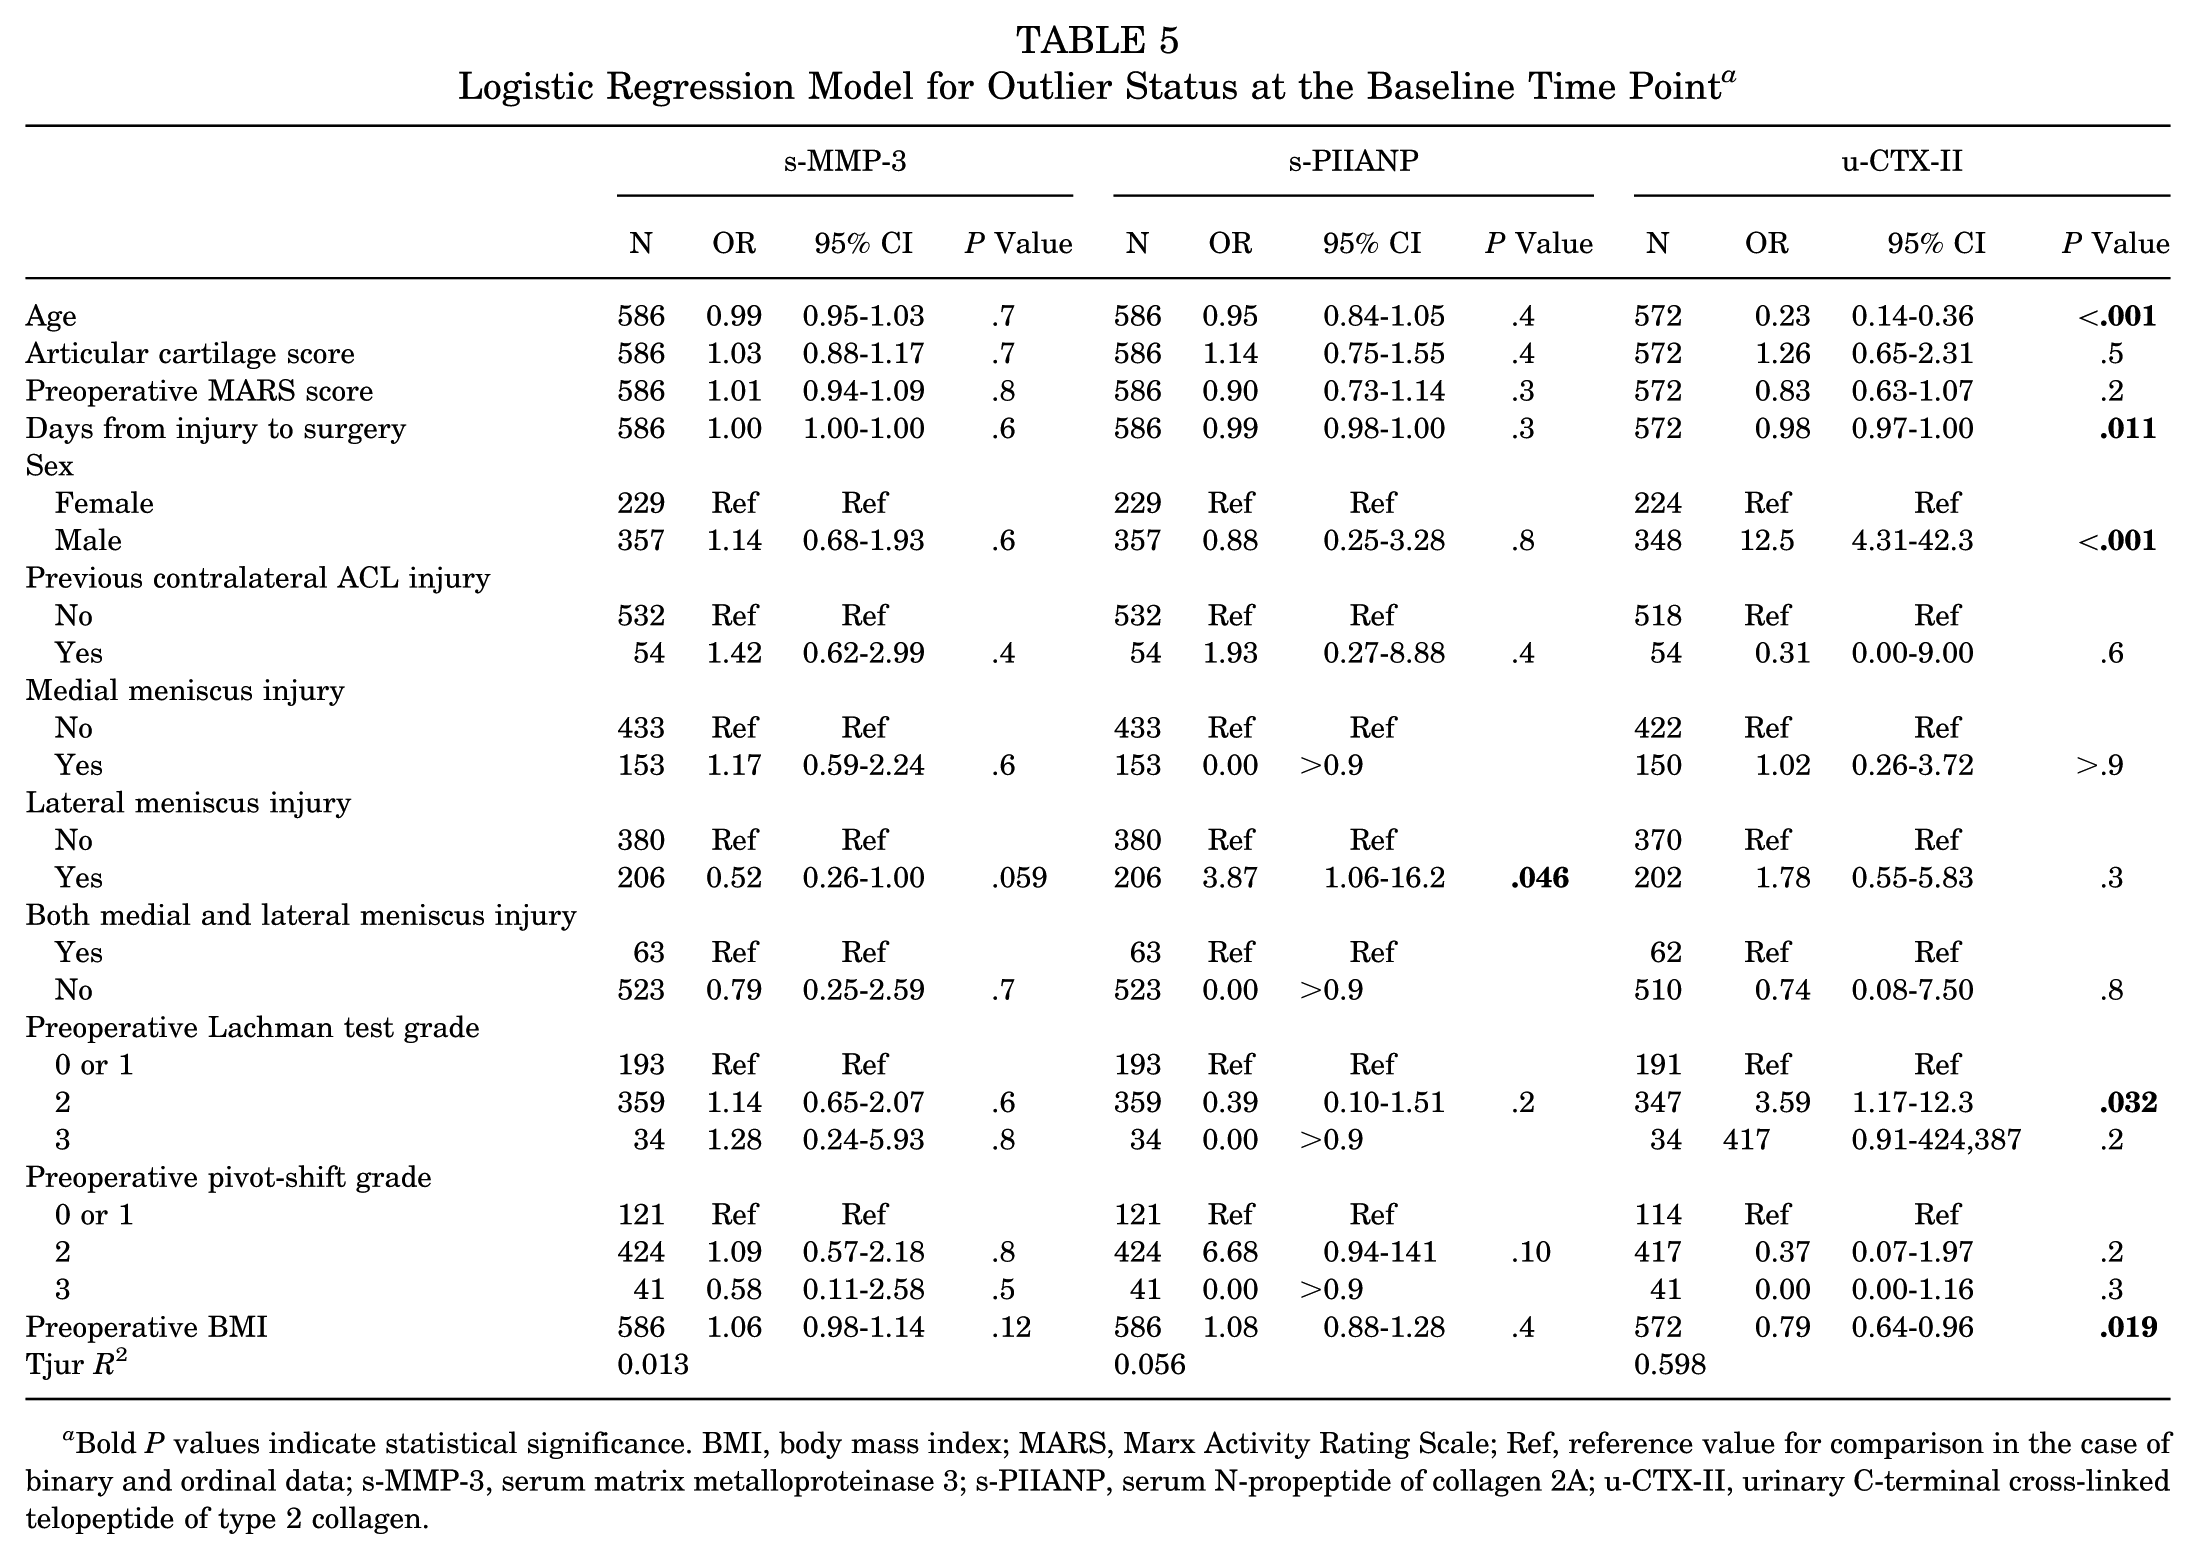
Bold P values indicate statistical significance. BMI, body mass index; MARS, Marx Activity Rating Scale; Ref, reference value for comparison in the case of binary and ordinal data; s-MMP-3, serum matrix metalloproteinase 3; s-PIIANP, serum N-propeptide of collagen 2A; u-CTX-II, urinary C-terminal cross-linked telopeptide of type 2 collagen.
Logistic Regression Model for Outlier Status at the 12-Month Time Point a
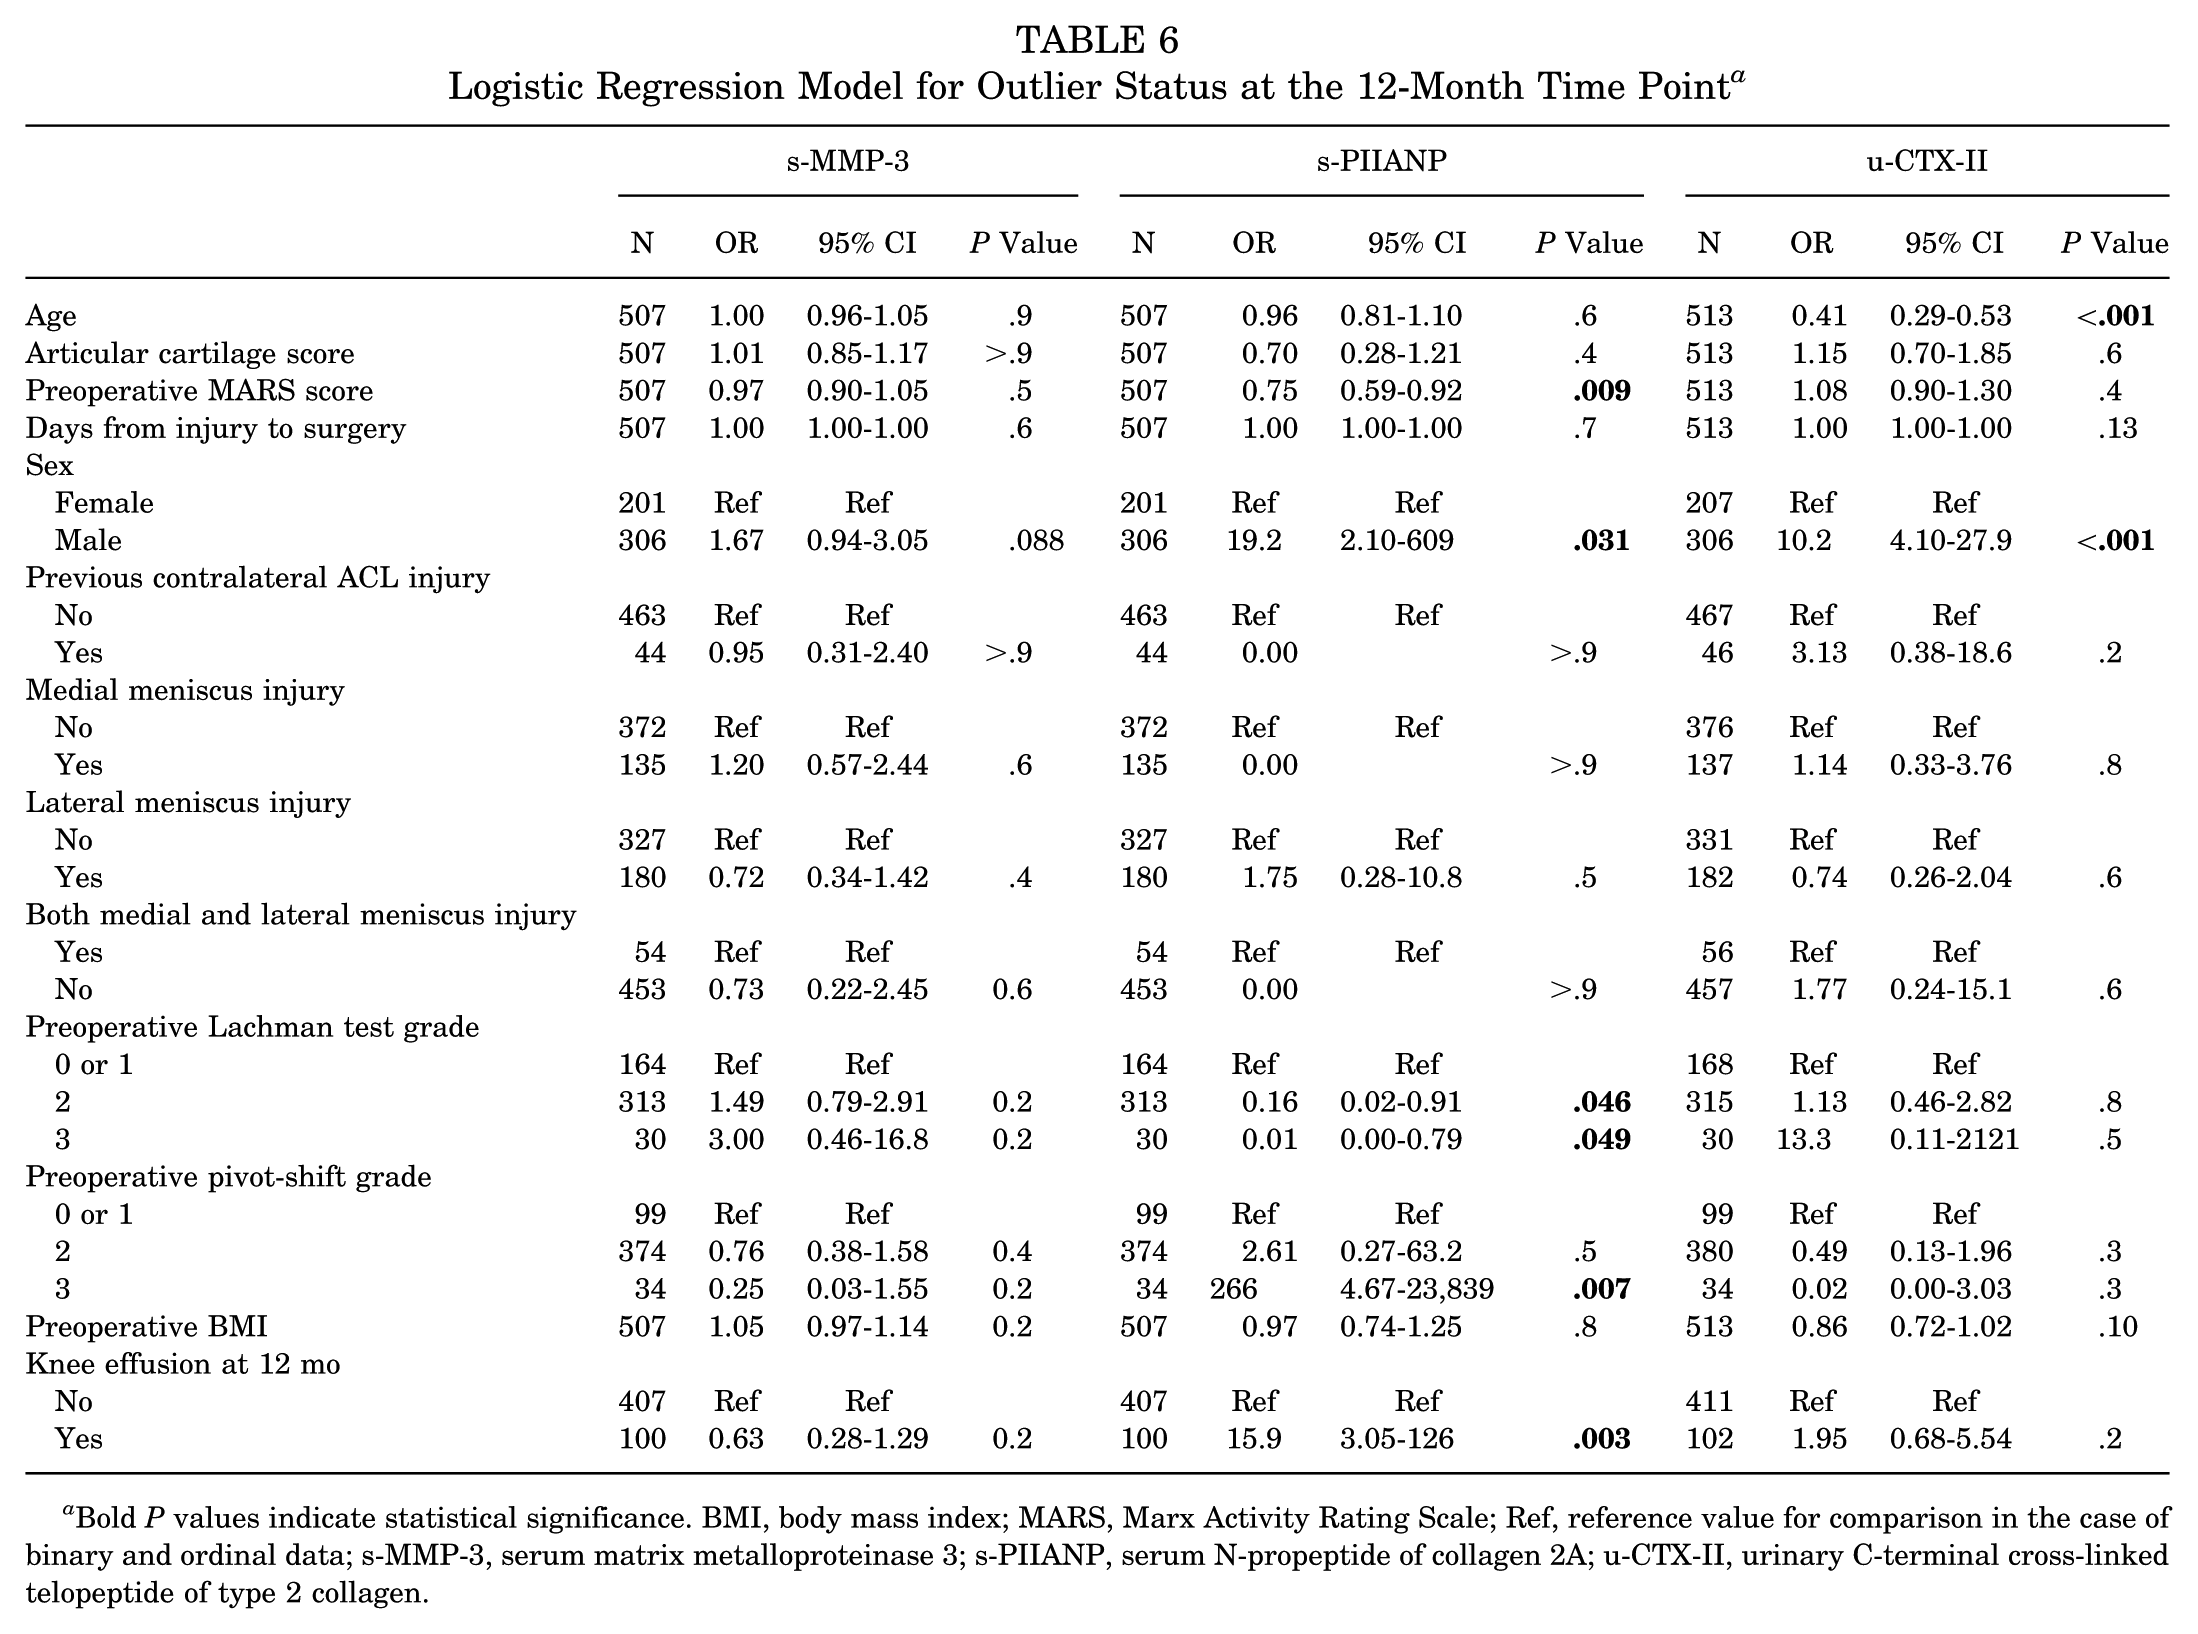
Bold P values indicate statistical significance. BMI, body mass index; MARS, Marx Activity Rating Scale; Ref, reference value for comparison in the case of binary and ordinal data; s-MMP-3, serum matrix metalloproteinase 3; s-PIIANP, serum N-propeptide of collagen 2A; u-CTX-II, urinary C-terminal cross-linked telopeptide of type 2 collagen.
At baseline, younger age, shorter time from injury to surgery, lower BMI, and male sex were independently associated with being an outlier in terms of urinary CTX-II (Table 5). A lateral meniscus tear was independently associated with outlier serum PIIANP status (Table 5).
Factors Associated With Outlier Status at the 12-Month Time Point
At the 12-month time point, younger age and male sex were associated with being an outlier in terms of u-CTX-II (Table 6). A lower preoperative MARS score, male sex, lower laxity on the Lachman test at baseline, a grade 3 pivot-shift test at baseline, and an effusion in the knee at 12 months postoperatively were associated with being an outlier in terms of PIIANP concentrations (Table 6).
Sensitivity Analysis: The Effect of Previous Contralateral ACL Injury
Sensitivity analysis excluding patients with a previous contralateral injury demonstrated very similar findings to the main model. Only 2 associations changed. First, a lateral meniscus injury was no longer significantly associated with baseline PIIANP outlier status (OR, 2.79; 95% CI, 0.66-12.6; P = .2). Second, a grade 0 or 1 Lachman test as measured at baseline was associated with PIIANP outlier status at 12 months, relative to patients with a grade 2 (P = .046) or grade 3 (P = .049) Lachman test at baseline. Other than these 2 changes, there were only small variations in the strength of associations observed.
Discussion
This study explores the unique group of outlier patients in terms of 3 systemic biomarkers of chondral metabolism in a large, well-characterized, prospectively studied cohort of patients with ACL reconstruction.
Outlier patients were identified for all 3 biomarkers at all 3 time points; however, the proportion of outliers varied, as did the change in outlier status over time between the biomarkers. There were some patterns observed in terms of biomarker grouping. The 2 catabolic markers, u-CTX-II, a marker of type 2 collagen degradation, and s-MMP-3, a mediator in chondral matrix degradation, had comparable rates of outliers seen at each time point. It was also observed that both of these biomarkers had apparent extreme outliers, which was particularly evident for s-MMP-3. In contrast, the anabolic marker PIIANP, a marker of type 2 collagen synthesis, had lower proportions of outlier patients at all time points, and there were no extreme outlier patients seen. A similar phenomenon was observed in terms of change in outlier status over time whereby both u-CTX-II and s-MMP-3 had a high proportion of patients who remained outliers at subsequent time points. In contrast, the vast majority of s-PIIANP outlier patients at baseline were no longer outliers at subsequent time points. However, it is important to acknowledge the small number of PIIANP outliers at baseline. Being an outlier for >1 biomarker was rare (between 1.2% and 1.9% of the cohort), but when this was observed, it was almost always being an outlier for both the catabolic markers, s-MMP-3 and u-CTX-II. These data suggest that systemic biomarkers of chondral metabolism have differing profiles after ACL reconstruction. It suggests that some patients can have an extreme catabolic response in terms of chondral metabolism given the higher rates of outlier patients and maintenance of outlier status at future time points when considering the catabolic biomarkers. Although the sample size is large with serial measurements and high follow-up rates, the small number of biomarkers tested should be considered when interpreting these data. Testing of this theory with other biomarkers of chondral metabolism is desirable.
Uncoupling of type 2 collagen synthesis to type 2 collagen degradation as measured by CTX-II and PIIANP concentrations has been associated with OA progression in the idiopathic knee OA setting, 13 as well as the rheumatoid OA setting. 9 In this context, patients with outlier u-CTX-II concentrations who had normal or low PIIANP concentrations would theoretically be at most risk for future OA. It is noted that very few of the u-CTX-II outliers were also outliers in terms of s-PIIANP. There were lower rates of outliers overall when measuring s-PIIANP. This may reflect a reduced capacity for a high-intensity reparative response relative to the exaggerated catabolic process observed in some patients.
For all 3 biomarkers, it was uncommon to become an outlier at 6 or 12 months if the patient was not an outlier at baseline (highest rate, 5.97% for u-CTX-II at 6 months). This may suggest that there are lower rates of extreme metabolic activity with increasing time after injury and/or surgery. This is in keeping with the idea that the knee recovers and progresses toward a metabolic equilibrium after the injury. Without a further injury or insult, the rates of extreme metabolic activity progressively dissipate.
In addition to higher rates of outliers, the chance of remaining an outlier at the 6- or 12-month time point was much higher for u-CTX-II and s-MMP-3 as compared with s-PIIANP. This may reflect the potential for longer durations of extreme catabolic activity as compared with the anabolic response. Conceptually, differing “biomarker spike” profiles after injury and/or surgery (Figure 1) could help to understand this observation. Serum PIIANP may inherently have a much narrower spike wavelength (Figure 1) as compared with u-CTX-II and s-MMP-3, meaning the chance of taking a sample at a time of extreme activity is reduced—hence the lower rates of outlier values. These data may also suggest different amplitudes in biomarker spiking, with higher amplitudes (and potentially more extreme outliers) seen for u-CTX-II and s-MMP-3 as compared with s-PIIANP. This theory would ideally be evaluated with more frequent sampling to develop a better understanding of the trajectories and natural evolution of these biomarkers over time after ACL reconstruction. If these phases occurred over very short time periods, it may be harder to identify with sampling given the infrequent testing due to the logistical challenges.
Patient and injury factors were explored to try to understand biomarker outlier status. However, given the results of the logistic regression model, these factors only seem relevant for u-CTX-II outlier status. The explanatory logistic regression models were of very poor utility in terms of explaining outlier status for s-PIIANP and s-MMP-3. This suggests that factors other than the listed explanatory variables are important in explaining outlier status for these 2 biomarkers. Of note, radiological parameters such as the degree of bone bruising and effusion at the time of injury were not included in the model and could be a contributing factor, as could be genetic factors, as another example among many. As compared with s-PIIANP and s-MMP-3, the multivariable model did have much better performance in differentiating u-CTX-II outliers. Risk factors identified for being an outlier in the modeling have been demonstrated to be associated with increased u-CTX-II concentrations in other ACL series (younger age14,34,36 and shorter time between injury and surgery14,36), which adds validity to the findings. In contrast, lower BMI was associated with u-CTX-II outlier status. An inverse relationship has also been shown when comparing u-CTX-II and BMI as continuous variables in other modeling using this same patient population. 4 This contrasts with non–ACL-injured cohorts, in whom higher u-CTX-II concentrations were observed in patients with a BMI >25 kg/m2. The exact cause for these discordant results remains unclear.
Despite the ability to identify and our attempts to characterize outlier patients, the clinical implications of being an outlier in the context of ACL reconstruction remain unclear. Future correlation of outlier status to patient-reported outcome measures, radiological degenerative change, and progression to joint replacement is required. Although many biomarkers have previously been shown to differ between patients with ACL injuries and controls,8,14,15,20,39 interpreting biomarker values requires ongoing investigation. It may be that outlier status is important in predicting clinically meaningful outcomes 13 ; however, other measures such as relative change over time, change relative to an individual’s baseline biomarker concentrations, rate of biomarker concentration change, or length of time as an outlier could also be important predictors. Large data sets with testing at serial time points are required to explore these hypotheses. In terms of u-CTX-II, for which predictors of outlier status were identified, the only one potentially modifiable by the treating physician is time between injury and surgery. Assuming outlier status did correlate to important outcome measures, this would be the one factor that could be controlled. It is likely that any future clinical utility of biomarkers would be for prognostic purposes (eg, risk stratification for future OA), disease monitoring, or potentially to identify a group of patients who may benefit most from a future disease-modifying intervention.
The research implications of outlier patients are also important. It is possible that these patients represent those with the highest rates of preclinical disease activity and therefore potentially those at greatest risk of future OA. Therefore, exclusion from analyses, as may be considered in other data management scenarios, may not be appropriate. This raises challenges in terms of data analysis and management. Inclusion of these patients can dramatically distort reporting group data and needs to be considered when interpreting biomarker data. Logarithmic transformation is 1 approach that has been used in this context.8,10,19,37 The general principles of reporting nonnormally distributed data should be emphasized, and median (range) values have previously been used in other series as opposed to mean (standard deviation) measurements.
Limitations
Testing other anabolic and catabolic biomarkers of type 2 collagen metabolism such as collagen type 2 cleavage product (C2C), procollagen 2 C-propeptide (CP-II), cartilage oligomatrix protein (COMP), and NH(2)-propeptide of type 2B collagen (PIIBNP), for example, would be advantageous to assess for similar trends regarding outlier status with alternate biomarkers of chondral metabolism. Testing of biomarkers in this context is expensive and resource intensive. The approach with this data set was to investigate a narrower selection of markers, but in a large patient cohort and at serial time points. Given the resource constraints, we believe this approach provides the most useful information. The inclusion of a noninjured and nonoperatively managed ACL-injured control group is desirable. However, the decision to perform an ACL reconstruction is predominantly based on current or anticipated knee instability, so for the ACL reconstruction group of patients, the data remain valid and likely have good external validity given the longitudinal recruitment process. External validity needs to be considered with any application to nonoperatively managed patients with ACL injuries. As with any biomarker investigation, diurnal variation should be considered as well as pathology in other joints, as the systemic biomarkers represent total-body concentrations. The large numbers of patients with sequential, prospective longitudinal recruitment hopefully mitigate some of this risk of bias, and we believe that the results would be reflective of any future clinical application of biomarkers in the population with ACL injuries in the clinical environment. Systemic biomarkers were the focus of this investigation as, despite the limitations, the ease of collection is advantageous if there is to be future clinical adoption. Although challenging to accurately record, correlating biomarker concentrations and outlier status to the chronicity of the observed chondral pathologies (acute injury related vs chronic preexisting) would have been of interest. Furthermore, although outside of the scope of the current study, correlation of outlier biomarker status to clinical and radiological outcomes will be an important next step in this line of research.
Conclusion
Outlier patients were observed when measuring all 3 systemic biomarkers of chondral metabolism after ACL reconstruction. For s-PIIANP and sMMP-3, outlier status was poorly explained by patient or surgical factors, but for u-CTX-II, outlier status could, in part, be explained by patient and surgical factors. These results support longitudinal biomarker analyses, given that outlier status can change over time, and this may not be identified in cross-sectional study designs.
Footnotes
Submitted November 20, 2024; accepted August 11, 2025.
One or more of the authors has declared the following potential conflict of interest or source of funding: This work was supported by the Australian Government National Health and Medical Research Council (postgraduate scholarship to L.M.B.), Royal Australasian College of Surgeons (surgeon scientist scholarship to L.M.B.), Australian Orthopaedic Association Research Foundation (project grant to L.M.B.), Epworth Medical Foundation (OrthoSport Victoria grant), and OrthoSport Victoria Research Unit. L.M.B. has received fellowship support from Smith & Nephew; consulting fees from Arthrex; and speaking fees from Arthrex, Smith & Nephew, and Device Technologies. T.S.W. has received consulting fees from Smith & Nephew, Corin, and Medacta; and fellowship support from Smith & Nephew. J.A.F. has received fellowship support and speaking fees from Smith & Nephew; and is associate editor of Orthopaedic Journal of Sports Medicine. AOSSM checks author disclosures against the Open Payments Database (OPD). AOSSM has not conducted an independent investigation on the OPD and disclaims any liability or responsibility relating thereto.
‡‡
References 1, 3, 5, 8, 12, 14, 15, 20, 31, 32.
§§
References 8, 12, 14, 26, 28, 29, 33, 38, 40.