
Abstract
Polyvinylidene fluoride and its co-polymer with trifluoroethylene are promising biomaterials for supporting nerve regeneration processes because of their proven biocompatibility and piezoelectric properties that could stimulate cell ingrowth due to electrical activity upon mechanical deformation. This study reports the piezoelectric effect of electrospun polyvinylidene fluoride scaffolds in response to mechanical loading. An impact test machine was used to evaluate the generation of electrical voltage upon application of an impact load. Scaffolds were produced via electrospinning from polyvinylidene fluoride and polyvinylidene fluoride-co-trifluoroethylene with concentrations of 10–20 wt% dissolved in N,N-dimethylformamide (DMF) and acetone (6:4). The structural and thermal properties of scaffolds were analyzed using Fourier Transform Infrared Spectroscopy and Differential Scanning Calorimetry, respectively. The piezoelectric response of the scaffolds was induced using a custom-made manual impact press machine. Impact forces between 0.4 and 14 N were applied. Fourier Transform Infrared Spectroscopy and Differential Scanning Calorimetry results demonstrated the piezoelectric effect of the electrospun polyvinylidene fluoride and polyvinylidene fluoride-co-trifluoroethylene scaffolds. All the scaffolds exhibited a piezoelectric polar beta-phase formation. Their thermal enthalpies were higher than the value of the initial materials and exhibited a better tendency of crystallization. The electrospun scaffolds exhibited piezoelectric responses in form of voltage by applying impact load. Polyvinylidene fluoride-co-trifluoroethylene scaffolds showed higher values in the range of 6–30 V as compared to pure polyvinylidene fluoride. Here, the mechanically induced electrical impulses measured were between 2.5 and 8 V. Increasing the impact forces did not increase the piezoelectric effect. The results demonstrate the possibility of producing electrospun polyvinylidene fluoride and polyvinylidene fluoride-co-trifluoroethylene scaffolds as nerve guidance with piezoelectric response. Further experiments must be carried out to analyze the piezoelectricity at dynamic conditions.
Keywords
Introduction
Traumatic injuries and loss of peripheral nerves can lead to lifelong discomfort, disability, or both. 1 The current gold standard for nerve restoration is tension-free reconstruction by autologous nerve grafts. 2 However, due to the complete loss of function of the donor nerve, the disadvantages of this approach, such as limited length and availability, have encouraged the search for alternative means of nerve reconstruction.3,4 Thus, the development of artificial nerve guidance conduits matching the effectiveness of the autologous nerve graft would be beneficial to the field of peripheral nerve surgery. 5 Regenerative medicine represents an alternative to conventional transplantation procedures and applies either permanent or degradable biomaterials with innovative material properties.6–8 Biosynthetic piezoelectric polymer structures have been investigated for this purpose. One very promising material is polyvinylidene fluoride (PVDF), which was discovered by Kawai 9 in 1969, and its modification polyvinylidene fluoride-co-trifluoroethylene (PVDF-TrFE). Owing to their proven biocompatibility as well as strong and stable piezoelectric effect, such materials can generate electrical activity when mechanically deformed.10–12 In this context, PVDF scaffolds have been studied for various medical applications including engineering of vascular grafts, fractionation of human plasma, and bone and nerve regeneration.13–15
According to previous studies of peripheral nerve regeneration, the micro-electric pulses of PVDF films positively influenced directional axon growth.16,17 The piezoelectric effect supports and accelerates the axonal regeneration in the grafts. The direction of the growth of axons is controlled by the electrical polarization and a faster growth of neurites is induced. 18 Among the methods to produce porous films, electrospinning has gained much attention because of its potential applications for designing biomedical devices and tissue-engineered fibrous scaffolds. It includes fabrication of thin fibers from a polymer solution by using a high-voltage electric field.19,20 The polymer solution is pumped through a nozzle and gets charged in high voltage electric field. Due to accumulation of positive charge in the polymer drop, a Taylor cone forms with an emerging polymer jet at the tip. With continuous evaporation of the solvent, the jet solidifies into a polymer fiber that is randomly deposited on a grounded collector. This leads to elongation of the fiber due to the electrostatic forces. The stretching process reduces the initial fiber diameter by several orders of magnitude. The final diameter is dependent on the polymer solution and its properties (viscosity, surface tension, conductivity) and the process parameters. Important process parameters are the electrical voltage, the flow rate, and the distance between the nozzle and the collector. Also, environmental factors such as humidity and temperature affect fiber deposition.21,22
For measuring the piezoelectric properties, there are at present three main methods. These include Frequency method, Laser interferometry method, and Quasi-static method. 23 All of these methods are used very frequently, mainly because they provide high accuracy results and optimized for certain applications.23,24
The current work focuses on Quasi-static method because of the availability of the equipment needed and lower overall cost compared to the other methods. 24 This method does not require establishing of the material constants involved. To have an accurate result, the tested sample needs to be compared to a reference sample of a known piezoelectric coefficient. There are different setups for this method but the main principle remains the same.24,25 It includes application of high-resistance input voltmeters to measure the charges created when the sample is mechanically deformed. Commercial measuring devices are offered by companies such as Piezotest and HC Materials Corporation.26,27
In this work, we aim at developing and validating of an impact press machine with respective electronic unit. We hypothesize that different PVDF formulations (pure PVDF and PVDF-TrFE) can be processed by electrospinning into porous piezoelectric scaffolds and then analyzed using the designed approach. The effect of electrospinning process on structural and thermal properties of PVDF-based materials is also investigated.
Methods
Materials
To prepare the polymer solutions, PVDF (Sigma-Aldrich) with a molecular weight of ~530,000 in pellet form and PVDF-TrFE 70/30 (Piezotech Arkema) with molecular weight of ~450,000 in powder form were used. N,N-dimethylformamide (DMF) (Fluka Analytical) and acetone (AppliChem GmbH) were used as solvents in a weight ratio of 6:4. For the identification of favorable conditions for producing the scaffolds concentrations of 15% and 20% PVDF and 10%, 15%, and 20% PVDF-TrFE were prepared at 50°C and stored at room temperature overnight prior to electrospinning.
Scaffold manufacturing
In the electrospinning process, the polymer solution was transferred into a 10 mL syringe with Luer-lock tip and an orthogonally cut-ended needle. A syringe driver (Kd Scientific, Massachusetts, USA) was used to control the solution flow rate at 2 mL/h. Voltages of 20–30 kV were applied between the syringe needle and a rotating drum collector at speed of 1000 r/min. Fibers were collected on a grounded piece of aluminum foil (6 × 20 cm2) which was placed on the collector plate 20 cm from the needle-end. The electrospinning time of each sample was 2.5 h under a temperature range of 24–25.5°C and a humidity between 47% and 50%.
Morphological and structural characterizations
The resulting morphology of the scaffolds were observed by using a scanning electron microscope (SEM) (VP-SEM S-3400 Type II, Hitachi High-Technologies Europe GmbH Krefeld, Germany). The SEM used a resolution of up to 10.0 nm at an accelerating voltage of 15 kV and 7 mm working distance. Prior to SEM imaging, the fiber mats were sputter coated with a conductive layer of Au/Pt for 15 s twice. The micrographs of the scaffolds were captured at various magnifications and then compared.
The Fourier Transform Infrared Spectroscopy (FTIR) was used to record the infrared spectra of the electrospun scaffolds. The spectra were compared to those of untreated/raw materials with respect to the presence of the nonpolar α- and piezoelectric β-phase. The FTIR spectra were recorded using a PerkinElmer 100 FTIR spectrometer (PerkinElmer, Norwalk, CT, USA) equipped with a triglycine sulfate detector and an attenuated total reflection accessory with a diamond/ZnSe crystal. The acquisition parameters were the following: 4 cm−1 resolution, 8 co-added interferograms, and 4000–550 cm−1 wavenumber range. An automatic CO2/H2O vapor correction algorithm was used during recording of the spectra. Analysis of spectra was carried out using PerkinElmer software. To examine the crystalline structure and the thermal properties of PVDF and PVDF-TrFE in the electrospun scaffolds, calorimetric measurements were performed to scaffolds using a differential scanning calorimeter (Netzsch DSC 204F1 Phoenix, Selb, Germany). The sample weights of the electrospun scaffolds as well as raw pellets were approximately 10 mg. The melting temperature (Tm) and heat of fusion of all samples were determined. The samples underwent a cool–heat temperature cycle program with a cooling and heating rate of 10 K/min from −70°C to +250°C in flushing nitrogen.
Piezoelectric measurements
Device description and signal acquisition
The piezoelectric response of the scaffolds was induced using a custom-made impact press machine. Impact forces between 0.4 and 14 N were applied. The schematic structure and concept of the impact press machine is shown in Figure 1(a).
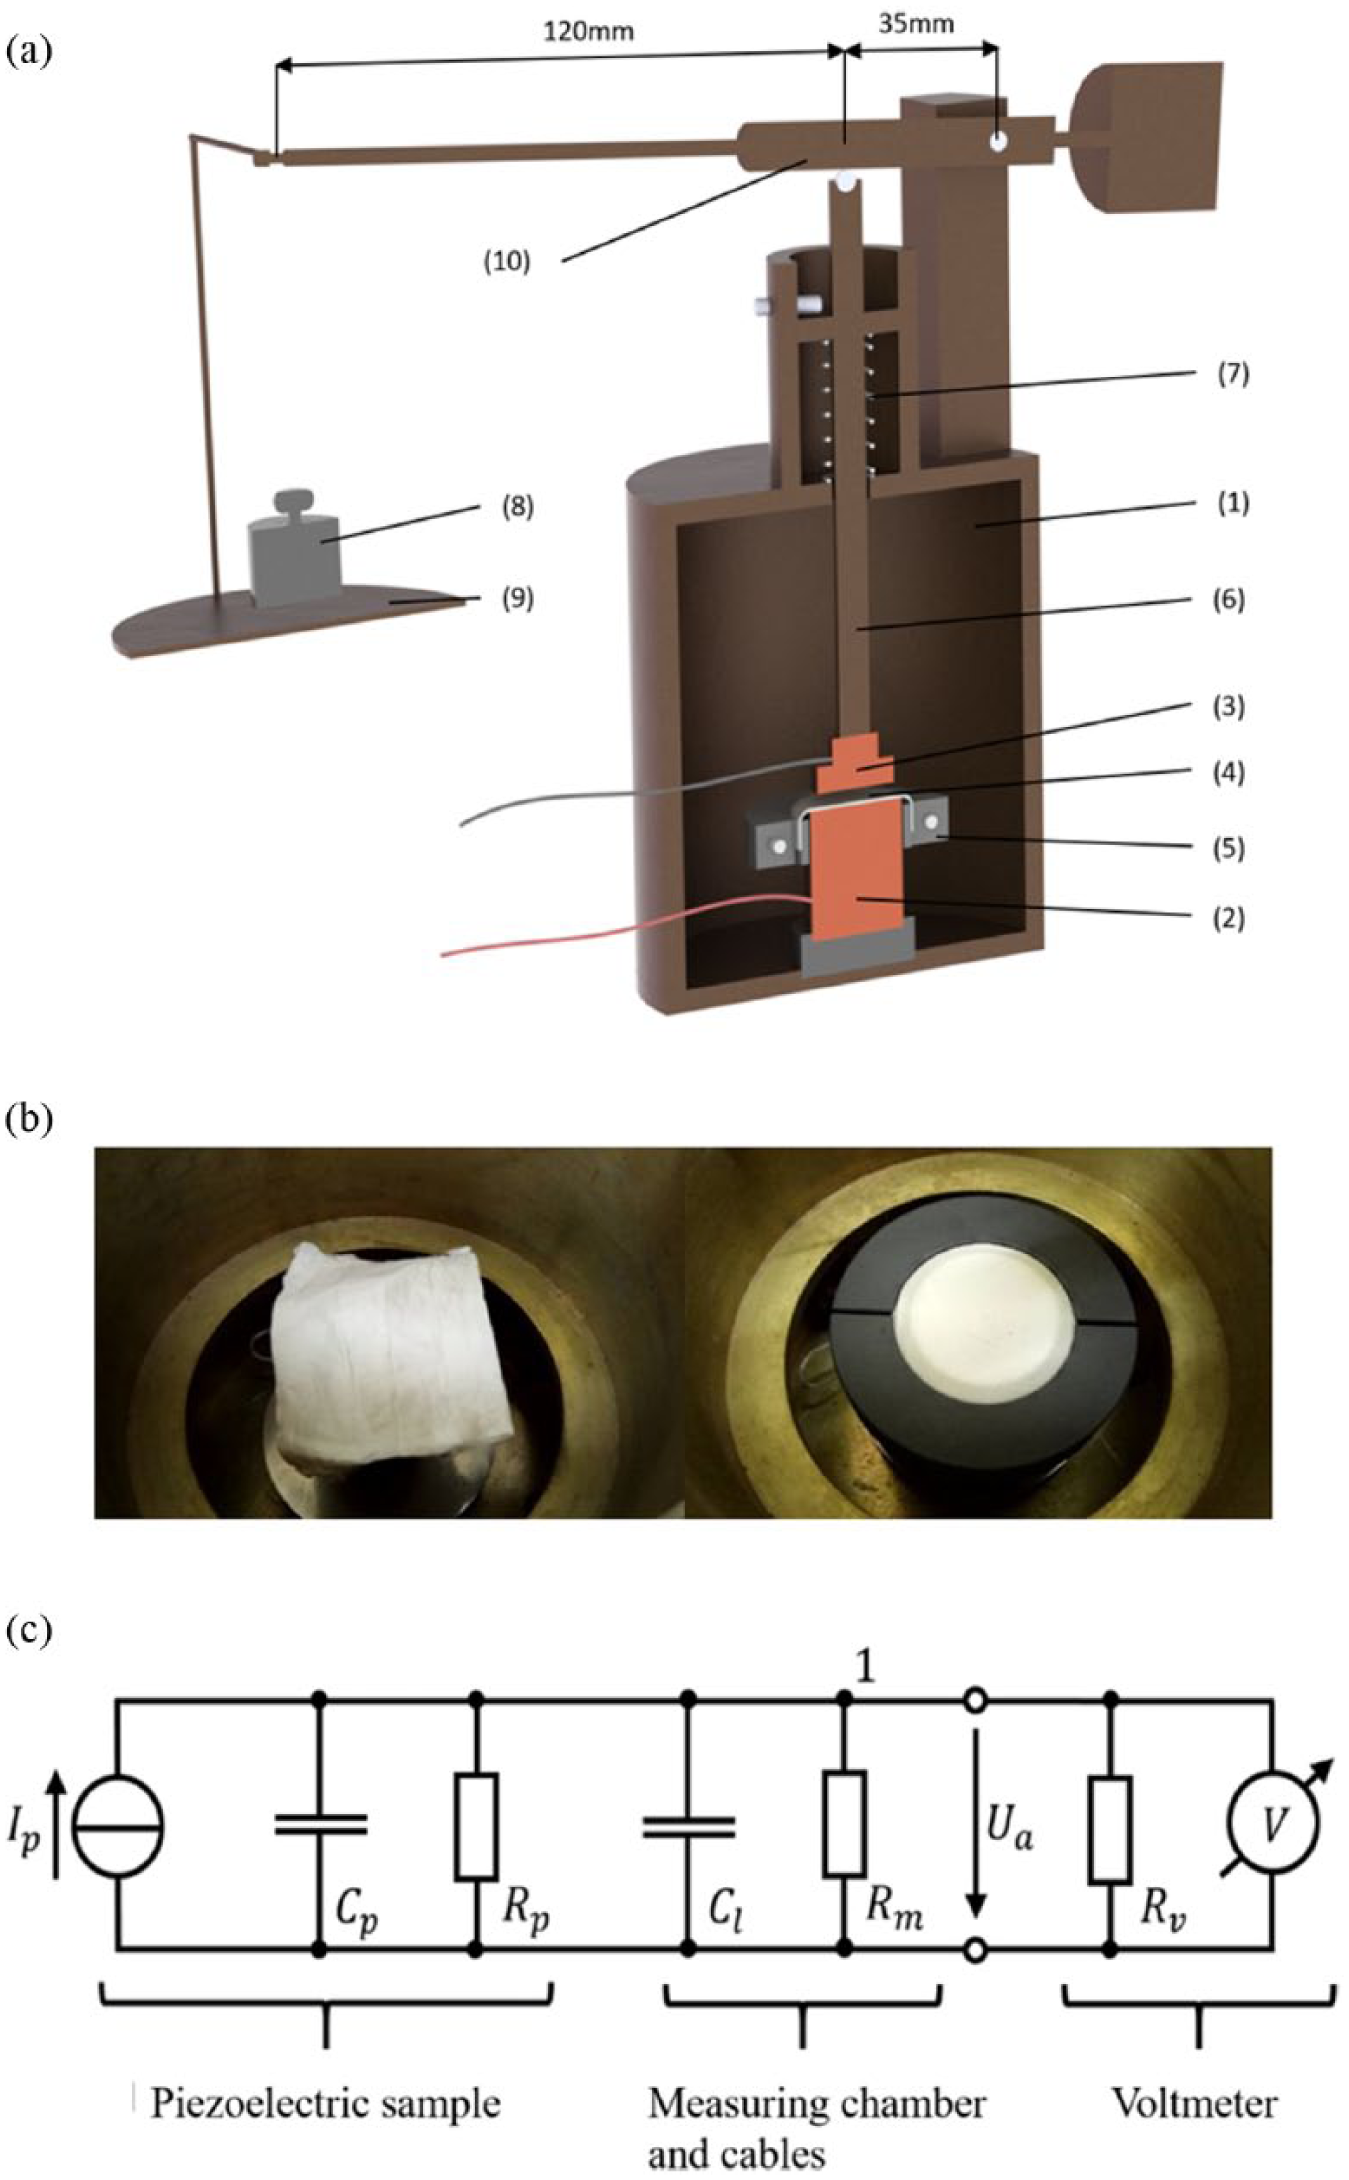
(a) Section of the structure of the impact press machine: (1) measuring cell, (2, 3) electrodes, (4) test sample, (5) clamping device, (6) pressure rod, (7) spring, (8) applied weight, (9) shell, (10) lever. (b) Sample without (left) and with the clamping device (right). (c) Electrical equivalent circuit diagram of the voltage measurement of the piezoelectric sample.
The measuring cell (1) is a closed shell of steel. Due to the influence in the electrical conductor, this shields the measurement against electromagnetic interference (Faraday cage). The lower electrode (2) is located in the measuring cell on a polymer base which is insulated from the measuring chamber. The sample (4) is positioned in a clamping device (5) between the lower and the upper electrode (3). This consists of two rings between which the sample is clamped. The clamping device together with the sample is placed on the lower electrode, so that only the sample is in contact with the electrode surface. Due to the weight of the rings, the sample is evenly stretched over the electrode surface (Figure 1(b)).
The upper electrode is connected to a rod (6), which projects from the measuring cell. The rod is held in position by a spring (7). On the tip of the rod there is a ball, which applies pressure uniformly to the rod and thus to the sample. The mechanical load is applied by means of a lever (10) via a weight (8), which is positioned in a shell (9). The electrodes from the measuring cell were connected to the voltage meter (610°C, Keithley Instruments) during loading and unloading. The generated voltage measurement signal was then passed on to the oscilloscope (K8031, Velleman), digitized and graphically displayed on a computer via software. For capacitance measurement, the electrodes were connected to the capacitance meter (E7-20, MNIPI) in the loaded state of the sample after the voltage signal had been decayed.
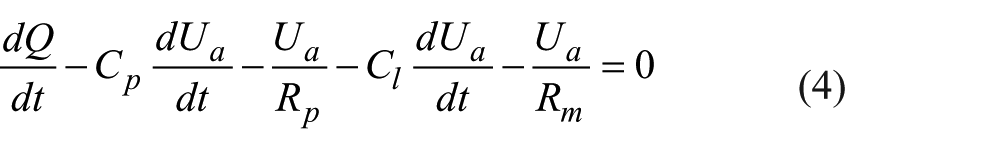
The measuring principle is based on the direct piezoelectric effect. During mechanical compression of the sample, a voltage difference can be measured on the surfaces. For the determination of the piezoelectric modulus, the capacitance of the sample Cp must be known. The piezoelectric modulus d33 can then be calculated with the following equation
where Q is the induced charge in C, F is the impact force in N, U is the induced voltage in V, C is the electric capacitance in F, w is the area of the mechanical load in cm2, and W is the area of the electrodes in cm2.
Performing measurements
The samples were fixed in the clamping device and placed on the lower electrode in the measuring cell. The measuring cell was then closed and the pressure rod adjusted so that the upper electrode did not make contact with the sample during resting. A weight mapp of 48, 99, 170 and 363 g was used to apply the pressure load on the sample. Considering the weight of the pressure rod (mrod), the upper electrode (melectrode), the pressure compensation by the tensioning energy of the spring (mspring), the conversion factor from the arm ratio of the lever (l) (Figure 1(c)), and the gravitational acceleration (g), the actual acting force (Fapp) applied on the sample can be calculated as follows
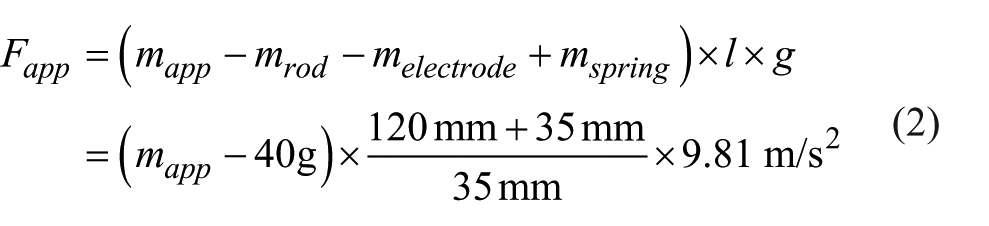
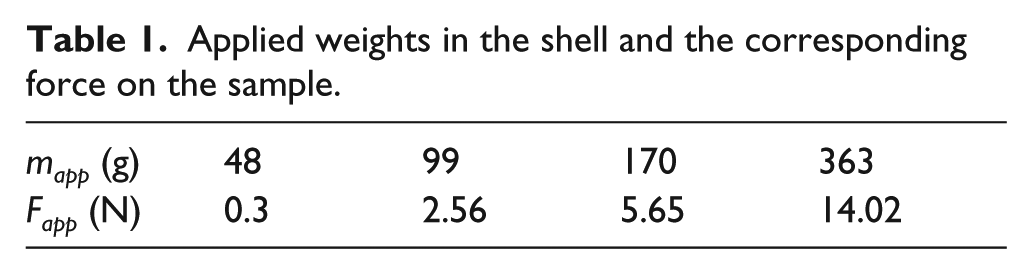
Both the weight of the rod and the electrode as well as the pressure compensation of the spring were approximated with 40 g since the contact between the upper electrode and the sample is ensured only at a weight of 40 g in the shell. Table 1 shows the applied weights in the shell and the forces acting on the sample.
Applied weights in the shell and the corresponding force on the sample.
For the determination of the piezoelectric modulus d33, the voltage potentials at the surfaces and the capacitance of the samples were measured during the applied force on the sample. Figure 1(c) shows the equivalent circuit diagram for the voltage measurement of the examined piezoelectric samples.
In measuring the capacitance, the total capacitance (Ctot) has been recorded in the connected component. This included the capacitance of the sample (Cp) and the parasitic capacitance of the cables (Cl) (Figure 1(c)). The capacitances were connected in parallel in this measurement setup. The total capacitance (Ctot) can thus be calculated using the following equation

Statistical analysis
All values are represented as mean and standard deviation of at least three measurements. Statistical analysis was performed using Microsoft Excel 2013.
Results
Effect of polymer concentration on scaffold morphology
The polymer concentration is one of the variables for controlling the scaffolds morphology due to the large variations in the viscosity of the solution caused by increasing the concentration. Figure 2 shows SEM micrographs of electrospun scaffolds made from a polymer solution with 15 and 20 wt% PVDF dissolved in N,N-dimethylformamide and acetone (6:4).
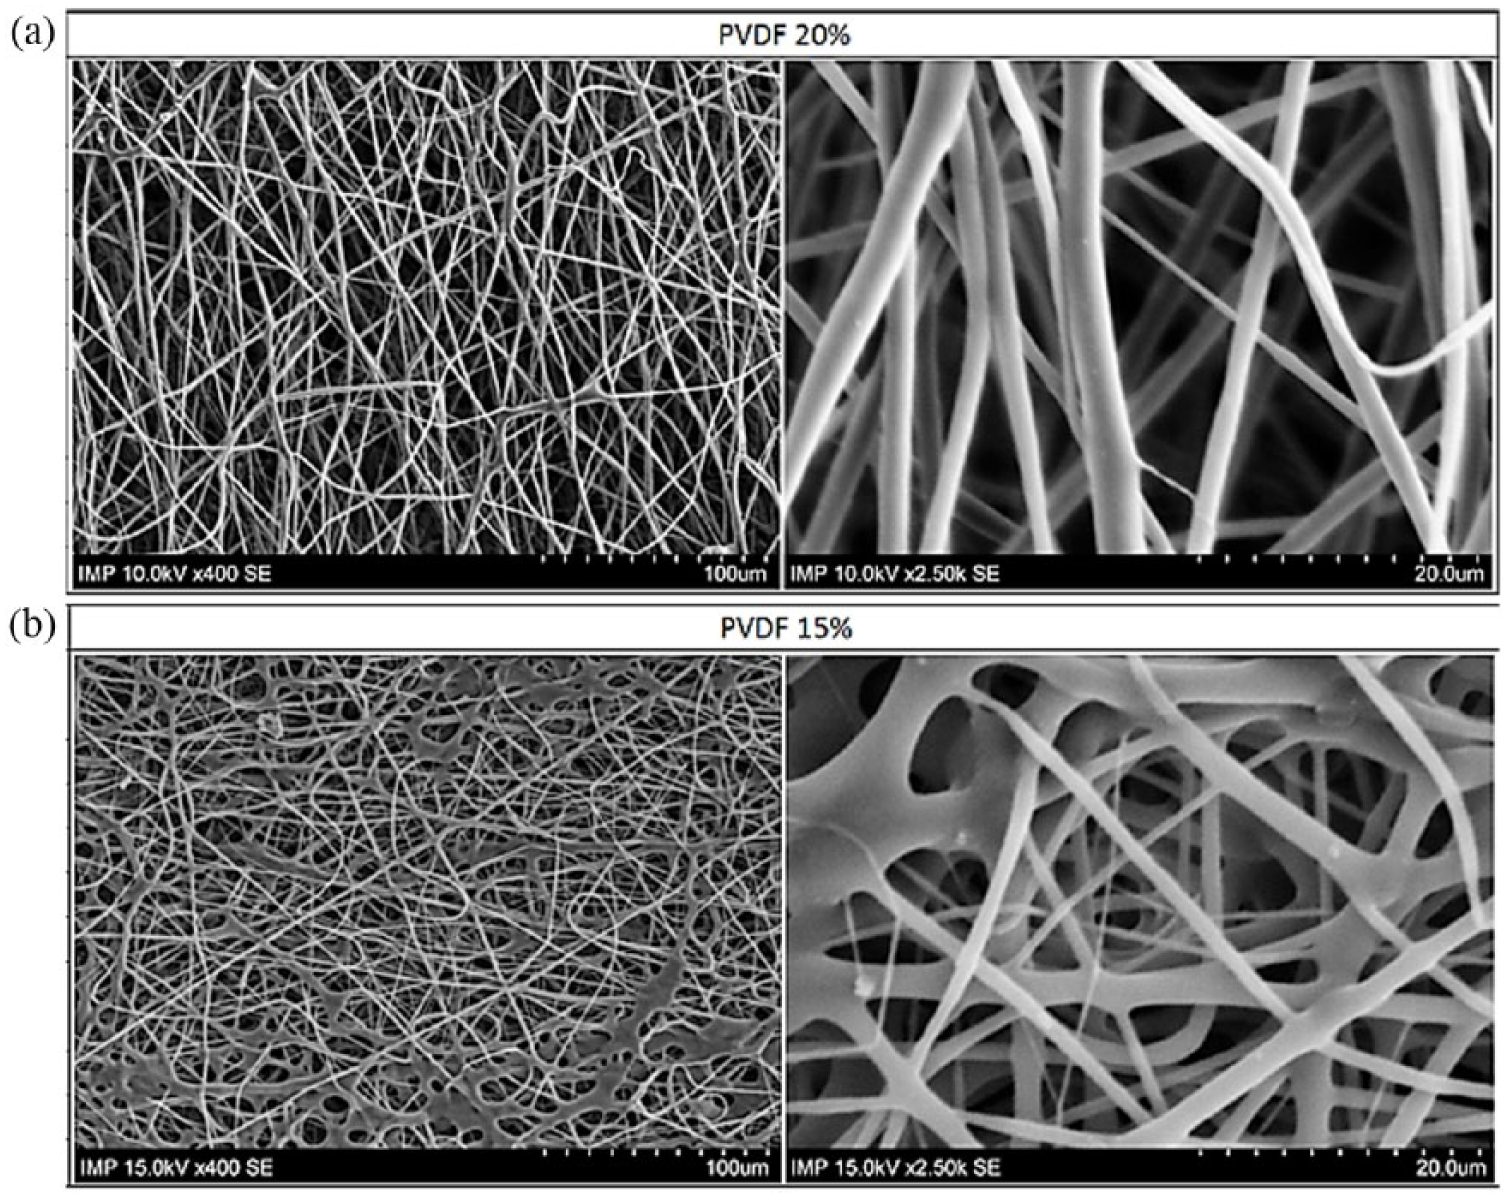
SEM images of electrospun scaffold structure by different PVDF concentrations: (a) 20 wt% and (b) 15 wt%. Magnifications: 400× and 2500×. Voltage: 20–30 kV, flow rate: 2 mL/h, distance nozzle to collector: 20 cm, temperature: 24°C to 25.5°C; humidity: 47%–50%.
As can be seen, scaffolds made of 20% PVDF solution possess homogeneous fiber diameter (2.6 ± 0.4 µm) and distribution. By contrast, the scaffold made of 15% PVDF solution consisted of inhomogeneous fiber diameters (1.5 ± 0.2 µm). The results for 10% PVDF are not shown due to instability of electrospinning process for this polymer concentration.
Compared to PVDF, scaffolds were made from 10%, 15%, and 20% PVDF-TrFE. The SEM images of PVDF-TrFE scaffolds are shown in Figure 3. All scaffolds of the three polymer concentrations had mostly homogeneous fiber diameters, which were lower with decreasing concentration. The following mean fiber diameter was achieved: 0.7 ± 0.4 µm (10%), 0.9 ± 0.6 µm (15%), and 1.5 ± 0.2 µm (20%). In addition, the formation of thickening was determined with decreasing concentration. Previously, Zhao et al. 28 suggested that such increase of thickening is due to decreasing viscosity of the polymer solution.
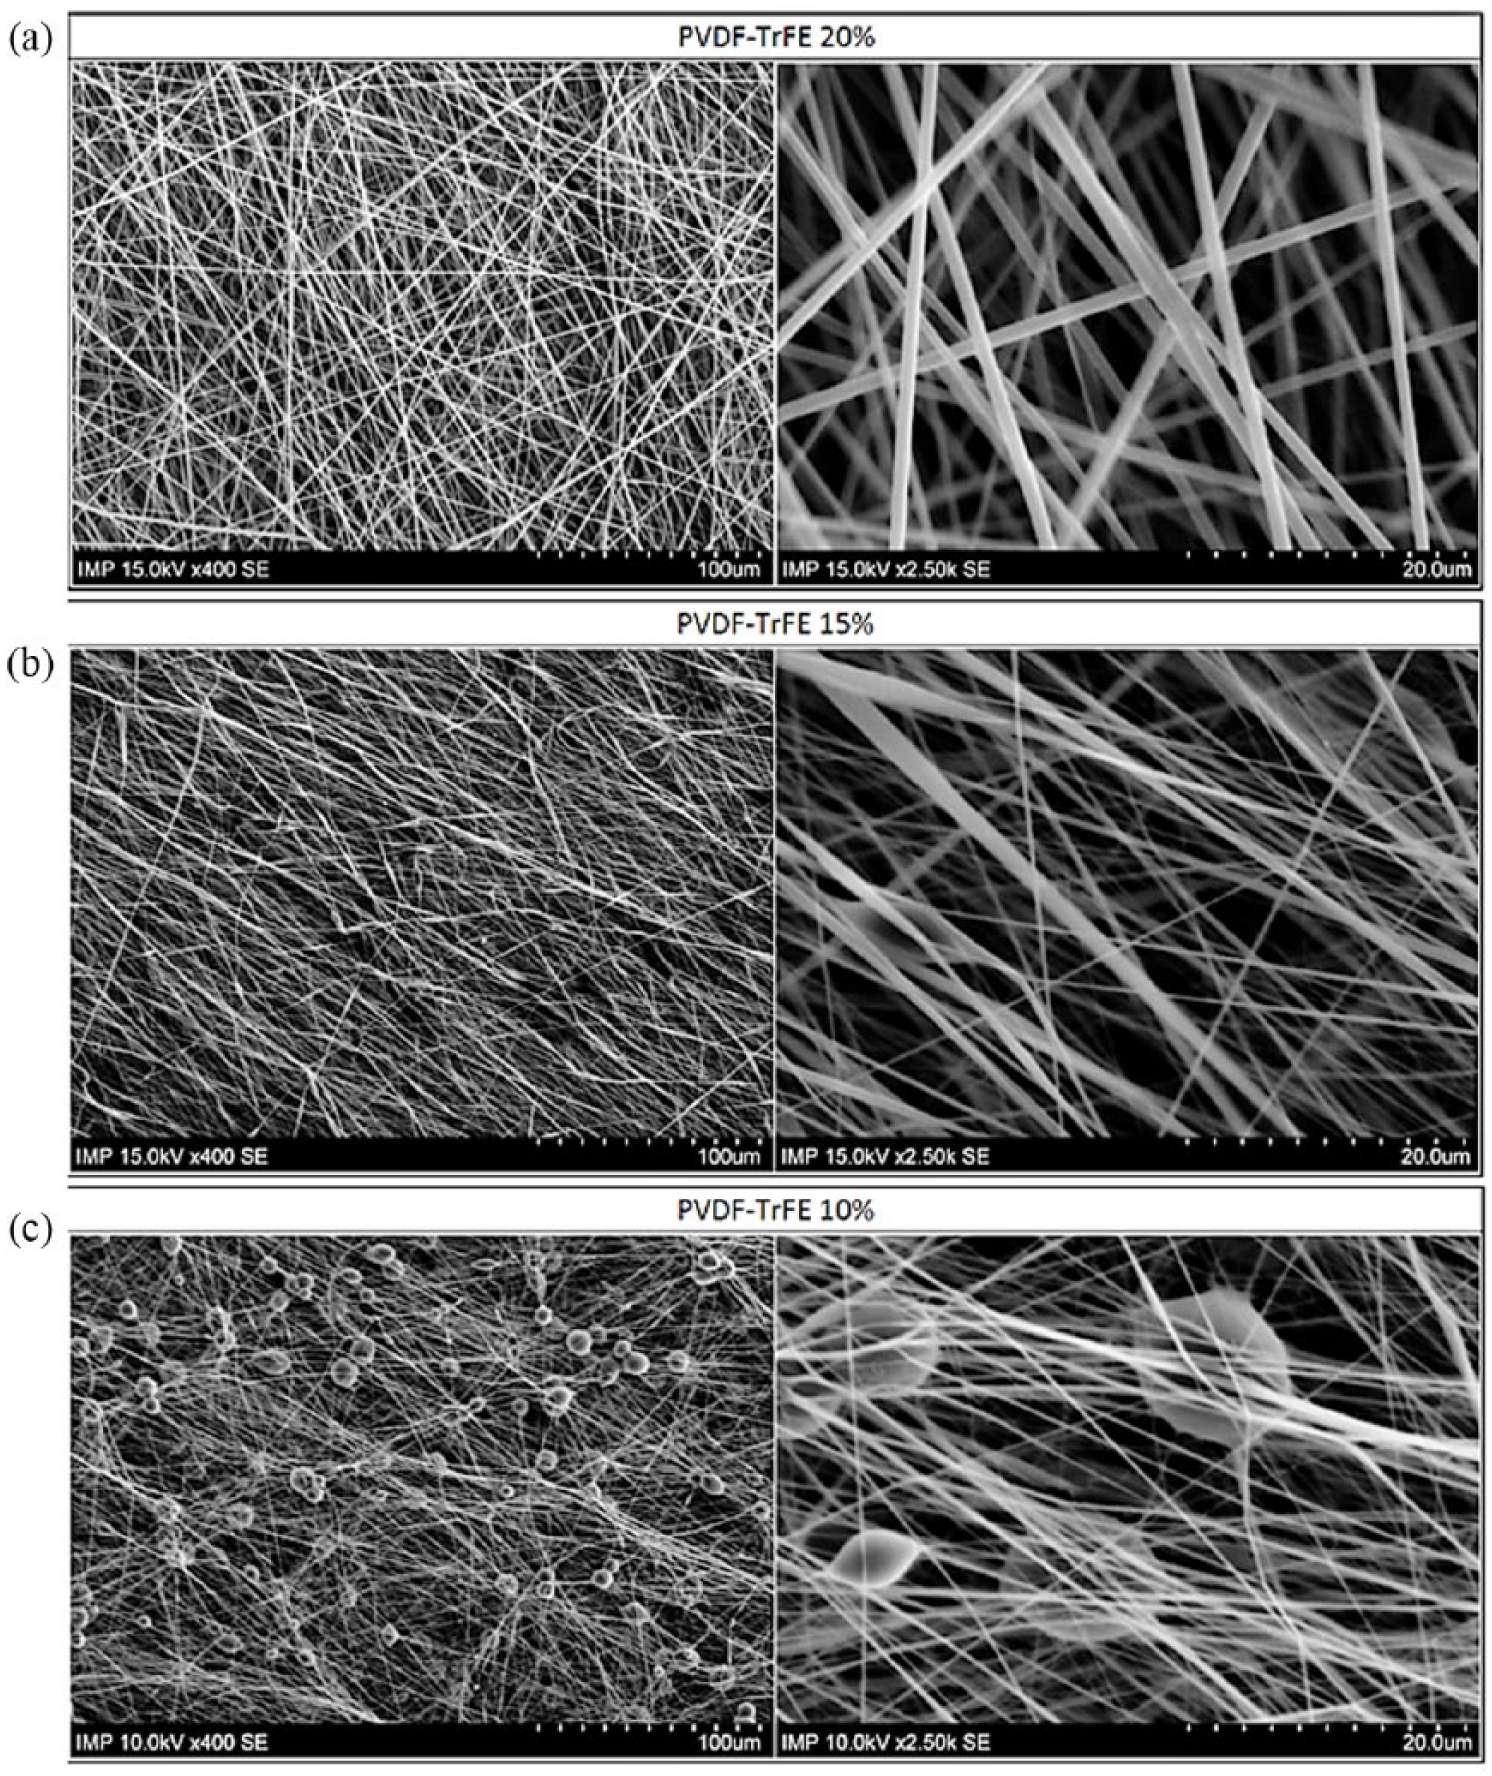
SEM images of electrospun scaffold structure by different PVDF-TrFE concentrations: (a) 20 wt%, (b) 15 wt%, and (c) 10 wt%. Magnifications: 400× and 2500×. Voltage: 20–30 kV, flow rate: 2 mL/h, distance nozzle to collector: 20 cm, temperature: 24°C to 25.5°C; humidity: 47%–50%.
Effect of the polymer concentration on the crystalline β-phase
The study investigated the influence of the polymer concentration on the transformation process of the crystals from α- to the piezoelectric β-phase during electrospinning. In Figure 4(a), FTIR was used to quantify the variation of the PVDF crystal phases. The normalized absorption spectrums of the 15% and 20% PVDF scaffolds were compared with the raw PVDF pellet.
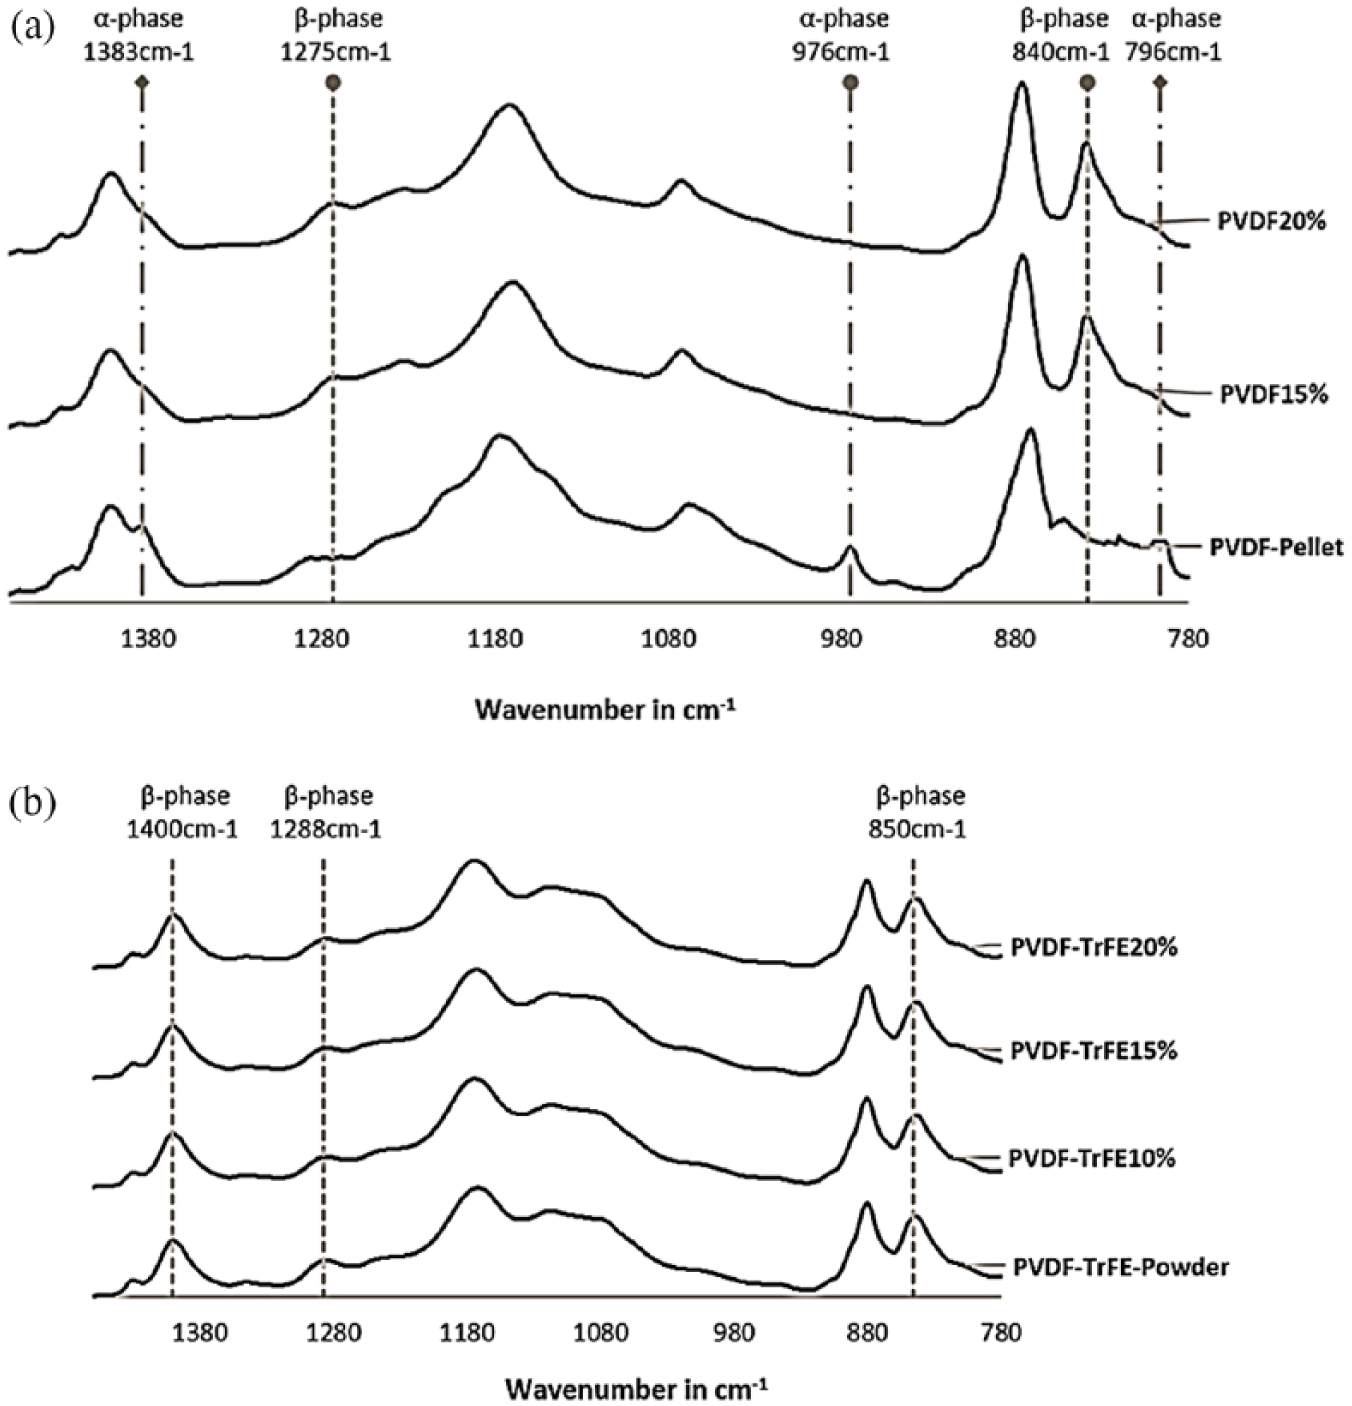
FTIR spectra of (a) raw PVDF pellet and PVDF scaffold made of 15% and 20% polymer concentration and (b) raw PVDF-TrFE powder and PVDF-TrFE scaffolds made of 10%, 15%, and 20% polymer concentration.
The results indicated that both scaffolds from 15% and 20% PVDF have no peaks at 796, 976, and 1383 cm−1 of the α-phase as compared to the raw pellet. The characteristic peaks at 840 and 1275 cm−1 of the β-phase have approximately the same intensity for both scaffolds.
Figure 4(b) shows the unprocessed PVDF-TrFE powder as well as scaffolds made of 10%, 15%, and 20% PVDF-TrFE by means of electrospinning. In contrast to the PVDF, in which the crystals are converted into the piezoelectric β-crystal-phase during the electrospinning process, the PVDF-TrFE powder shows peaks at the characteristic peaks of the piezoelectric β-phase at 850, 1288, and 1400 cm−1. 29 Thus, the PVDF-TrFE, theoretically, does not require transformation processes for the conversion of crystallites into the β-phase. Furthermore, the three PVDF-TrFE scaffolds show nearly identical peaks at the β-phase-wavelengths.
To examine the crystalline structure and the thermal properties of PVDF in the electrospun scaffolds, Differential Scanning Calorimetry (DSC) was performed for all scaffolds and compared with raw PVDF pellets. Figure 5 shows the DSC thermograms of the raw PVDF/PVDF-TrFE materials and the electrospun PVDF/PVDF-TrFE scaffolds. The melting temperature (Tm) and heat of fusion (H) of these samples were determined from DSC curves as shown in Table 2. The crystallinity (Xc) was calculated mathematically. 30
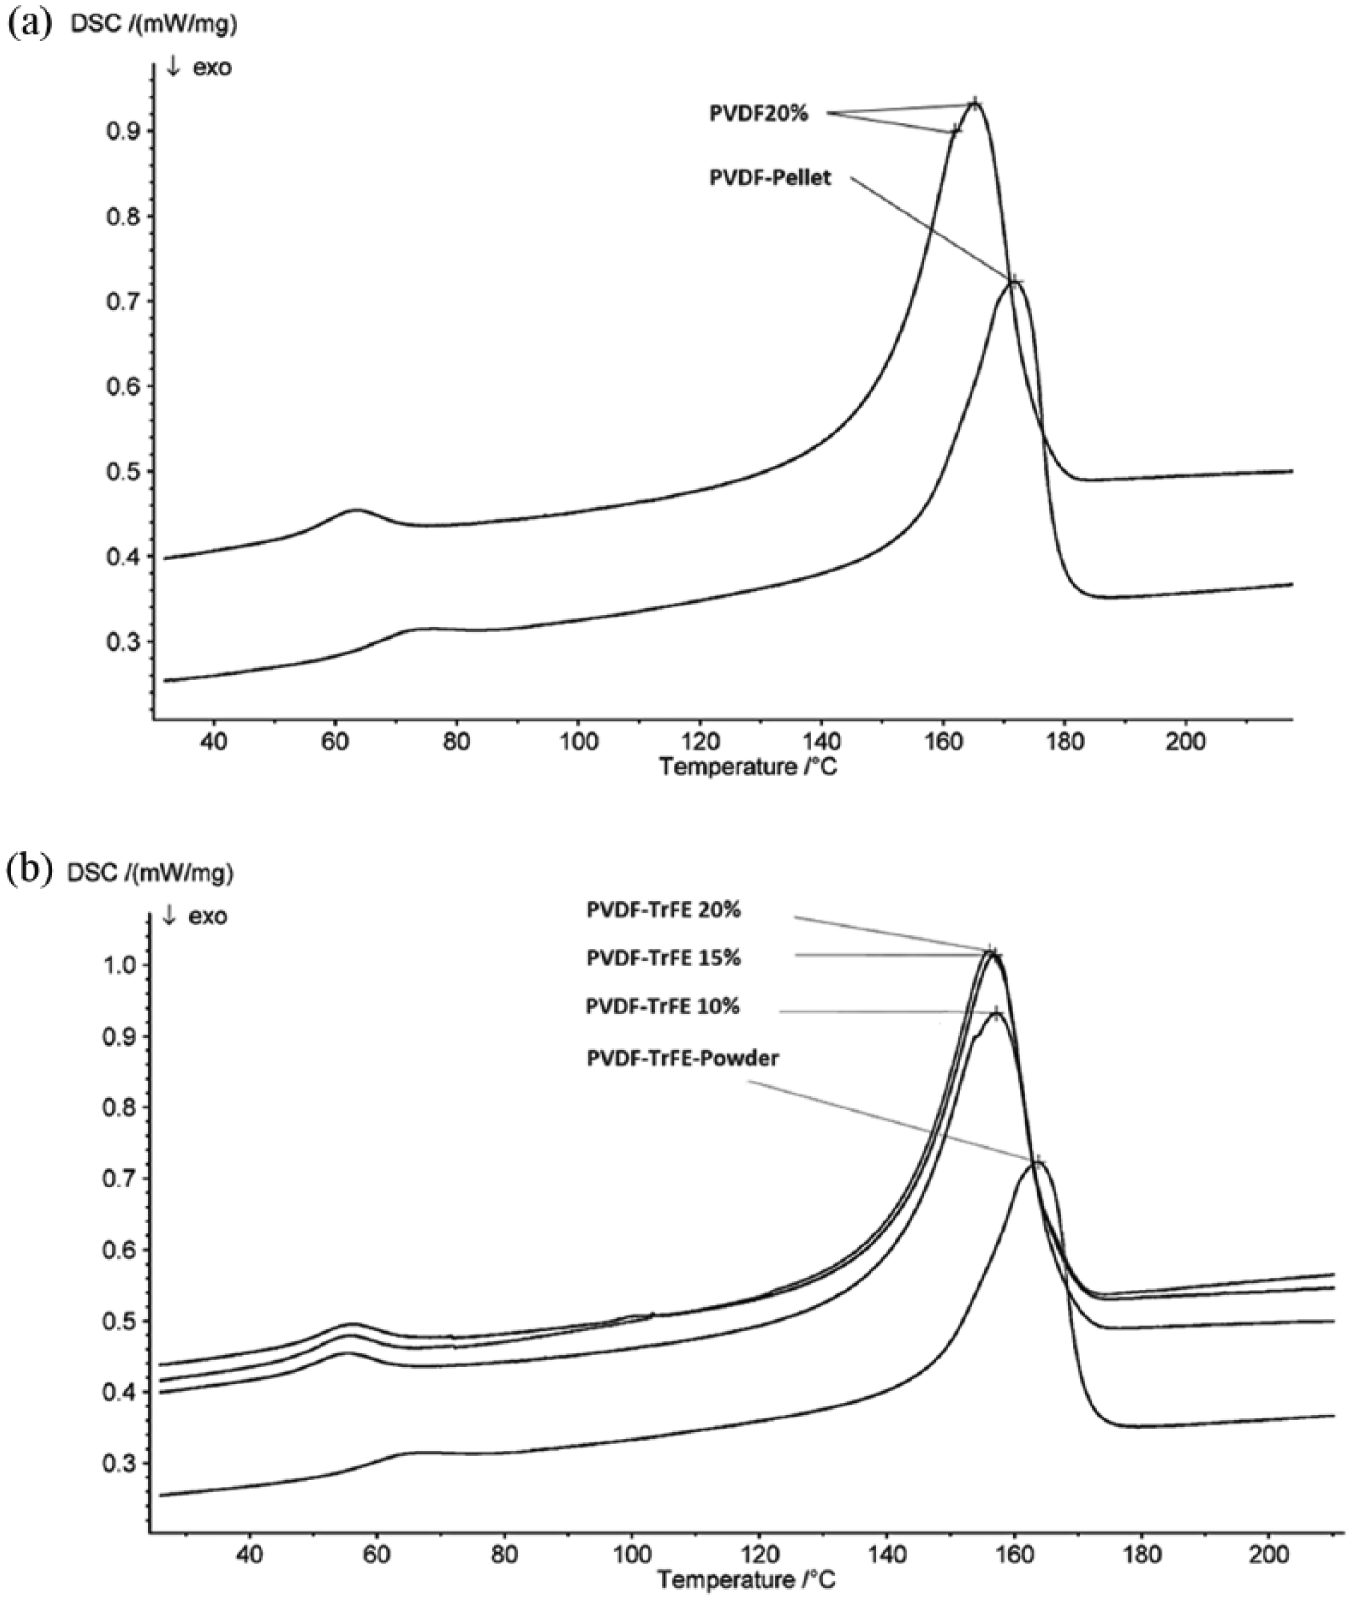
DSC thermograms of used materials: (a) raw PVDF pellet and electrospun PVDF scaffolds with 20 wt% in DMF:acetone (6:4) and (b) raw PVDF-TrFE powder and electrospun PVDF-TrFE scaffolds with 10, 15, and 20 wt% in N,N-dimethylformamide: acetone (6:4).
The heat of fusion and peak melting temperature obtained from the DSC curves of electrospun (a) PVDF and (b) PVDF-TrFE scaffolds and their raw materials.
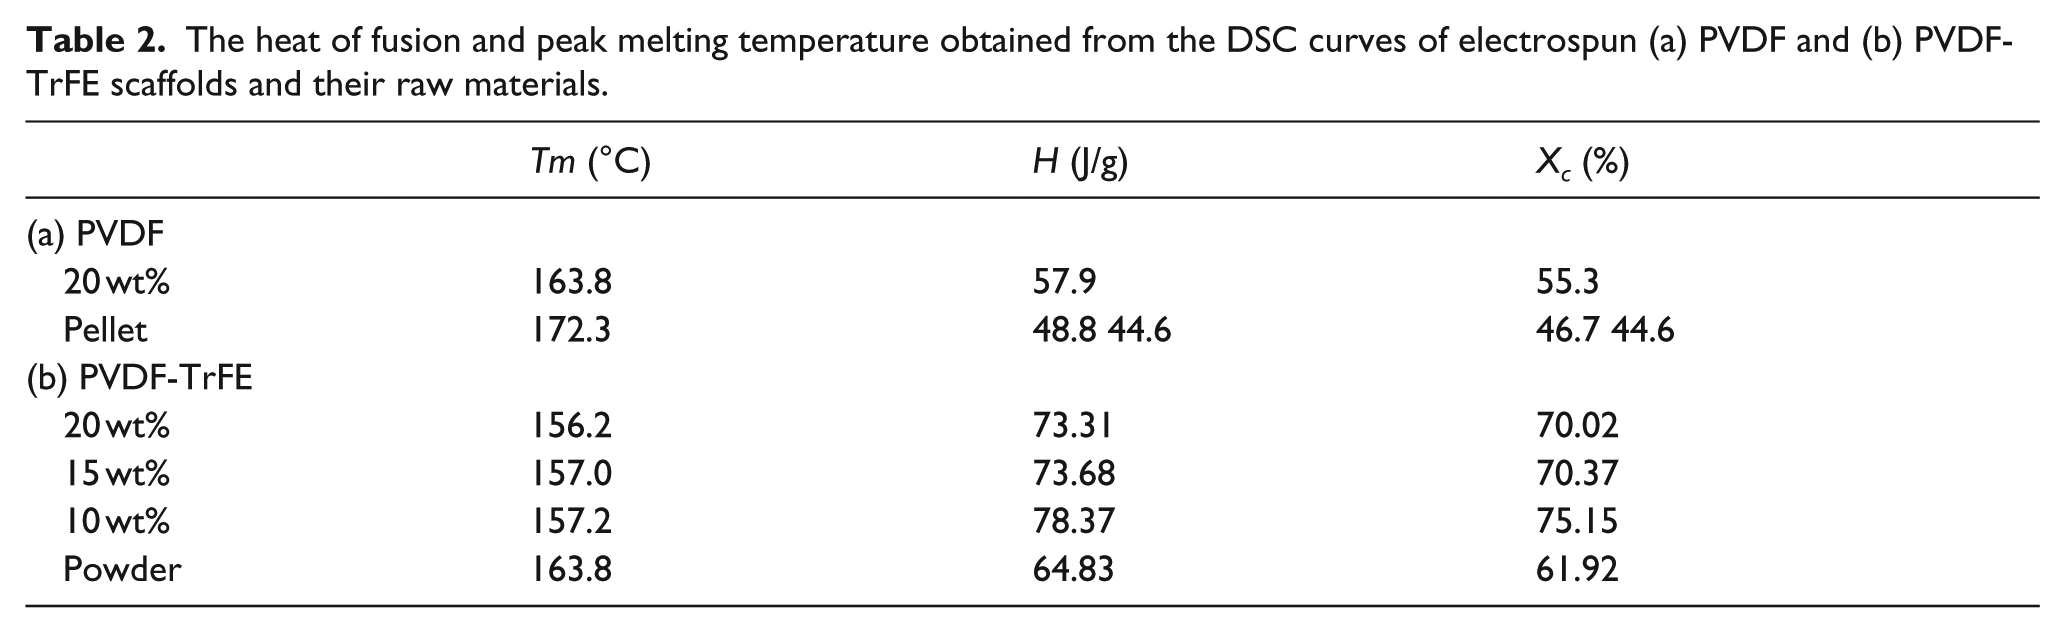
Double melting peaks were observed for the heating scans of the PVDF 20% sample. The melting peak at 163.8°C was attributed to the melting of the induced β-phase by mean of electrospinning. 31 For the raw PVDF pellet, a melting peak at 172.3°C was observed, caused by the melting of the crystalline α-phase. 32 The heat of melting and grade of crystallization for the electrospun PVDF were 57.9 J/g and 55.3%, respectively, whereas those for raw pellet were 48.8 J/g and 46.7%, respectively. Similarly, the electrospun PVDF-TrFE scaffolds shifted their melting temperatures compared to the raw powder. Their thermal enthalpies were higher than the value of the powder and exhibited a better tendency of crystallization.
Measuring the piezoelectric effect using the impact press machine
Five scaffolds per polymer concentration were examined. Each scaffold was manually loaded and unloaded six times, yielding 60 measuring points for each concentration. The quasi-static frequency of the measuring cycle was 0.2 Hz. Figure 6(a) and (b) shows all measured voltages and sample capacitances, respectively. Taking into account the relationship
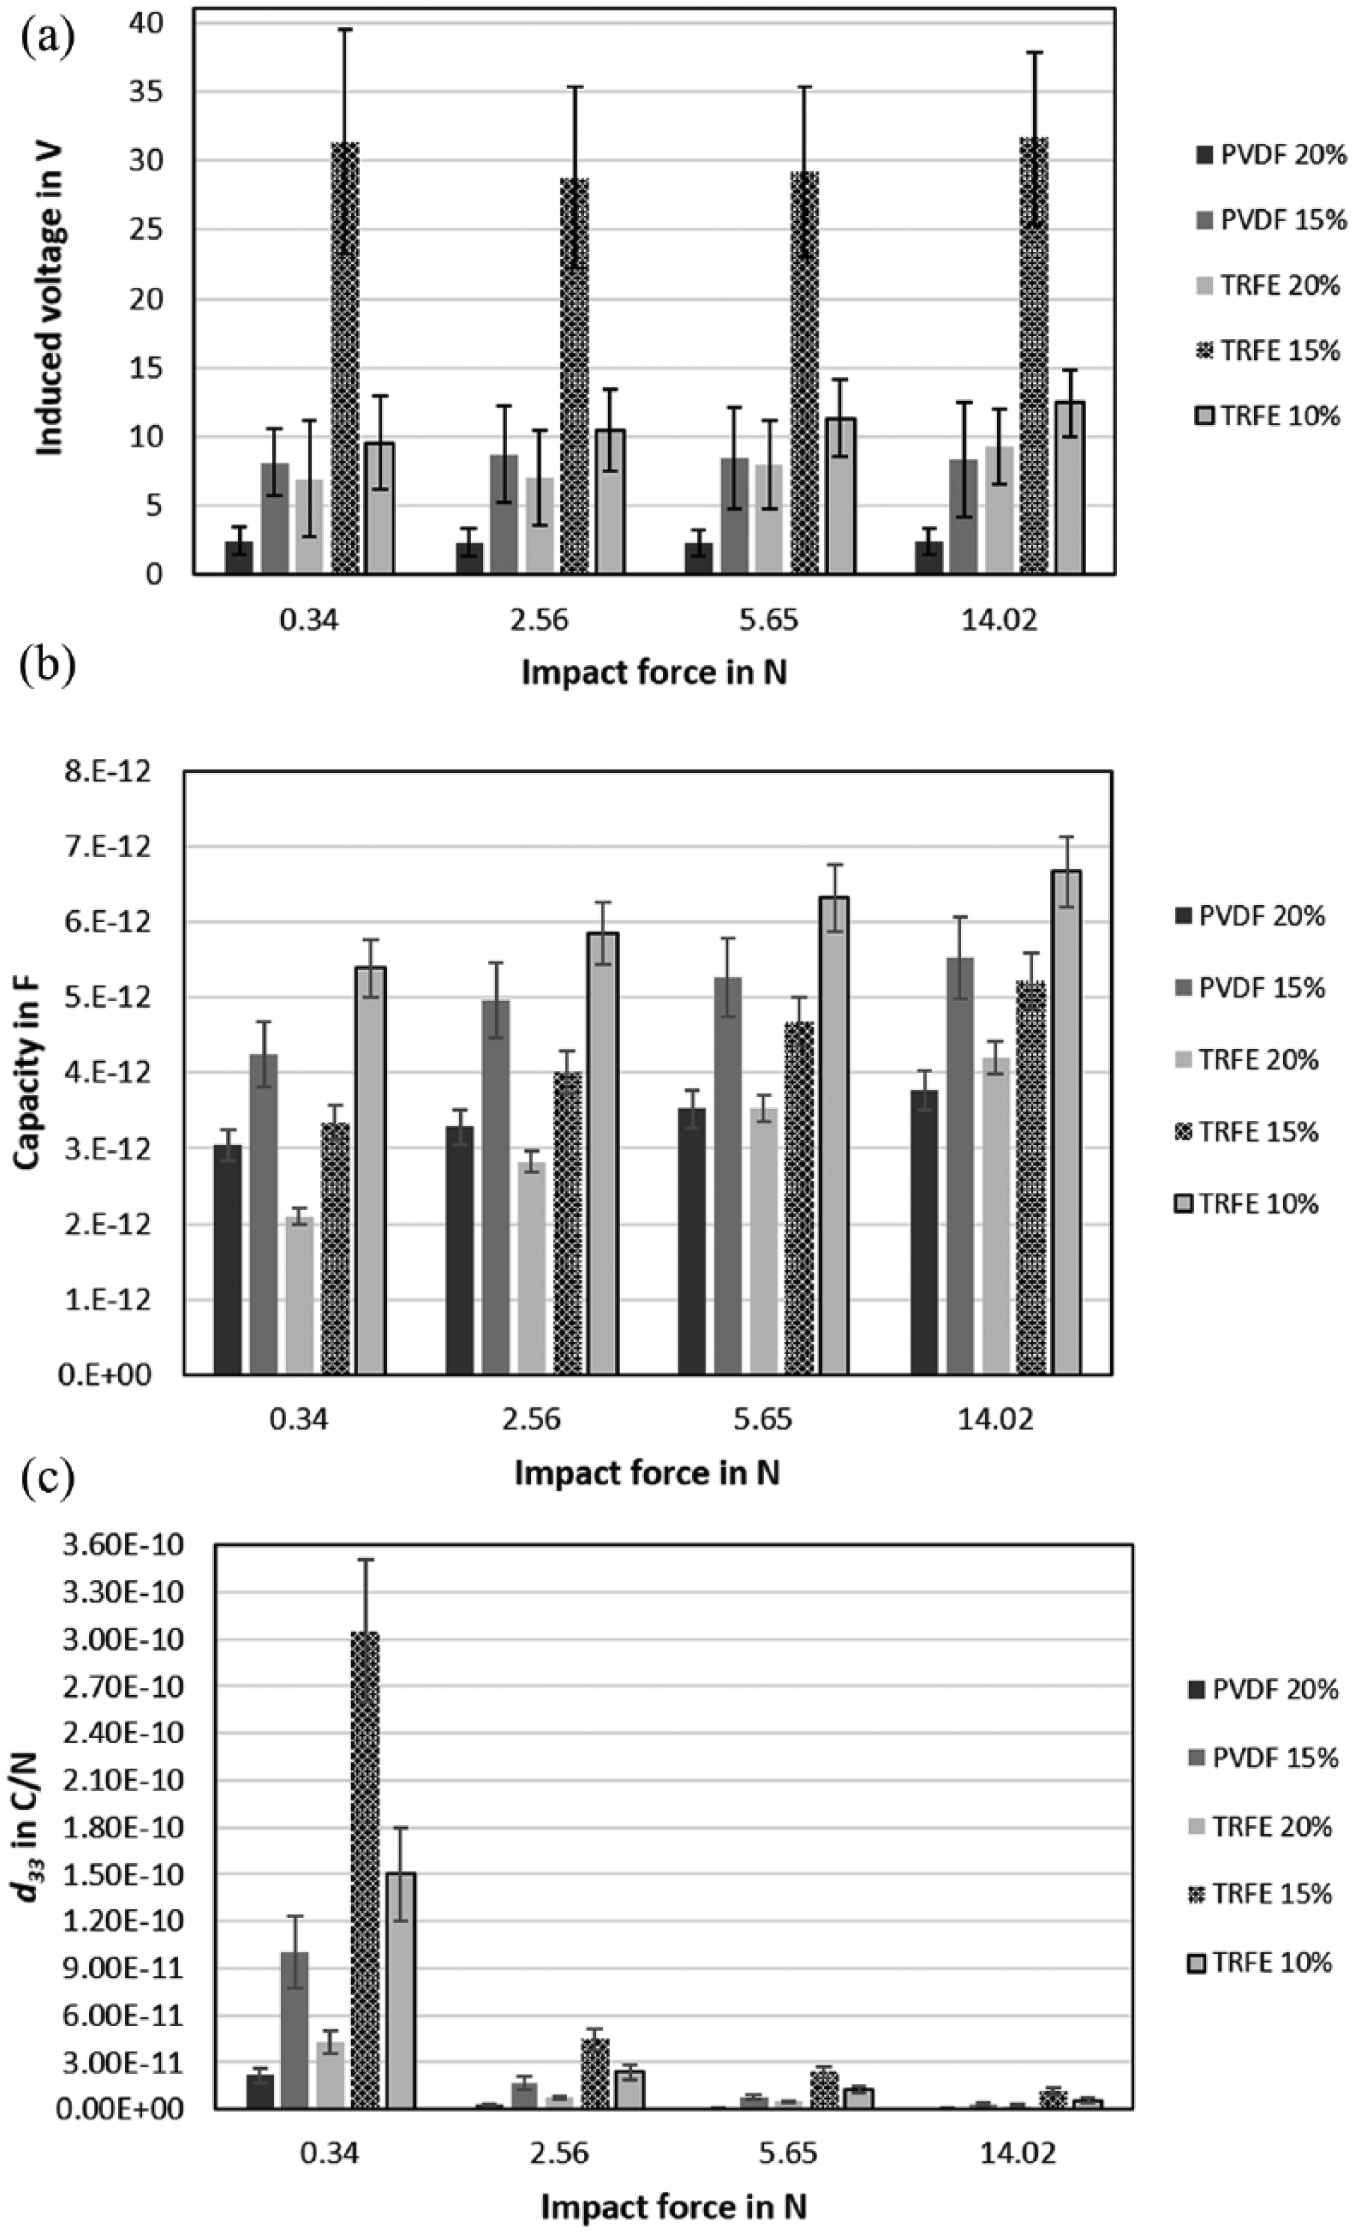
(a) Measured voltages of PVDF and PVDF-TrFE scaffolds. (b) Capacitances of PVDF and PVDF-TrFE scaffolds. (c) Piezoelectric modulus d33 of PVDF and PVDF-TrFE scaffolds (n = 6).
Discussion
This study examined the effect of varying the polymer concentration of PVDF and PVDF-TrFE during electrospinning process on the scaffolds morphology, and structural and thermal properties. FTIR spectroscopy was used to observe changes in crystalline α- and β-phases of final materials, whereas main attention was made to formation of piezoelectric β-phase in the scaffolds. Differences were detected in the structure and β-phase fraction due to increasing the PVDF concentration from 15% to 20% and PVDF-TrFE from 10% to 20%. In addition, the piezoelectric response of the scaffolds was induced using a custom-made impact press machine.
During electrospinning, the concentration of polymer solution has a major effect on fiber uniformity and size. In this study, N,N-dimethylformamide (DMF) and acetone were used as solvents in a 6:4 volume ratio. During the process, acetone evaporates at a faster rate than DMF, whereas DMF has a higher boiling point (153°C) as compared to acetone (56°C). The slower evaporation rate of DMF allowed fibers to stretch and promote the transformation of α-phase to β-phase, while acetone prevented the formation of irregular fiber morphologies and bead formation.33–35
Electrospinning of deferent polymer concentration also had a direct effect on the crystallinity, crystal phases, and Tm when compared with raw materials as measured from FTIR and DSC thermograms. While FTIR analysis was applied to distinguish between α- and β-phases, DSC measurements were performed to analyze the changes in crystallinity of processed and initial materials, which is directly correlated to melting enthalpy and Tm. When compared to raw materials, the electrospun scaffolds of PVDF and PVDF-TrFE showed higher crystallinity, but lower Tm. The melting temperature of the electrospun scaffolds possibly led to the broad distribution of the α- and β-phase crystallites formed in the scaffolds. In other studies, similar lower Tm values have been determined for oriented and poled PVDF films when compared to randomly oriented non-poled PVDF films.36–38 Similarly, FTIR data demonstrated the presence of α- and β-phases in PVDF electrospun scaffolds as well as initial pellet. Here, processing of PVDF solution using electrospinning resulted in stretching of fibers and transformation of α- to β-phase, as detected by simultaneous decrease in peak intensities for α-phase and increase in peak intensities for β-phase (Figure 4(a)), as discussed earlier. Whereas, the spectra for initial PVDF pellet showed only characteristic α-phase peaks.29,39–41
The measured capacitances of the produced PVDF and PVDF-TrFE scaffolds are in the range of a few picofarads. However, theoretical capacitances calculated of a plate capacitor of PVDF and PVDF-TrFE films
The variation in the value of the electrical voltages in the measurement of scaffolds made from the same polymer concentration is also due to the contact area between the electrodes and sample surfaces. However, each sample has an individual surface structure. Thus, each sample generates different electrical voltages under the same mechanical load. Therefore, for the same test, the contact area must be the same in all samples. This is only possible if the sample surfaces are designed to be electrically conductive.
Furthermore, we observed an increase in the measured sample capacitance with increasing load of the same sample. This behavior is due to the definition of capacitance: with loading the sample, its thickness t is reduced and thus the sample capacitance must increase.
Time behavior of the measuring signal
The piezoelectric modulus d33 represents a constant factor between the electrical and mechanical quantities. Therefore, a linear relationship between the applied load and the measured electrical voltages was expected. To investigate this linearity, the samples were loaded with four different forces of 0.3, 2.56, 5.64, and 14.02 N. Contrary to the assumption, the linear relationship could not be established for the investigated types of the scaffolds. Changing the load from 0.34 N to the maximum selected load of 14.02 N did not lead to increased voltage. The independence of the voltage signal from the mechanical stress can be related to the time response of the induced charge of the sample. The charging time was not long enough for the measurement acquisition and therefore the measured voltage could not be fully captured using the designed electronic unit. In the following, the time behavior of the induced charge is calculated and validated.
As the sample is mechanically stressed, the positive and negative charge concentration drift apart in the crystal lattices of the sample generating charged sample surfaces. Figure 1(c) shows the electrical equivalent circuit of the static measurement method. To ensure that the measuring signal stays at the electrodes and does not compensate with the input resistance of the voltmeter Rv, an additional resistor Rm was connected to the voltmeter in parallel. As a result, the entire measuring resistor Rm,tot was reduced compared to the input resistance of the voltmeter Rv so that the measurement is no longer affected by the measuring instrument. Considering the relationship
The transformed equation represents a first-order differential equation of a high-pass element 44
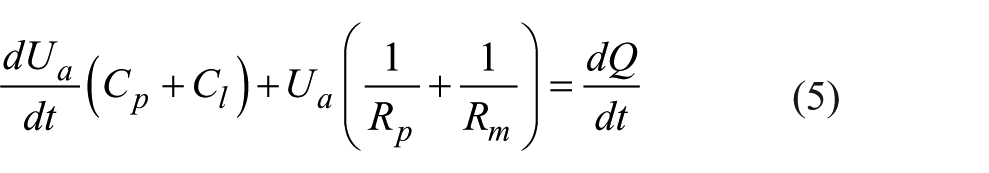
That can be solved analogously to Schrüfer et al.
45
The condition is considered after stimulation
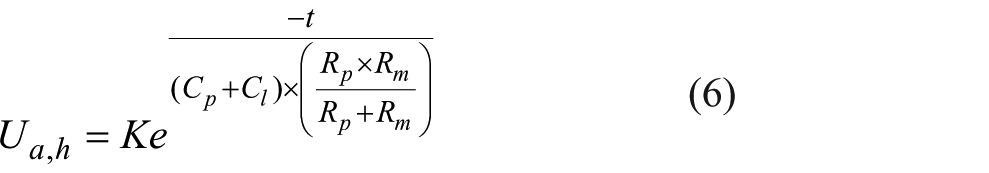
With the boundary condition
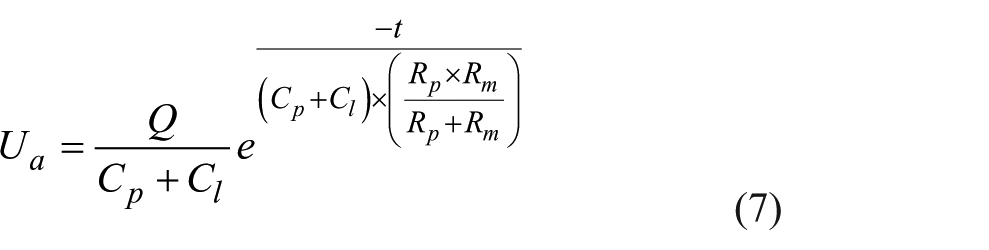
Thus, the differential equation solution gives the time behavior of the induced voltage in the piezoelectric sample, which decreases with the time constant
To summarize, considering the timing of the measured signal, the loading frequency of the measurements must be adjusted. In this piezoelectric study of the PVDF and PVDF-TrFE fibers, the loading on the samples can be considered static, whereas the time constant of the measured signal was in a microsecond range.
Conclusion
The piezoelectric modulus represents a geometry-independent parameter of a material, which is constant under different load profiles (by definition,
In this work, we designed and validated an impact press machine for the piezoelectric investigation of the electrospun fibrous scaffolds from PVDF and PVDF-TrFE. In this method, the sample capacitance and the induced voltage were measured and the induced charge was calculated. In order to reduce the measurement inaccuracies, the measuring charge was processed by designed measuring amplifier considering time behavior of the signal. The results of measurements showed a dependence of the piezoelectric modulus on the load, load frequency, and scaffold thickness. This behavior is due to the nonlinear viscoelasticity of the scaffolds. Since the piezoelectric modulus of the scaffolds did not behave uniformly under different load profiles, it is not possible to predict the induced voltage at a certain load.
For further investigations, the electrical response to a specific load profile must therefore be examined individually for different scaffold geometries. For error-free detection of the induced voltage, a surface-covering contact between the sample surface and the measuring electrodes must be ensured. This can be performed using spinning conducting electrodes from the piezoelectric polymer and graphene oxide, as indicated elsewhere. 46 In addition, for a reproducible production of certain scaffold geometries, a complete control of the electrospinning process (process parameters and environmental conditions) has to be taken into consideration.
Footnotes
Acknowledgements
The authors thank Igor Katz for his great technical assistance and DAAD-financed program of the Leibniz Universitaet Hannover within Strategic Partnership with Peter the Great St. Petersburg Polytechnic University, Russia. Moreover, they are grateful to Professor W.F. Wolkers for significant support with Fourier Transform Infrared Spectroscopy and Differential Scanning Calorimetry measurements.
Declaration of conflicting interests
The author(s) declared no potential conflicts of interest with respect to the research, authorship, and/or publication of this article.
Funding
The author(s) received no financial support for the research, authorship, and/or publication of this article.