
Abstract
The blood damage prediction in rotary blood pumps is an important procedure to evaluate the hemocompatibility of such systems. Blood damage is caused by shear stresses to the blood cells and their exposure times. The total impact of an equivalent shear stress can only be taken into account when turbulent stresses are included in the blood damage prediction. The aim of this article was to analyze the influence of the turbulent stresses on the damage prediction in a rotary blood pump’s flow. Therefore, the flow in a research blood pump was computed using large eddy simulations. A highly turbulence-resolving setup was used in order to directly resolve most of the computed stresses. The simulations were performed at the design point and an operation point with lower flow rate. Blood damage was predicted using three damage models (volumetric analysis of exceeded stress thresholds, hemolysis transport equation, and hemolysis approximation via volume integral) and two shear stress definitions (with and without turbulent stresses). For both simulations, turbulent stresses are the dominant stresses away from the walls. Here, they act in a range between 9 and 50 Pa. Nonetheless, the mean stresses in the proximity of the walls reach levels, which are one order of magnitude higher. Due to this, the turbulent stresses have a small impact on the results of the hemolysis prediction. Yet, turbulent stresses should be included in the damage prediction, since they belong to the total equivalent stress definition and could impact the damage on proteins or platelets.
Keywords
Introduction
Ventricular assist devices (VADs) are technical solutions to improve the life situation of patients with severe heart failure. Nowadays, most VADs are designed as rotary flow pumps. These pumps consist of a rotary and a stationary part, where non-physiologically high shear stresses occur. These shear stresses
Regarding this, flow simulations (computational fluid dynamics (CFD)) combined with blood damage prediction models are commonly used to estimate the cell damage in VADs, for example, to minimize the blood damage within the design process. This is mainly done by evaluating the computed shear stresses and their exposure times to the blood cells.
If those shear stresses are treated by Reynolds’ decomposition, the total, instantaneous, viscous shear stress tensor (bold symbols represent tensors) can be expressed by

where
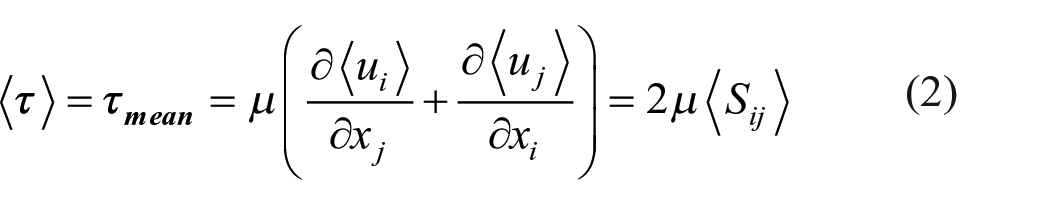
and
In the aforementioned equations,
In this context, the question how turbulence damages blood cells is still not answered.
4
Kameneva et al.
5
showed in their pipe flow experiments that a turbulent flow could have a more harmful influence on hemolysis (damage to red blood cells (RBCs)) than a comparable laminar flow with similar wall shear stresses. Quinlan
6
analyzed the experiment conducted by Kameneva et al. and revealed that the mean shear stresses
Morshed et al.
7
used an energy balance in the pipe flow to show that there is a strong correlation between the flow variable total dissipation rate
In fact, many researchers have suggested to take the total dissipation rate
to evaluate blood cell damage.
9
,
12
,
13
Although it was shown by these authors that this quantity seems to be more appropriate to assess blood damage than the Reynolds stresses, it is still questionable, why the theoretically or experimentally determined hemolysis thresholds of the TVSS seem to be lower than the laminar stress thresholds. Jones suggested that this is due to the treatment of TVSS in a time-averaged framework. He argued that the instantaneous (time-dependent) shear stresses which correlate with the instantaneous dissipation rates, were expected to be much higher and could cause damage to blood cells. The treatment of the instantaneous shear stress
Despite the many unknown issues, it is certain that turbulence has an impact on the blood cells. Hence, the stresses from the turbulent field should generally not be disregarded in the numerical damage prediction in a VAD’s flow. 15 , 16
Nowadays, the flow simulations in VADs are commonly conducted using unsteady Reynolds-averaged Navier–Stokes (URANS) methods, in which a great part of the turbulent field is modeled.
17
Furthermore, the viscous shear stresses in the flow field are commonly analyzed using equivalent, scalar representations,
16
,18–25 which are based on the second invariant
But, many CFD studies do not include all components in their investigation. Often, the contribution from the modeled turbulent stress is neglected, while the resolved ones are included.18–22 By doing so, the impact of the turbulent stresses on the total equivalent stress is just partly considered in the blood damage estimation.
On this account, the first aim of this article is to state the three components of an equivalent shear stress definition. It is shown that the resulting total equivalent stress can be linked to a physical flow variable, the total dissipation rate
The second aim of this article is to quantitatively analyze the influence of the turbulent stresses on the blood damage prediction. With the derived total equivalent shear stress, three damage models were applied to the flow to numerically predict the blood trauma in the VAD. Afterward, the damage prediction was performed a second time with an equivalent stress definition, where just mean stresses were considered and the resolved and modeled turbulent stresses were omitted. Then, the percentage differences between both results were used to investigate the influence of the turbulent stresses on the damage prediction.
The simulations were performed using the large eddy simulation (LES) method. Idea of this method is to resolve the greatest part of turbulence (at least 90% of the turbulent kinetic energy) 28 directly in the flow field, while a small share of turbulence is modeled by a turbulence model. It is shown in this article that the performed simulations, in fact, directly resolve for the greatest share of the computed turbulent stresses. To realize this, a numerical setup with a spatially and temporally high discretization was used, which is explained subsequently.
Methods
Computational setup
Pump geometry
The flow field of an axial, rotary flow pump was investigated. This VAD has been designed in our institute. The design was inspired by axial flow VADs, which are currently in clinical use. The design principles are briefly explained as follows.
After choosing the inner (11 mm) and outer (16 mm) diameter, meridian lines were placed between hub and casing to set the blade angles for a chosen nominal operation point
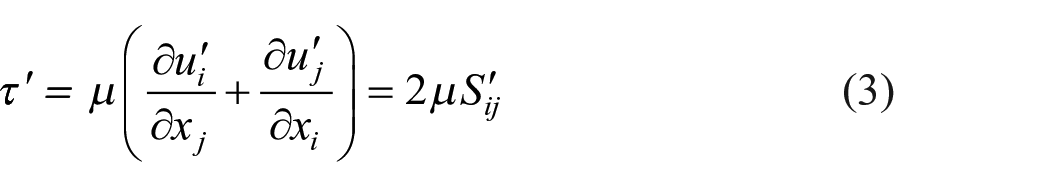
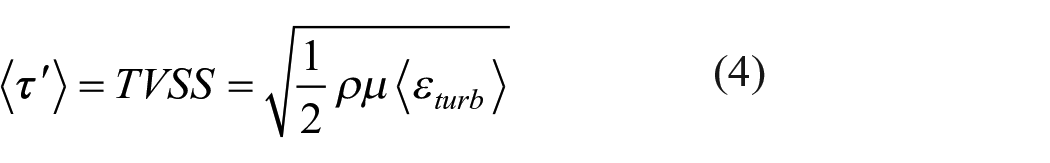
The VAD within the computational domain is illustrated in Figure 1(a). It consists of a two-bladed rotor, an inlet guide vane with five, slightly bended blades, to apply a counter-swirl, which theoretically leads to an increased pressure head for a specific rotational speed, and a three-bladed outlet guide vane.
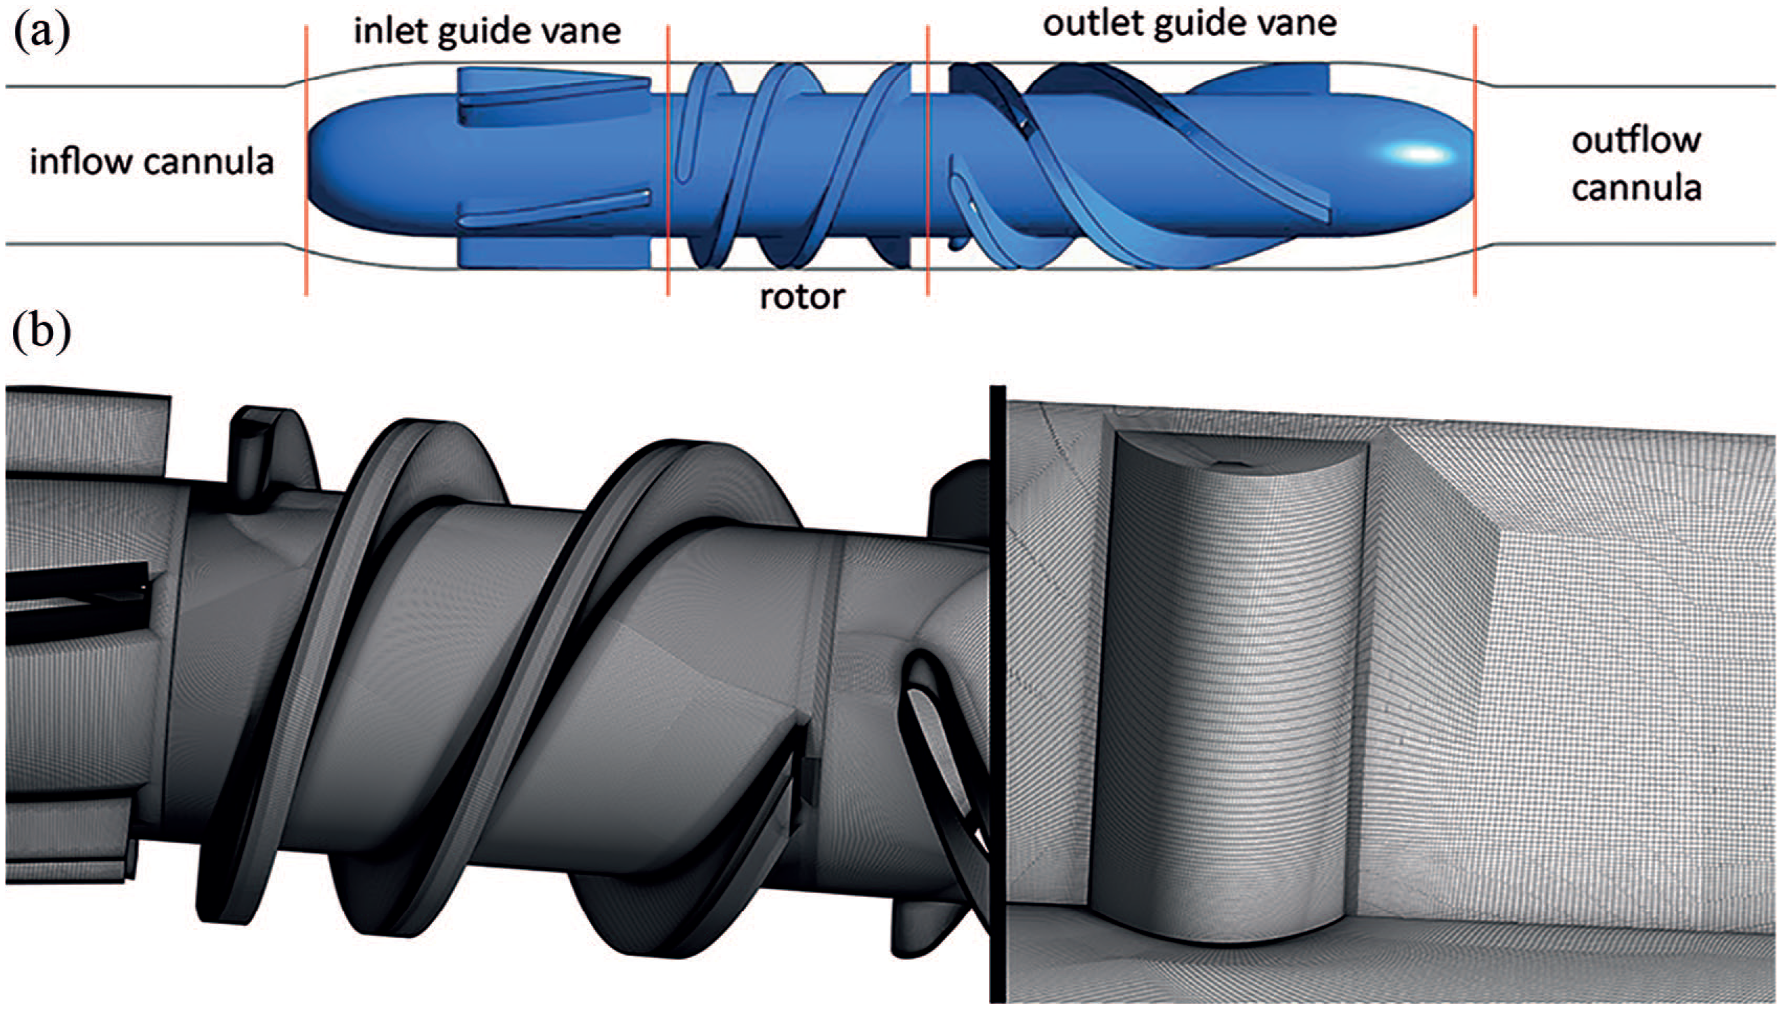
Numerical setup: (a) computational domain and (b) sections of the LES mesh. Left: surface mesh on the hub and the blades. Right: cut-plane through the volume mesh near the rotor’s leading edge.
This VAD was designed for research solely. Hence, a bearing concept for a clinical use was not considered in the design concept. Furthermore, no axial gaps between the rotor and the stators were included in the original design.
The aim of the design was not to build a “perfect” implantable VAD with an optimal flow behavior, but rather a pump, in which the same flow pattern can occur as in real implanted VADs. In these pumps, the inflow angle cannot be optimal during the entire operation time due to the varying input from the remaining heart. Thus, non-optimal inflow angles and flow paths were deliberately accepted at the nominal operation point.
Meshing
The mesh was created in ICEM CFD 18 (Canonsburg, PA, USA) using a block structure with hexahedral elements. Parts of the mesh are displayed in Figure 1(b). The mesh has a size of approximately 100M elements. For mesh construction, literature recommendations for wall-resolving LES
29
,
30
were applied. In doing so, a near-wall mesh was built, which fits the upper limits of
CFD model and simulation setup
ANSYS CFX 17 (Canonsburg, PA, USA) was used to solve the Navier–Stokes equations by a finite volume method.
31
The differential equations were discretized by a bounded central difference scheme in space and a second-order scheme in time. The rotary and stationary parts of the VAD were connected by transient sliding interfaces. Blood was modeled as a Newtonian fluid with a viscosity of
The simulations were performed at two operation points with flow rates of
The aforementioned flow rates were defined at the outlet of the computational domain and a zero total pressure was set at the inlet. The dynamic Smagorinsky model was applied for turbulence modeling. This model is advantageous compared to standard Smagorinsky models for VAD simulations, since its application is automatically valid for laminar flow regimes and no near-wall corrections are needed. 33
No turbulent inflow conditions were defined at the inlet of the computational domain. Theoretically, the inflow field at
The rotor speed was 7900 r/min, and the time step equals a rotational increment of 1°. Time-averaging was done for 10 revolutions after Root Mean Square (RMS) residuals were smaller than
Experimental examination of pressure heads
The pressure heads via the VAD were measured for comparison with the numerically determined pressure heads. The VAD casing and cannulas were built by milling of two acrylic blocks (Figure 2(a)). The hydraulic components in both blocks, namely, the guide vanes and the rotor, were also constructed by milling of acrylic material. All wetted parts of this measurement cell were hand polished and have tolerances of ≈10 µm. Furthermore, axial gaps of 100 µm had to unavoidably be included between the rotary and stationary parts in the measurement cell, which were not considered in the numerical flow simulations. A motor shaft was integrated into the experimental setup through the outlet guide vane and the outflow cannula. Preliminarily performed URANS simulations indicated that the rotating shaft has a neglectable influence on the pressure measurements. The shaft is fixed through three ball bearings in the acryl block as well as in the outlet guide vane. An electric motor (3564K024B; Faulhaber, Schönaich, Germany) was used as the drive. The measurement cell was included in a test bench (Figure 2(b)). The measurement cell and test bench were constructed according to the guidelines of the DIN EN ISO 9906:2012 for hydraulic measurements in turbomachines.
35
The pressures were measured by two relative pressure sensors (sensor 1: DMU 0,25 ES; Landefeld, Kassel, Germany; sensor 2: P-31-R; WIKA, Klingenberg, Germany) at four positions along the perimeter in the outflow cannula behind and in the inflow cannula before the VAD. A water–glycerol mixture was used as the working fluid. The mixture was adjusted in the way that a dynamic viscosity of
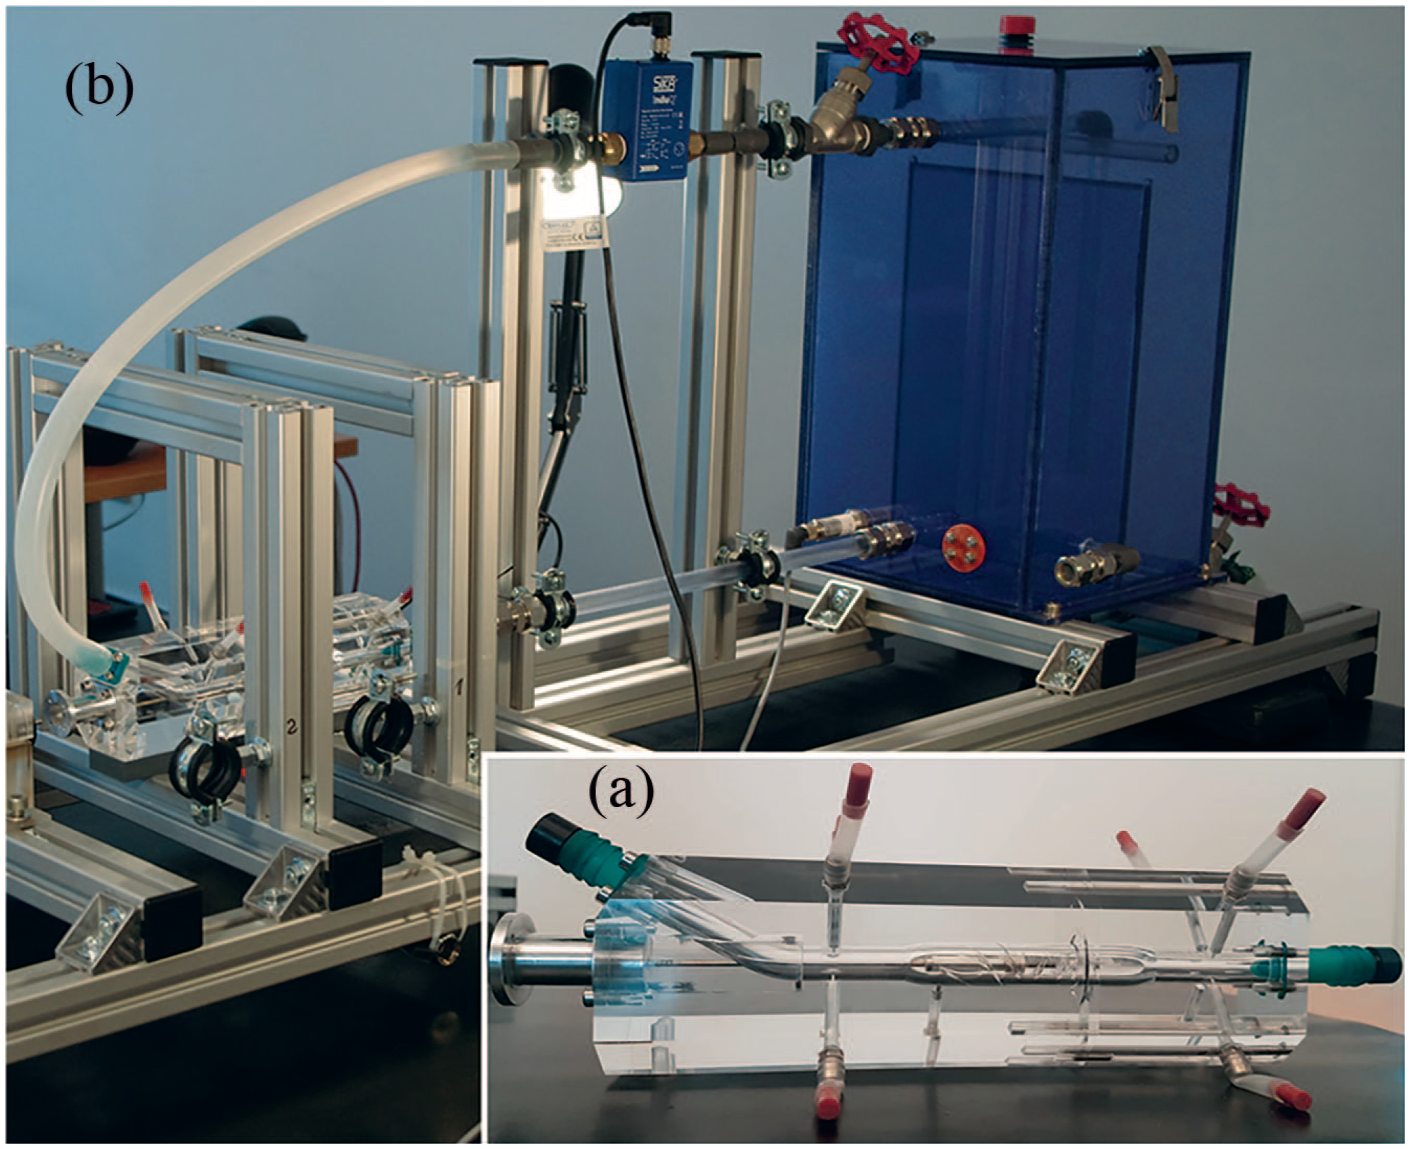
Experimental setup: (a) measurement cell and (b) test bench.
Methods for the analysis
Viscous shear stress formulation and consideration of turbulent stresses
The viscous shear stress is a tensorial quantity and is derived from the velocity gradients of the flow. In complex medical devices, it is common to replace the tensor by an equivalent shear stress formulation. 24
For analyzing the blood damage in VADs, a stress definition based on the second invariant of the strain-rate tensor
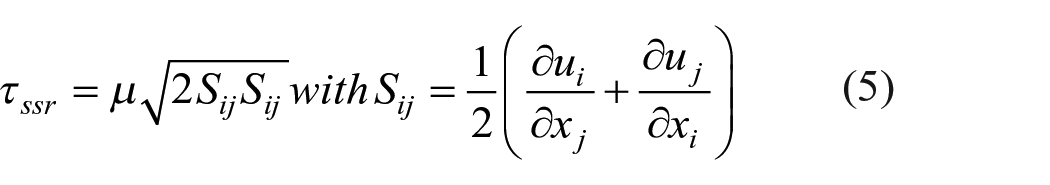
The term within the square root can be directly related to the total dissipation rate

By implementing this variable in the stress formulation, assuming a statistically steady flow field and applying the Reynolds decomposition,
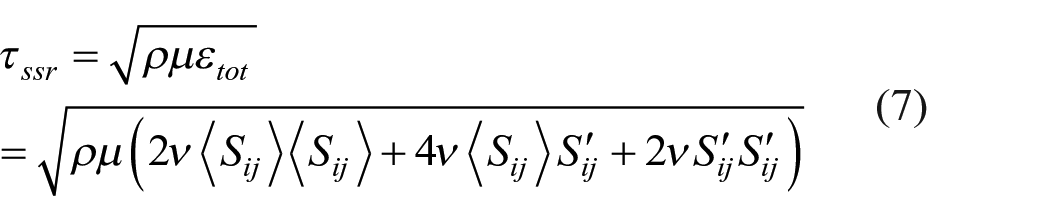
In the design process of a VAD using numerical simulations, the flow field is often not only analyzed in an instantaneous but also in a time-averaged manner. This can be done by averaging equation (7) within the square root (as proposed by Hund et al.). 3
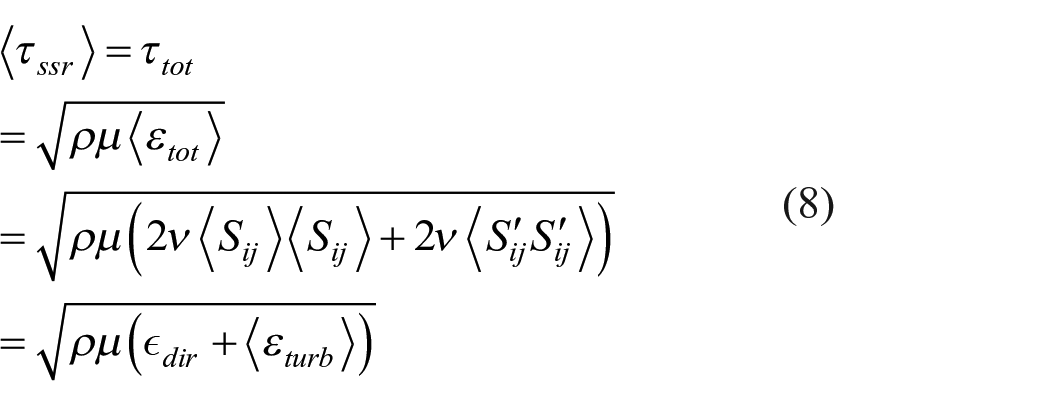
The crossterm
In numerical simulations, the equivalent stress from equations (7) and (8) could only be obtained properly in direct numerical simulations (DNS). But, in most flow simulations within VADs, the fluctuating turbulent flow is entirely or partially modeled by turbulence models. Hence, the turbulent stress component from a turbulence model must be taken into account when analyzing the total equivalent stress field. Following the connection between shear stresses and total dissipation rate from equation (7), the modeled turbulent dissipation rate
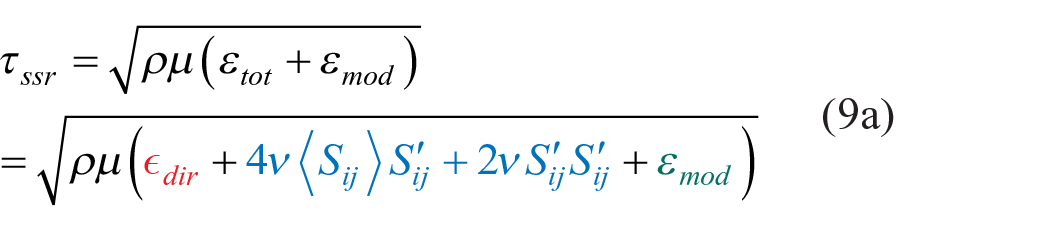
and for the time-averaged, total equivalent stress
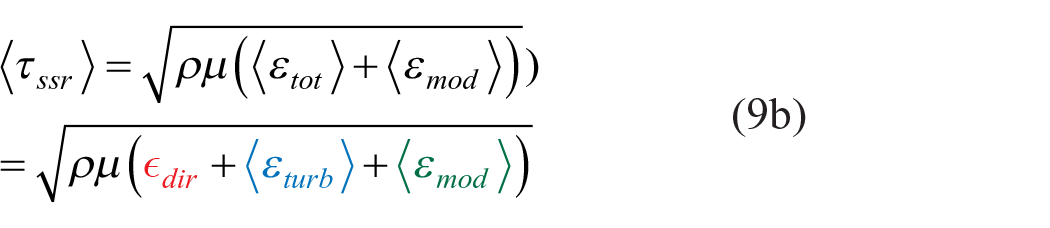
As shown in the aforementioned equation, the total equivalent stress definition contains three components. The contribution from the mean flow (marked in red), from the resolved turbulent flow (marked in blue), and from the modeled turbulent flow field (marked in green).
The direct dissipation rate
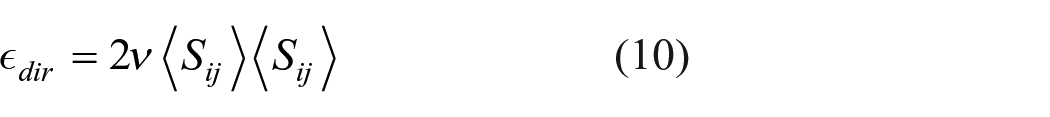
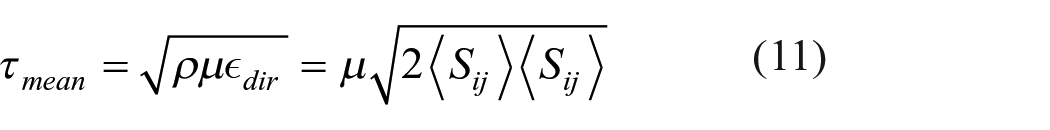
This variable is connected with the mean shear stress
To investigate the influence of these turbulent stresses on the total equivalent stress field and subsequent on the damage prediction, the mean shear stress formulation
With the equivalent stress formulations from equations (9a) and (b) and (11), the blood damage was predicted within the VAD.
Numerical models for the blood damage prediction
Three blood damage prediction models in an Eulerian manner were applied with the aforementioned equivalent stress definitions to estimate the influence of turbulent stresses on the damage prediction.
For the first damage model, the equivalent stresses were taken from the instantaneous field (equation (9a)) and were compared against the mean stresses from equation (11). The first model predicts a hemolysis value
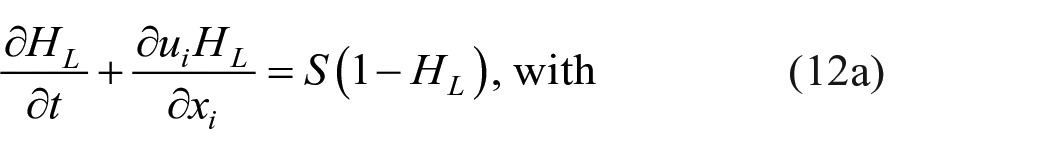

In equation (12a),
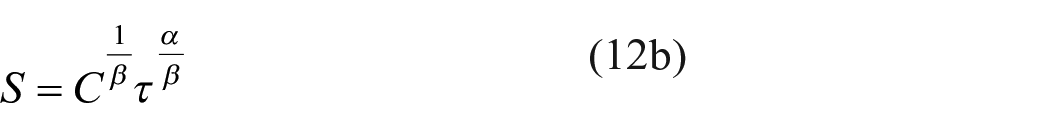
The idea of solving a transport equation for the numerical hemolysis estimation was first introduced by Garon and Farinas.
37
They also proposed a further, numerical damage model, where hemolysis can be quickly approximated by predicting a simplified, averaged hemolysis value
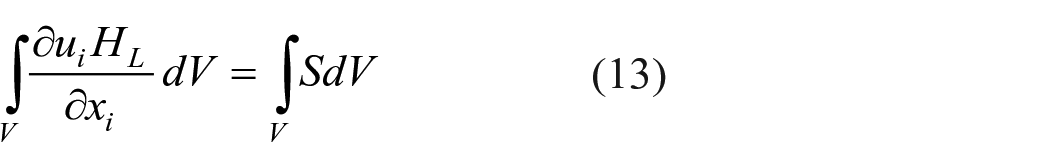
Since the original formulation of Garon and Farinas was used in this article, the term
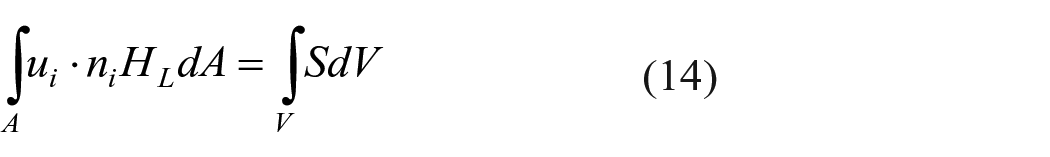
with the surface normal vector
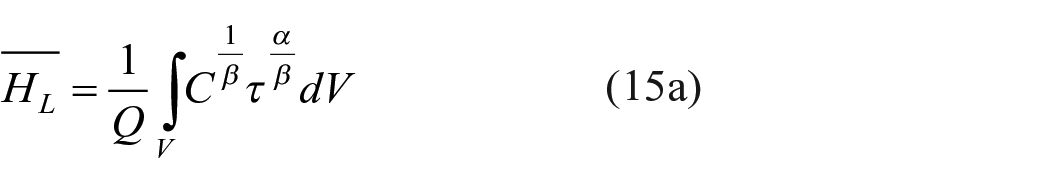
where
Due to its simplicity and many assumptions, this second hemolysis model lacks in accuracy and is just a rough estimator of the real hemolysis process. Nevertheless, it has its justification in the design process of VADs, where lots of simulations are analyzed and compared against each other and the computation of additional transport equations could be too time-consuming.
With the third applied damage model, volumes within the VAD
Power loss analysis for the verification
It was shown that the considered equivalent stresses can be directly correlated with the total energy dissipation
A detailed description of this method is given in the study by Torner et al.
40
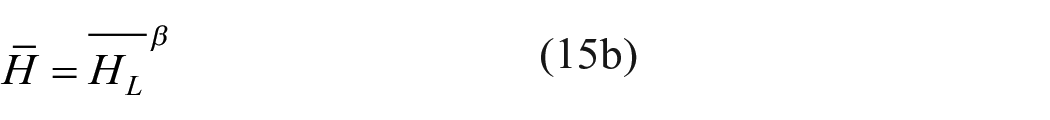
To explain it briefly, the total power loss

Equation (16) is built with the blades moment
From a physical point of view, equations (16) and (17) should lead to the same power loss
Results and discussion
Experimental examination of the pressure heads
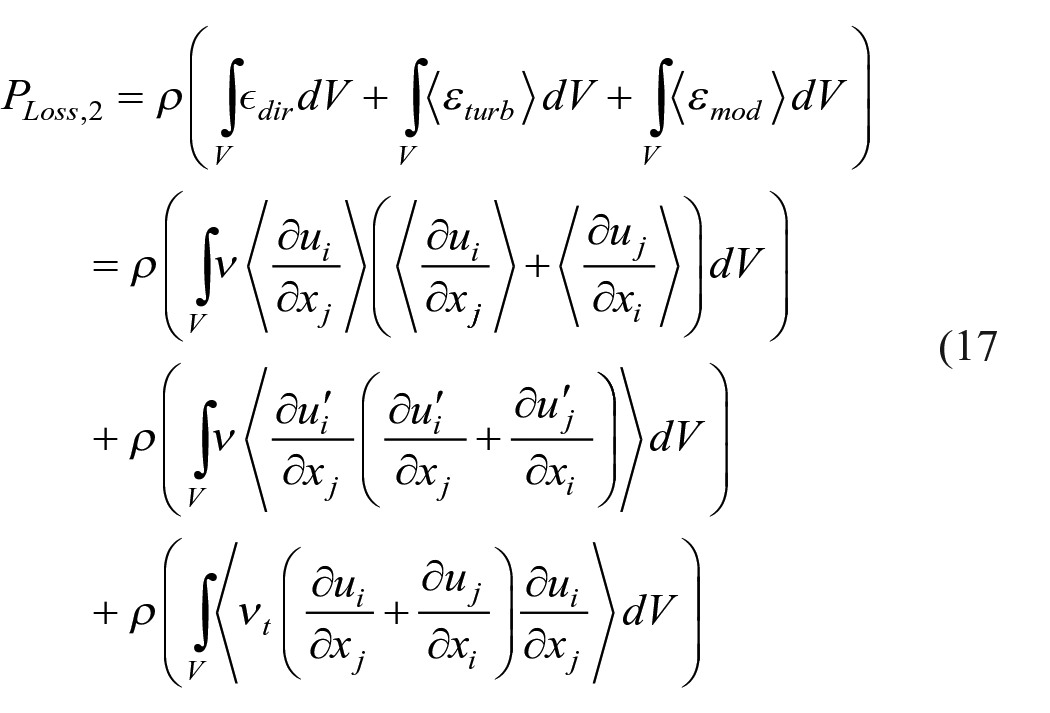
The measured characteristic curve for
Experimentally assessed characteristic curve and comparison with the computed pressure heads from the large eddy simulation (LES).
Verification of the computed equivalent shear stresses
The results of the PLA are shown in Table 1. Similar LES results were also presented and comprehensively discussed in the study by Torner et al. 40 Therefore, only a short summary of the verification is given.
Power loss analysis (PLA) results for both operation points.
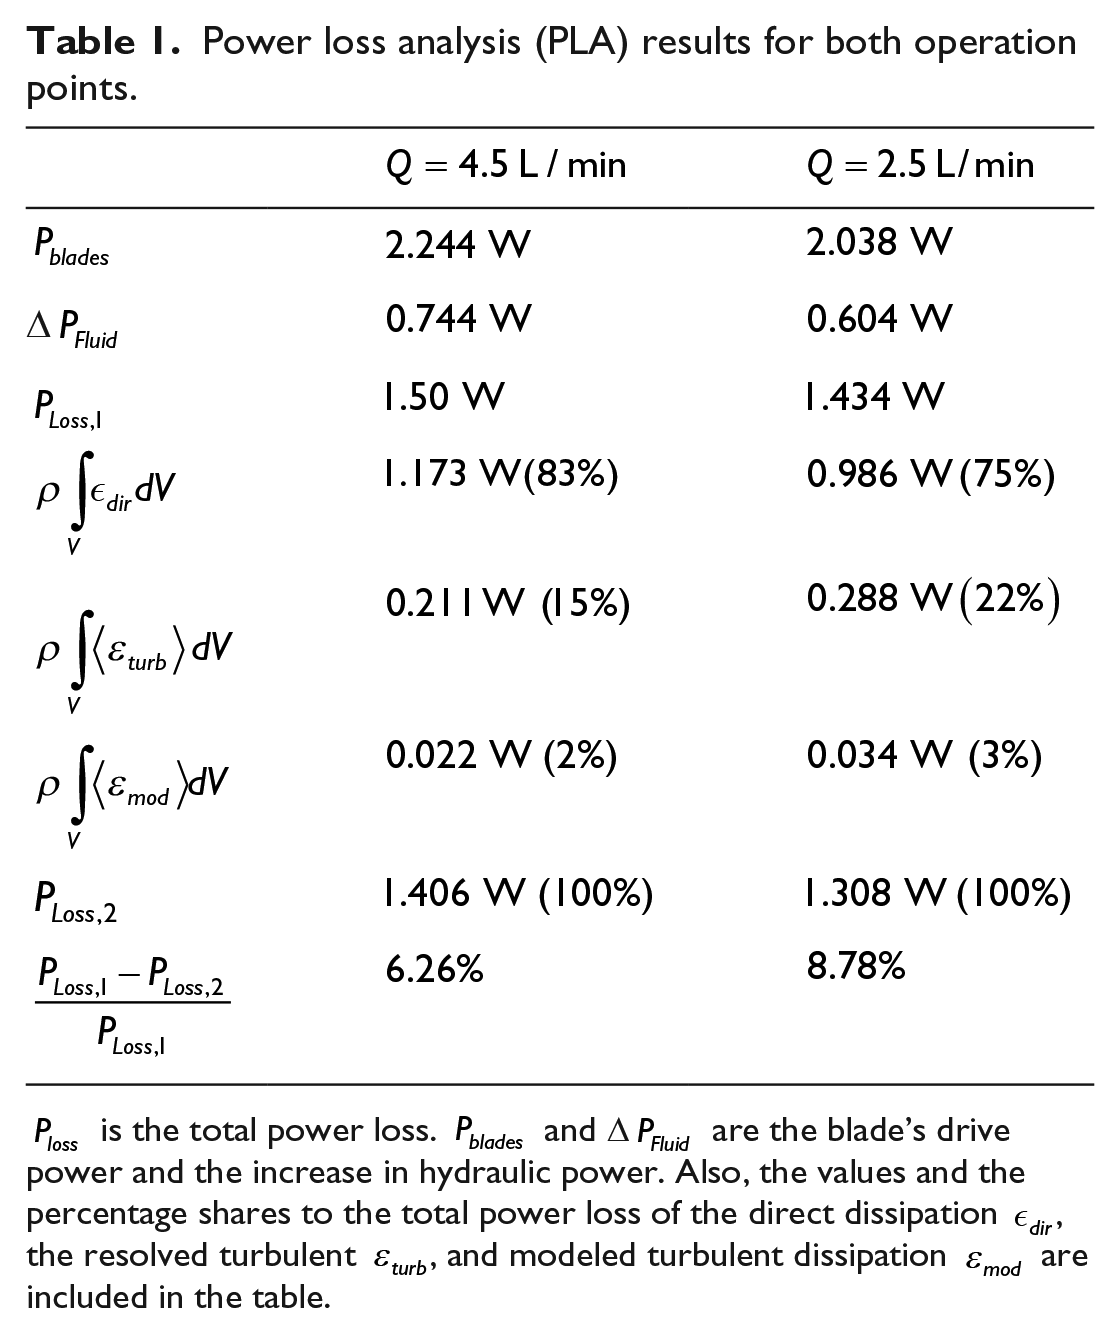
As it can be seen from the table, the direct dissipation
The relatively small deviations of around 6% and 9% let us conclude that the LES computations are generally capable of reflecting the majority of the flow losses and significant portions of the considered equivalent shear stresses are adequately resolved from a global perspective.
It can be seen from the PLA results that the “shear-related” losses
Influence of turbulent stresses on blood damage prediction results
The results for the two operation points are shown in Tables 2 and 3. The values on the right hand side (RHS) of the tables present the percentage difference between the respective total equivalent shear stress from equations (9a) and (b) and the mean shear stress
Blood damage prediction results for the operation point with
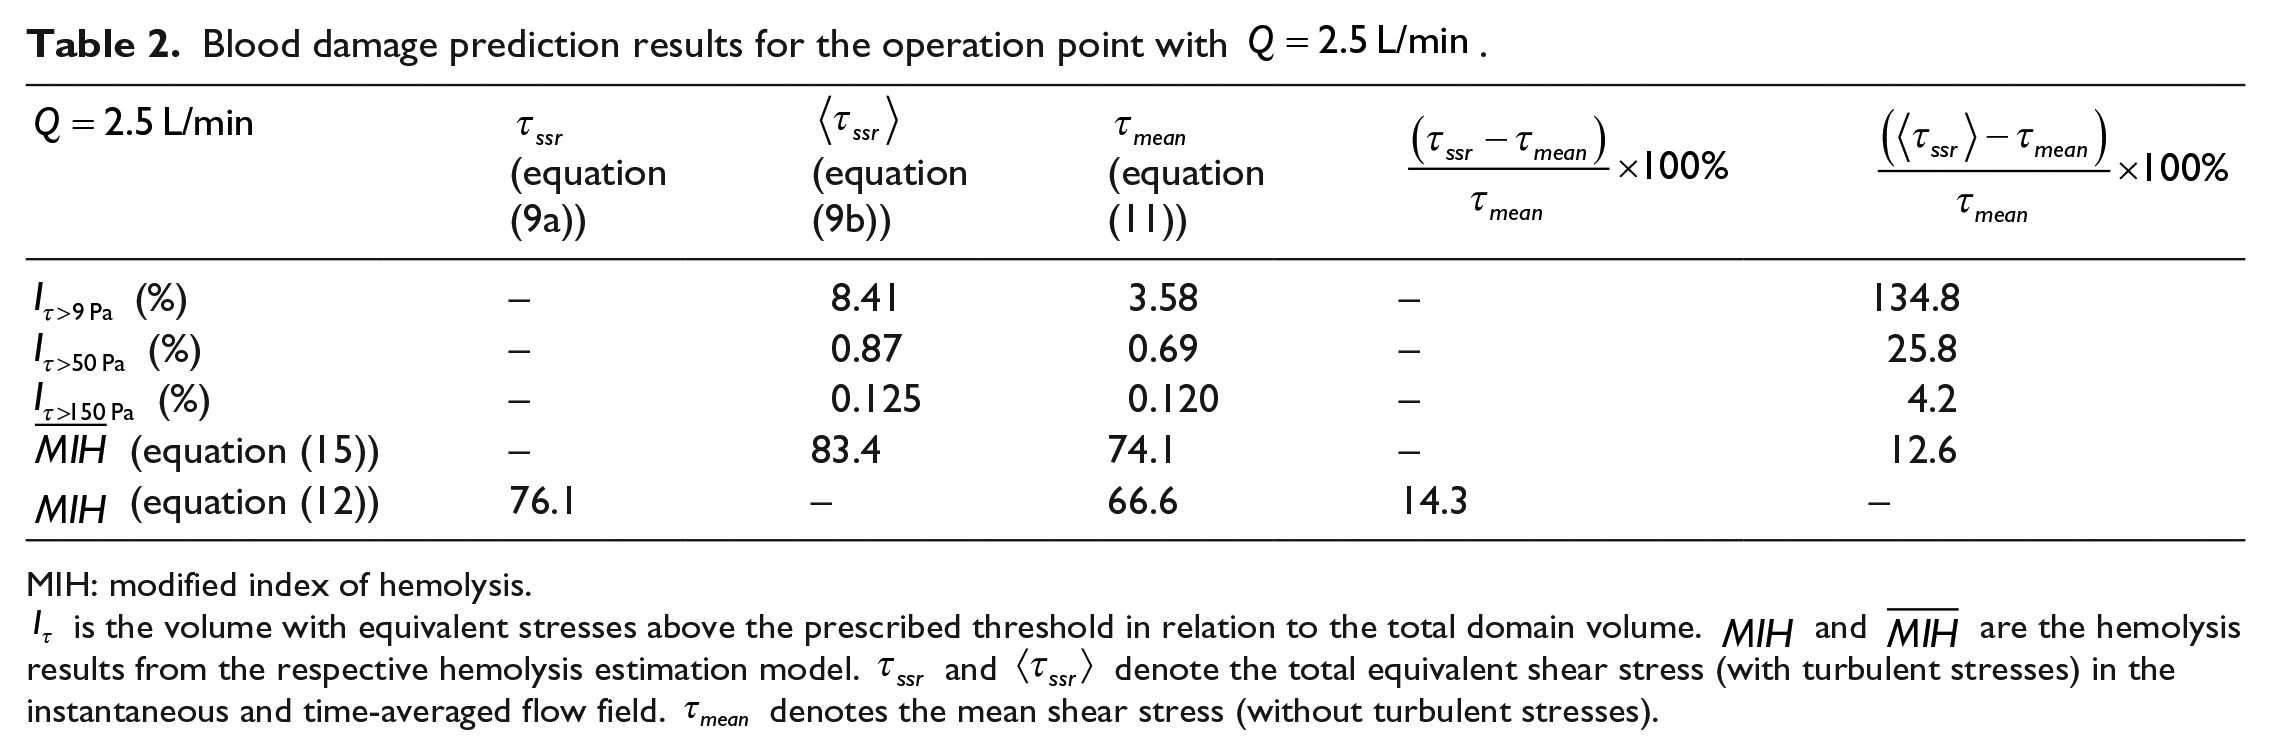
MIH: modified index of hemolysis.
Blood damage prediction results for the operation point with
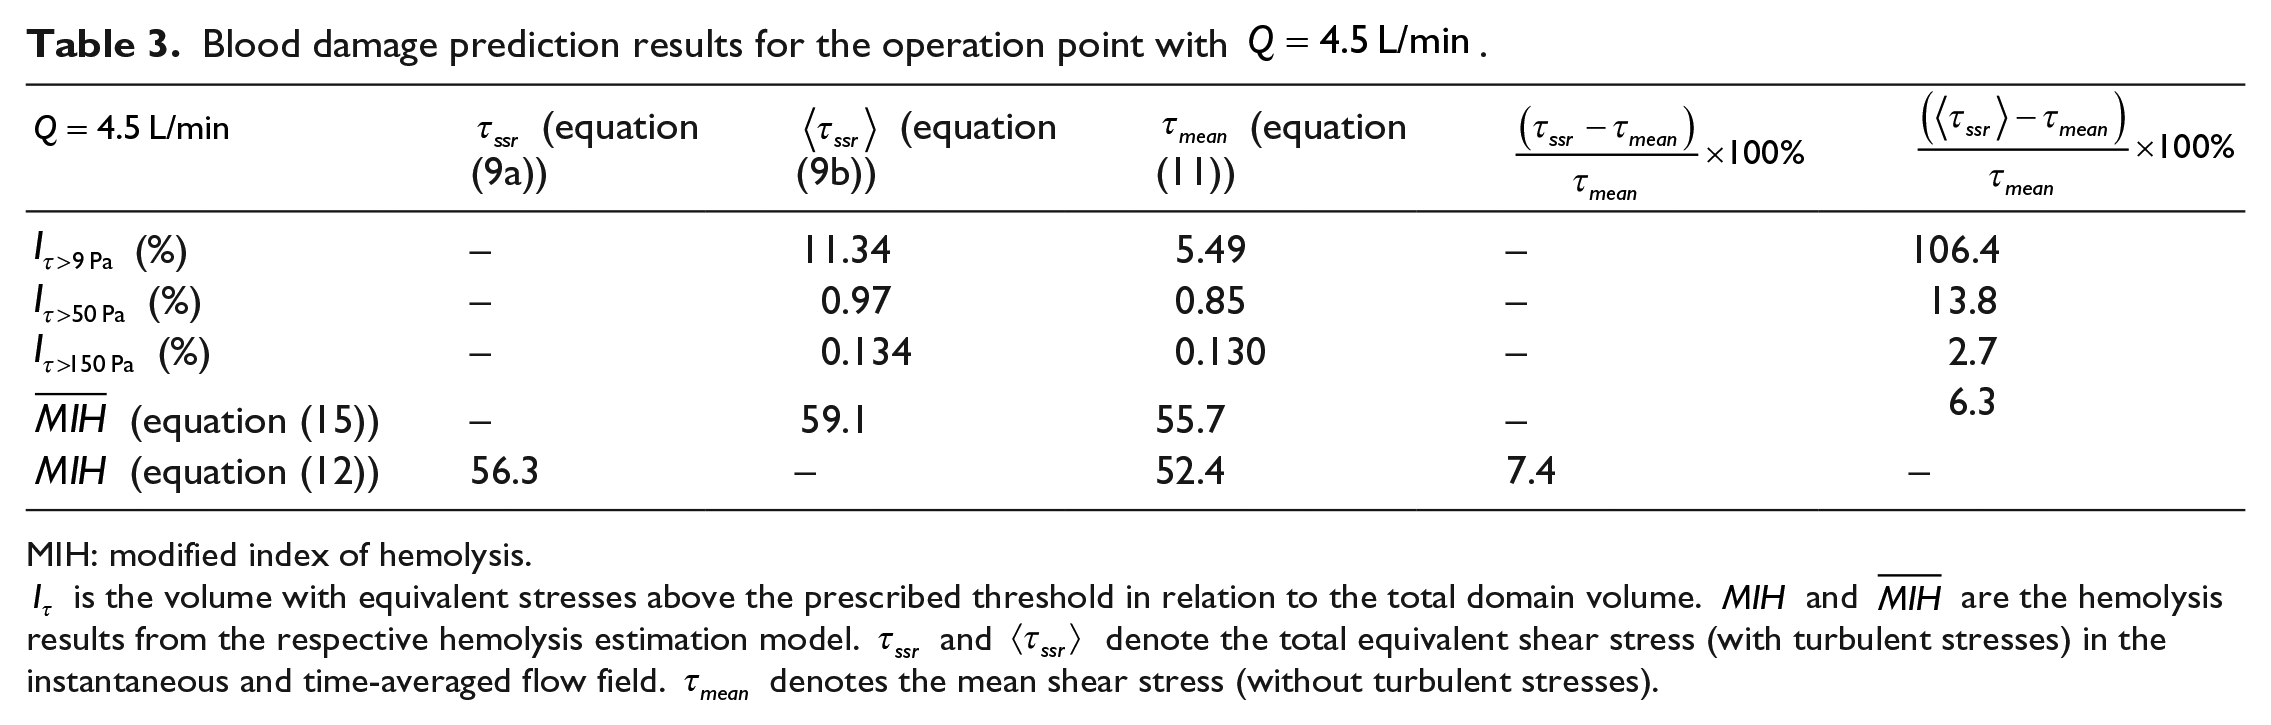
MIH: modified index of hemolysis.
The time-averaged flow was examined in the volumetric analysis
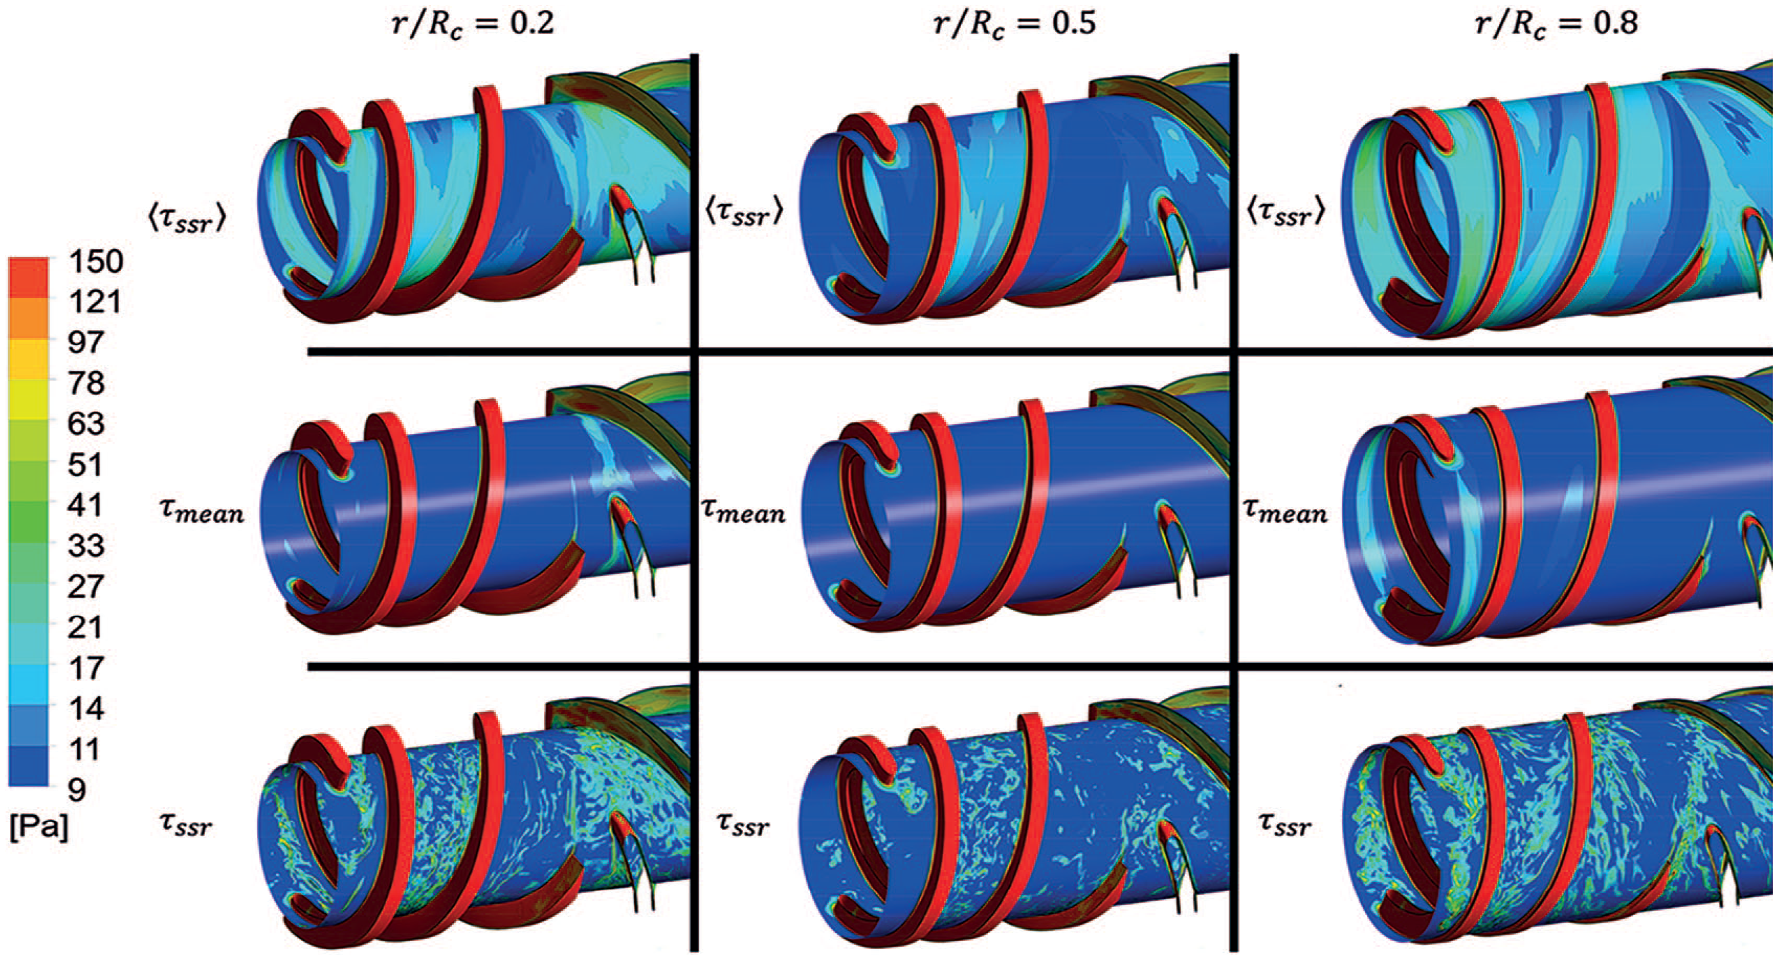
These results suggest that the turbulent stresses are frequently influential between the stress levels of 9 and 150 Pa in the VAD. For a more detailed analysis of the flow field, the equivalent stress fields are shown in Figures 4 and 5. All considered stress definitions (equations (9a) and (b) and (11)) were examined in three different, cylindrical blade-to-blade views through the rotor and outlet guide vane. The blade-to-blade views were located at radius ratios
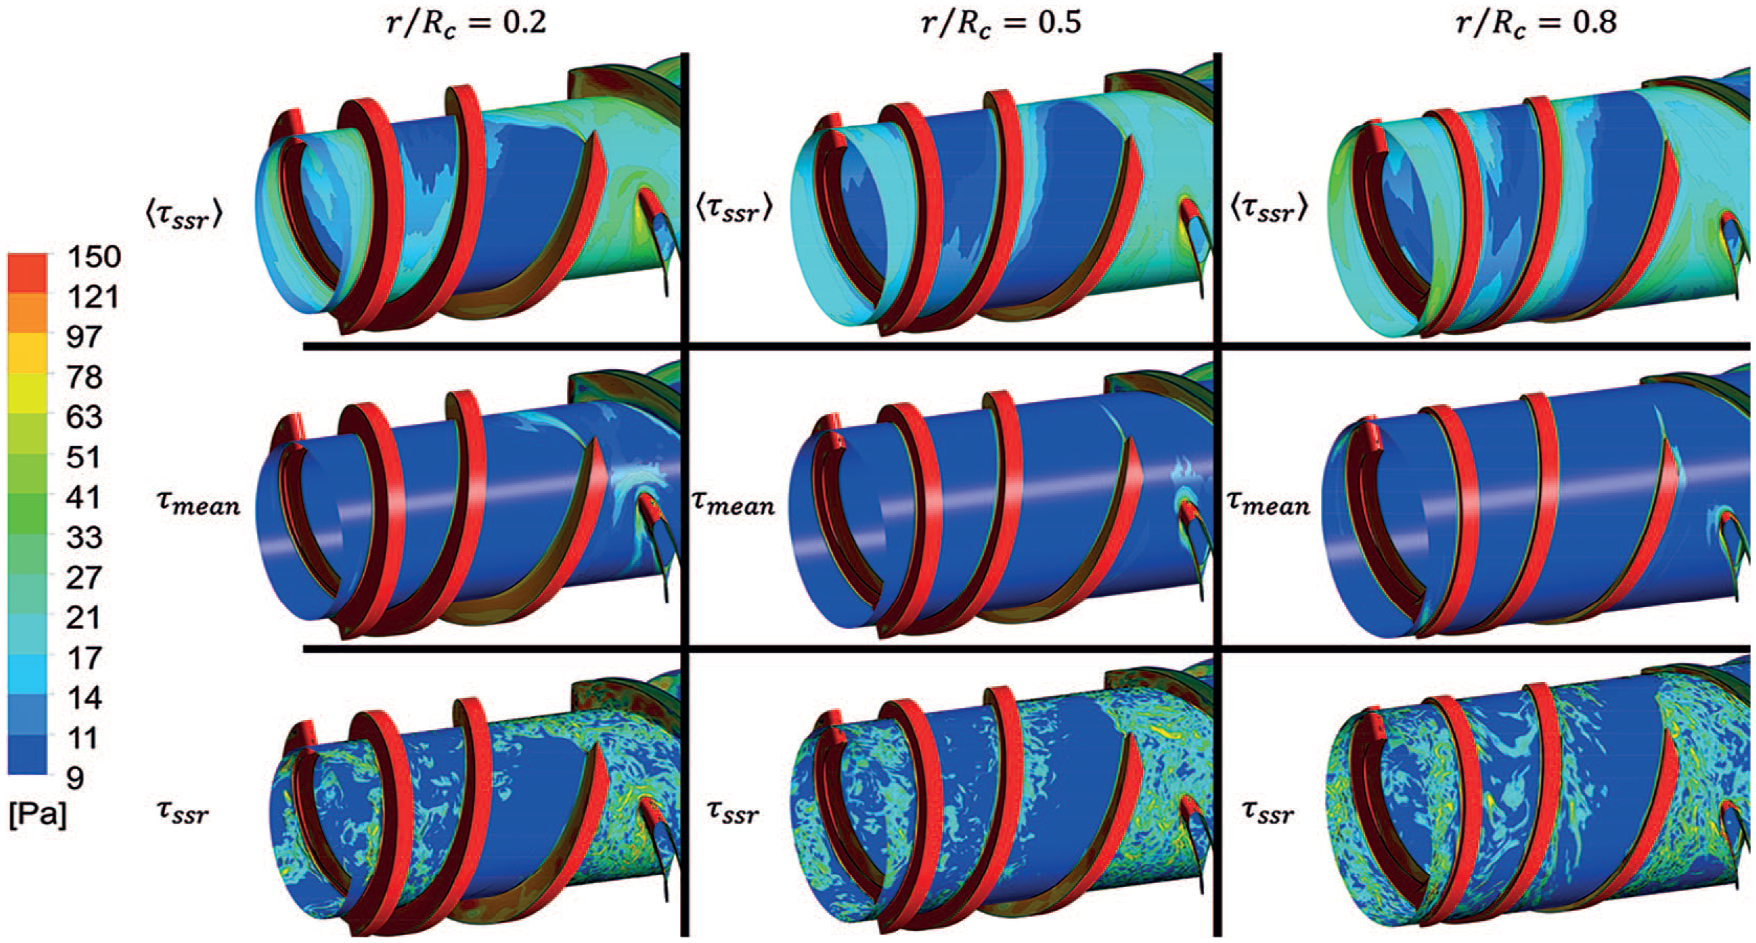
Equivalent shear stress distributions at the walls and in the flow field in a cylindrical cut-plane through the rotor and a part of the outlet guide vane at different radius ratios. Simulation with a flow rate of
Equivalent shear stress distributions at the walls and in the flow field in a cylindrical cut-plane through the rotor and a part of the outlet guide vane at different radius ratios. Simulation with a flow rate of
In all figures, it can be seen that the highest stresses occur in the proximity to the walls within the boundary layer, where
The global contribution of turbulent stresses can be evaluated by analyzing the average hemolysis index
It is noticeable that the
Finally, the influence of turbulent stresses on the blood damage prediction is analyzed by calculating the relative deviation between the instantaneous hemolysis values
This instantaneous hemolysis prediction via transport equation was performed using a “stress-based” damage model, where the instantaneous hemolysis is a direct function of the equivalent stresses, 20 whereas the biophysical aspects of RBCs (shape deformation, relaxation, viscoelastic effects) are not considered. According to Pauli et al., 24 this simplification can lead to a potential risk for overpredicting hemolysis, since the shape of an RBC does not deform immediately and rather takes time to adapt to the turbulent flow field. The instantaneous turbulent stresses in the wall-distant field act only in a relatively small range and only for a short time in our analysis. In this context, the influence of the turbulent stresses on the hemolysis estimation in our VAD could be possibly even lower, when the morphological properties of RBCs are taken into account. But this is just a presumption and has to be proven in further studies.
Limitations
A comparison between experiments and CFD was performed only by analyzing the pressure heads. Although the validation of pressure heads is not as valuable as a full validation of the velocity or turbulent kinetic energy field, it is an appropriate and commonly used validation method 16 , 18 , 23 , 44 to analyze the suitability of a numerical model. The validation of the H–Q curve holds as a first step of flow validation, since an incorrectly computed flow field will also lead to incorrectly computed pressure heads.
In this context, the used acrylic model can theoretically be used for optical flow measurements. Unfortunately, these measurements have not been performed up to now, but are planned for future work.
Just “stress-based” damage prediction models were used to estimate and evaluate the blood trauma. It would be interesting to apply a “strain-based” model and analyze the effect of the turbulent flow also in these models. Unfortunately, it was not possible for the authors to implement a complex, “strain-based” model into the used commercial solver.
Summary and conclusion
This study dealt with the influence of turbulent stresses on the numerical blood damage prediction in two operation points of an axial rotary blood pump.
In a first step, a total equivalent stress definition
In addition, another shear stress definition,
This influence was investigated using a volumetric analysis of different stress thresholds and a simplified, average hemolysis value, wherefore the time-averaged flow fields were examined. It could be shown that large fields of turbulent stresses are present distant from the walls and act in a range between 9 and 50 Pa. According to the study by Fraser et al., 38 this is the potential range, where vWF proteins or platelets could be damaged. Here, a disregard of turbulent stresses would lead to an underprediction in the volumetric analysis and potential sources for blood damage may not be identified in the flow field. Hence, it is recommended to include turbulent stresses in all numerical analyses which use evaluation methods like the volumetric analysis.
Nonetheless, the dominant component in the total equivalent stress formulation is not the turbulent stress, but the mean stress
A transport equation for the hemolysis prediction was also analyzed in the instantaneous flow field. Here, the damage prediction results from the instantaneous total stresses
Nevertheless, turbulent stresses should always be included into the damage model when an equivalent stress definition based on the strain-rate tensor invariant is used, since these stresses belong to the total equivalent stress formulation and could be more significant in other flow cases.
Nonetheless, this research cannot answer the question how and to which extent the turbulent stresses impact true blood trauma. It rather indicates how the contribution from turbulent stresses can be numerically included in an equivalent stress definition (which is based on the invariant of the strain-rate tensor) to account for the total flow field. Due to the correlation between the total equivalent stress and the total dissipation rate, there exists a physical basis to balance the considered turbulent stresses against the mean stresses. Due to this, the turbulent stresses are not overestimated as with the use of Reynolds stresses and seem more appropriate for flow simulations in the author’s opinion.
Turbulence has an effect on blood damage, and therefore, the turbulent stresses must be and are already partly considered in the damage prediction in blood pumps. Turbulent stresses will always be present in axial or radial rotary blood pumps, since secondary flow structures and free shear layers trigger the production of turbulent kinetic energy. Therefore, the authors are of the opinion that turbulent stresses have to be considered, for example, in the pump’s design process, to identify all potential sources of damage, in spite of the fact that the true mechanism of blood trauma in turbulent flow conditions is still unknown.
Footnotes
Acknowledgements
The authors acknowledge the North-German Supercomputing Alliance (HLRN) for providing HPC resources that have contributed to the research results reported in this article. We want to thank Dr Guenther Steffen and Sebastian Hallier, MSc, who have made an immense contribution to the creation of this article.
Declaration of conflicting interests
The author(s) declared no potential conflicts of interest with respect to the research, authorship, and/or publication of this article.
Funding
The author(s) received no financial support for the research, authorship, and/or publication of this article.