
Abstract
Background:
Identifying candidates for left ventricular assist device surgery at risk of right ventricular failure remains difficult. The aim was to identify the most accurate predictors of right ventricular failure among clinical, biological, and imaging markers, assessed by agreement of different supervised machine learning algorithms.
Methods:
Seventy-four patients, referred to HeartWare left ventricular assist device since 2010 in two Italian centers, were recruited. Biomarkers, right ventricular standard, and strain echocardiography, as well as cath-lab measures, were compared among patients who did not develop right ventricular failure (N = 56), those with acute–right ventricular failure (N = 8, 11%) or chronic–right ventricular failure (N = 10, 14%). Logistic regression, penalized logistic regression, linear support vector machines, and naïve Bayes algorithms with leave-one-out validation were used to evaluate the efficiency of any combination of three collected variables in an “all-subsets” approach.
Results:
Michigan risk score combined with central venous pressure assessed invasively and apical longitudinal systolic strain of the right ventricular–free wall were the most significant predictors of acute–right ventricular failure (maximum receiver operating characteristic–area under the curve = 0.95, 95% confidence interval = 0.91–1.00, by the naïve Bayes), while the right ventricular–free wall systolic strain of the middle segment, right atrial strain (QRS-synced), and tricuspid annular plane systolic excursion were the most significant predictors of Chronic-RVF (receiver operating characteristic–area under the curve = 0.97, 95% confidence interval = 0.91–1.00, according to naïve Bayes).
Conclusion:
Apical right ventricular strain as well as right atrial strain provides complementary information, both critical to predict acute–right ventricular failure and chronic–right ventricular failure, respectively.
Introduction
Heart failure with reduced ejection fraction (HFrEF) is an emerging epidemic in adults aged 55 years or older in the European Union. 1 Heart transplantation (HTX), although effective, cannot be a generalizable treatment since there are not enough donors available for patients in need. Continuous-flow left ventricular assist devices (CF-LVADs) could be the alternative, but costs are still very high and this is partially due to related complications, such as right ventricular failure (RVF). 2
In fact, after LVAD implantation, the RV is exposed to the risk of failure: leftward shift of the interventricular septum (favored by the unloaded left ventricle) and the concomitant increase in RV preload, promoted by the device, disrupt the delicate RV geometry of an already impaired chamber, precipitating RVF in many cases. This usually happens within 2 weeks post-LVAD, but can rise even later and portends a worse prognosis also in the long term. Although several score systems have been defined to identify patients at risk,3–7 these are retrospective analyses of single-center experiences and are most often focused on the out-dated pulsatile-flow (PF) LVADs. Finally, such score systems have high internal validity but usually low external validity (i.e. generalizability), since useful predictors have been defined and then validated using the same pool of patients/data.
Focusing on a homogeneous population of HFrEF patients referred specifically to the HeartWare ventricular assist device (HVAD)/CF-LVAD (HeartWare, Oakville, CA, USA) 8 implantation, the aim of this study was twofold: (a) to identify the most accurate predictors of both early- and late-onset RVF among clinical, biological, and imaging markers, including advanced RV as well as right atrial (RA) deformation analysis by echocardiography (ECHO), and (b) to assure generalizability of our conclusions by employing machine learning algorithms applied to training and test (i.e. validation) sub-dataset.
Methods
After Bioethical Committee approval, starting November 2010, all HFrEF patients referred to HVAD implantation at ISMETT and Papa Giovanni XXIII Hospital have been included in a centralized registry, built on clinical, biochemical, imaging, and cath-lab data, and collected as a result of the standard pre-operative workup routinely performed on our study population. Patients with HFrEF judged unsuitable to LVAD (N = 22) by the Heart Team at each center, patients undergoing replacement of an existing LVAD (N = 1), or with a pre-operative plan for biventricular support with a total artificial heart or right ventricular assist device (RVAD; N = 0), or who were supported with extracorporeal membrane oxygenation (ECMO) at the time of their ECHO (N = 0) were excluded.
RVF and primary outcomes definition
Acute-RVF was defined as (a) need of a RVAD or (b) requirement of inhaled nitric oxide or inotropic therapy for >1 week any time after LVAD implantation in the presence of symptoms and signs of persistent RV dysfunction, such as central venous pressure (CVP) of >18 mm Hg with a cardiac index of <2.3 L/min per square meter in the absence of elevated left atrial (LA) or pulmonary capillary wedge pressure (>18 mm Hg), cardiac tamponade, ventricular arrhythmias, or pneumothorax.9,10 Chronic-RVF was defined as RV impairment, occurring after indexed hospital discharge and needing urgent re-admission to start intravenous (IV) diuretics and IV inotropes.
Detection of RVF was based on clinical findings, such as peripheral edema, weight gain, ascites, and jugular venous distention. Heart failure related to device failure or suspected device failure, such as device thrombosis, inflow and outflow obstruction or drive-line fracture, was not considered as Chronic-RVF. Each event was assessed prospectively by at least two reviewers (C.F. and S.S.); divergences were resolved by consensus.
Patients were subsequently divided into three groups based on the occurrence of post-operative RVF, as follows: Group I (“Acute-RVF”), Group II (“Chronic-RVF”), and Group III (“NO-RVF”). Primary end-points considered were as follows: (a) development of Acute-RVF, (b) development of Chronic-RVF, and (c) development of RVF any time during follow-up (ANY-RVF).
Beyond these primary outcomes, other clinical outcomes were collected as well and were considered as possible predictors of RVF, including major ventricular arrhythmias, cardiac tamponade, transitory ischemic attack and stroke (either ischemic or hemorrhagic), LVAD thrombosis, and major infective episodes. Finally, all-causes mortality was also collected (median follow-up: 14 months; range: 1–76 months).
Collected variables
Demographic, clinical, biochemical, and echocardiographic data were collected within 72 h preceding the LVAD implant, while invasive hemodynamic measurements by right heart catheterization (RHC) were obtained 5–7 days ahead of surgery. Available risk scores for RVF were computed as well. In particular, the following scores were collected: HeartMate II Risk Score (HMRS), Kormos Score, Michigan Score, model of end-stage liver disease excluding INR (MELD), MELD-NA, MELD-XI.6,7,11–14
Standard ECHO
Pre-operative transthoracic echocardiograms were analyzed by a reader blinded to clinical outcomes (D.B.). All echocardiographic examinations were performed with a commercially available instrument (Vivid E90 System; Vingmed, General Electric, Milwaukee, WI, USA). Standard LV systolic and diastolic parameters from two-dimensional (2D) and Doppler ECHO, as well as pulsed-wave tissue Doppler imaging of the mitral medial annulus, were acquired and measured as previously described. 15 RV wall thickness and RV end-diastolic diameters at basal and midventricular levels were measured. RV end-diastolic and end-systolic four-chamber areas were derived by manually tracing the endocardial. RV fractional area change (FAC) was calculated. To obtain tricuspid annulus plane systolic excursion (TAPSE), the apical four-chamber view was used, and an M-mode cursor was placed through the lateral tricuspid annulus in real time. Pulsed wave tissue Doppler imaging was performed, placing the sample volume on the lateral tricuspid annulus in the apical four-chamber view, and S′ velocity was collected. Right ventricular systolic pressure (RVSP) was calculated by inserting the tricuspid regurgitation velocity, obtained with continuous-wave (CW) Doppler, into the simplified Bernoulli equation. Diastolic pulmonary artery pressure (PAP) was computed from the pulmonary valve regurgitation (PR) flow according to the following equation: 4(PR-end velocity)2 + RA pressure. 15
2D speckle tracking analysis
Both RV and RA Strain measurements were performed using standard commercial software (EchoPAC version BT13; GE Healthcare, Fairfield, CT, USA). A narrow-sector view of the RV–free wall was acquired using an RV–optimized apical four-chamber view, in order to maintain frame rate of >80 frames per second.
Longitudinal systolic strain (sS) and systolic strain rate (sSR), as well as early diastolic strain rate (dSR-E) of the RV–free wall, were collected. The endocardial border of the RV was traced, and strain curves were generated automatically for each of the three segments (Figure 1(a)). The peak strain for the three segments corresponding to the RV–free wall was averaged to produce a global longitudinal strain measurement.
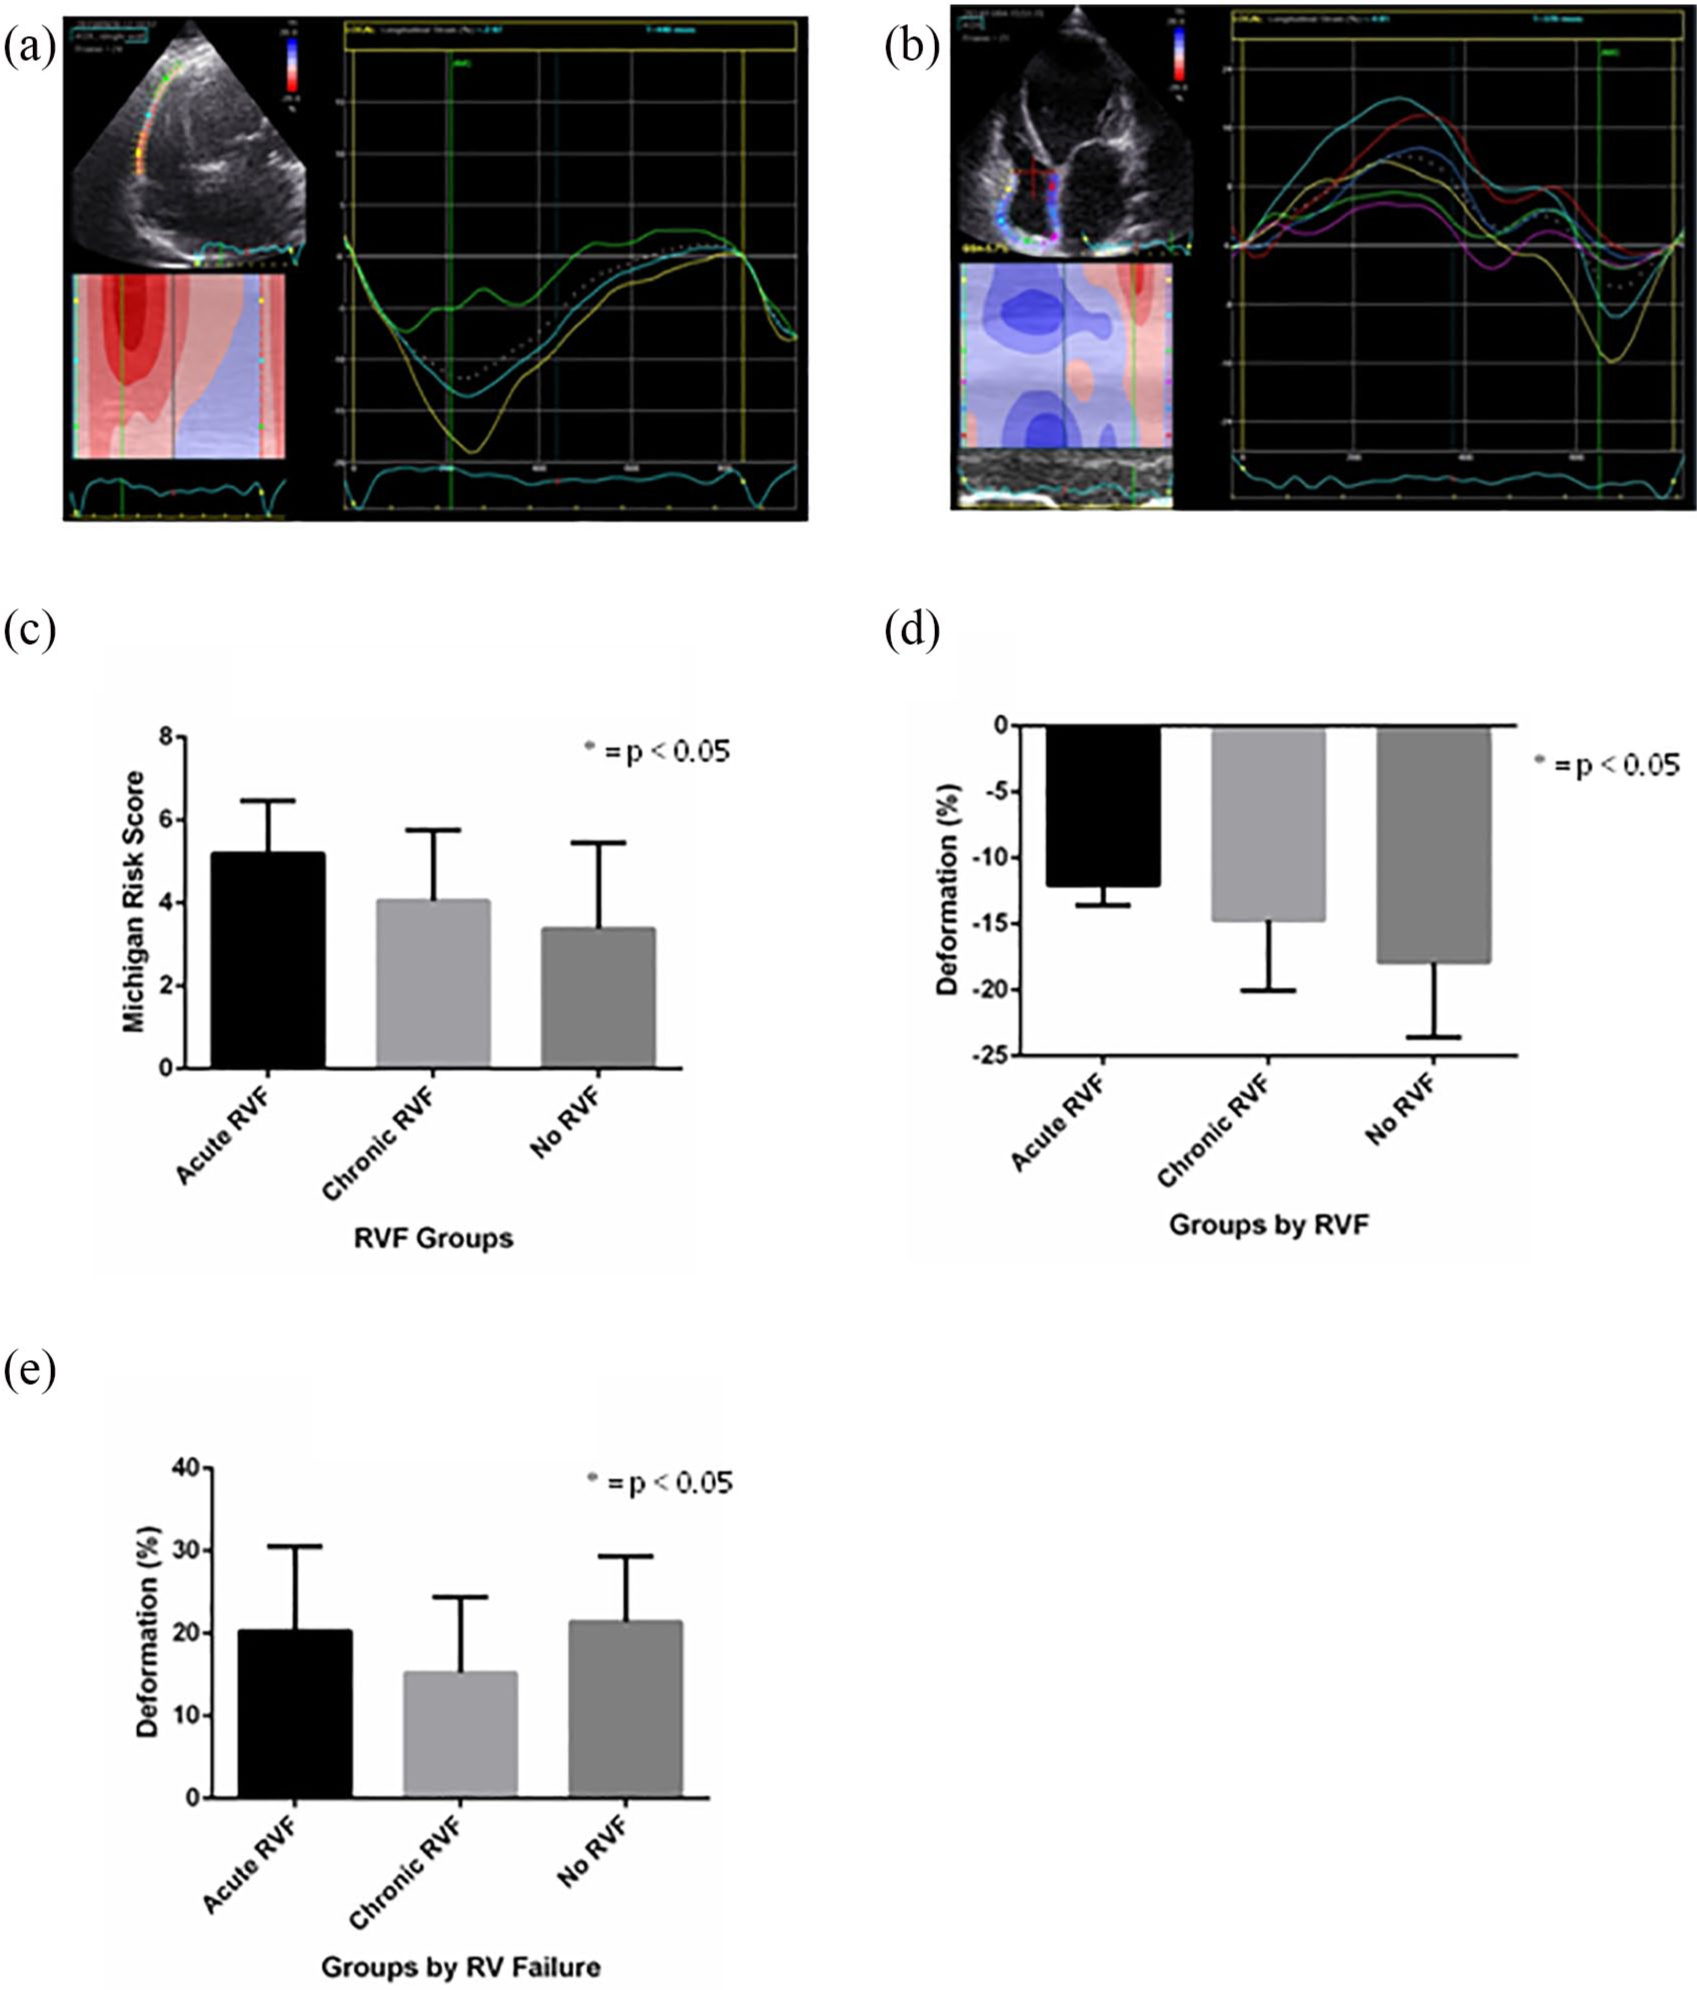
(a, b) Strain curves for the three segments: longitudinal systolic strain (sS) and systolic strain rate (sSR), as well as early diastolic strain rate (dSR-E) of the RV–free wall; (c) Michigan score by RVF; (d) longitudinal sS of the apical RV–free wall; and (e) RA total strain.
To obtain RA strain, a narrow-sector and zoomed view of the RA was obtained from an apical four-chamber view. QRS complex served as the first reference frame. In this study, the right peak atrial longitudinal strain (R-PALS) was measured as εS + εA and expressed as absolute number 16 (Figure 1(b)).
Data analysis
Comparisons between groups and univariate as well as multivariable logistic regression were performed using STATA version 14.1 (Stata-Corp LP, College Station, TX, USA). Continuous variables were compared using the unpaired t-test for normally distributed variables or the Wilcoxon rank-sum test according to normal/non-normal distribution. The chi-square or Fisher’s exact test was used for categorical variables. Serum levels of N-terminal pro-B-type natriuretic peptide (NT-proBNP), blood urea nitrogen (BUN), creatinine, alanine transaminase (ALT) were log-transformed to meet the distributional assumptions.
Univariate logistic regression analysis was performed to calculate an odds ratio (OR) for different forms of RVF and for each baseline variable, using binary outcomes as follows: RVF (acute or chronic)/NO-RVF, Acute-RVF/NO-Acute-RVF, and Chronic-RVF/NO-Chronic-RVF.
Receiver operating characteristic (ROC) curves were generated and compared. 17 A series of exploratory models were created by multivariable logistic regression, using a mixed (i.e. backward and then forward) stepwise approach for model building, forcing the algorithm to identify the three most accurate predictors of the following three primary outcomes: Acute-RVF only, Chronic-RVF only, or any event of RVF, respectively. “Best” models were selected according to the Bayesian information criterion (BIC). Candidate variables were selected on clinical grounds, including most used risk score systems (see above) within the categories of clinical features, standard biochemical markers, hemodynamics, echocardiographic assessment of LV, RV, or RA function, and therapy. Data are presented as mean value ± standard deviation (SD), median value ± inter-quartile range, or count (%), as appropriate. A difference was considered statistically significant when the p-value was less than 0.05. In the multivariable models, a variable was considered as a significant predictor of primary end-points when the p-value was less than 0.1.
Machine learning algorithms
Machine learning algorithms were applied using R Software, version 3.3.3 (R Foundation for Statistical Computing, Vienna, Austria; https://www.R-project.org/) and specifically, the following packages were implemented: CARET, GLMNET, and E1071.18–20
As a preliminary step, in order to identify most performing machine learning algorithms for our dataset, we have tested several algorithms, both linear and nonlinear (including classification and regression trees) as well as ensemble methods. The three algorithms with the highest discrimination accuracy and kappa statistics were selected and fine-tuned to perform ultimate analysis.
Penalized logistic regression
In brief, the elastic-net penalty is controlled by α and bridges the gap between lasso (α = 1, the default) and ridge (α = 0). The tuning parameter λ controls the overall strength of the penalty. In order to identify “best” values of α and λ for our data, an α/λ grid was created and the best values were identified using the repeated k-fold cross-validation method. Penalized logistic regression was therefore implemented to train linear classifiers using any three predictors available in our dataset. For each of the three considered outcomes (Acute-RVF, Chronic-RVF, and ANY-RVF) compared with the NO-RVF outcome, we selected the most accurate GLMNET model. To test the predictive accuracy of the classifiers, we calculated the area under the ROC curve (area under the curve (AUC)) after performing repeated k-fold cross-validation. We also computed the performance of the classifier trained with the entire dataset (SELF). K-fold cross-validated AUC and SELF-AUC values were used to select the best classifier.
Support vector machines
Briefly, in the three-dimensional space of predictors, where each point is characterized by the patient’s values of three selected predictors, the support vector machine (SVM) computes the best surface able to separate two classes of patients’ outcome. The cost parameter defines the amount of penalty assigned to each misclassification. Three values of cost were considered (0, 0.5, 1) and the classifier with the best performance was selected and associated with the used triplet of predictors.
For each of the three considered outcomes (RVF-All, Acute-RVF, and Chronic-RVF) compared with the NO-RVF outcome, we selected the most accurate SVM model. To test the predictive accuracy of the classifiers, we calculated the AUC after performing a leave-one-out validation (LOOV). We also computed the performance of the classifier trained with the entire dataset (SELF). LOOV-AUC and SELF-AUC values were used to select the best classifier.
Naïve Bayes
The naïve Bayes classifier computes the conditional a-posterior probabilities of a categorical class variable, that is, RVF/NO-RVF, given independent predictor variables, that is, the clinical features. It uses the naïve Bayes rule to compute the probabilities and it assumes that each feature is conditionally independent of every other feature. We used the R function Naïve Bayes 21 implemented in the klaR package.
Results
Demographic, clinical characteristics and biochemical markers
Between January 2010 and 31 March 2017, the HeartWare HVAD device was implanted in 74 patients at ISMETT center (N = 45) and Papa Giovanni XXIII Hospital (N = 29), who met the clinical criteria for study inclusion. Bridge-to-transplant was the primary strategy in 43 patients (58%), while 16 patients (22%) were referred to LVAD as destination therapy, and the remaining 15 patients (20%) were implanted in a bridge-to-candidacy perspective.
Out of 74 patients, N = 8 (11%) developed Acute-RVF and N = 10 (14%) developed Chronic-RVF. A comparison of the clinical characteristics of the three groups included in the study is shown in Table 1: there were no differences among the Acute-RVF, Chronic-RVF, and NO-RVF groups according to demographic, biometric, and vital signs at baseline as well as INTERMACS and NYHA class pre-implant. Optimal medical treatment, including furosemide dosage and way of administration, was similar among RVF and NO-RVF groups as well. Considering computed risk scores for RVF, only the Michigan score (Figure 1(c)) and MELD-XI were higher in patients who developed Acute-RVF as well as Chronic-RVF, as compared to NO-RVF group.
Demographics and clinical characteristics pre-implant.
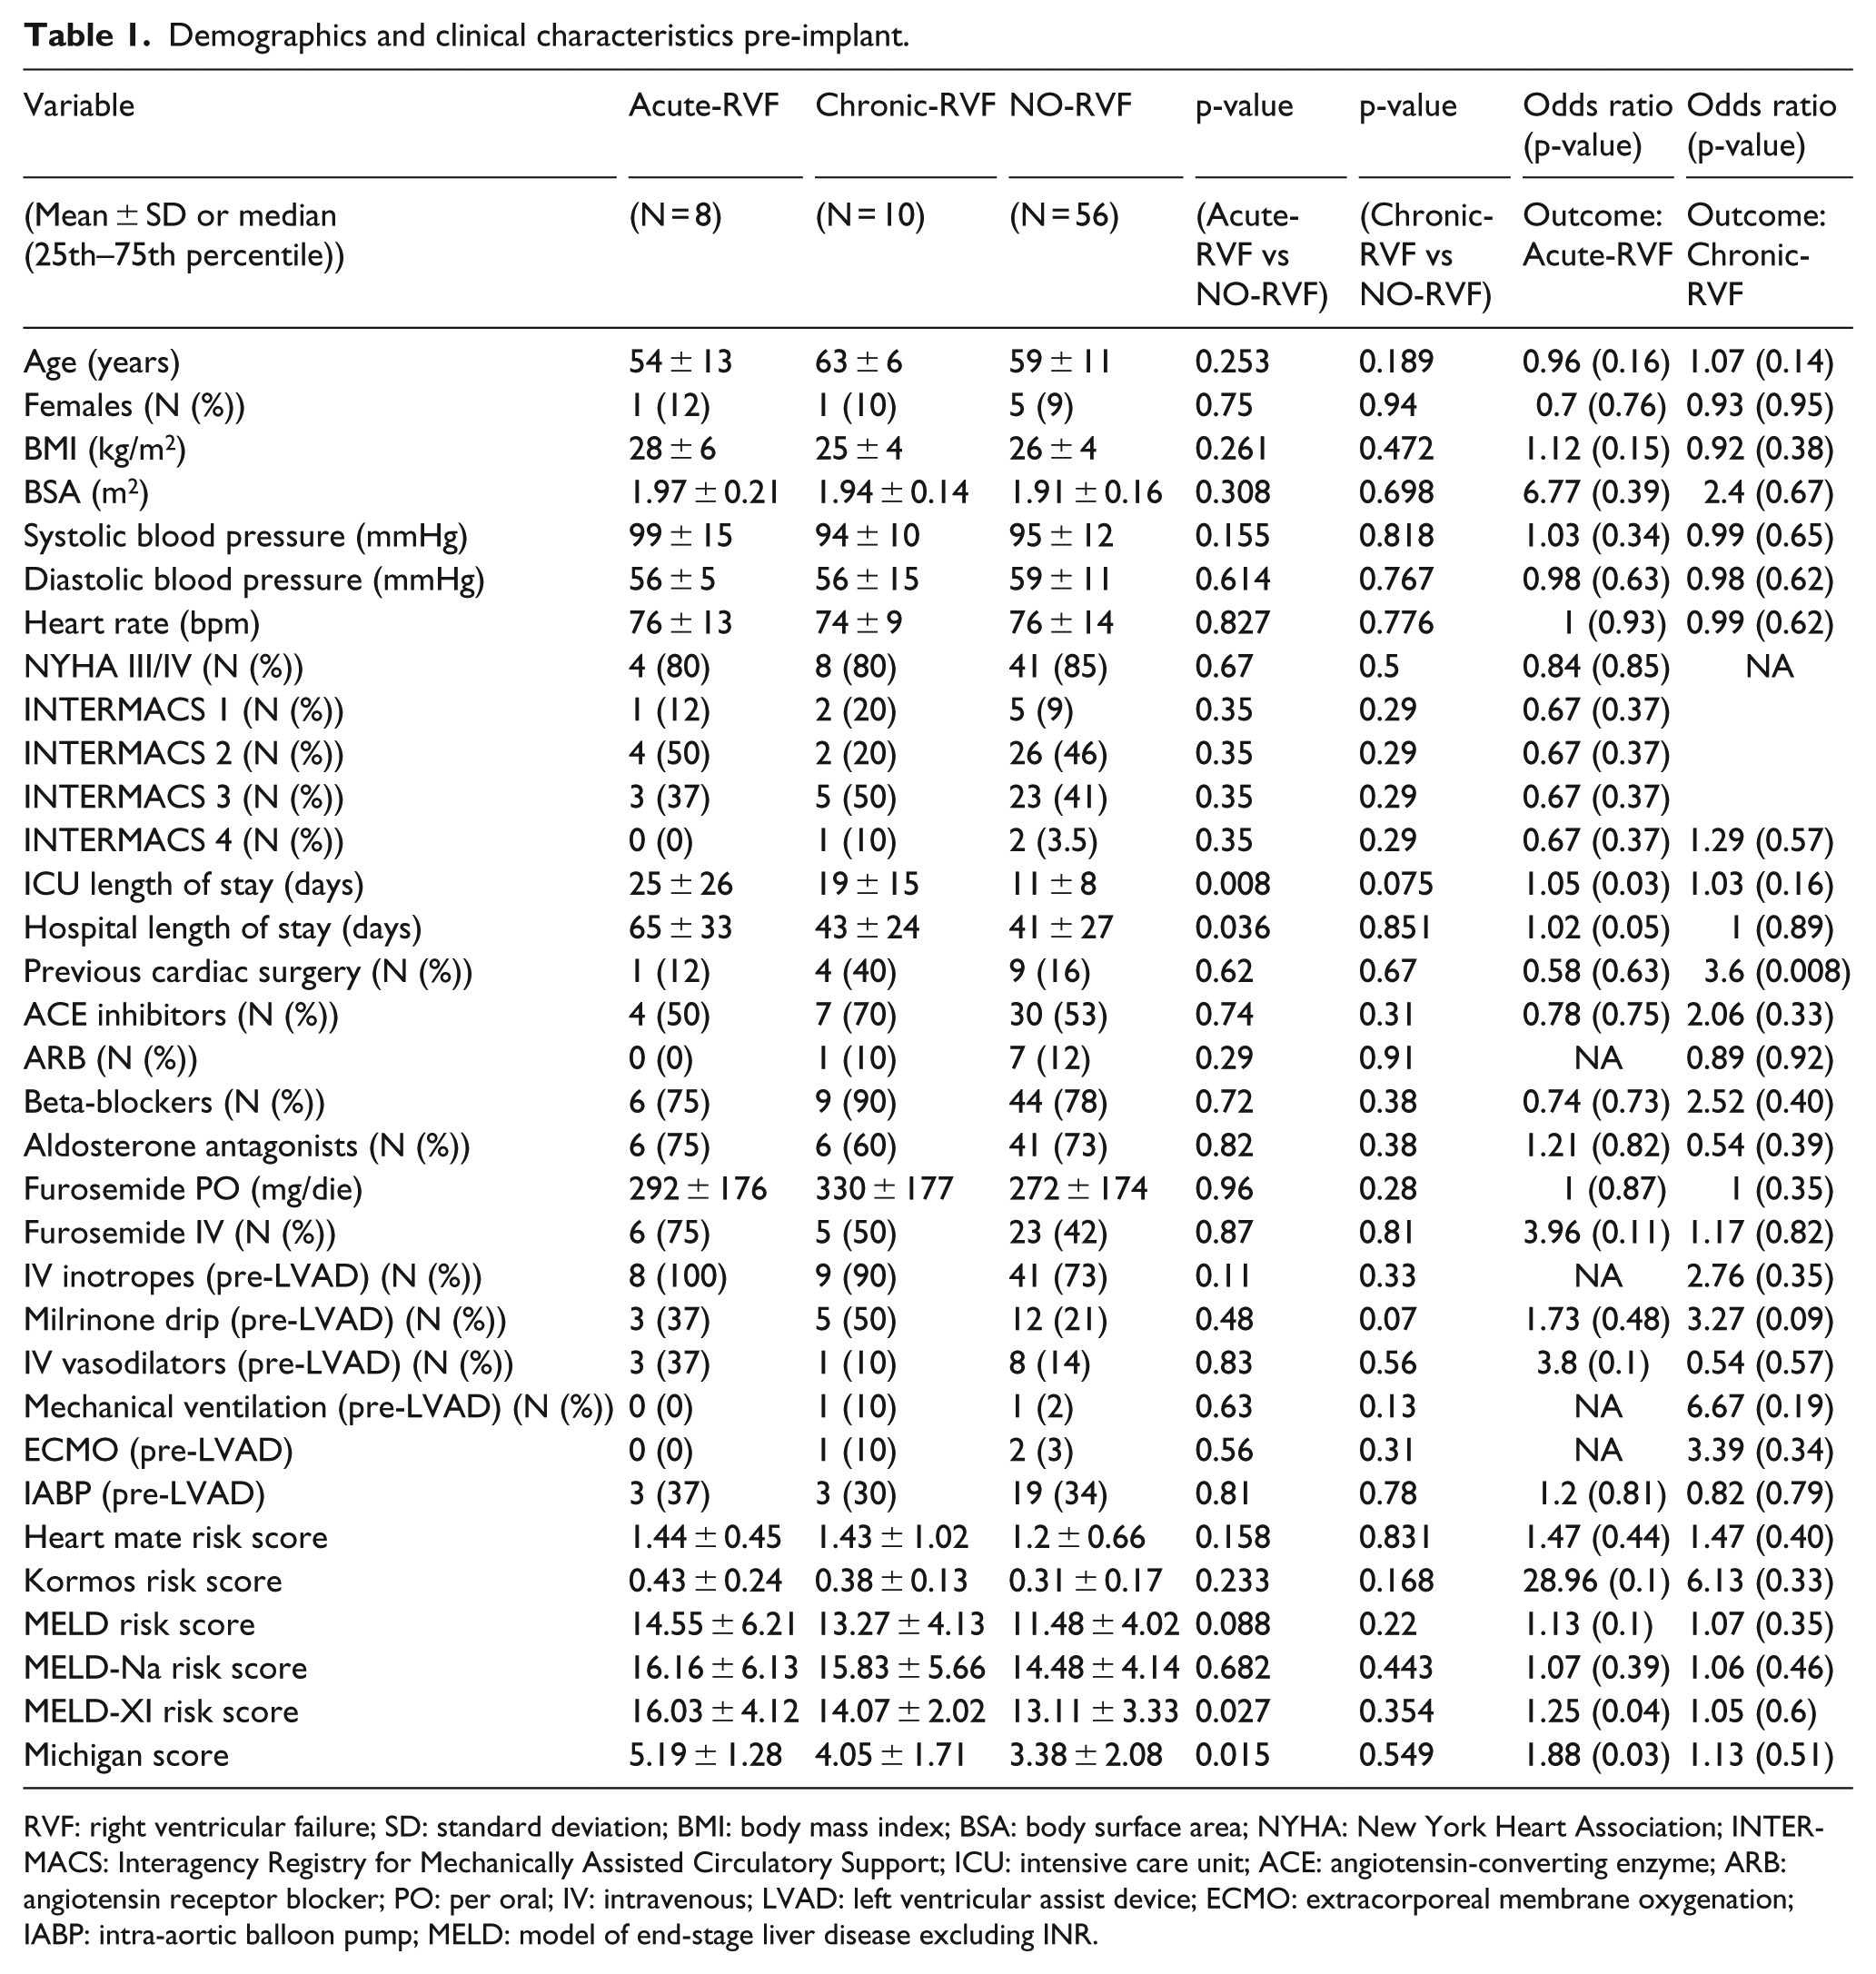
RVF: right ventricular failure; SD: standard deviation; BMI: body mass index; BSA: body surface area; NYHA: New York Heart Association; INTERMACS: Interagency Registry for Mechanically Assisted Circulatory Support; ICU: intensive care unit; ACE: angiotensin-converting enzyme; ARB: angiotensin receptor blocker; PO: per oral; IV: intravenous; LVAD: left ventricular assist device; ECMO: extracorporeal membrane oxygenation; IABP: intra-aortic balloon pump; MELD: model of end-stage liver disease excluding INR.
Finally, a number of patients needing mechanical ventilation, intra-aortic balloon pump (IABP), or ECMO were minimal and comparable among the three groups. Total bilirubin pre-implant was elevated in Acute-RVF patients as compared to Chronic-RVF or NO-RVF groups (Table 2). BUN was higher and platelets were lower in patients who developed Chronic-RVF as compared to NO-RVF group.
Biochemical markers pre-implant.
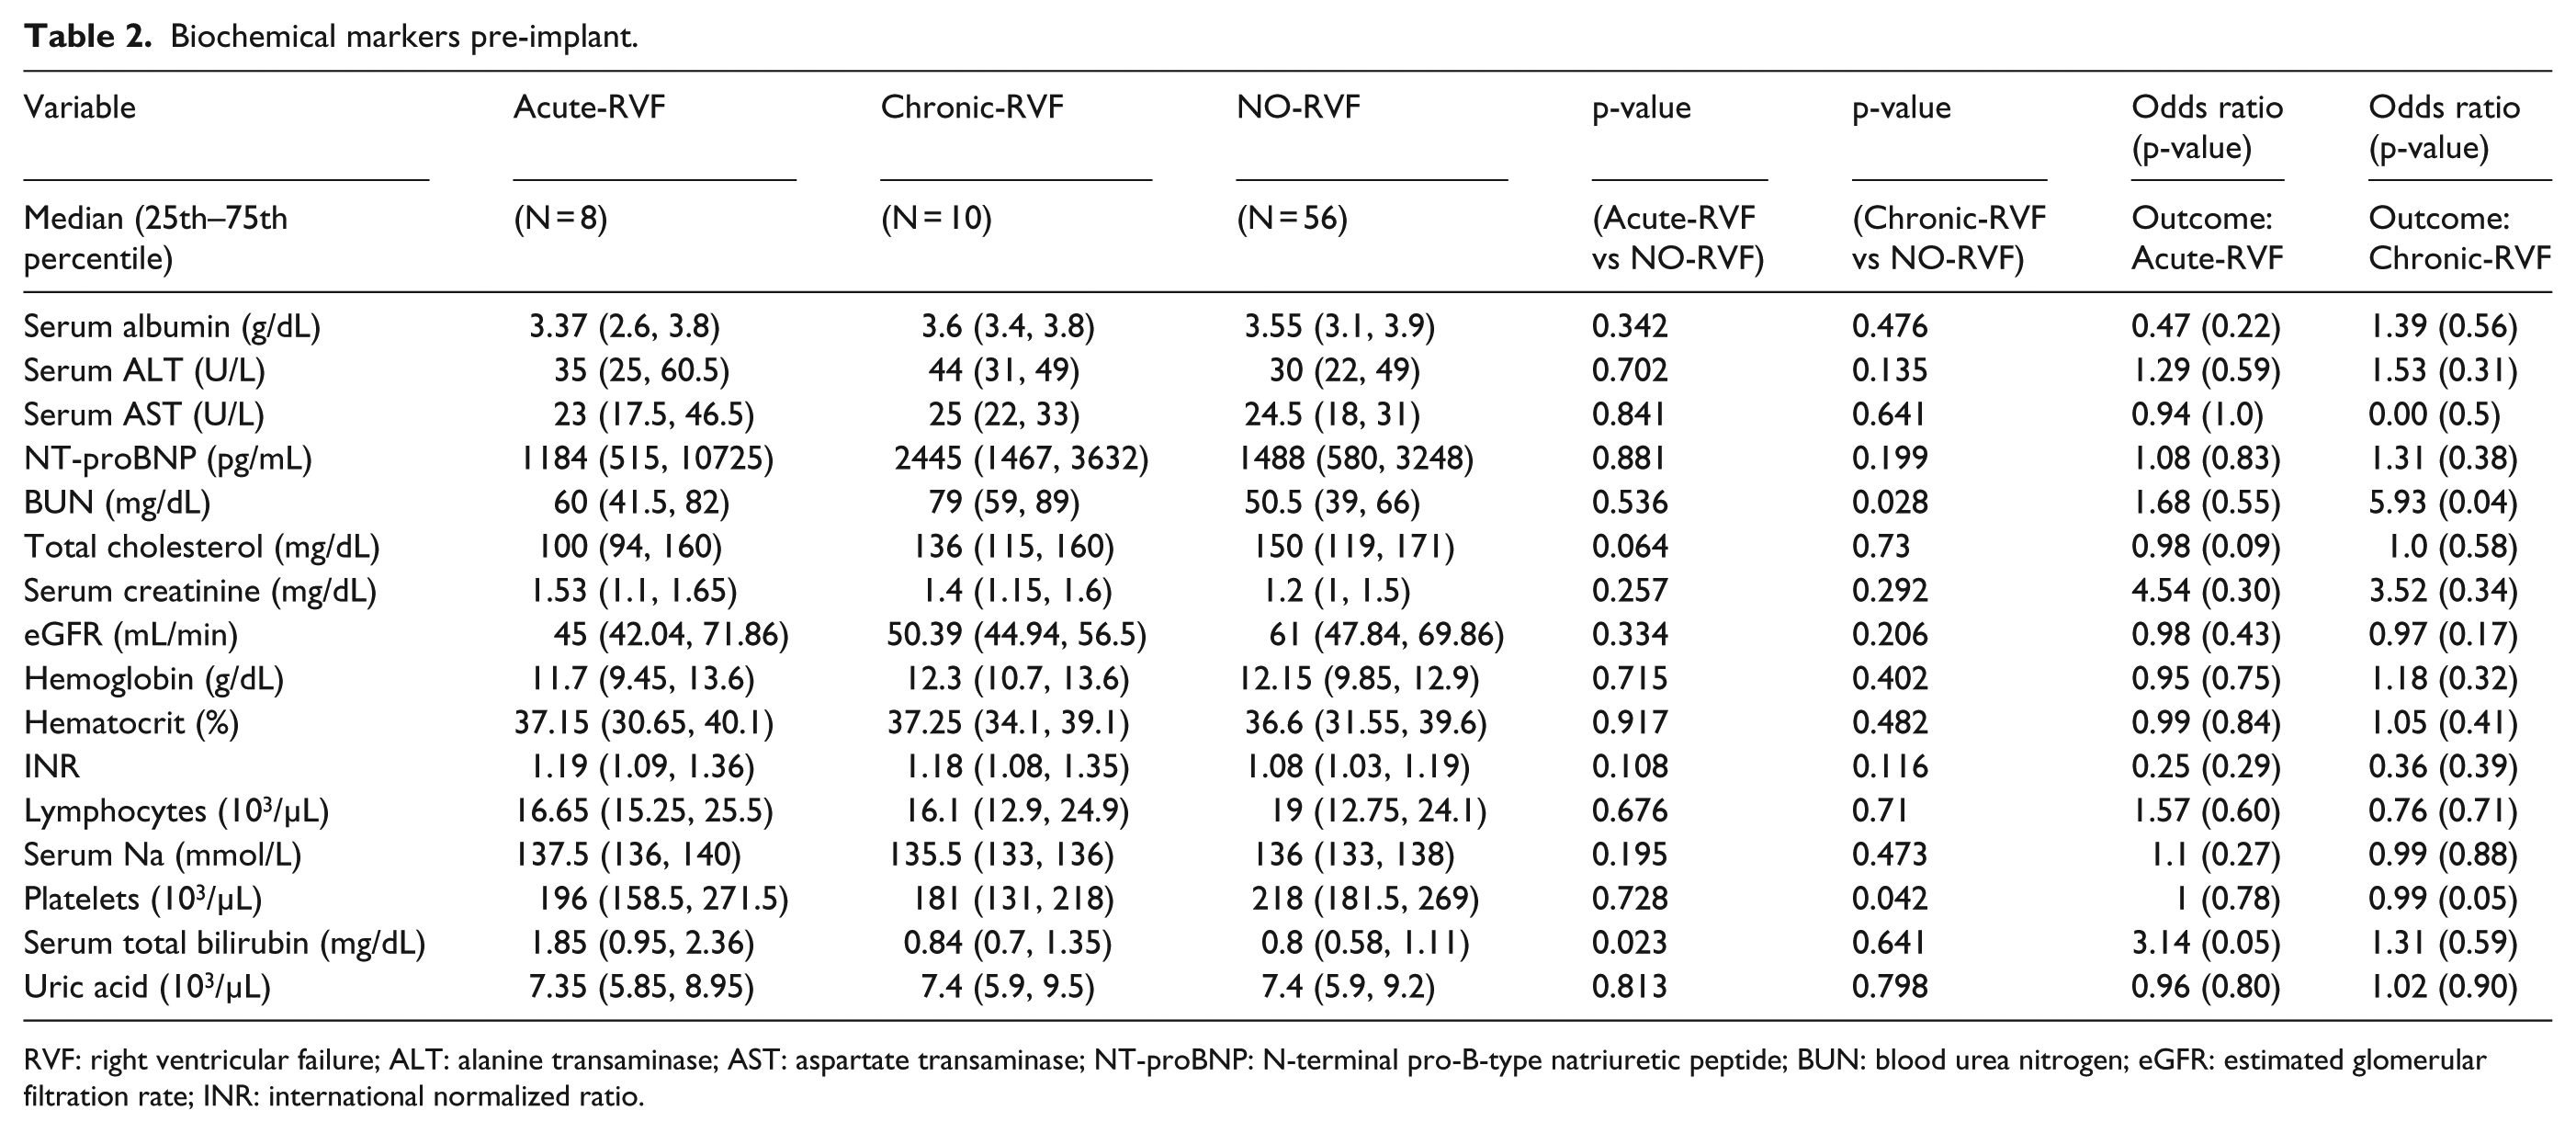
RVF: right ventricular failure; ALT: alanine transaminase; AST: aspartate transaminase; NT-proBNP: N-terminal pro-B-type natriuretic peptide; BUN: blood urea nitrogen; eGFR: estimated glomerular filtration rate; INR: international normalized ratio.
Standard and strain ECHO
LV-EF was marginally lower in Acute-RVF group as compared to NO-RVF, while LA volume as well as LV dimensions (either systolic or diastolic) was comparable among the groups (Table 3).
Standard echocardiography.
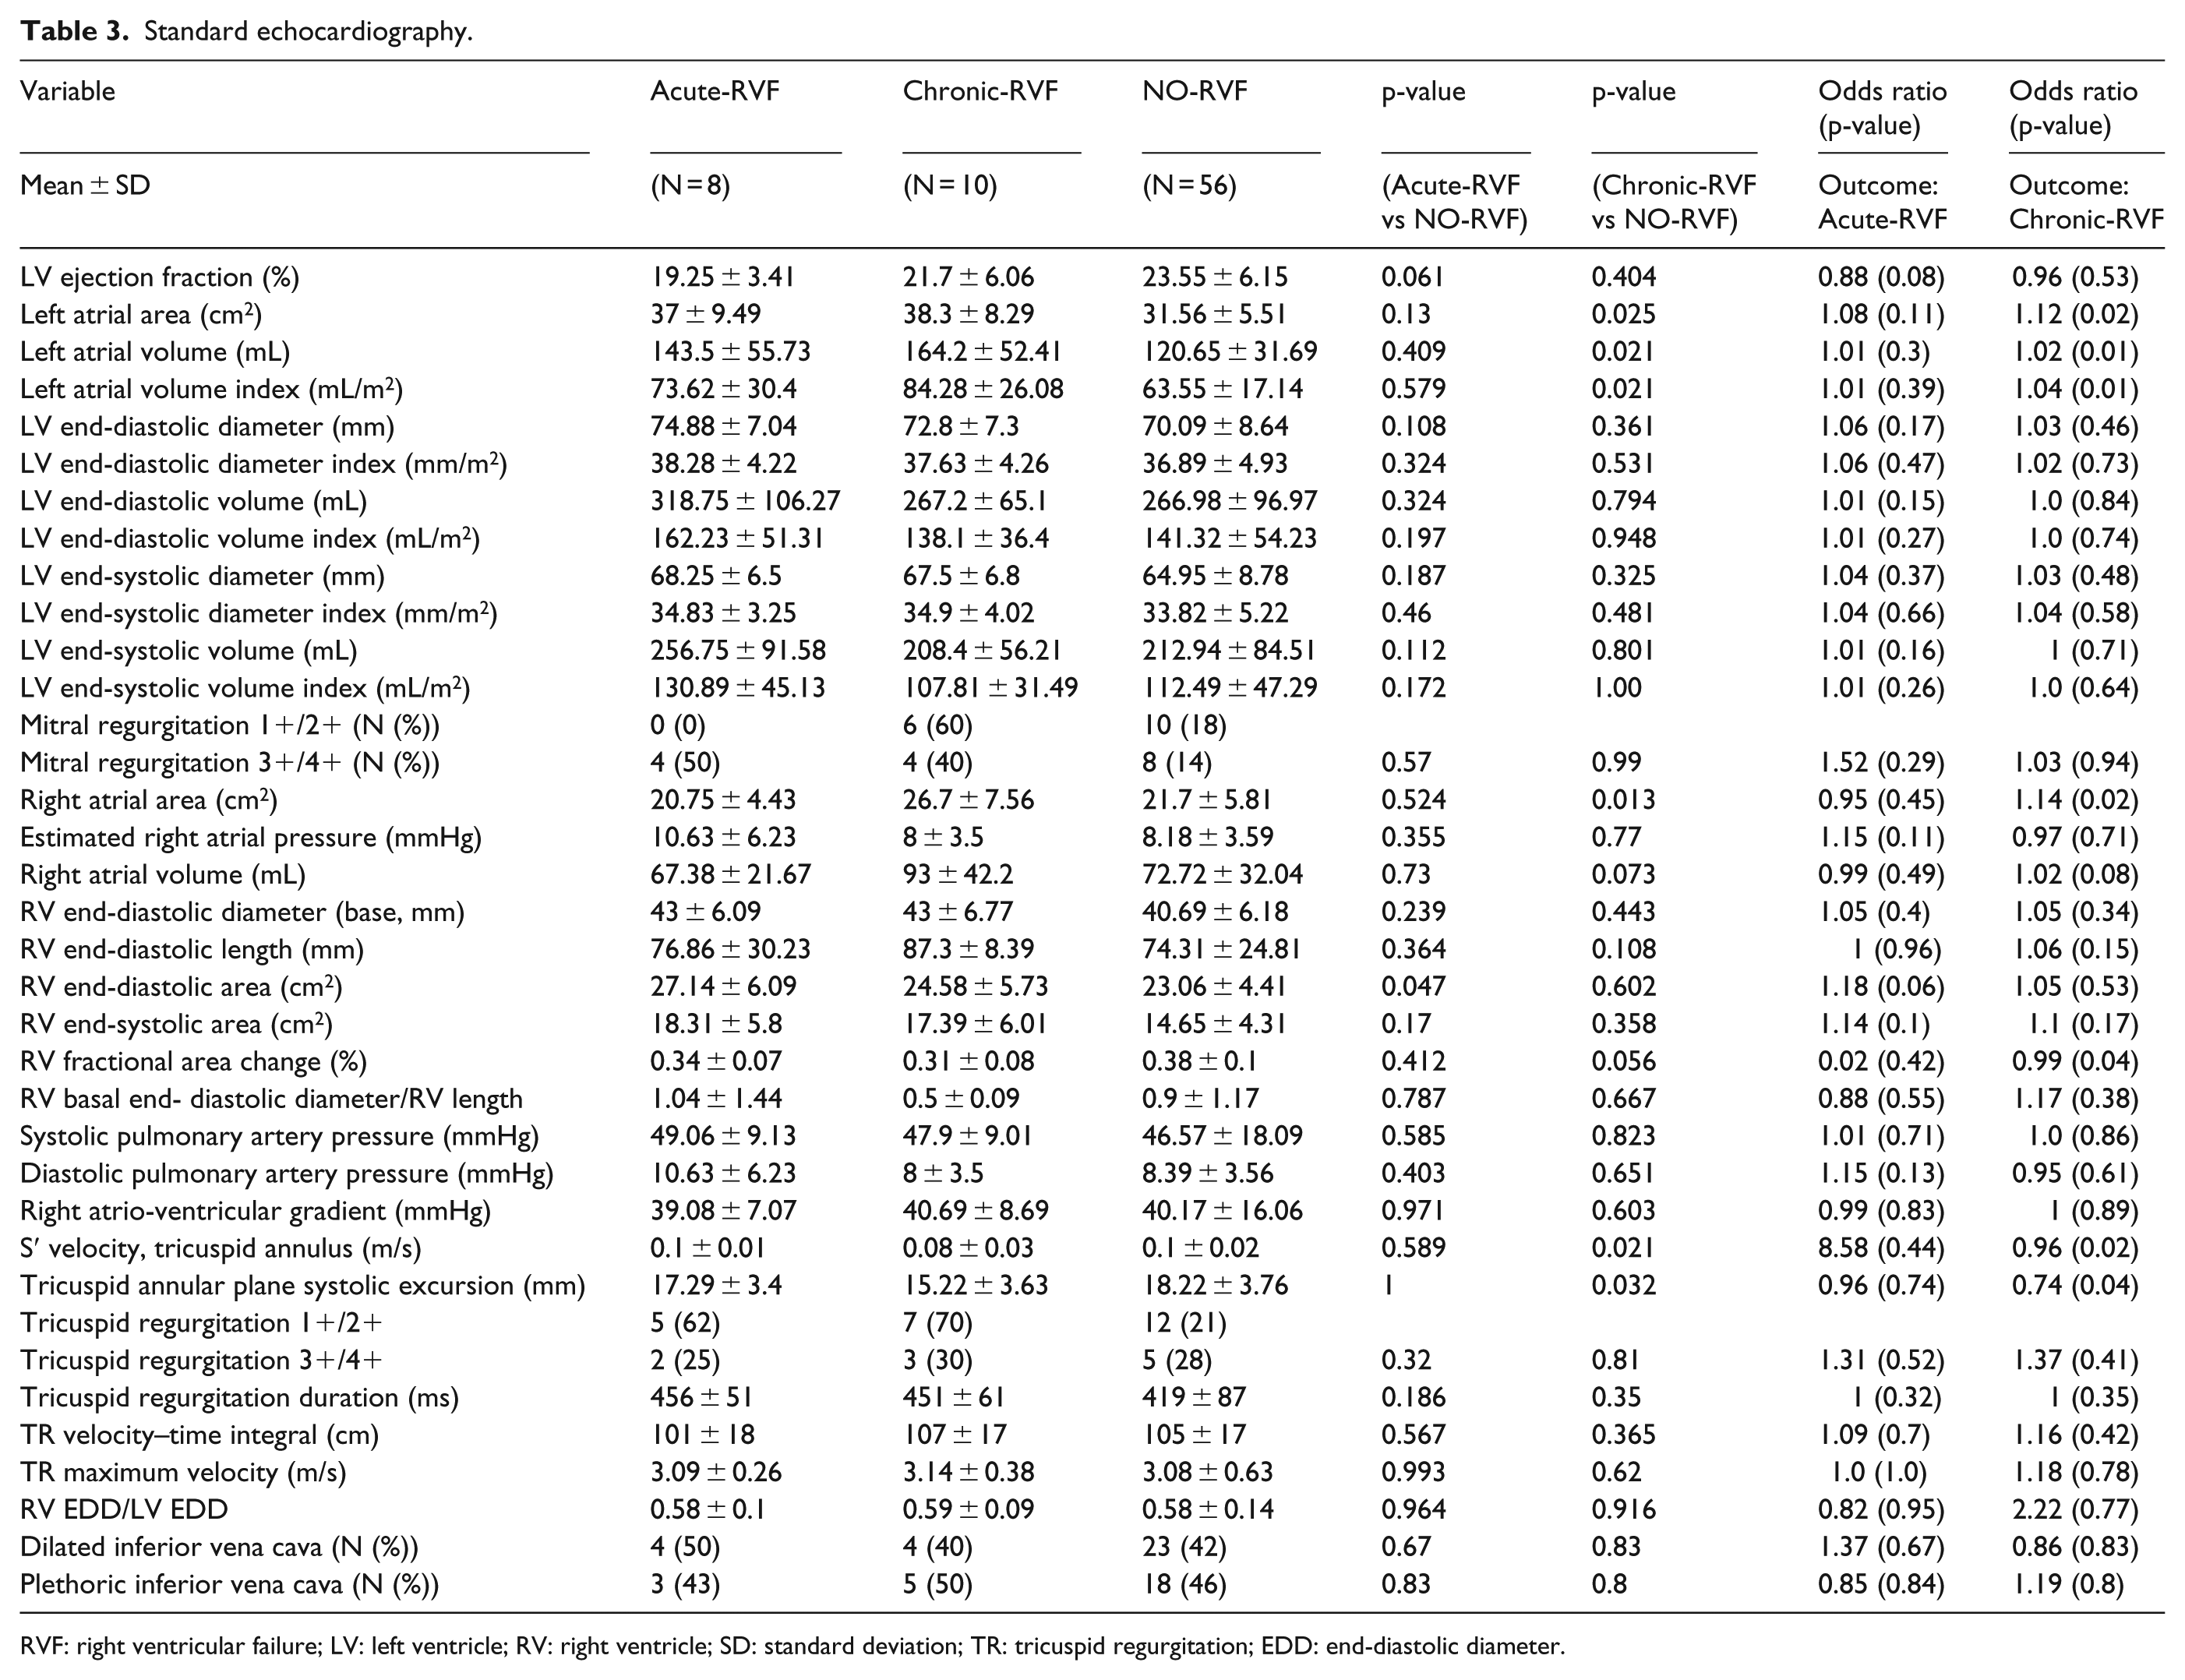
RVF: right ventricular failure; LV: left ventricle; RV: right ventricle; SD: standard deviation; TR: tricuspid regurgitation; EDD: end-diastolic diameter.
Regarding the RA or the RV, geometry was similar among groups: RA volume, RV end-diastolic dimensions as well as RV end-diastolic or end-systolic area were all comparable among patients with RVF and those with NO-RVF. ECHO parameters of RV performance, including TAPSE, tricuspid annular S′ velocity, and RV FAC, were similar as well. Finally, also the prevalence of moderate-to-severe tricuspid regurgitation, estimated systolic or diastolic PAP, as well as estimated RA pressure by inferior vena cava dimensions and collapsibility, were comparable among RVF and NO-RVF patients.
Right ventricular free wall deformation analysis
Although RV sS was <–20%, and therefore impaired, in all recruited patients, RV dysfunction as assessed by either longitudinal sS or sSR was greater in patients who developed Acute-RVF or Chronic-RVF as compared to NO-RVF (Table 4). However, dSR-E was comparable among RVF and NO-RVF groups. According to segmental analysis, the RV longitudinal sS of the apex was significantly lower in either Acute-RVF or Chronic-RVF groups as compared to NO-RVF patients (Figure 1(d)). RV Longitudinal sSR of the basal and middle segment was lower in Acute-RVF as compared to NO-RVF but was similar at all segments between patients with Chronic-RVF and NO-RVF.
Strain echocardiography.
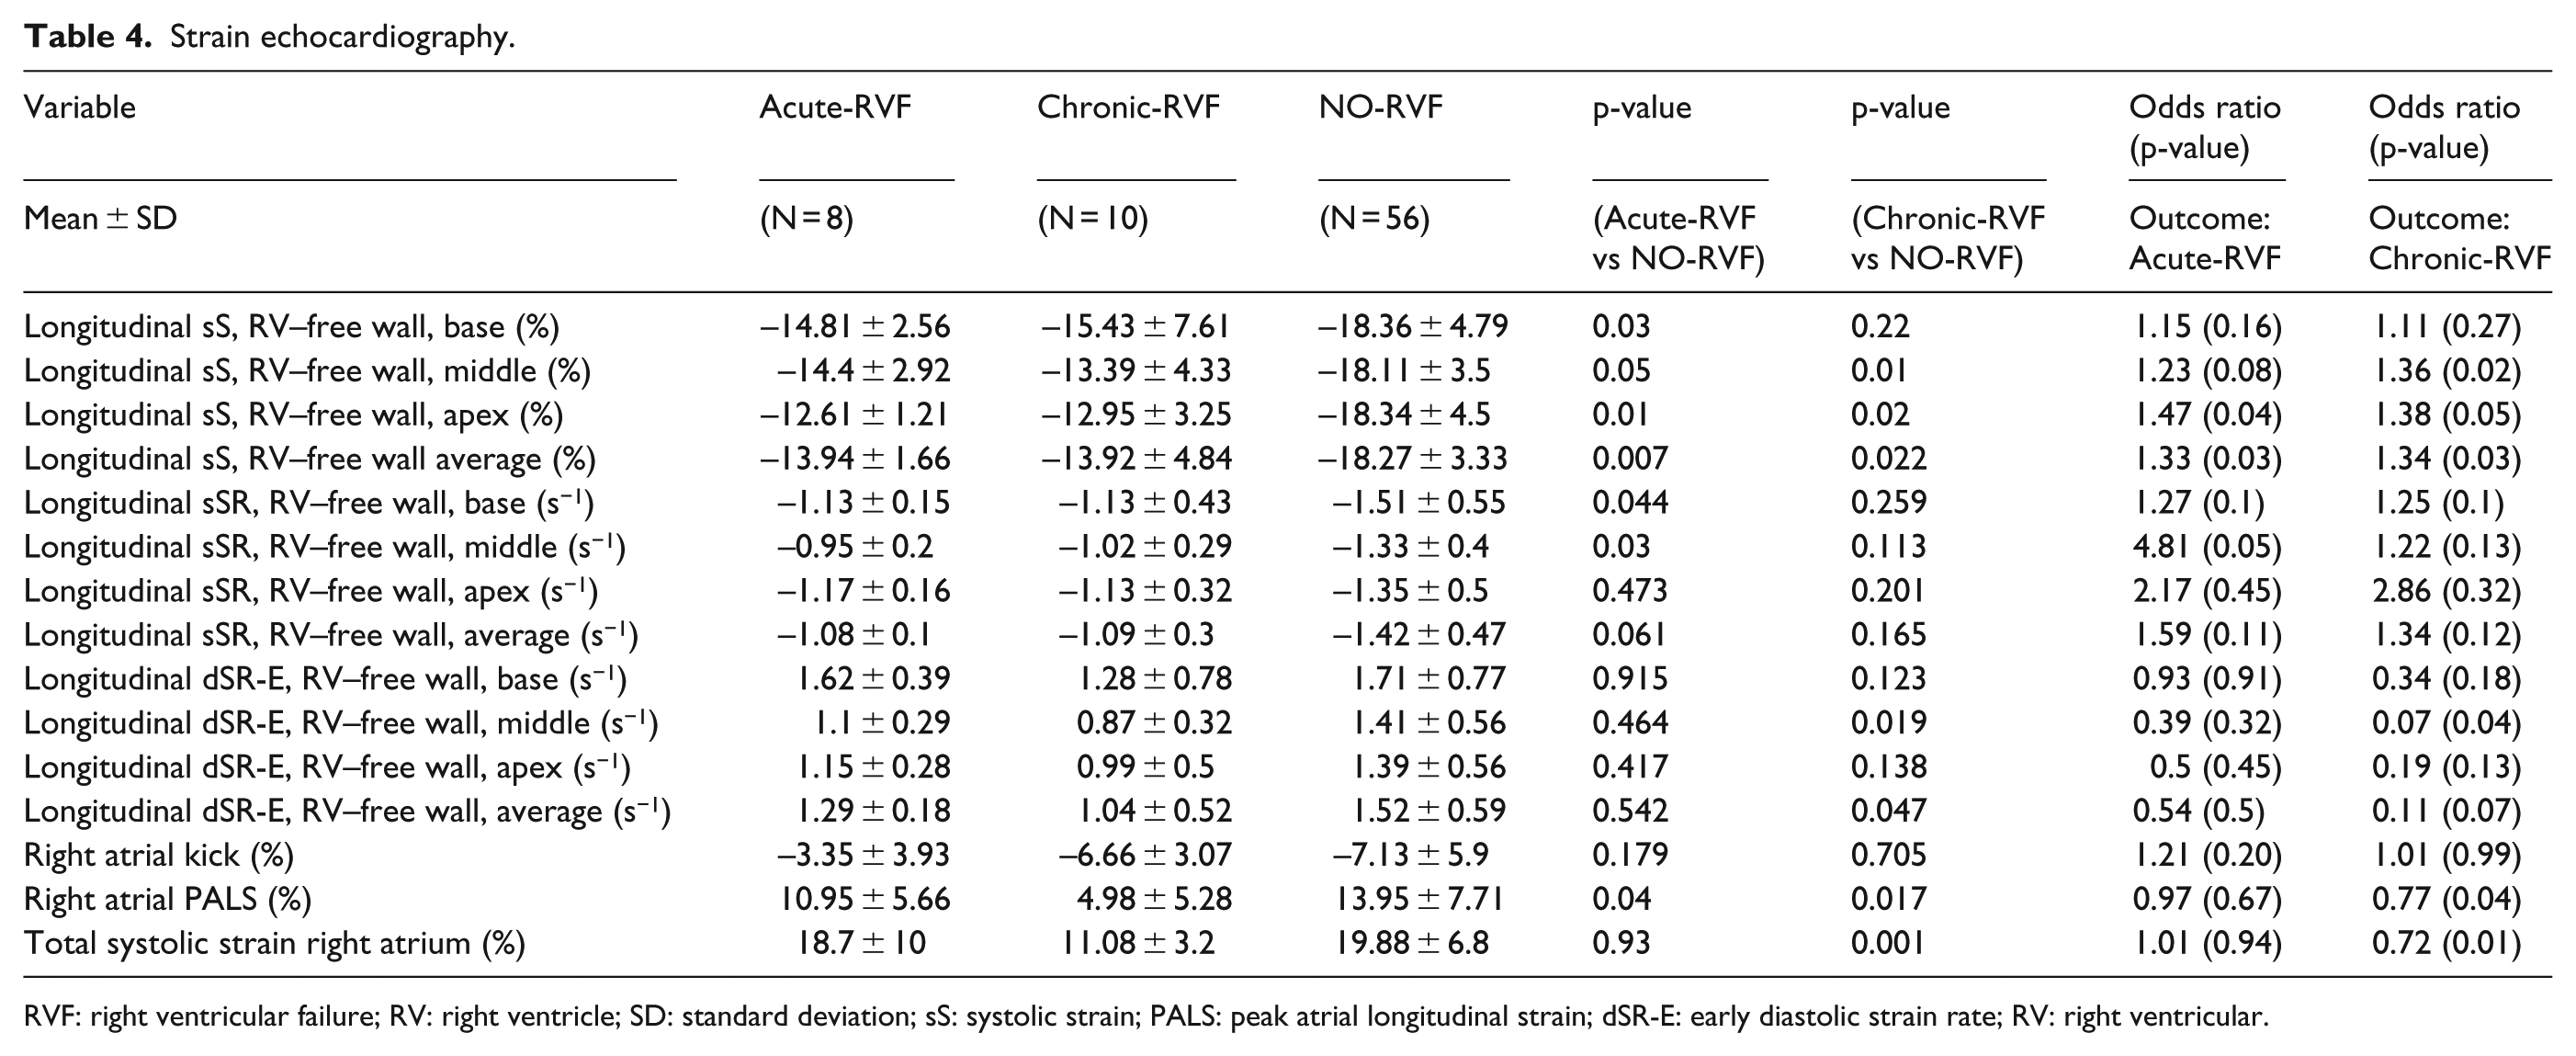
RVF: right ventricular failure; RV: right ventricle; SD: standard deviation; sS: systolic strain; PALS: peak atrial longitudinal strain; dSR-E: early diastolic strain rate; RV: right ventricular.
RA total strain was comparable between patients in the Acute-RVF and NO-RVF, while it was significantly reduced in the Chronic-RVF as compared to NO-RVF group (Figure 1(e)).
RHC
Patients with either Acute-RVF or Chronic-RVF had higher CVP (i.e. RA pressure) as compared to NO-RVF (Table 5). The difference between diastolic PAP and pulmonary capillary wedge pressure was higher in Chronic-RVF group as compared to NO-RVF. No other hemodynamic measurements collected invasively were different between RVF and NO-RVF groups.
Invasive hemodynamics.
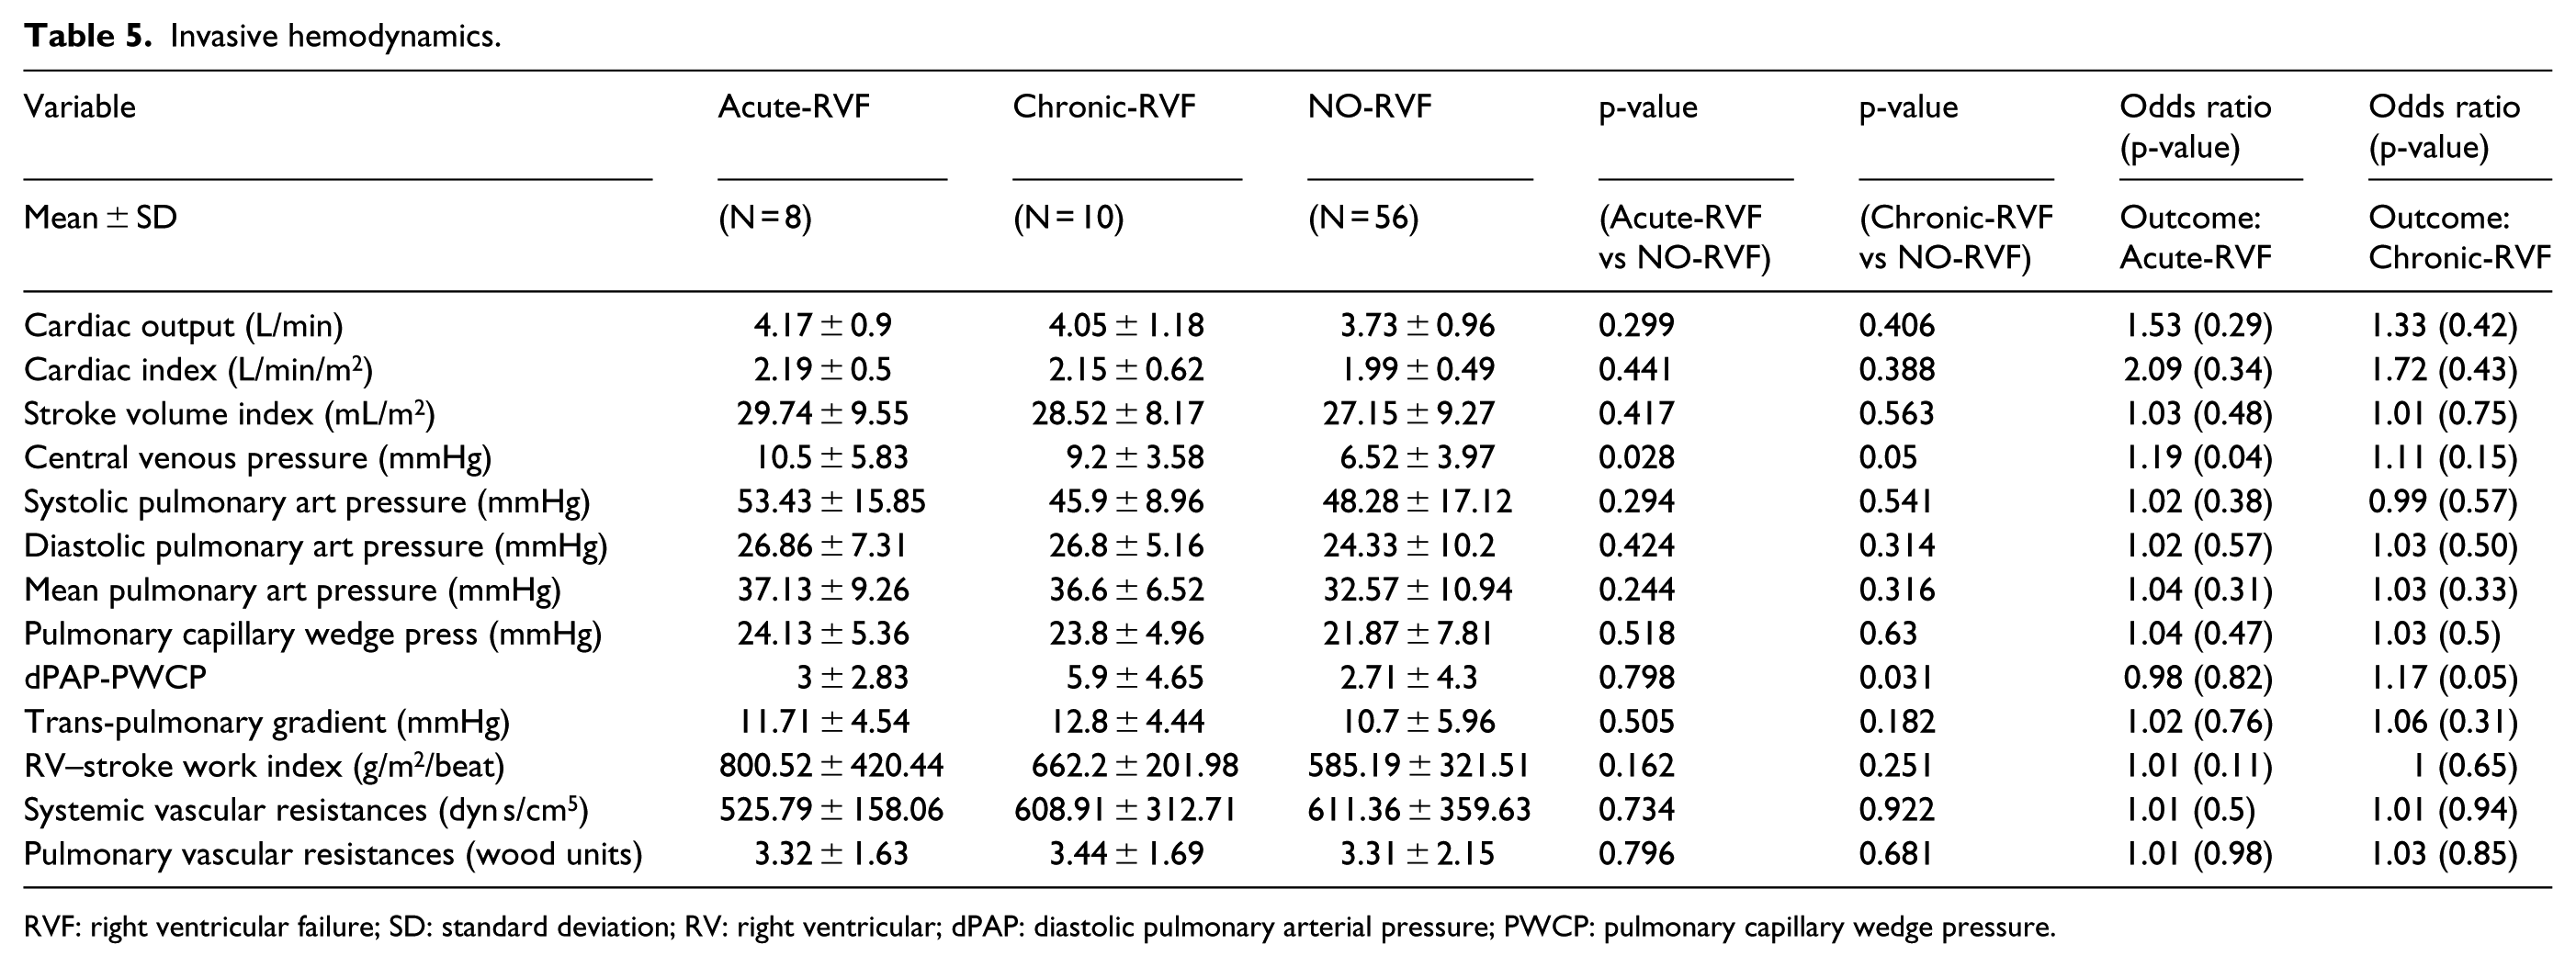
RVF: right ventricular failure; SD: standard deviation; RV: right ventricular; dPAP: diastolic pulmonary arterial pressure; PWCP: pulmonary capillary wedge pressure.
All-causes mortality and other HVAD complications
Distribution of several LVAD-related complications was similar across RVF groups, and no complication was a significant predictor of any form of RVF (Table 6). Overall, 23 LVAD patients died at follow-up. Although patients with RVF (both acute and chronic) had higher all-cause mortality compared to the NO-RVF group, such a difference was not significant.
Clinical outcomes, post-LVAD implant.
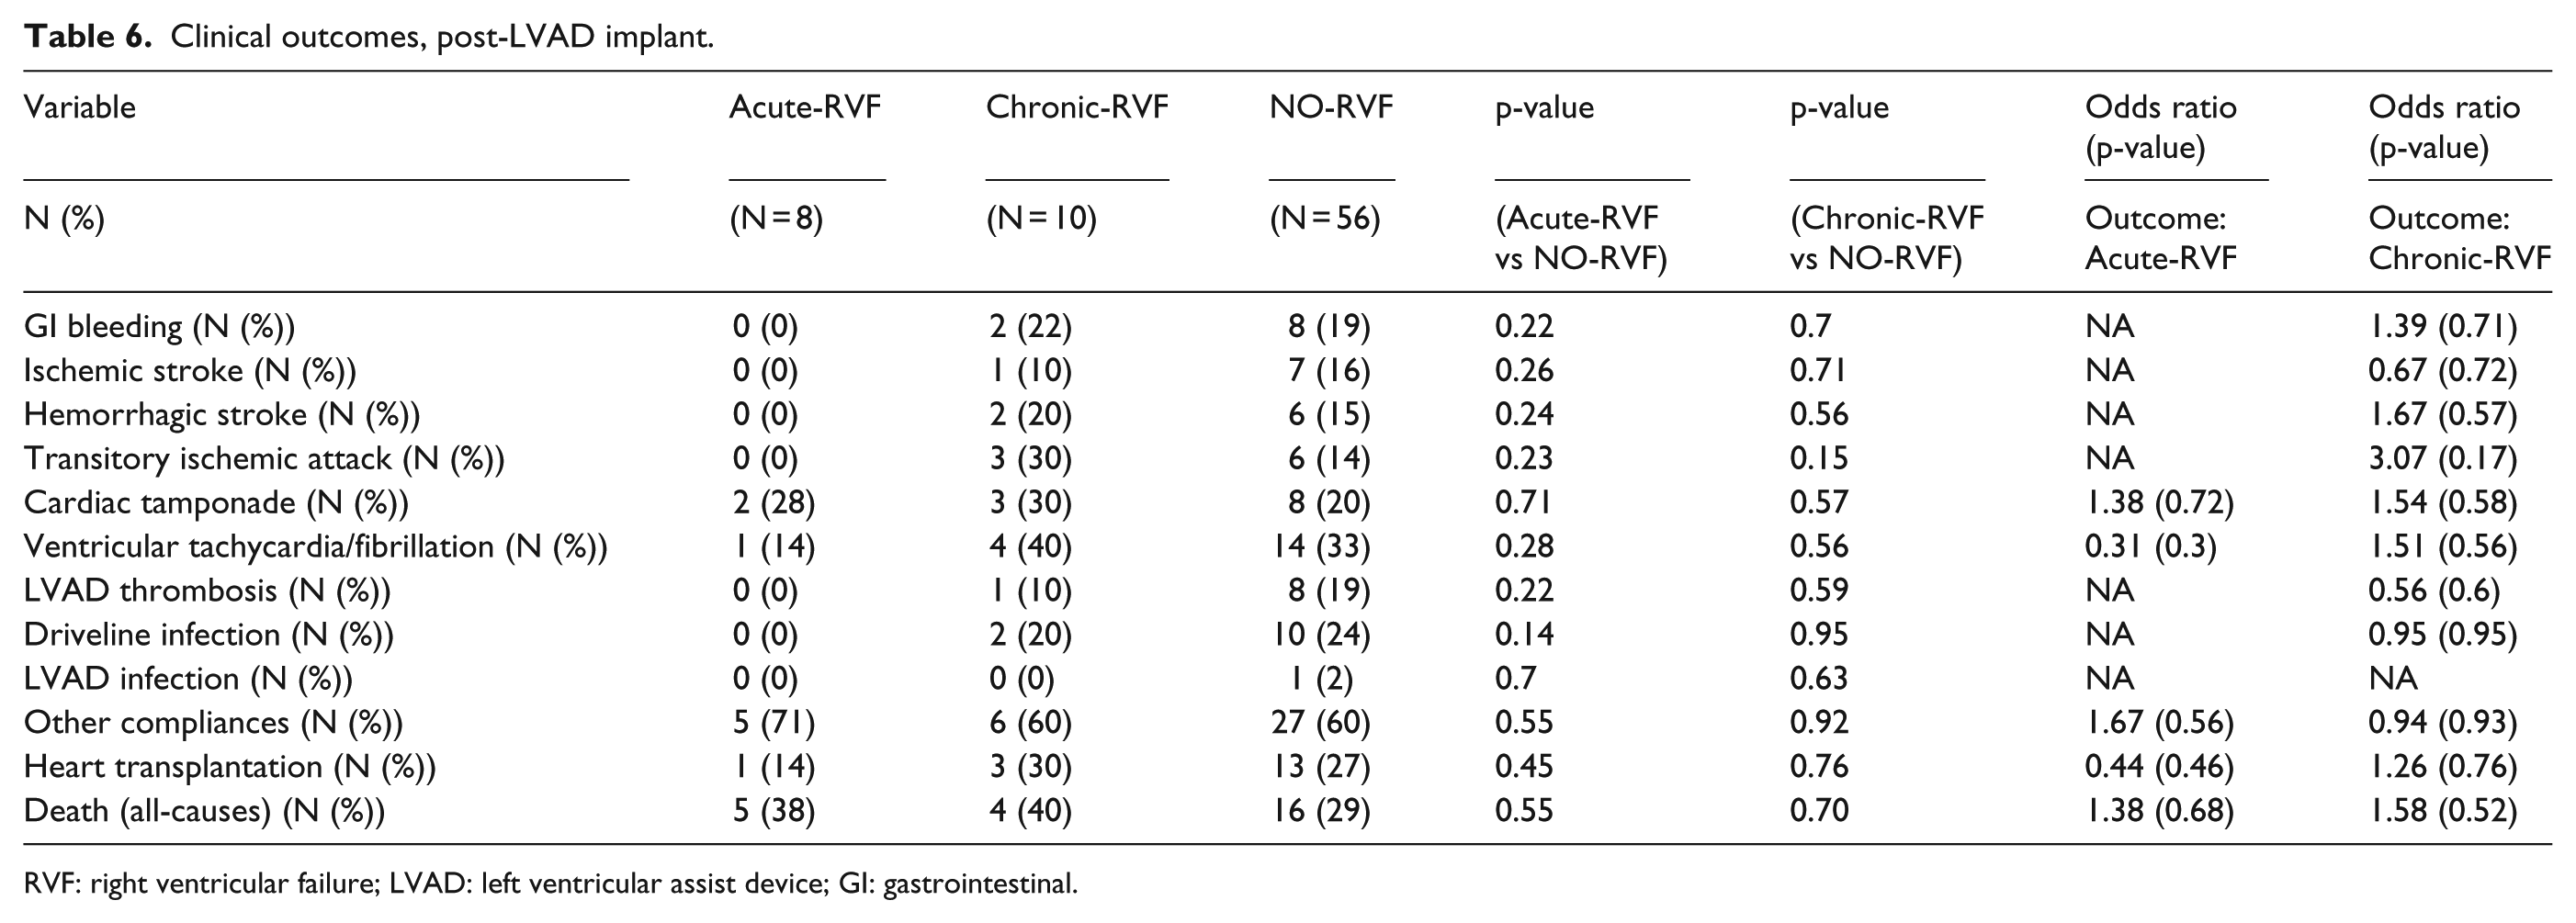
RVF: right ventricular failure; LVAD: left ventricular assist device; GI: gastrointestinal.
Predictors of Acute-RVF
According to univariate, simple logistic regression, MELD-XI and Michigan scores were the only significant predictors of Acute-RVF among demographic, clinical, and biochemical markers (serum total bilirubin was marginally significant, Tables 1 and 2) and a Michigan score of ⩾6.0 discriminated between Acute-RVF and NO-RVF groups with a sensitivity of 50% and a specificity of 89%. Among standard echocardiographic measurements, no predictors were significantly associated with Acute-RVF, although RV end-diastolic area was marginally significant. RV–free wall longitudinal sS average was a significant predictor as well and a low sS of the RV apex was specifically associated with higher risk of developing Acute-RVF already at the univariate logistic regression (Tables 3 and 4) (apical sS less negative than −12.7% had a sensitivity of 83.2% and a specificity of 81.4% in discriminating between Acute-RVF and NO-RVF). Higher CVP at RHC was the only invasive parameter to predict a greater risk of Acute-RVF (Table 5, a CVP of ⩾13 mmHg discriminated between Acute-RVF and NO-RVF groups with a sensitivity of 38% and a specificity of 91%).
According to multivariable logistic regression and machine learning algorithms, both set to identify the most accurate three predictors of Acute-RVF, there was fair agreement among the different analytic methods implemented: as depicted in Table 7 (showing ROC-AUC and AUC 95% CIs obtained on the training dataset), Table 8 (showing ROC-AUC and AUC 95% CIs obtained on the testing dataset), and Figure 2(a) and (b), the combination of the Michigan score, longitudinal sS of the apical segment of the RV–free wall, and the CVP reached the highest accuracy in discriminating between Acute-RVF and NO-RVF patients. Comparable accuracy was obtained considering RA area by ECHO instead of CVP, while the combination of RV apical sS, CVP, and RV–stroke work index (SWI) was the third most accurate triad, although its accuracy was slightly lower than the first 2 options.
Most accurate predictors of RVF according to different machine learning algorithms, UNTRAINED results.
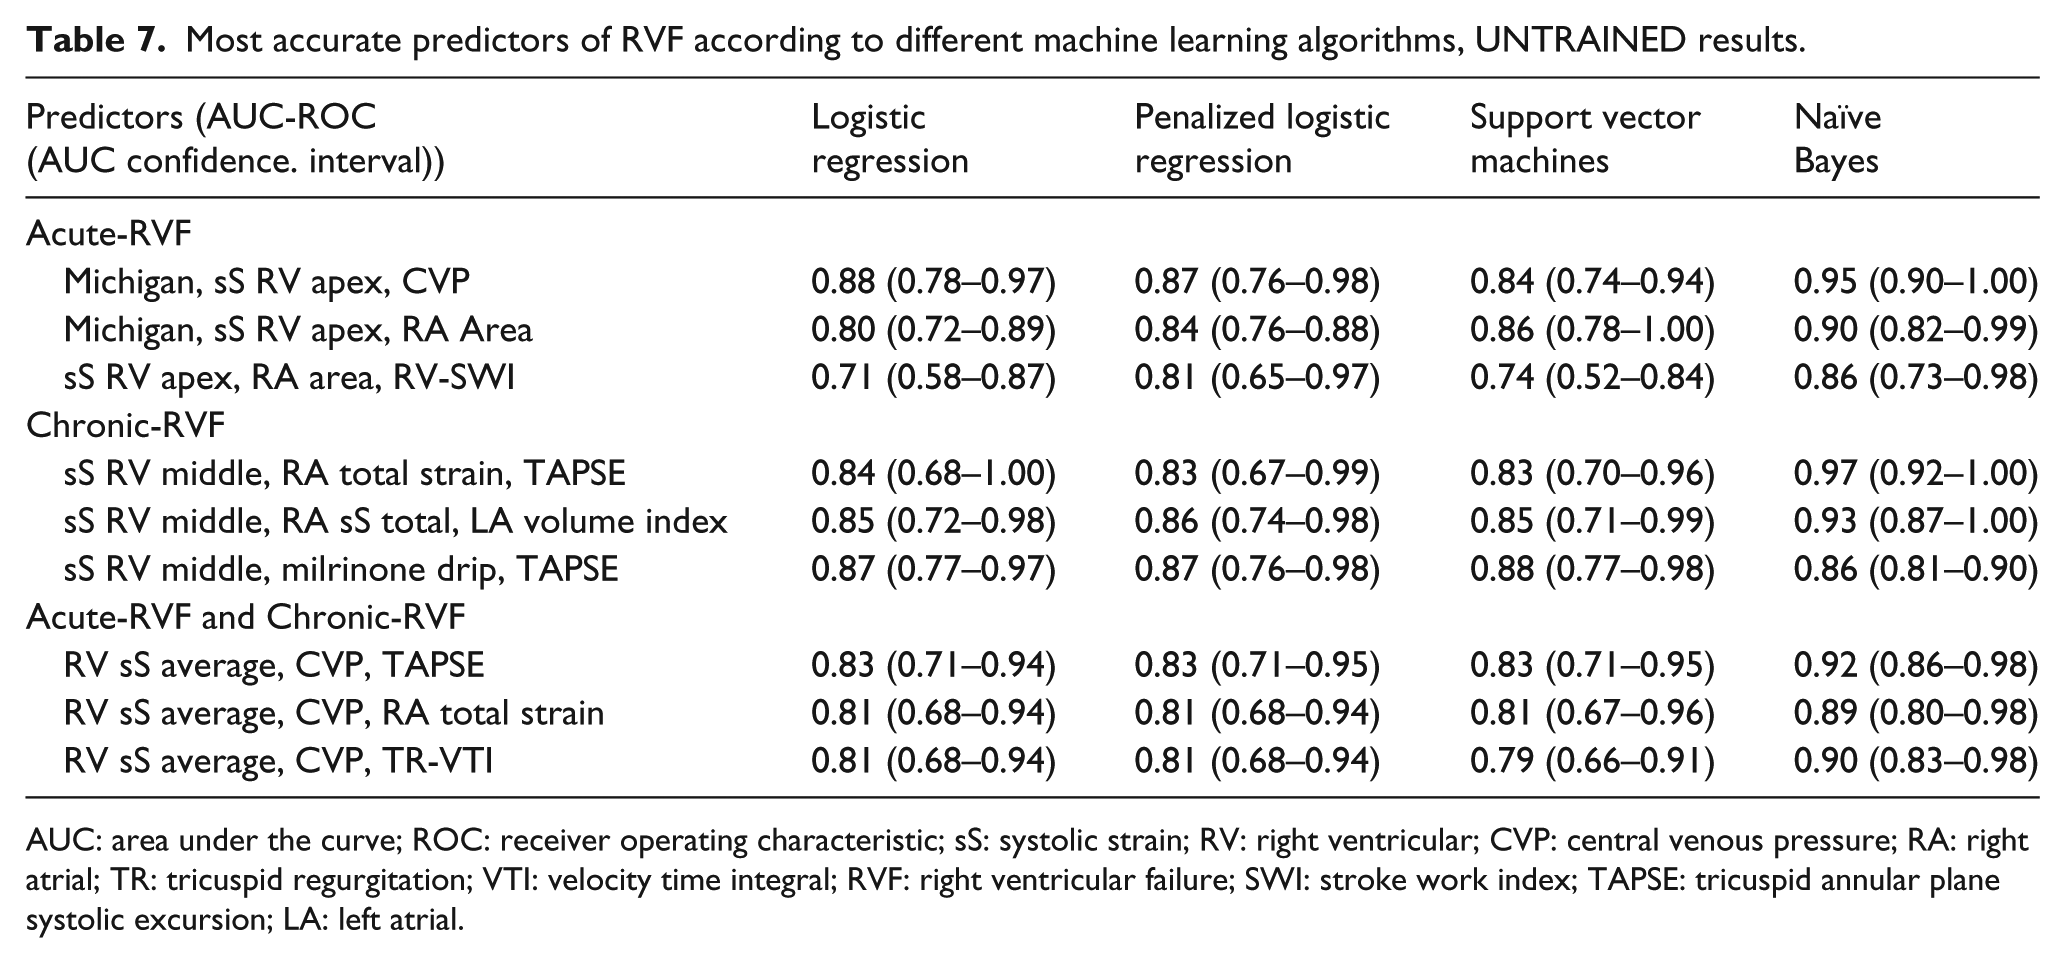
AUC: area under the curve; ROC: receiver operating characteristic; sS: systolic strain; RV: right ventricular; CVP: central venous pressure; RA: right atrial; TR: tricuspid regurgitation; VTI: velocity time integral; RVF: right ventricular failure; SWI: stroke work index; TAPSE: tricuspid annular plane systolic excursion; LA: left atrial.
Most accurate predictors of RVF according to different machine learning algorithms, TRAINED results.
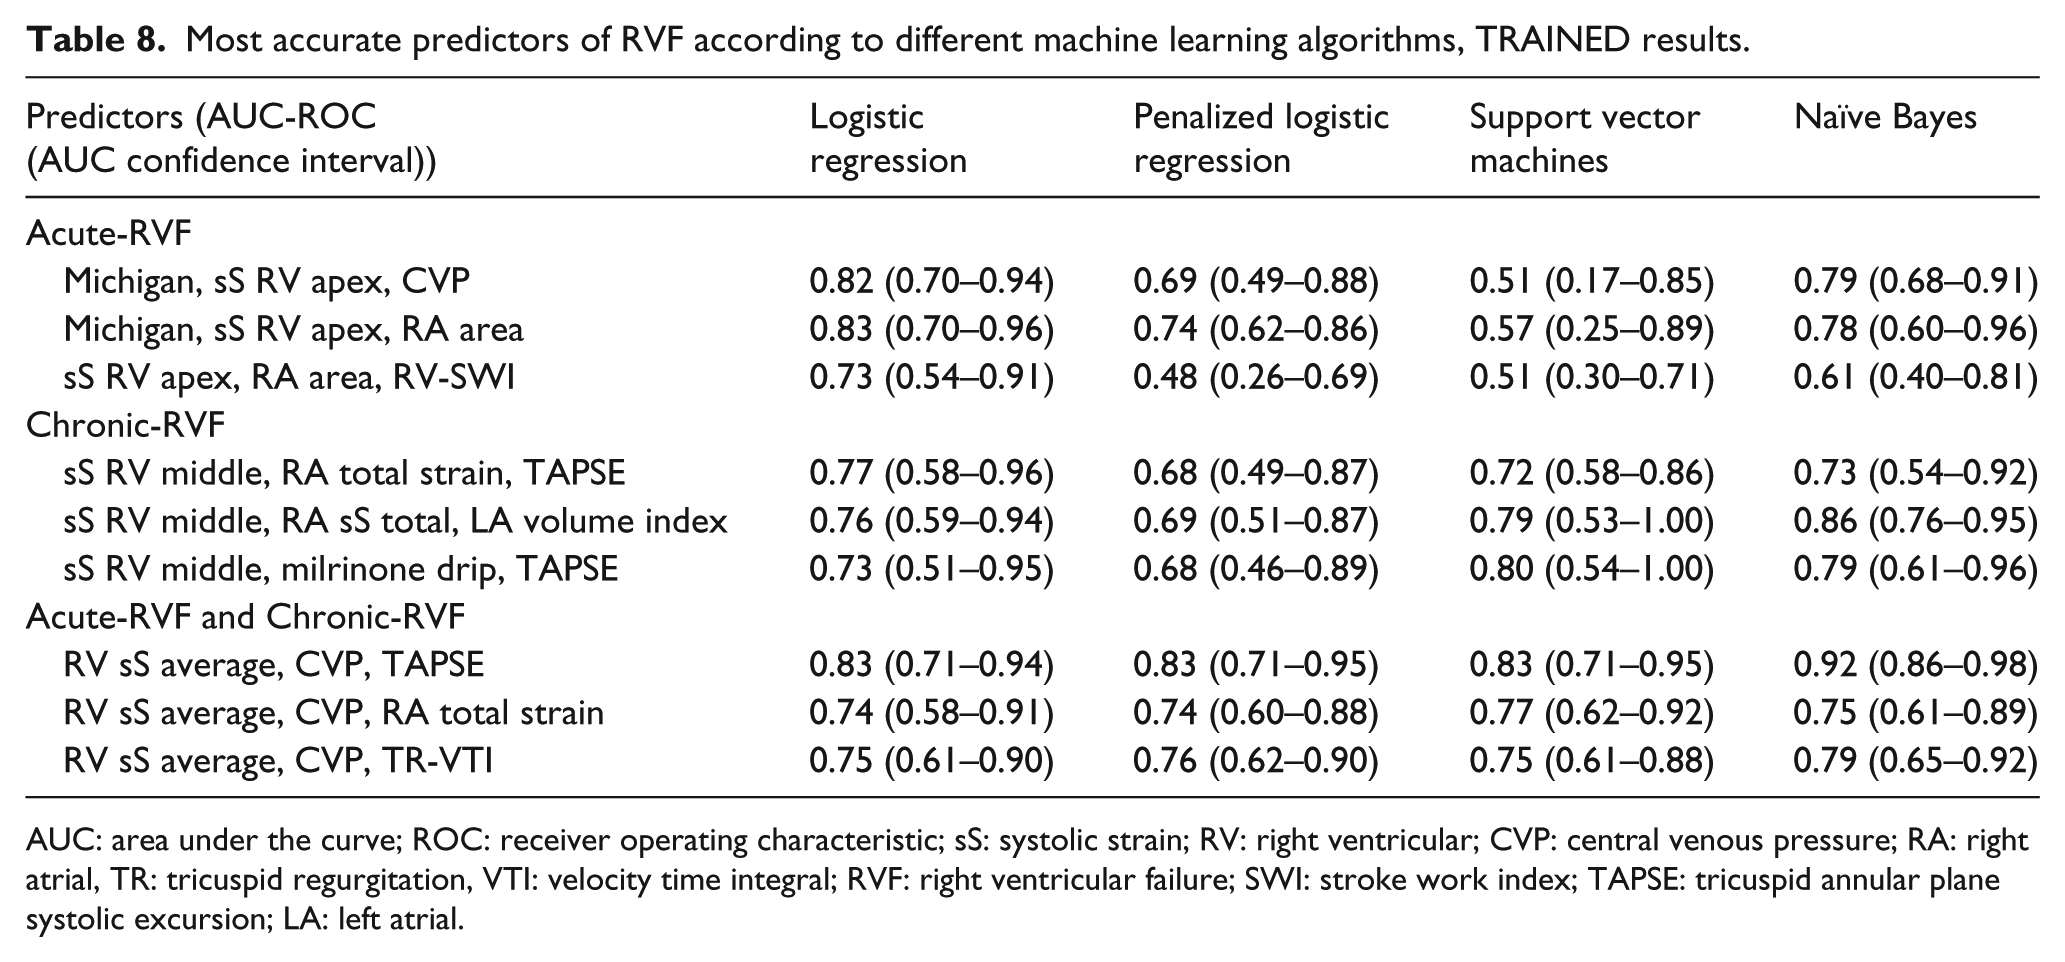
AUC: area under the curve; ROC: receiver operating characteristic; sS: systolic strain; RV: right ventricular; CVP: central venous pressure; RA: right atrial, TR: tricuspid regurgitation, VTI: velocity time integral; RVF: right ventricular failure; SWI: stroke work index; TAPSE: tricuspid annular plane systolic excursion; LA: left atrial.
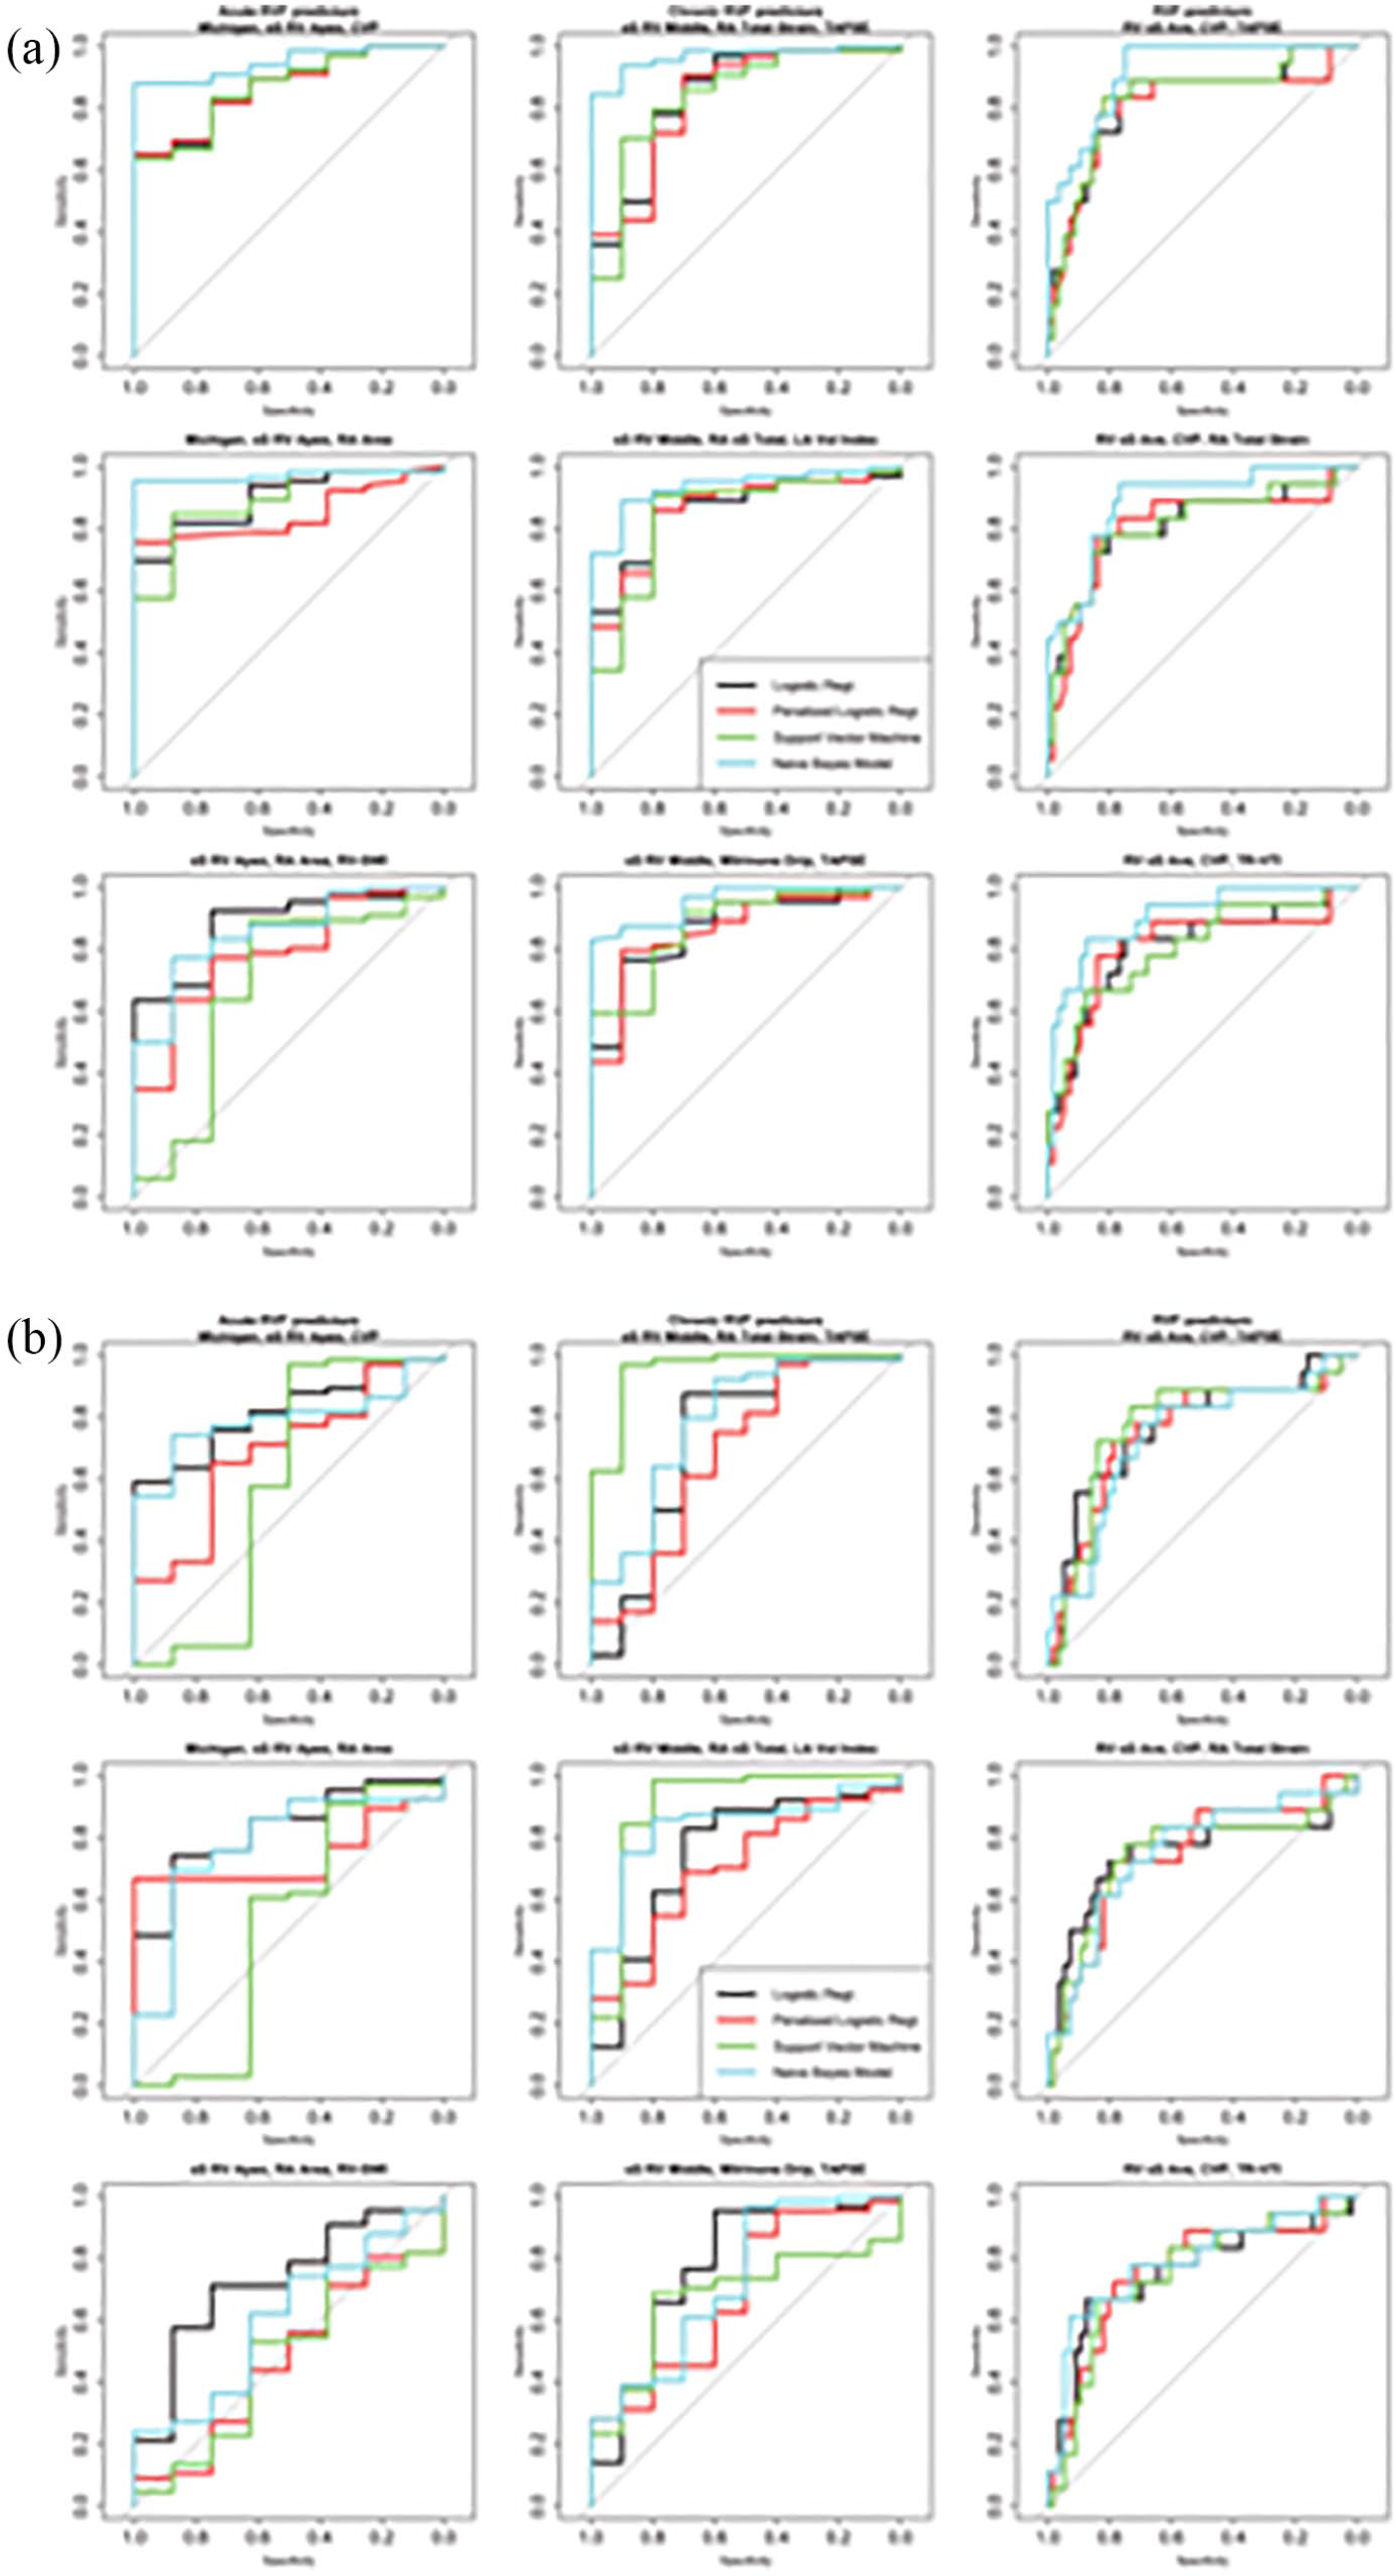
ROC curves for (a) Acute-RVF and (b) NO-RVF patients
Predictors of Chronic-RVF
According to univariate analysis, history of cardiac surgery (i.e. previous sternotomy) was the only predictor of Chronic-RVF, while low circulating platelets were marginally associated with Chronic-RVF (Tables 1 and 2). Among standard ECHO, higher LA area/volume, lower RV-FAC, TAPSE, and tricuspid annulus S′ velocity were all predictive of Chronic-RVF. Longitudinal sS of the RV–free wall was also associated with Chronic-RVF and sS of the RV middle segment less negative than −13% had the highest accuracy in predicting Chronic-RVF, with a sensitivity of 67% and a specificity of 91%. Likewise, RA PALS and RA total strain were both predictive of higher risk (Tables 3 and 4). In particular, a total RA strain of ⩽11.13 had a sensitivity of 92% and specificity of 63%. Finally, among invasive hemodynamic parameters, the higher difference between diastolic PAP and pulmonary capillary wedge pressure was the only significant predictor of Chronic-RVF at the univariate analysis (Table 4).
According to the multivariable logistic regression and different machine learning algorithms, longitudinal sS of the RV–free wall at the middle segment, RA total strain, and LA volume (index) were the three best predictors of Chronic-RVF; combination of RV sS with TAPSE or the need for milrinone drip pre-implant was also highly predictive of Chronic-RVF (Tables 7 and 8).
Predictors of either Acute-RVF or Chronic-RVF (ANY-RVF)
According to simple logistic regression, the following parameters were significant predictors of ANY-RVF (Acute-RVF or Chronic-RVF): Michigan score index (OR: 1.43, p = 0.04), LA volume index (OR: 1.03, p = 0.01), RV end-systolic area (OR = 1.15 p = 0.03), longitudinal RV sS average (OR: 1.49 p < 0.001) as well as sS of the RV Apical and Middle segment (OR: 1.41 and 1.55, respectively, p-values < 0.001 for both), longitudinal RV–free wall sSR (OR: 2.5, p = 0.04), RA PALS as well as RA total strain (OR: 0.86 and 0.82, p-values = 0.04 and 0.01, respectively). Finally, CVP (OR: 1.19, p = 0.01) was the only invasive hemodynamic measure to be associated with ANY-RVF.
The combination of global longitudinal sS of the RV–free wall, CVP, and either TAPSE, RA total strain, or the velocity time integral of the tricuspid regurgitation flow at the CW Doppler spectral analysis, were the most accurate predictors of any form of RVF, according to the different algorithms deployed.
Discussion
To our knowledge, this is the first study to have identified independent predictors of both Acute-RVF and Chronic-RVF in patients undergoing specifically HVAD implantation, employing innovative imaging parameters (regional RV–free wall as well as RA strain) as well as alternative approaches of data analysis (machine learning algorithms).
The current investigation had several main findings. First, longitudinal sS of the RV–free wall pre-implant, and in particular sS of the apical segment, had the highest accuracy in identifying patients who will develop any form of RVF (either acute or chronic) or early RVF, respectively. Second, RA strain is specifically impaired in patients referred to HVAD who have the greatest risk of developing late-onset RVF. Finally, the integration of the Michigan Score Index with deformation analysis of the right chambers by ECHO and CVP by RHC reached the highest accuracy in discriminating patients at risk of developing either Acute-RVF or Chronic-RVF.
CF-LVADs could realistically be the only alternative to transplantation, although high costs and major complications are major limiting factors to the wide use of such devices. Among major complications, early- and late-onset RVF still occurs in roughly 29% of patients 2 and results upon a sixfold increased risk of death. Therefore, the depiction of reliable, independent, and generalizable predictors of such complication is of paramount importance in this context.
Predicting early-onset RVF post-HVAD
First of all, the results of our prospective registry have confirmed that no demographic or biometric characteristic is able to identify patients at risk of RVF, as initially believed. This has also been suggested by a recent meta-analysis completed by our group. 2
However, biomarkers of liver function, and total bilirubin in particular, were elevated in patients who developed Acute-RVF, as a proxy of liver congestion due to increased RV end-diastolic pressure in a dysfunctional chamber. It is therefore not surprising that the Michigan RVF risk score in our study population was an independent predictor of Acute-RVF, consistently in all multivariable combinations of models we have tested.
In agreement with most recent publications,2,3 CVP was the only hemodynamic measurement, collected at RHC, which was higher in Acute-RVF as compared to NO-RVF group. In fact, CVP was also an independent predictor of either Acute-RVF or ANY-RVF. The equation “higher CVP = higher RA pressure and higher RV end-diastolic pressure” is straightforward, but CVP is also one of those parameters effectively modifiable in the pre-implant phase to decrease the risk of early post-operative RVF. It is indeed common intensive care unit (ICU) practice in our institution to assess CVP 48 h pre-implant in order to start an RV unloading strategy by aggressive IV diuretics and/or inotropes or even prophylactic IABP placement if needed. Several studies have reported RV-SWI to be abnormally low in patients with early-onset RVF and most recent international guidelines highlight predictive role of such parameter in identifying patients at risk of Acute-RVF. 10 We have recently shown that role of RV-SWI as predictor of Acute-RVF relies primarily on oldest studies based on PF LVADs, and its usefulness in CF-LVADs is lower. 2 Furthermore, in the present prospective study, RV-SWI was highly variable and therefore not different among groups. However, two out of three machine learning algorithms identified it as an independent predictor of Acute-RVF, when it is combined with RV–free wall strain and RA area. In summary, although our observations confirm RV-SWI as a significant predictor of Acute-RVF, it should be considered as a complementary parameter to RV–free wall strain by ECHO, and assessment of other hemodynamic measures (i.e. CVP) should be a priority in patients referred to HVAD (CF-LVAD) implant.
Standard echocardiographic measurements were not different between patients with early-onset RVF and those who did not develop RVF, so it is somewhat expected that no standard ECHO measure but RA area was useful in predicting Acute-RVF (see after). On the contrary, RV–free wall systolic deformation analysis was helpful: both global longitudinal RV–free wall sS and sSR were increased (i.e. less negative) in Acute-RVF as compared to NO-RVF. However, longitudinal diastolic strain rate was similar between the two groups and was observed to not have any influence in Acute-RVF prediction. To date, three studies have reported that RV longitudinal sS is an independent predictor of Acute-RVF,22–24 one of which enrolled the biggest sample number. 22 We have confirmed the importance of global RV–free wall sS in predicting Acute-RVF, but we have gone a step further, focusing our analysis on the segmental evaluation of the RV–free wall, as well as the RA strain. In our population, the sS of the RV–free wall at the apex was substantially increased (i.e. it was less negative) at baseline in patients who developed Acute-RVF and was identified as one of the three most accurate predictors of early-onset RVF by standard or alternative classification algorithms. Why the apex of the RV is the most impaired segment in this population is uncertain, but segmental regionality by strain is quite common in cardiomyopathies 25 and previous research may help in understanding this phenomenon: Kulkusky and coworkers 26 were the first to report an RV apex to base strain gradient already in healthy elderly subjects, showing that apical Doppler sS was lower as compared to the basal RV–free wall sS. The observation was subsequently confirmed in the pulmonary hypertension arena: two groups have independently shown that either adult 27 or pediatric 28 patients with pulmonary hypertension had a more severe impairment of the Apical (or middle) sS as compared to the Basal RV–free wall sS, and that this phenomenon was absent in controls. Finally, similar findings have been recently reported in the same population employing 3D Speckle tracking. 29 It could be argued that orientation of RV apical myofibers is oblique at the subendocardium as compared to the basal region that preserves a more longitudinal orientation. 30 An appealing hypothesis is that apical RV deformation is mostly influenced by the LV dimensions, so that in patients with higher LV volume (i.e. greater apex) the RV apex is compressed affecting strain specifically at that level. However, independently on the reason, our results highlight one of the main benefits offered by strain analysis, that is the opportunity to perform an exhaustive regional analysis of the myocardial deformation. It is therefore important to avoid combining/averaging values and report segmental strain separately.
Interestingly, RA strain was comparable between Acute-RVF and NO-RVF patients and was not associated with early-onset RVF in our population. The importance of RA area in this context is reasonable and is consistent with the higher CVP (RA pressure) documented in this group of patients.
Predicting late-onset RVF post-HVAD
Counting on a longer follow-up, we have also looked for independent predictors of Chronic-RVF: first of all incidence of Chronic-RVF in our sample was consistent with available reports.31,32 Likewise, patients developing late-onset RVF had comparable survival as compared to NO-RVF patients, although, due to the relatively small number of events, we had no chance to perform stratified analysis or check subgroups. Moreover, it is noteworthy that in our population, there is no overlapping between Acute-RVF and Chronic-RVF: in other words, patients developing post-operative RVF were different from those readmitted for late-onset RVF. This suggests that Acute-RVF and Chronic-RVF should not be considered as a unique disease with a wide spectrum and timing of clinical presentation, rather distinct issues affecting RV, with different patho-physiology and risk factors.
Although body mass index (BMI) was not associated with late-onset RVF in our population, 33 consistently with Takeda and collaborators, patients at higher Chronic-RVF risk had greater BUN levels and lower platelets. The explanation of pre-implant milrinone drip as an independent predictor of late-onset RVF is not immediately evident: according to our common protocol (implemented either at ISMETT and at Papa Giovanni Hospital), milrinone is begun 24–48 h ahead of LVAD implant, in those patients with extremely low LV-EF and high trans-pulmonary gradient at the RHC, to provide inotropic support at both ventricles at the same time reducing pulmonary resistances. In other words, milrinone is used in patients at higher risk of developing early-onset RVF to reduce such risk. Milrinone could therefore be really helpful in preventing Acute-RVF, but it cannot influence RV performance in the long term, so that patients that need the drip are also those at higher risk of RVF after hospital discharge.
Surprisingly, ECHO measurements collected pre-implant are reasonably useful in predicting RVF occurring several months after implantation: LA volume is a well-known indicator of LV filling pressures. 33 Since higher LV filling pressure is necessarily related to higher RV afterload, it is perhaps not surprising that patients with higher LA dimensions have higher risk of late-onset RVF. Regional longitudinal sS of the RV–free wall is useful in predicting Chronic-RVF too, and deformation analysis of the middle segment seems more accurate than apical strain to assess long-term risk of RVF. Furthermore, we for the first time report the importance of assessing RA performance by total strain, to stratify the risk of patients with LVAD in the long term. It is in fact reasonable that RA function more than the mere chamber dimensions is helpful in identifying patients with chronically high CVP, specifically due to advanced RV impairment. Finally, it is worth to remark the role of a simple and immediate measurement such as TAPSE in this context: consistent with previous reports, 34 we confirm that TAPSE at pre-implant is not useful in predicting early, post-operative RVF. Nonetheless, TAPSE has been identified by several algorithms as an independent predictor of late-onset RVF in this population. Putting all together, we can legitimately speculate that loading conditions and volemic status are more important than intrinsic myocardial performance in determining early RVF, while RV muscle function is the predominant factor in predicting late-onset RVF.
Predicting any form of RVF in patients undergoing HVAD implantation
Combining Acute-RVF and Chronic-RVF events improved statistical power and offered the best way to define “overall” risk of RVF in this population: it is indeed not surprising that global average of longitudinal RV–free wall sS was the main predictor of any form of RVF, being a combined parameter of apical strain (useful for Acute-RVF prediction) and middle segment strain (helpful for late-onset RVF prediction). CVP, as an indirect measure of RV impairment, is extremely useful for defining the risk of Acute-RVF, but it is evidently involved in late-onset events as well, so to be among the parameters with the highest predictive accuracy of any form of RVF. This supplementary analysis confirmed the role of RA total strain and TAPSE in risk stratification, while the tricuspid regurgitation velocity time integral (an indicator of mPAP 35 ) seems useful only when it is combined with RV strain and CVP.
Limitations
The primary limitation of our study is the relatively low number of events, either in the acute context or in the chronic context. Some level of uncertainty due to low statistical power is also shown by the wide ROC-AUC 95% confidence intervals, in particular those obtained in the testing dataset. However, this limitation is partially mitigated by the highly homogeneous study population (all patients were referred to HVAD) and by the specific analysis employed: although as expected, ROC-AUCs of the multivariable models were all reduced when applied to a new (“test”) subset of patients, machine learning algorithms have substantially confirmed results obtained by standard logistic regression. This assures generalizability and comforts our conclusions. Finally, our analysis is consistent with previous reports and extends available knowledge highlighting the importance of regional strain assessment of the RV as well as the RA deformation.
Another weakness of our analysis is the definition of either Acute-RVF or Chronic-RVF: although we have relied on the most recent guidelines, 10 such rigid definition has been questioned and a more flexible classification based on clinical severity of Acute-RVF has been proposed. 36 Finally, although no formal consensus has been published, we have defined late-onset RVF according to research groups that have worked in the field, using a reasonable definition based on clinical assessment.32,37
Conclusion
In conclusion, predicting RVF following LVAD implantation cannot rely on just one parameter, and several factors, including clinical assessment, as well as hemodynamic, biochemical, and imaging markers, need to be considered together. Among available score systems, the Michigan risk score has the highest accuracy in identifying patients at risk of early-onset RVF among those referred specifically to HVAD implant. Such risk is further improved by the integration with the apical sS of the RV–free wall and CVP pre-implant. Strain of the middle segment of the RV–free wall as well as RA strain and TAPSE is helpful in predicting late-onset RVF, so we recommend to complete a regional as well as global strain assessment of both RV–free wall and RA when standard measures of RV performance by ECHO (i.e. TAPSE) have been collected, to assess the overall risk of developing RVF post-HVAD either in the short term or in the long term. Further studies enrolling a bigger sample of patients and different LVAD models are certainly warranted to confirm our results.
Footnotes
Declaration of conflicting interests
The author(s) declared no potential conflicts of interest with respect to the research, authorship, and/or publication of this article.
Funding
The author(s) received no financial support for the research, authorship, and/or publication of this article.