
Abstract
The intraventricular blood flow changed by blood pump flow dynamics may correlate with thrombosis and ventricular suction. The flow velocity, distribution of streamlines, vorticity, and standard deviation of velocity inside a left ventricle failing to different extents throughout the cardiac cycle when supported by an axial blood pump were measured by particle image velocimetry (PIV) in this study. The results show slower and static flow velocities existed in the central region of the left ventricle near the mitral valve and aortic valve and that were not sensitive to left ventricular (LV) failure degree or LV pressure. Strong vorticity located near the inner LV wall around the LV apex and the blood pump inlet was not sensitive to LV failure degree or LV pressure. Higher standard deviation of the blood velocity at the blood pump inlet decreased with increasing LV failure degree, whereas the standard deviation of the velocity near the atrium increased with increasing intraventricular pressure. The experimental results demonstrated that the risk of thrombosis inside the failing left ventricle is not related to heart failure degree. The “washout” performance of the strong vorticity near the inner LV wall could reduce the thrombotic potential inside the left ventricle and was not related to heart failure degree. The vorticity near the aortic valve was sensitive to LV failure degree but not to LV pressure. We concluded that the risk of blood damage caused by adverse flow inside the left ventricle decreased with increasing LV pressure.
Keywords
Introduction
Left ventricular assist devices (LVADs) have been successfully used to rescue end-stage heart failure patients.1–5 The native heart operates coupled with a blood pump during periods of blood pump support. In patients supported by LVADs, both the intraventricular flow fields and the hydraulic performance of the cardiac output and blood pressure in terms of circulation are influenced. For example, the pump speed influences the cardiac output and blood pressure, and a higher pump speed causes negative pressure inside the left ventricle, whereas a lower pump speed may cause insufficient unloading of the left ventricle. 6 The effect of supportive blood pumps that are widely used for end-stage heart failure on the circulation in heart failure patients should be thoroughly investigated, especially in terms of how the original intraventricular flow fields are influenced by supportive blood pumps and the correlation between changes in the intraventricular flow fields and the occurrence of thrombosis or ventricular collapse in the native heart. Although LVADs relieve the symptoms of heart failure, the altered blood flow fields are related to adverse events that remain problematic.
Studies on blood flow behavior inside the ventricle have been performed by analyzing the myocardial structures and systolic and diastolic function. The changes of intraventricular flow that accompany LVAD use can similarly lead to areas of stasis. Vulnerable areas in LVAD patients include the aortic outflow tract, particularly aortic cusps with stagnant flow, and the LV apex near the LVAD inflow cannula.7,8 Computed tomography (CT) has been widely used to acquire images with very high resolution and thin slices,9,10 and anatomical relationships can be accurately represented by three-dimensional (3D) reconstructions.11,12 However, few investigations have focused on the LV failure stages to study the intraventricular flow characteristics after LVAD implantation. Therefore, the influence of LV failure stages on intraventricular flow and ventricular collapse is still unclear. Furthermore, the heart of experimental sheep is normal, whereas the heart of treated patients is failing, so whether and to what extent animal experiments can reflect the effect of blood pumps in clinical use is also unclear.
Mock circulatory loops (MCLs) can imitate the human circulatory system and have been widely used to test LVAD hydraulic performance in vitro.13–16 Some MCLs have been integrated with particle image velocimetry equipment and with transparent silicone tubes for flow visualization experiments. A flexible anatomical LV model can be incorporated into the MCL for more realistic simulations. 17 Silicone is used to manufacture the flexible transparent models of structures, such as arteries, for flow visualization. The aim of this research was to investigate the influence of blood pump support on intraventricular flow in different levels of LV failure and related adverse events. A flow visualization experiment with a transparent left ventricle was performed by PIV under conditions of LV failure and severe LV failure with blood pump support. The transparent LV model was manufactured based on a heart failure patient’s CT data. The time-dependent intraventricular blood flow velocity was measured for two levels of heart failure with blood pump assistance.
Materials and methods
LV model
We manufactured a transparent silicone LV model based on the reconstruction of a heart failure patient’s end-diastolic CT data. The inspected patient underwent cardiac CT with 0.5-mm slices using a GE CT system (GE, USA). Then, end-systolic CT digital imaging and communications in medicine (DICOM) images were used to extract and 3D reconstruct the left ventricle with Mimics 17.1 software, as shown in Figure 1(a). This reconstructed model was manufactured and incorporated into an MCL for in vitro hydrodynamic measurements by the PIV method. The material properties of the transparent silicone LV model are shown in Table 1.
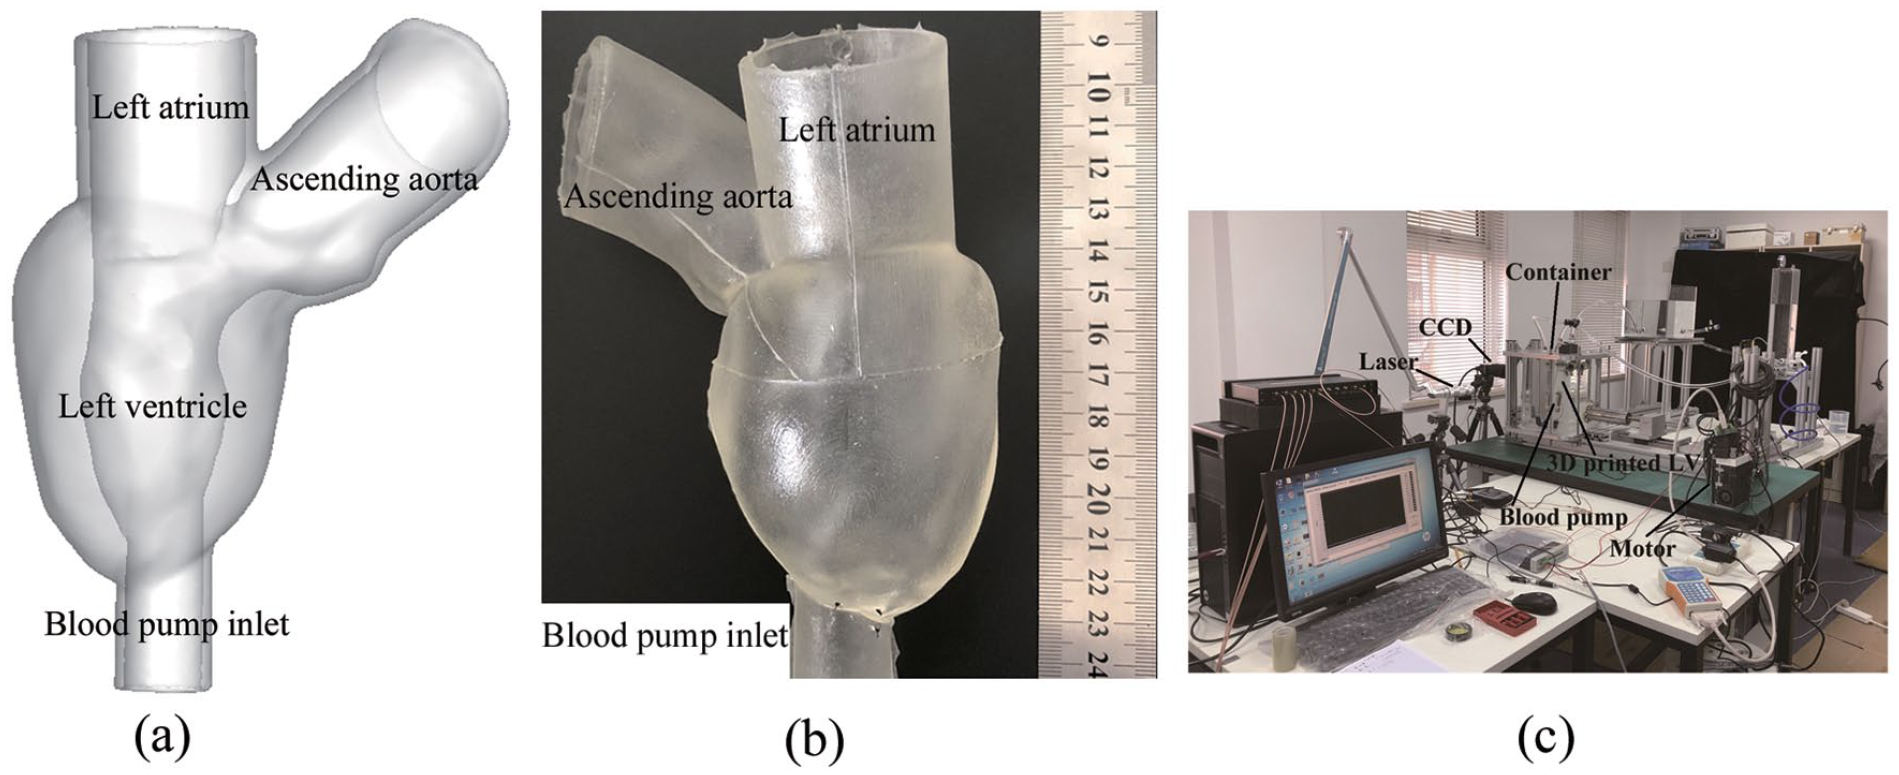
LV model and MCL: (a) 3D reconstruction of the LV model, (b) silicone LV model, and (c) MCL with PIV system.
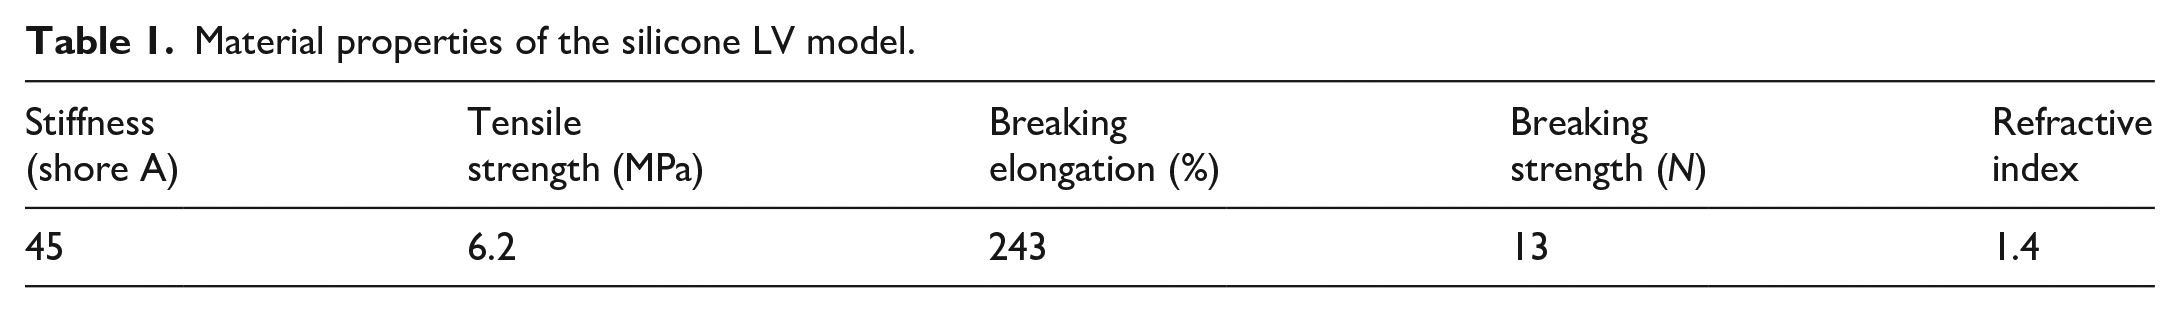
Material properties of the silicone LV model.
MCL
An experimental MCL was used to simulate the human circulation and consisted of a transparent silicone LV model shown in Figure 1(b). The MCL consisted of a transparent silicone LV model driven by electrical machinery, a transparent acrylic reservoir filled with purified water, a pressure transducer embedded into the LV model, manual pressure adjusting valve, polyvinyl chloride (PVC) tubing, aortic valve (mechanical bileaflet heart valve, Sorin Group Italia), mitral valve (mechanical bileaflet heart valve, Sorin Group Italia), PIV equipment, and the tested blood pump, as shown in Figure 1(c). The tested silicone LV model, mechanical heart valves and blood pump are placed into the sealed transparent acrylic cubic reservoir filled with purified water. The influence of refractive index of LV model surface can be eliminated by placing LV model into transparent acrylic cubic reservoir filled with purified water. And the transparency of LV model can be enhanced by placing LV model into purified water. The piston connected to electrical machinery motor pulses the LV model through suctioning and compressing the purified water inside the sealed reservoir. The volume change of the LV model is calculated by the piston position sensor because of the purified water is incompressible. The movement of the piston was controlled by computer and motor controller box. The pressure transducer is embedded into the LV model to monitor the pressure inside the LV model. Mechanical heart valves are placed at the joints between the LV model and the PVC tubing.
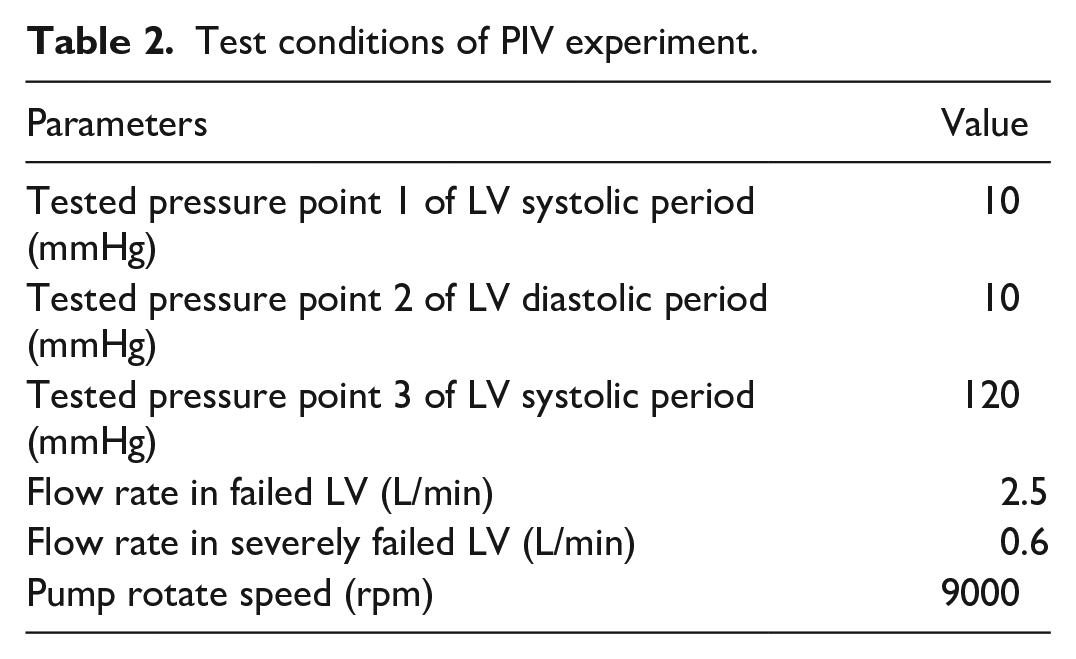
We defined LV volume change-time curves mimicking those in heart failure and severe heart failure patients in this study, as shown in Figure 2. The cardiac cycle was set to 0.9 s to let LV pulsed 65 beats per minute in the test. The flow rate in failed LV was 2.5 L/min without blood pump supporting, whereas the flow rate in severely failed LV was 0.6 L/min without blood pump supporting, as shown in Table 1. So the piston connected to the electrical machinery was pushed three times to reach the flow rates in failed LV and severely failed LV. The closed-loop silicone LV model and arterial pipelines were filled with 40% glycerin solution and aluminum oxide particles to mimic human blood with a viscosity of 3.5 × 10⁻³ Pa · s. 18 The LAP31 blood pump 19 was connected into this MCL and operated at 9000 ± 50 rpm for the in vitro test. The blood pump generated a pressure rise of nearly 100 mmHg and a flow rate of 3 L/min at 9000 rpm. Flow visualization experiments to observe the intraventricular flow fields were carried out under conditions of LV failure and severe LV failure. A B2020M digital charge coupled device (CCD) camera was used for image acquisition. The camera was operated at 2048 × 2048 pixels and a sampling rate of 1–20 Hz. A double-pulse Vlite-200 laser with a wavelength of 532 nm and single pulse energy of 200 mJ with a repetitive operating frequency of 1–15 Hz was used in the experiments. The silicone LV model was placed into the cubic acrylic reservoir filled with deionized water to eliminate the refraction of the LV model surface and gain clearer flow field visualization. The LV pressure was generated by electrical machinery and adjusted by manual adjusting pressure valve. The particle distribution was phase-lock recorded by a two-dimensional (2D) PIV system (Microvec, Inc., Beijing China) at the LV representative pressure points: 10 mmHg of failed LV systolic period, 10 mmHg of severely failed LV systolic period, 10 mmHg of failed LV diastolic period, 10 mmHg of severely failed LV diastolic period, 120 mmHg of failed LV systolic period, and 120 mmHg of severely failed LV systolic period, as shown in Table 2. The PIV phase-lock function was implemented by hall transducer sensor. The section of maximum area inside LV was selected as the tested cross-section. In this LV model, the maximum area cross-section can meanwhile include left atrium and ascending aorta joints. The flow fields inside LV, near left atrium, aortic valve, blood pump inlet, and LV apex can be observed from the tested cross-section simultaneously.
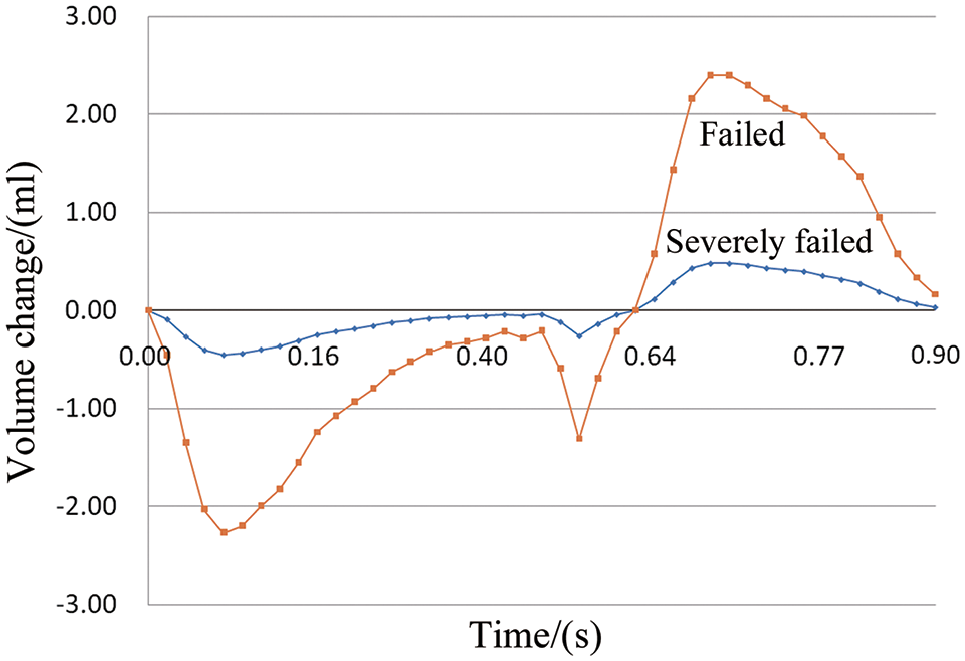
Volume change-time curves of failed LV and severely failed LV.
Test conditions of PIV experiment.
Results
Velocity vector
The visualized velocity vectors of intraventricular blood flow with the axial blood pump rotating at 9000 rpm under both LV failure and severe LV failure are presented in Figure 3. The maximal intraventricular blood velocity was 0.39 m/s throughout the cardiac cycle. The flow velocity near an inner wall of the LV was higher, whereas the flow velocity in the central LV region was lower or even static. The distribution of blood flow vectors was similar during a cardiac cycle with an intraventricular pressure from 10 to 120 mmHg for both LV failure and severe LV failure. This means that the axial blood pump was not sensitive to LV preloading. With the blood pump rotating at 9000 rpm, the blood flowed from the left atrium and aortic valve to the blood pump inlet. The highest blood flow velocity region was located at the axial blood pump inlet. The blood flow velocity vector distribution showed a velocity gradient from the atrium to the LV apex. The blood flow velocity inside the axial blood pump inlet in severe LV failure was higher than that in LV failure throughout the cardiac cycle, which means that the blood pump suctions blood more easily in cases of more severe native heart failure.
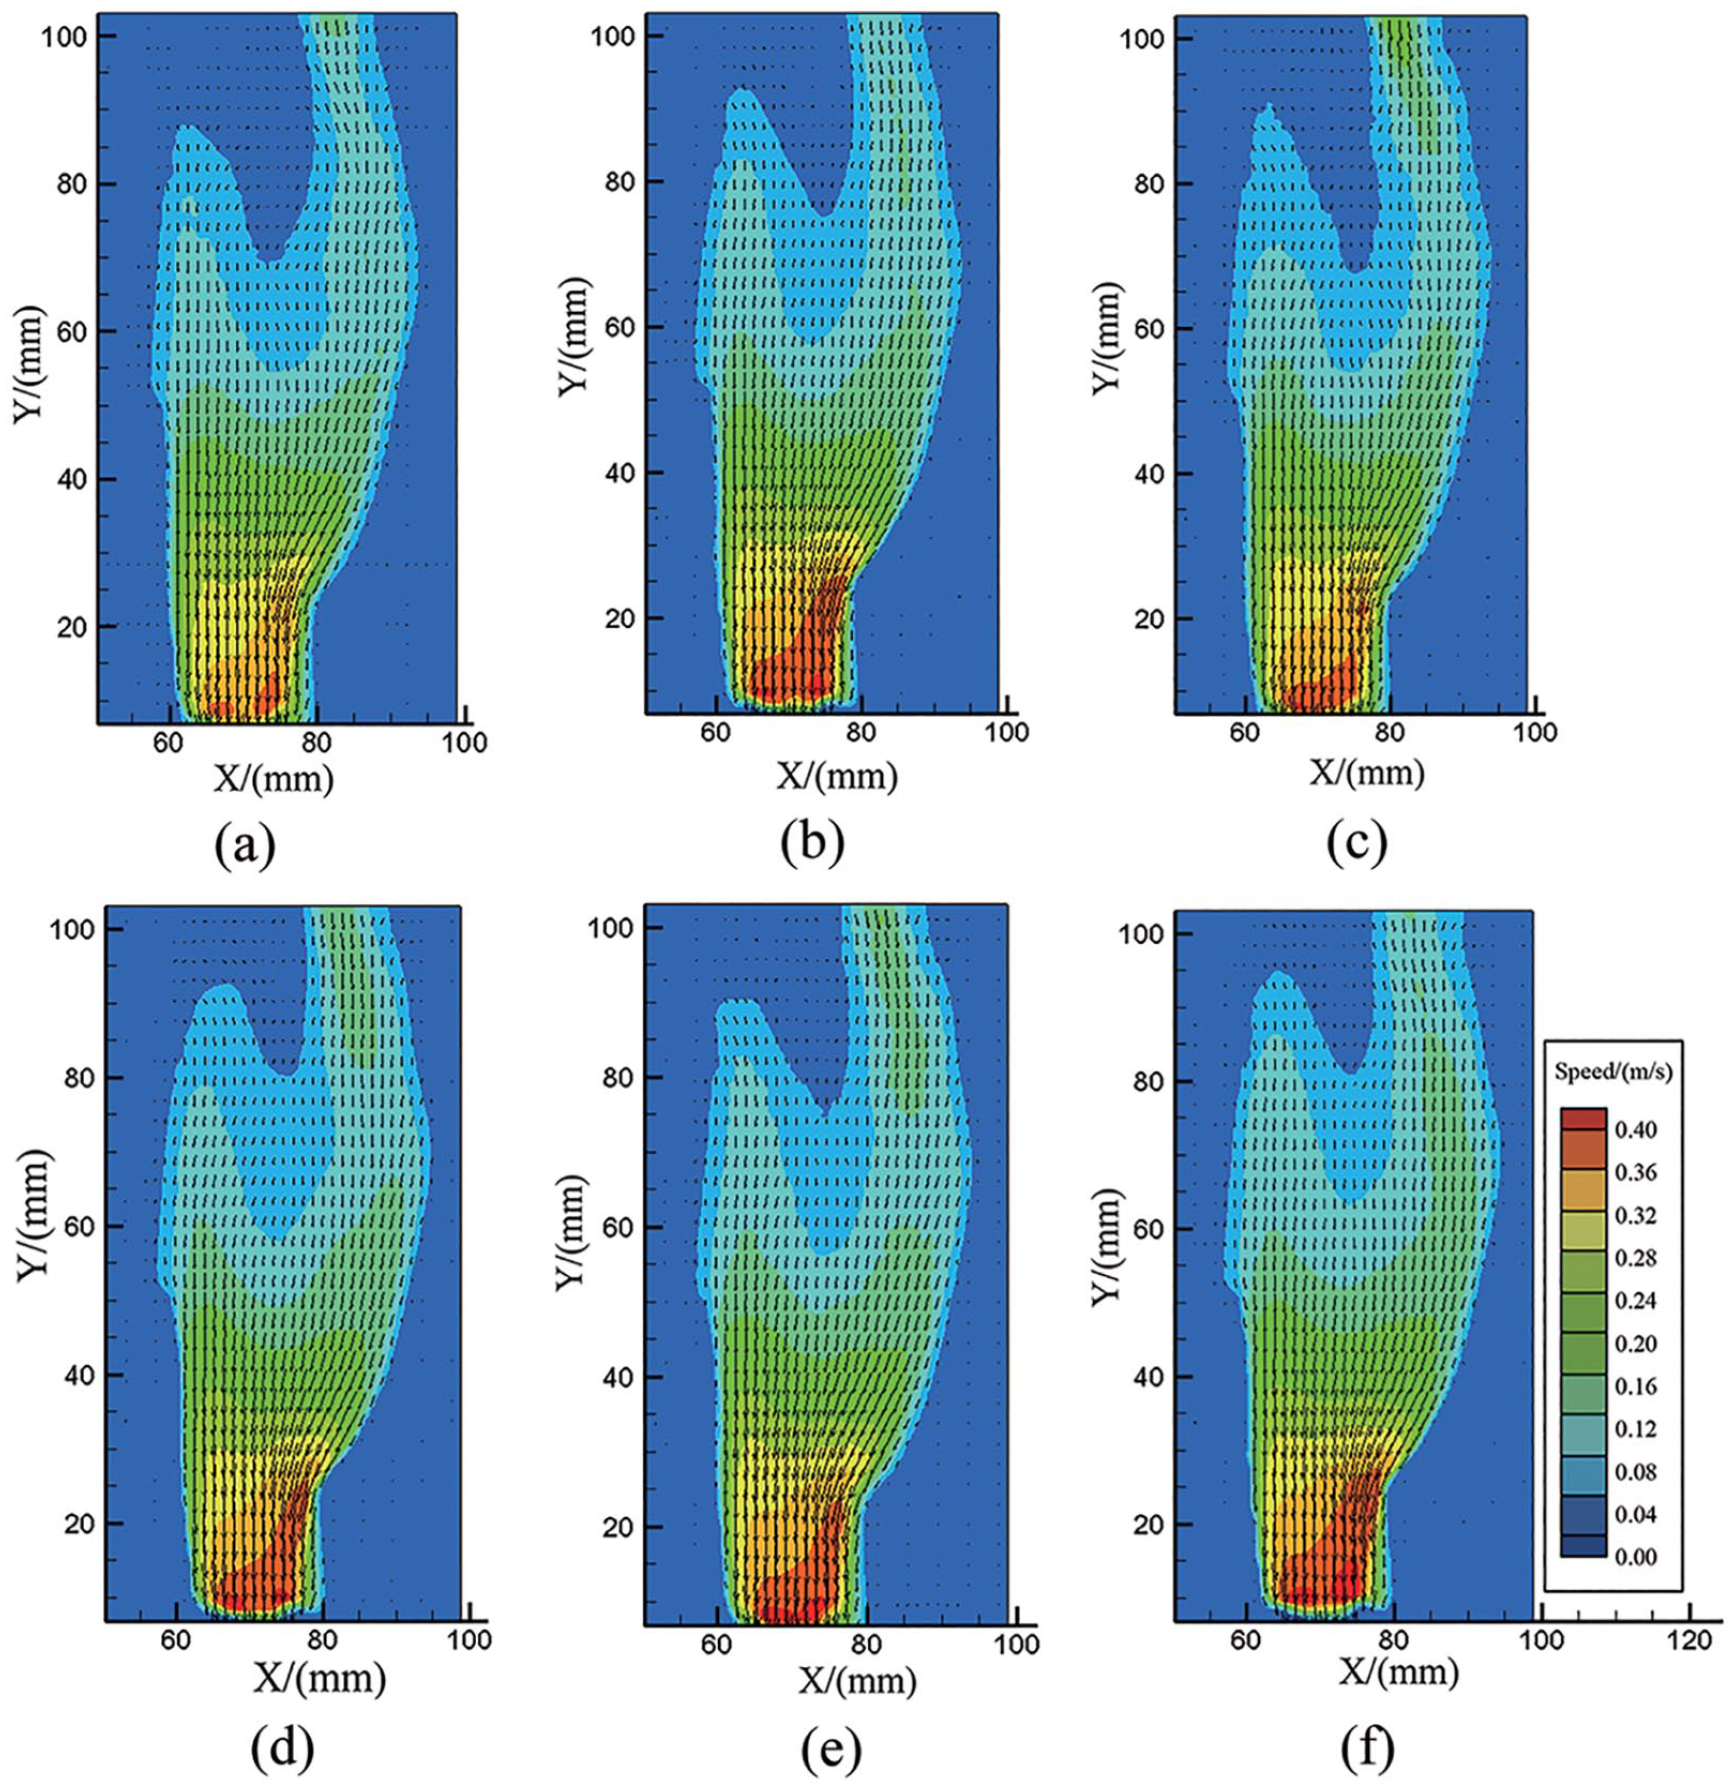
Velocity distribution inside left ventricle: (a) 10 mmHg of failed LV systolic period, (b) 10 mmHg of severely failed LV systolic period, (c) 10 mmHg of failed LV diastolic period, (d) 10 mmHg of severely failed LV diastolic period, (e) 120 mmHg of failed LV systolic period, and (f) 120 mmHg of severely failed LV systolic period.
Streamlines
Figure 4 presents the intraventricular blood flow streamlines of the tested cross-section in both LV failure and severe LV failure at a systolic intraventricular pressure of 10 and 120 mmHg and a diastolic intraventricular pressure of 10 mmHg. The blood pump suctioned blood directly from the left atrium to the LV apex along the inner LV wall in severe LV failure, as shown in Figure 4(b), (d), and (f). The blood flow streamlines near the atrium were disordered in less severe LV failure, as shown in Figure 4(a), (c), and (e).
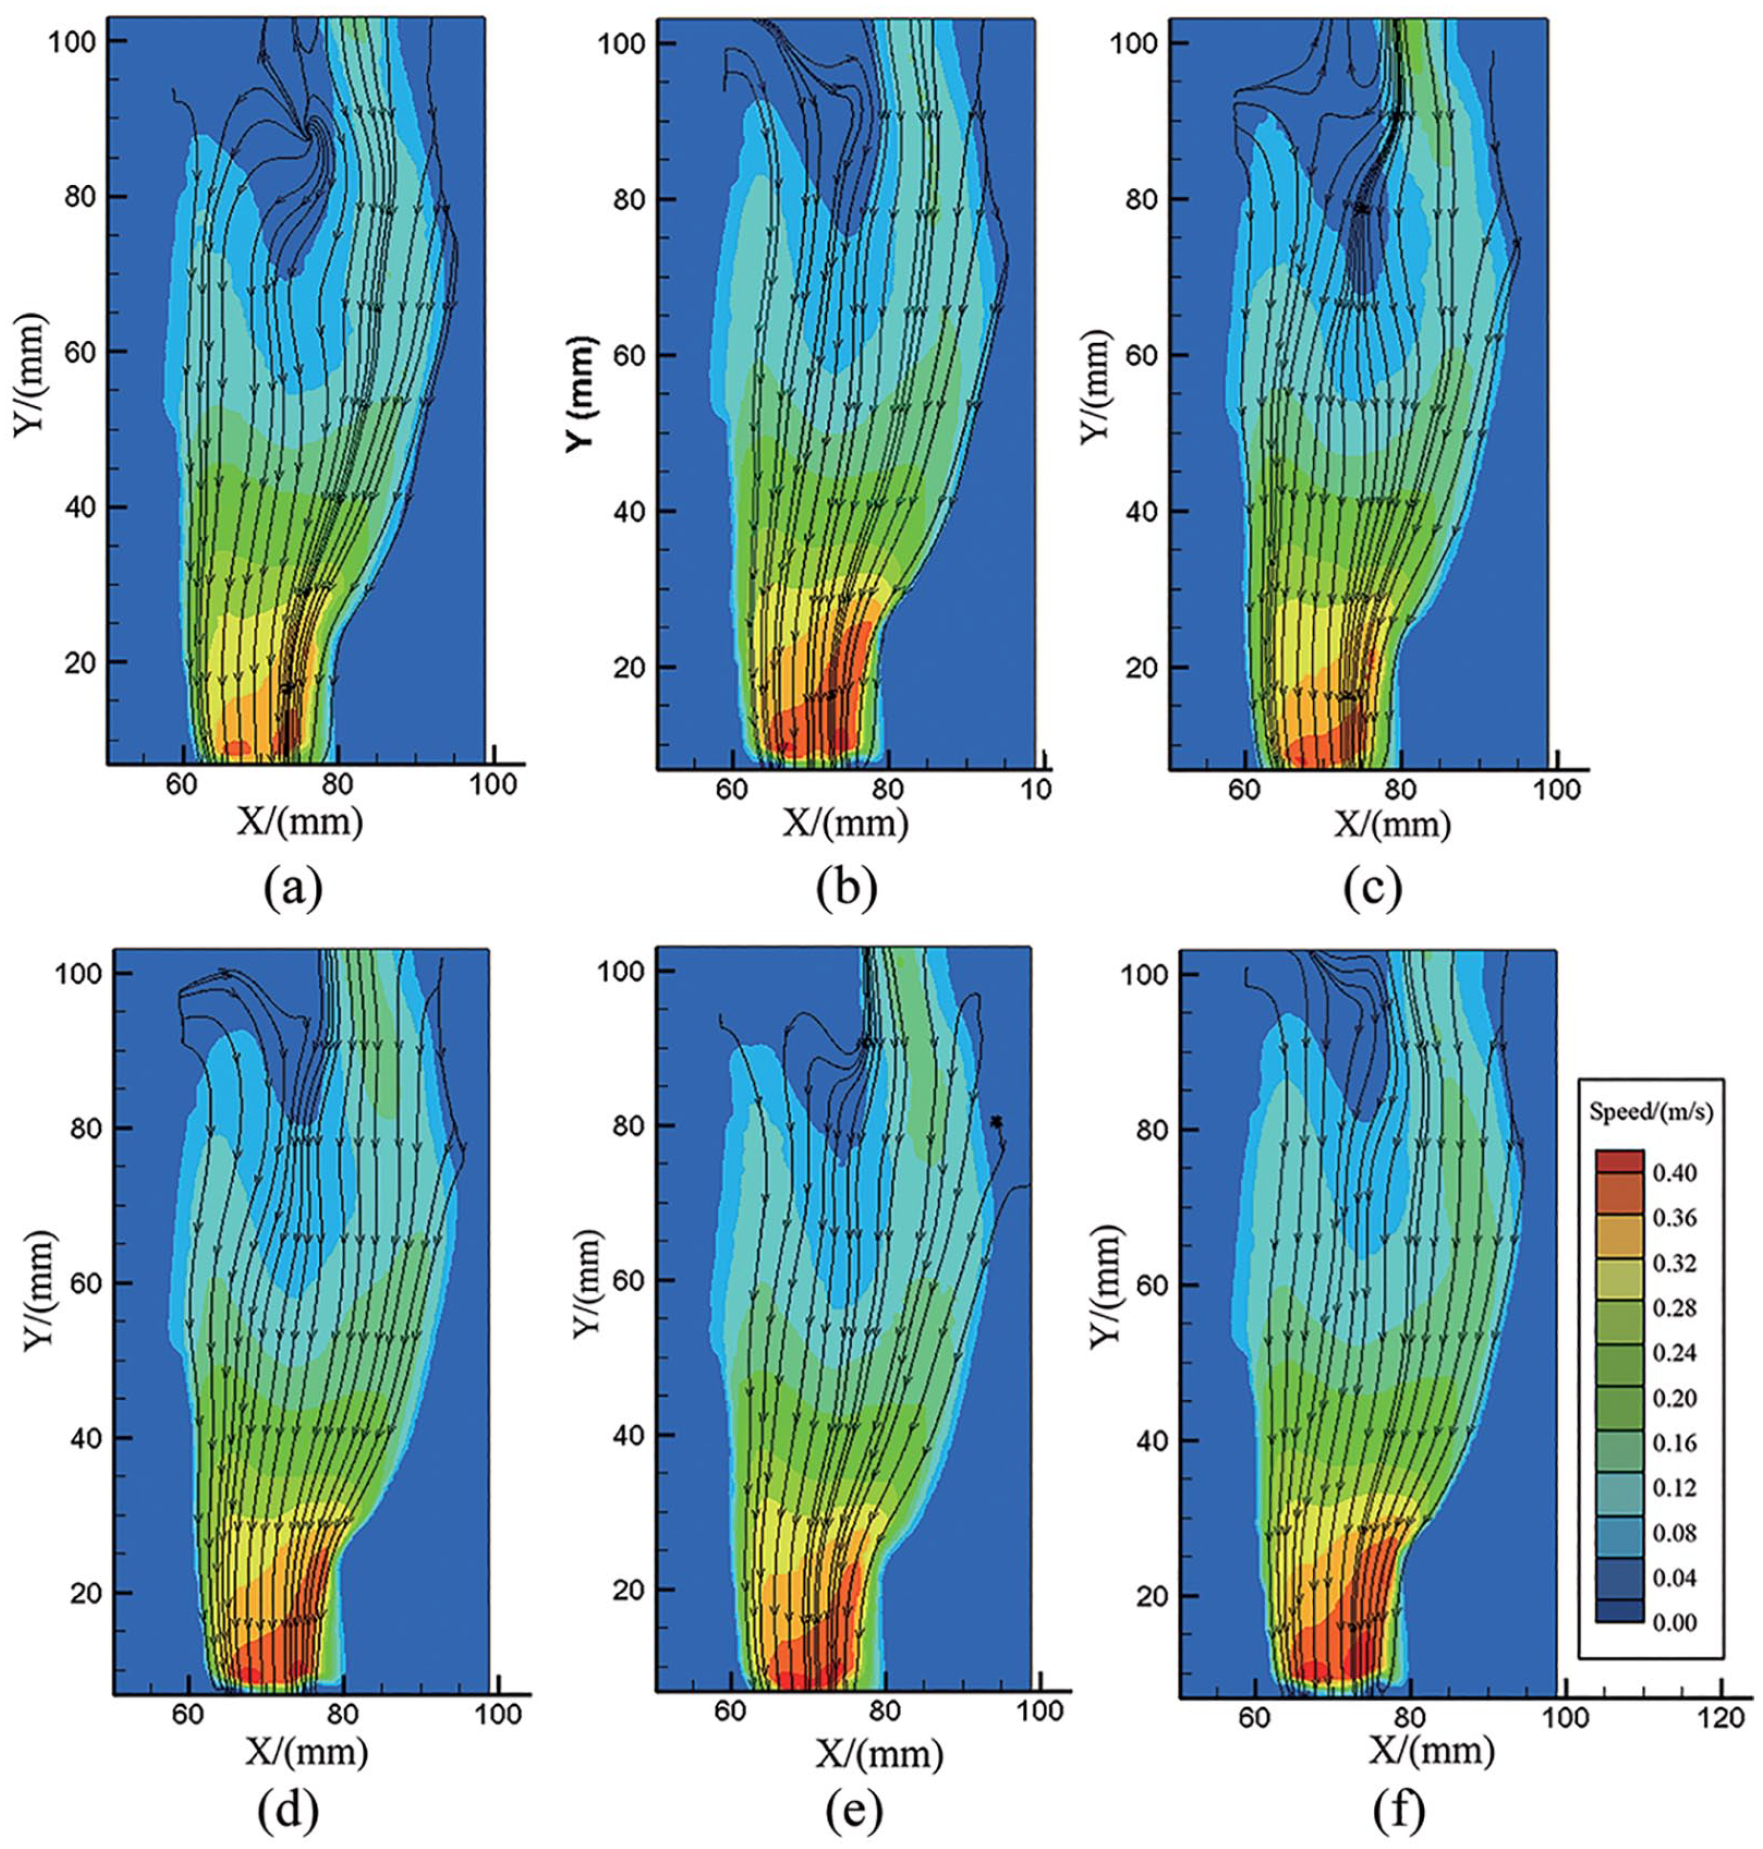
Streamlines inside the left ventricle under different conditions: (a) 10 mmHg of failed LV systolic period, (b) 10 mmHg of severely failed LV systolic period, (c) 10 mmHg of failed LV diastolic period, (d) 10 mmHg of severely failed LV diastolic period, (e) 120 mmHg of failed LV systolic period, and (f) 120 mmHg of severely failed LV systolic period.
Vorticity
The characteristics of the vorticity distribution in the tested cross-section in both LV failure and severe LV failure at a systolic intraventricular pressure of 10 and 120 mmHg and a diastolic intraventricular pressure of 10 mmHg are presented in Figure 5. The strong and maximum vorticity regions are located in the inner LV wall around the LV apex and blood pump inlet. The vorticity was lower than 50 s−1 inside the whole left ventricle. The vorticity distribution was similar when the intraventricular pressure changed. The vorticity strength near the aortic valve was higher in LV failure than in severe LV failure. This means that the flow near the aortic valve is unsteady in the case of less severe LV failure.
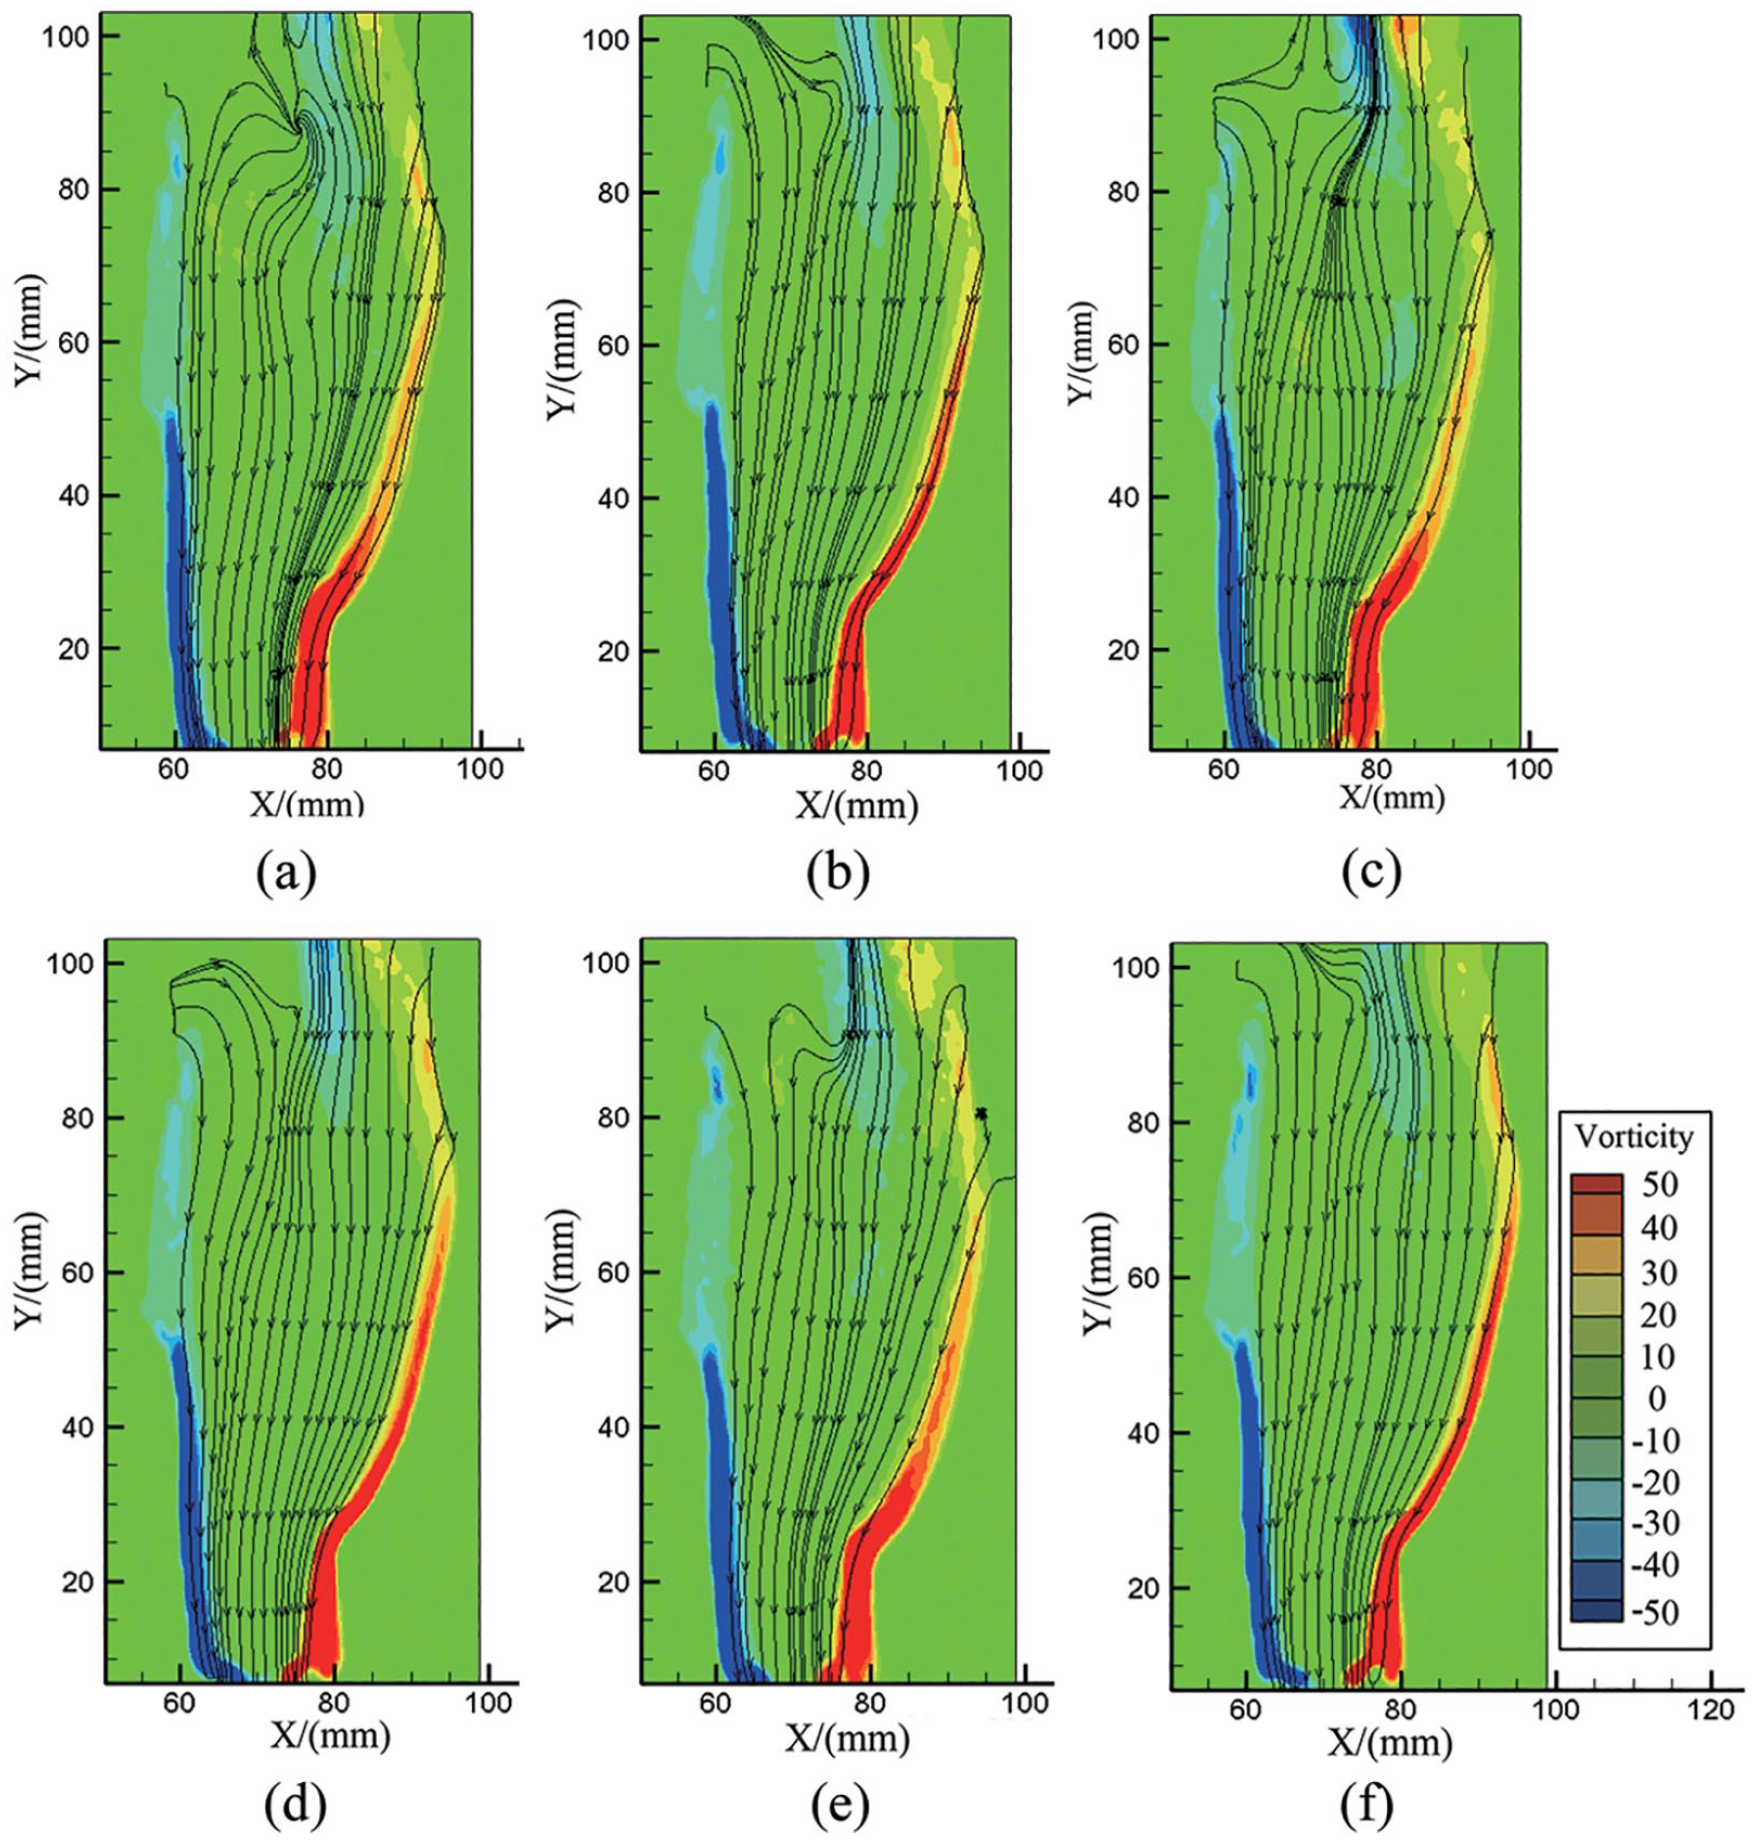
Vorticity vector inside the left ventricle under different conditions: (a) 10 mmHg of failed LV systolic period, (b) 10 mmHg of severely failed LV systolic period, (c) 10 mmHg of failed LV diastolic period, (d) 10 mmHg of severely failed LV diastolic period, (e) 120 mmHg of failed LV systolic period, and (f) 120 mmHg of severely failed LV systolic period.
Standard deviation of velocity
Figure 6 presents the blood flow velocity standard deviation distribution of the tested cross-section in both LV failure and severe LV failure at a systolic intraventricular pressure of 10 and 120 mmHg and a diastolic intraventricular pressure of 10 mmHg with the axial blood pump rotating at 9000 rpm. The standard deviation of the blood velocity inside the blood pump inlet and the connection joint was higher than that inside the left ventricle. The higher standard deviation of velocity near the blood pump inlet decreased with increasing LV failure degree. The standard deviation of velocity near the atrium increased from 0.08 to 0.12 when intraventricular pressure increased from 10 to 120 mmHg.
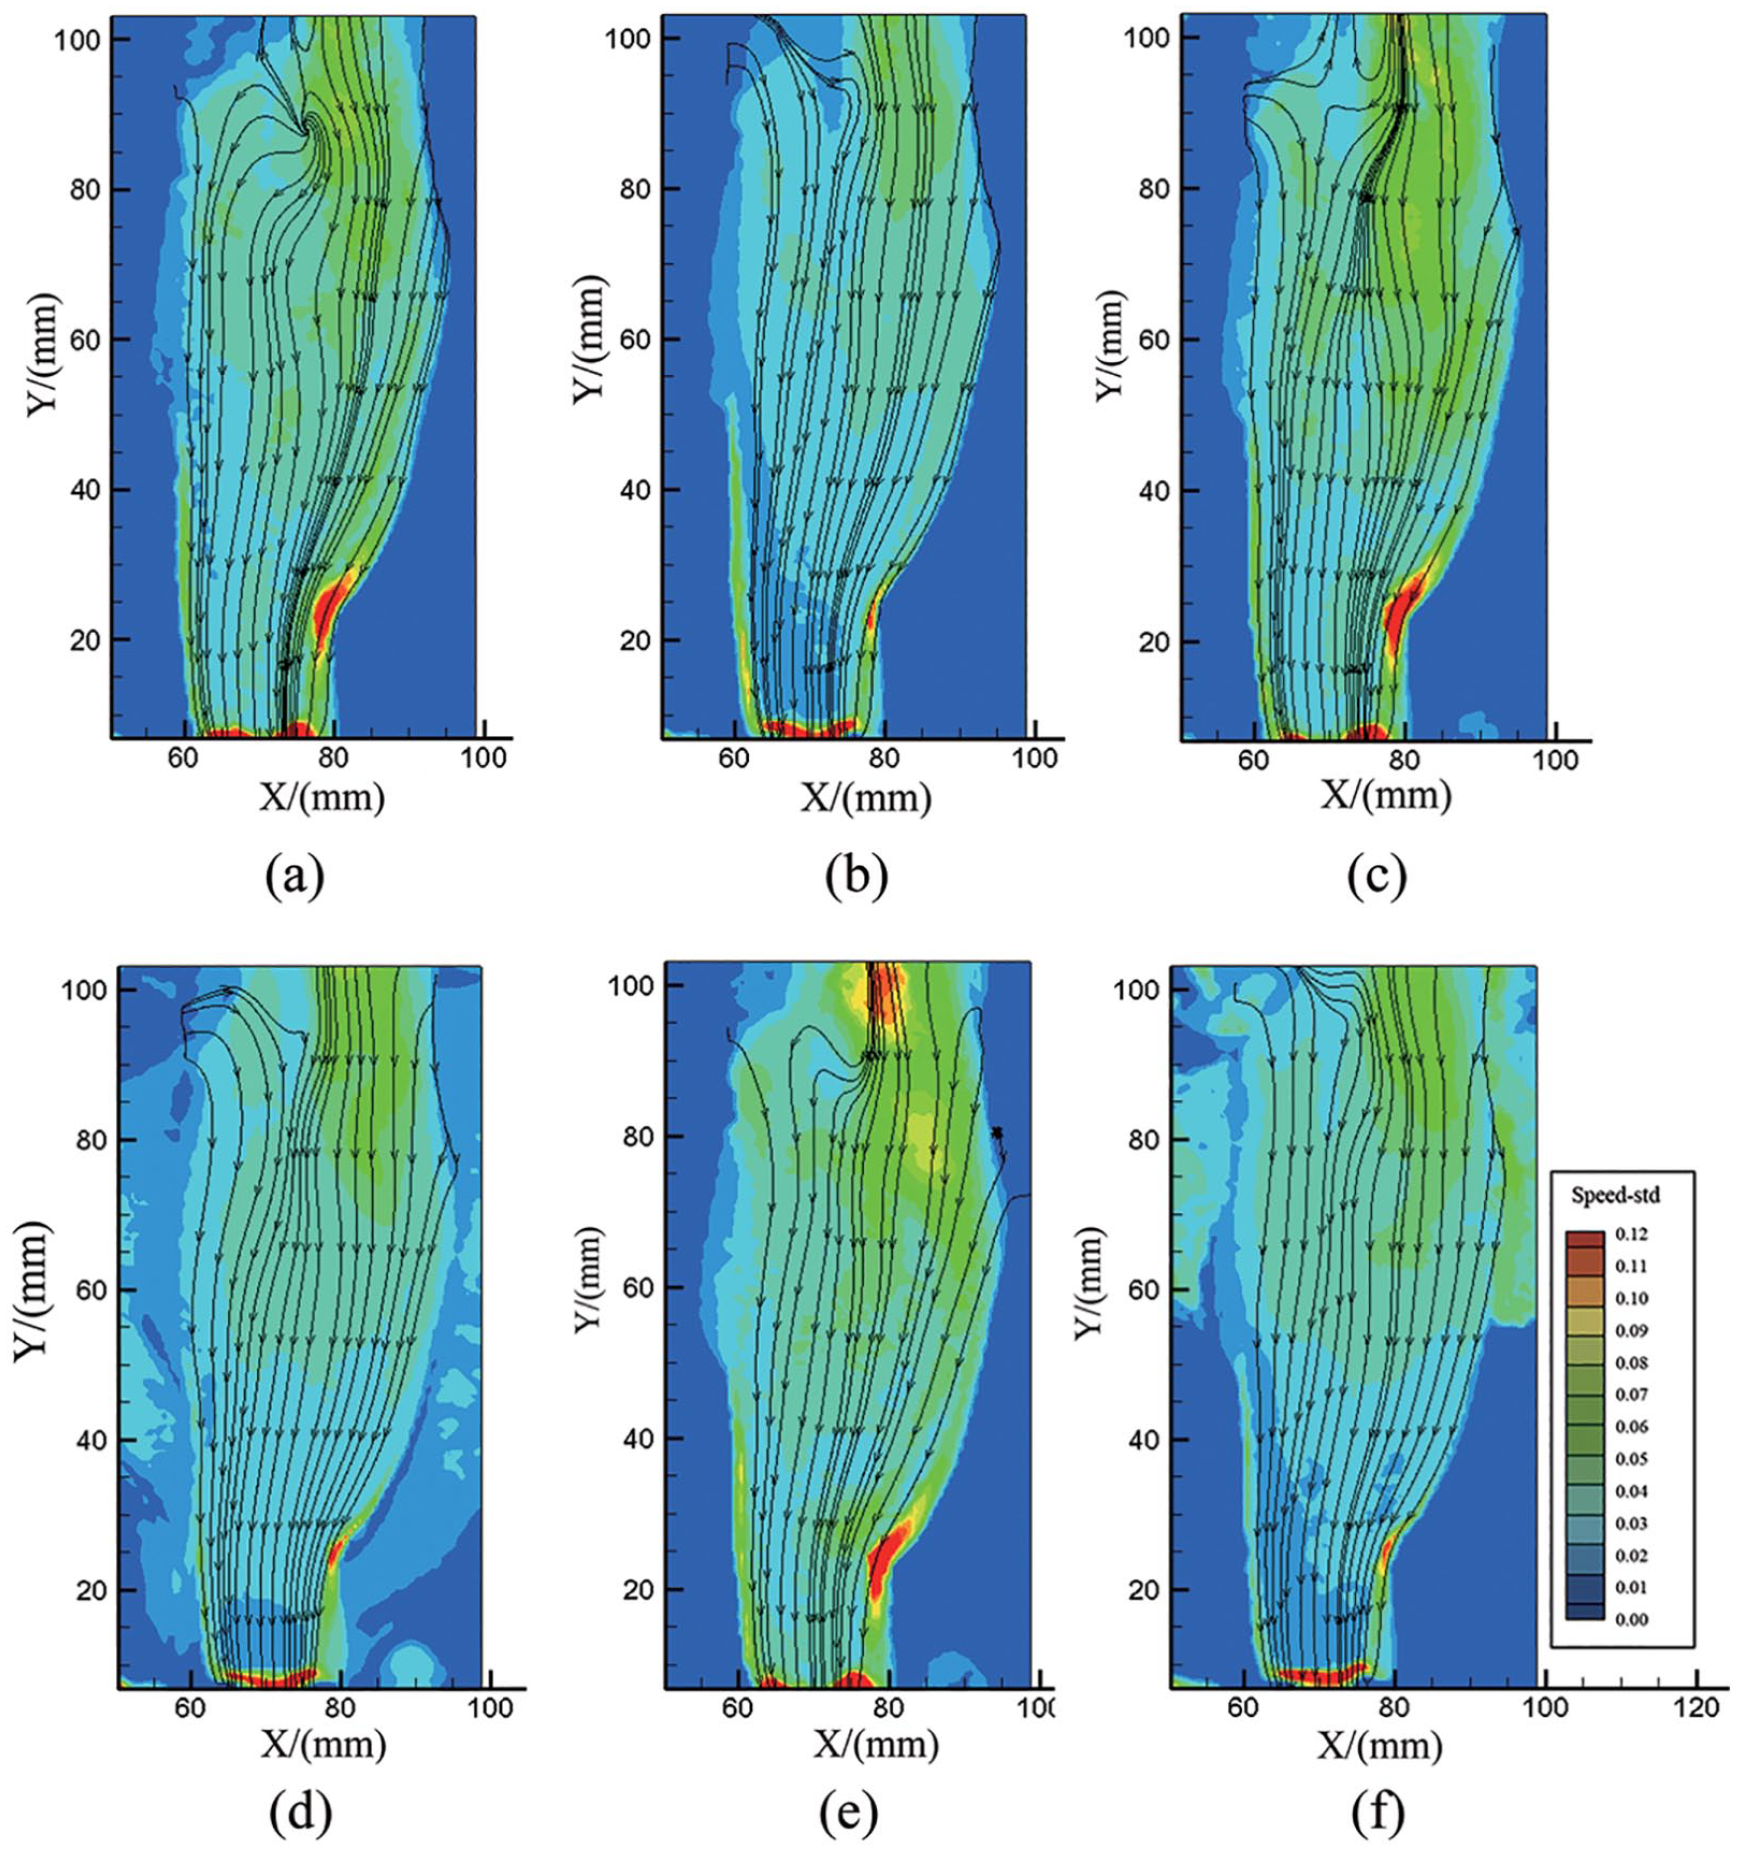
Standard deviation of velocity inside LV under different conditions: (a) 10 mmHg of failed LV systolic period, (b) 10 mmHg of severely failed LV systolic period, (c) 10 mmHg of failed LV diastolic period, (d) 10 mmHg of severely failed LV diastolic period, (e) 120 mmHg of failed LV systolic period, and (f) 120 mmHg of severely failed LV systolic period.
Discussion
The influence of a blood pump on the flow behavior inside a failing heart with different systolic and diastolic functions was visualized in vitro using a transparent silicone LV model based on reconstructed CT images from one heart failure patient. There was slower and even static flow in the central LV region near the mitral valve and aortic valve in both LV failure and severe LV failure throughout the cardiac cycle. There were no obvious differences throughout the cardiac cycle between LV failure and severe LV failure, except the velocity at the blood pump was higher in severe LV failure than in LV failure. At the same speed, the blood pump suctioned more blood when the LV failure was more severe. The blood flow near the atrium was more regular when the LV failure was more severe, which means that in this condition, the left ventricle loses its blood pumping function and acts more like a reservoir. May-Newman 7 reported the results of PIV using an MCL with a HeartMate II LVAD. Her results showed that the LVAD created an abnormal intraventricular flow field that decreased washout because it increased flow stasis and increased the risk of thrombus formation. Our results are similar and further suggest that the risk is not related to heart failure degree.
Hong et al. 20 reported that the LV vortex can facilitate blood mass entry into the left ventricle and prevent intraventricular blood stagnation. Our results show strong vorticity located near the inner LV wall around the LV apex in both LV failure and severe LV failure, with no difference, and this vorticity could effectively wash the inner wall of the left ventricle to reduce the risk of thrombus generation inside the left ventricle. Meanwhile, the strong vorticity located in the blood pump inlet in both LV failure and severe LV failure was similar and could disrupt the flow inside the LVAD, which would increase the blood damage inside the LVAD. There were no differences in the vorticity distribution between LV failure and severe LV failure even when the intraventricular pressure changed. The vorticity near the aortic valve in LV failure was stronger than that in severe LV failure. Previous research has indicated a large diastolic vortex near the aortic valve.21,22 The present study further shows that the vortex near the aortic valve was sensitive to LV failure degree but not to LV pressure. The standard deviation of the velocity distribution means the average of the deviations from the mean of each point’s velocity. It can be used to represent the flow separation inside the LV model. Higher blood velocity standard deviation was located at the blood pump inlet in both LV failure and severe LV failure and decreased with increasing LV failure degree throughout the whole cardiac cycle. Therefore, we infer that the potential for blood damage inside the blood pump inlet decreases with increasing LV failure degree because flow separation may cause blood damage. The standard deviation of velocity near the atrium increased with increasing intraventricular pressure but was not sensitive to LV failure degree. Therefore, we infer that the potential for blood damage inside the LV decreases with increasing LV pressure because flow separation may cause blood damage.
Although the intraventricular flow including near left atrium, aortic valve, and blood pump inlet was observed from the tested cross-section simultaneously by the 2D PIV system. It is necessary to observe flow distribution of another cross-section for the shape of LV model is not symmetrical. So flow field of another cross-section which is perpendicular to the maximum area cross-section was tested to verify the flow distribution of the maximum area cross-section can effectively demonstrate intraventricular flow. The flow distribution in severe LV failure at a systolic intraventricular pressure of 120 mmHg with the axial blood pump rotating at 9000 rpm are shown in Figure 7. The maximal blood velocity was 0.39 m/s. The flow velocity near an inner wall of the LV was higher, whereas the flow velocity in the central LV region was lower or even static. The blood flowed from the left atrium and aortic valve to the blood pump inlet. The highest blood flow velocity region was located at the axial blood pump inlet. The strong and maximum vorticity regions are located in the inner LV wall and lower than 50 s−1. In a word, the flow distribution in maximum area cross-section can effectively demonstrate intraventricular flow.
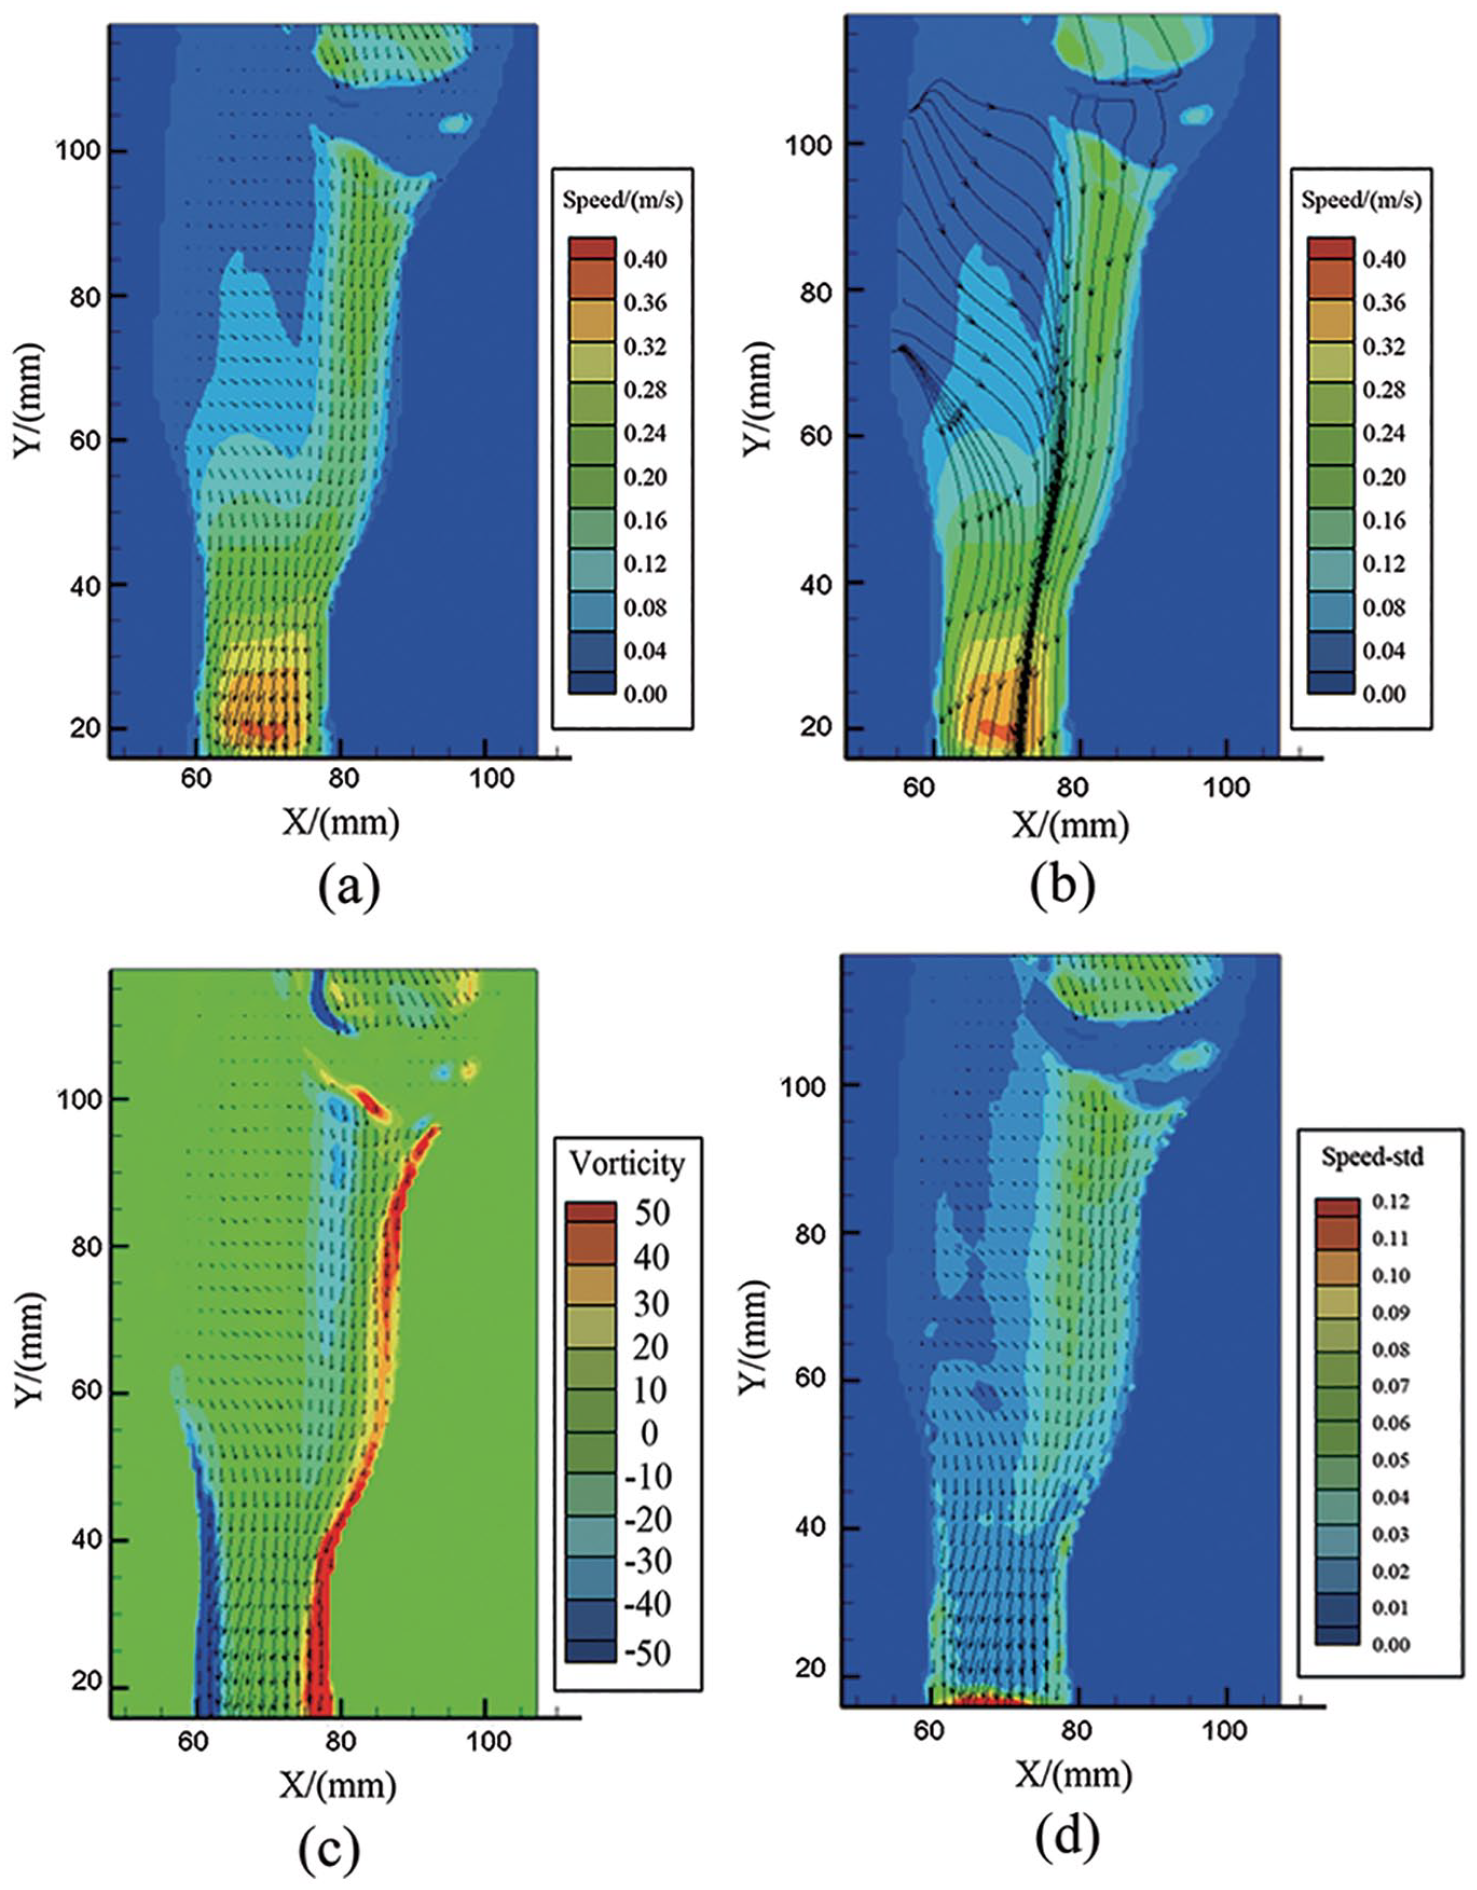
Flow distribution in severe LV failure at a systolic intraventricular pressure of 120 mmHg: (a) velocity vector, (b) streamlines, (c) vorticity, and (d) standard deviation of velocity.
This work does have limitations. The silicone LV model cannot include papillary muscles or chordae tendineae because these structures would block the line of the laser and view of the camera. The elasticity and diastolic LV geometry are different from those of the native heart. The silicone LV model is stiffer than native heart muscle, and the deformation of the LV model is much smaller than native heart. So the intraventricular flow pattern of LV end-systolic period is not as accurate as end-systole because the tested LV model is manufactured according to LV end-diastolic geometry and the deformation of tested LV model is not obvious. The mechanical valve prosthesis in this study cannot switch actively as a native aortic valve. So the valves cannot switch like native valves and result in intraventricular flow differing from native intraventricular flow. In a word, this in vitro test could not fully simulate the intraventricular flow in native heart failure. However, PIV within an MCL was used to observe intraventricular flow fields and yielded useful results. Further in vitro experiments more closely simulating in vivo conditions will be conducted.
Conclusions
We conducted in vitro PIV experiments to investigate the effects of an LVAD on blood flow in LV failure and severe LV failure throughout the cardiac cycle. Lower blood flow velocity was found in the central LV region near the mitral valve and aortic valve and was not related to LV failure degree or LV pressure; thus, the risk of thrombosis may be caused by the lower blood velocity but not related to the degree of heart failure. In the case of more severe LV failure, the LV acts more like a reservoir, and the blood pump suctions blood from the LV more easily. The strong vorticity located near the inner LV wall, which was not sensitive to LV failure degree, could “washout” the inner LV wall and may reduce the thrombotic potential near the LV inner wall. The strong vorticity located in the blood pump inlet was not sensitive to LV failure degree or intraventricular pressure, so the blood damage potential inside the LVAD caused by disturbed inhomogeneous inlet flow was irrelevant to LV failure degree or intraventricular pressure. The vorticity near the aortic valve was sensitive to LV failure degree but not to LV pressure. The elevated blood velocity standard deviation near the blood pump inlet decreased with increasing LV failure degree may contribute to decrease the risk of blood damage caused by flow separation inside severely failed LV. The risk of blood damage inside the LV with higher intraventricular pressure may lower than that of LV with lower intraventricular pressure because the standard deviation of velocity near the atrium decreased with increasing intraventricular pressure may improve corresponding flow seperation.
Footnotes
Declaration of conflicting interests
The author(s) declared no potential conflicts of interest with respect to the research, authorship, and/or publication of this article.
Funding
The author(s) disclosed receipt of the following financial support for the research, authorship, and/or publication of this article: This research was supported by the Beijing Science and Technology Plan (Z191100007619053) and the Program for Guangdong Introducing Innovative and Enterpreneurial Teams (2019ZT08Y481).