
Abstract
More than 50% of heart failure (HF) patients require diuretic therapy after left ventricular assist device (LVAD). Although few data related to diuretic response (DR) exist in stage D patients, tubular sodium reabsorption may be clinically prognostic independent of estimated glomerular filtration rate (eGFR) and proteinuria within this cohort. We aimed to characterize DR serially before and after LVAD implantation in a stage D population. We conducted a prospective, observational cohort study of HF patients receiving diuretics with plans to undergo LVAD implantation. We measured urine sodium (UNa) and creatinine (UCr) at three points after diuretic therapy: pre-LVAD, post-LVAD prior to discharge, and as an outpatient. Prior to LVAD, patients (N = 19) had an average eGFR of 54.0 ± 18.0 mL/min/1.73 m2, spot UNa of 74.8 ± 28.0 mmol/L, and fractional excretion of sodium (FENa) of 3.1 ± 2.7%. Pre-LVAD, eGFR did not correlate with spot UNa nor FENa (p > 0.05 for both). LVAD implantation did not improve DR post-LVAD (mean change FENa per 40 mg IV furosemide 0.5 ± 1.0%; p = 0.84), and 90% of patients required loop diuretics at 90 days post-surgery. Improved hemodynamics following LVAD may not improve DR or tubular function; larger studies are needed to confirm our results and assess the utility of DR to predict post-LVAD outcomes.
Keywords
Introduction
Risk stratification for patients undergoing left ventricular assist device (LVAD) implantation is needed to improve prognostication.1–5 Despite improvement in cardiac output, more than one-half of patients still struggle with congestion and require chronic loop diuretic therapy.6,7 Kidney function, measured by estimated glomerular filtration rate (eGFR), after LVAD may change substantially and can potentially influence resulting morbidity and mortality. 8 The eGFR measures filtration function of the kidney but not the kidney’s tubular sodium handling. Diuretic response (DR), also called diuretic efficiency, is a validated measure of tubular sodium handling expressed as the DR relative to the diuretic dose.9–13 DR has significant interpatient variability at a given eGFR and is independently correlated with adverse heart failure (HF) outcomes, including increased mortality.14 –18 Furthermore, DR appears unrelated to cardiac output and may not change after LVAD. 9 Evaluation of DR could improve risk prognostication post-LVAD, predict those requiring diuretic therapy post-LVAD to manage congestion, and provide insight into changes in tubular sodium handling post-LVAD. In this study, we aimed to serially describe DR in a Stage D HF population, both before and after LVAD implantation.
Materials and methods
Study design
This trial was a prospective, observational cohort trial conducted at Vanderbilt University Medical Center from February 2020 to July 2021. Adult patients were eligible for enrollment if they had stage D HF on scheduled loop diuretic therapy and had a planned LVAD implantation. Exclusion criteria included the need for renal replacement therapy or right ventricular mechanical support prior to LVAD; ongoing evaluation for liver or kidney transplantation; pregnancy or breastfeeding; or current incarceration. The study was approved by the Vanderbilt Institutional Review Board, and all data were collected and managed using REDCap electronic data capture tool.19,20
Patients were administered oral torsemide 100 mg, or alternative loop diuretic regimen if deemed necessary per the primary provider, prior to each urine sample. Urine samples were collected 2 ± 0.5 h following loop diuretic administration to assess spot urine sodium and spot urine creatinine. The urine samples were collected at three serial time points throughout the study: (1) during the index hospitalization prior to LVAD implantation; (2) post-LVAD prior to hospital discharge during index hospitalization when clinically stable on oral loop diuretics; and (3) post-LVAD at the earliest available outpatient visit. Patients were evaluated prospectively throughout study enrollment to determine appropriate urine collection timing per study criteria. All patients received a 2000 mL fluid restriction and 2000 mg/day sodium diet.
Study endpoints
We assessed unadjusted DR metrics of spot urine sodium concentration, fractional excretion of sodium (FENa), and calculated 6-h cumulative sodium output using the Natriuretic Response Prediction Equation (NPRE). FENa was calculated as: (Naurine/Naserum) x (Crserum/Crurine) x 100%.NRPE was calculated as: Na output (mmol) = eGFR ×
Statistical analysis
Baseline characteristics were calculated for all patients, and outcomes were analyzed for all patients actively enrolled at the time of the sample. Descriptive statistics for categorical variables were reported as counts with percentages, and continuous variables were reported as means with standard deviations (SD). Spearman’s correlation coefficients and corresponding p-values were reported to describe the relationship between continuous variables. For pairwise comparison of variables at different timepoints in the same patient, we used a one-sample Wilcox signed-rank test to test the differences of measurements between two timepoints. All statistical analyses were conducted using R software version 4.13 and IBM SPSS 28. Scatter plots were created using R package ggplot2.26–28
Results
A total of 19 patients were enrolled in the trial (Figure 1). Seven patients were not included at urine sample 2 due to deferred/declined LVAD (n = 3) or death (n = 4) and two additional patients at urine sample 3 were lost to follow-up. Baseline characteristics before LVAD implantation are summarized in Table 1. The mean age was 53 ± 13 years, and the majority of patients received a HeartMate 3™ LVAD device (79%). The baseline cardiac index (CI) by Fick prior to LVAD was 1.8 ± 0.5 L/min/m2 with an eGFR of 54 ± 18 mL/min/1.73 m2. Other baseline hemodynamic parameters included: central venous pressure (CVP) 10.6 ± 4.9 mmHg, pulmonary capillary wedge pressure (PCWP) 25.1 ± 9.4 mmHg, and mean arterial pressure (MAP) 80.4 ± 11.6 mmHg (Table 2). The cohort required an average daily oral furosemide dose of 352 ± 322 mg prior to enrollment.
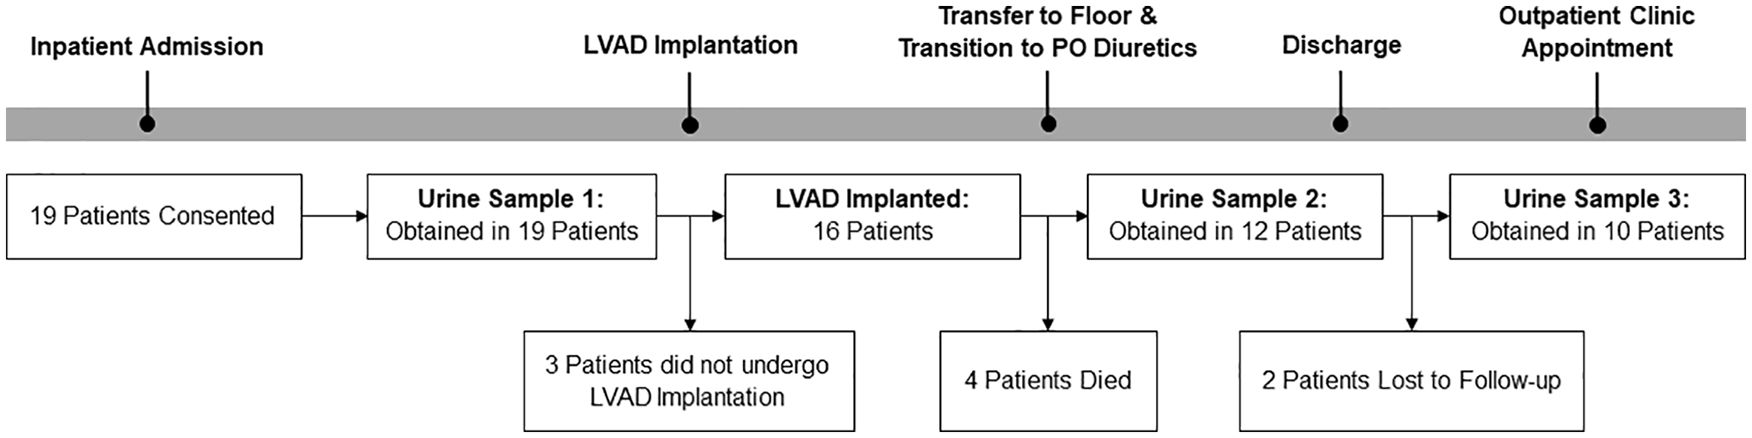
Study timeline.
Baseline demographics.
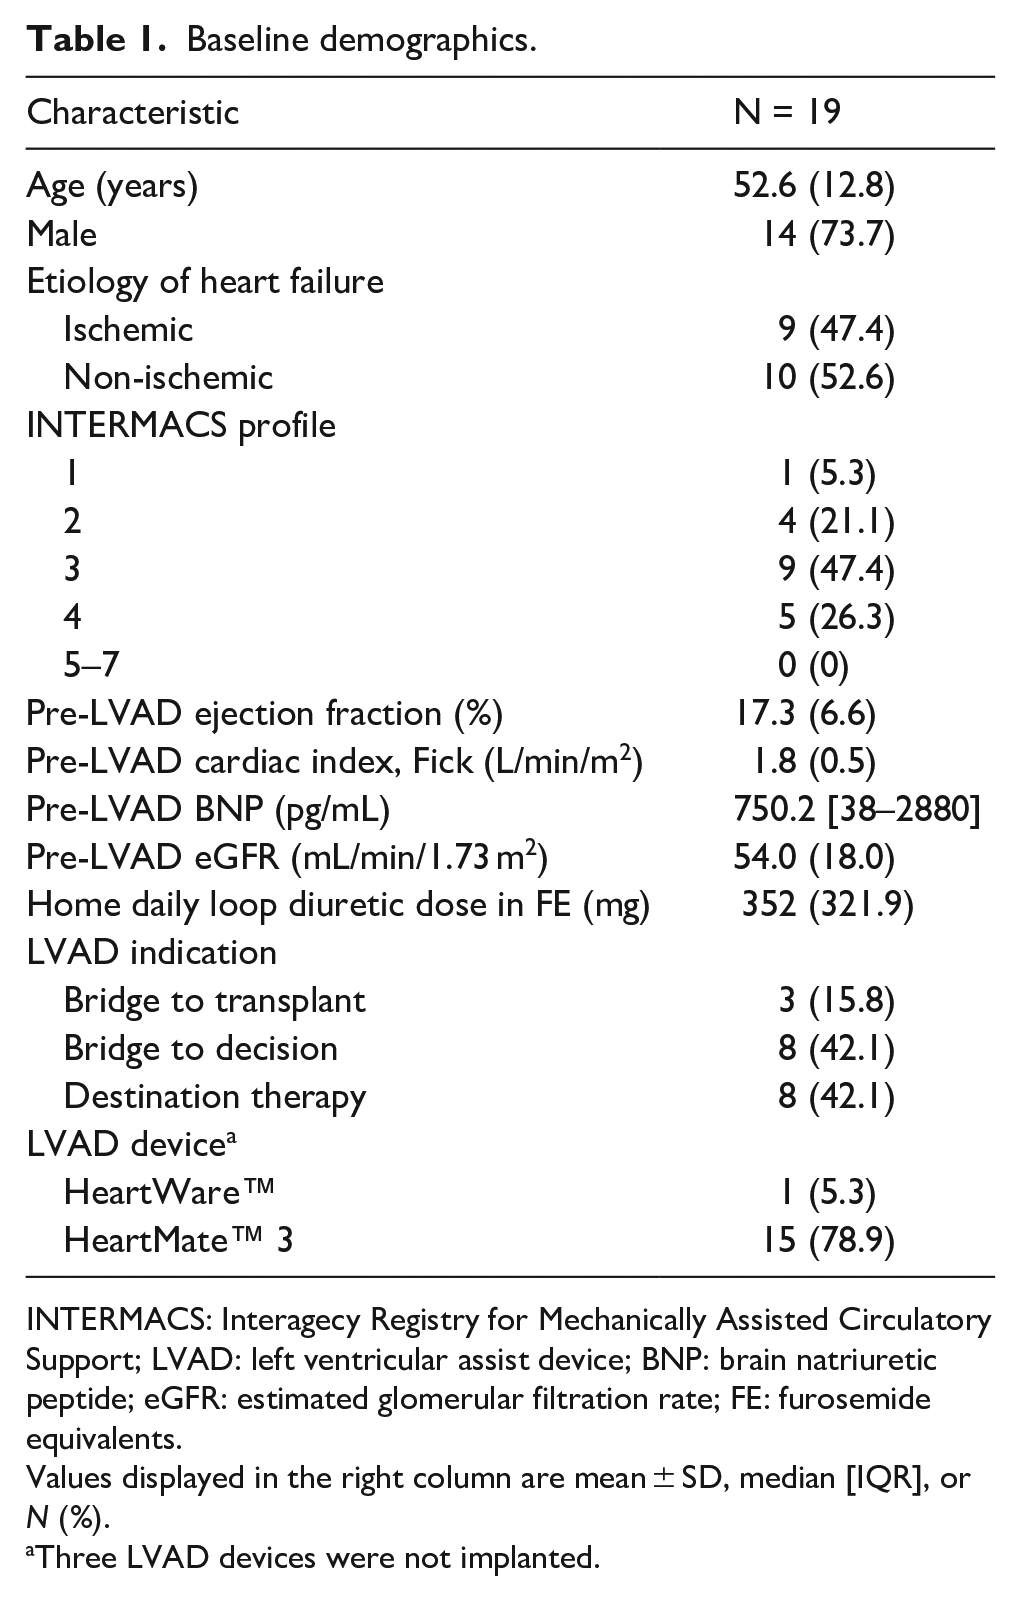
INTERMACS: Interagecy Registry for Mechanically Assisted Circulatory Support; LVAD: left ventricular assist device; BNP: brain natriuretic peptide; eGFR: estimated glomerular filtration rate; FE: furosemide equivalents.
Values displayed in the right column are mean ± SD, median [IQR], or N (%).
Three LVAD devices were not implanted.
Serial hemodynamic and eGFR measurements.
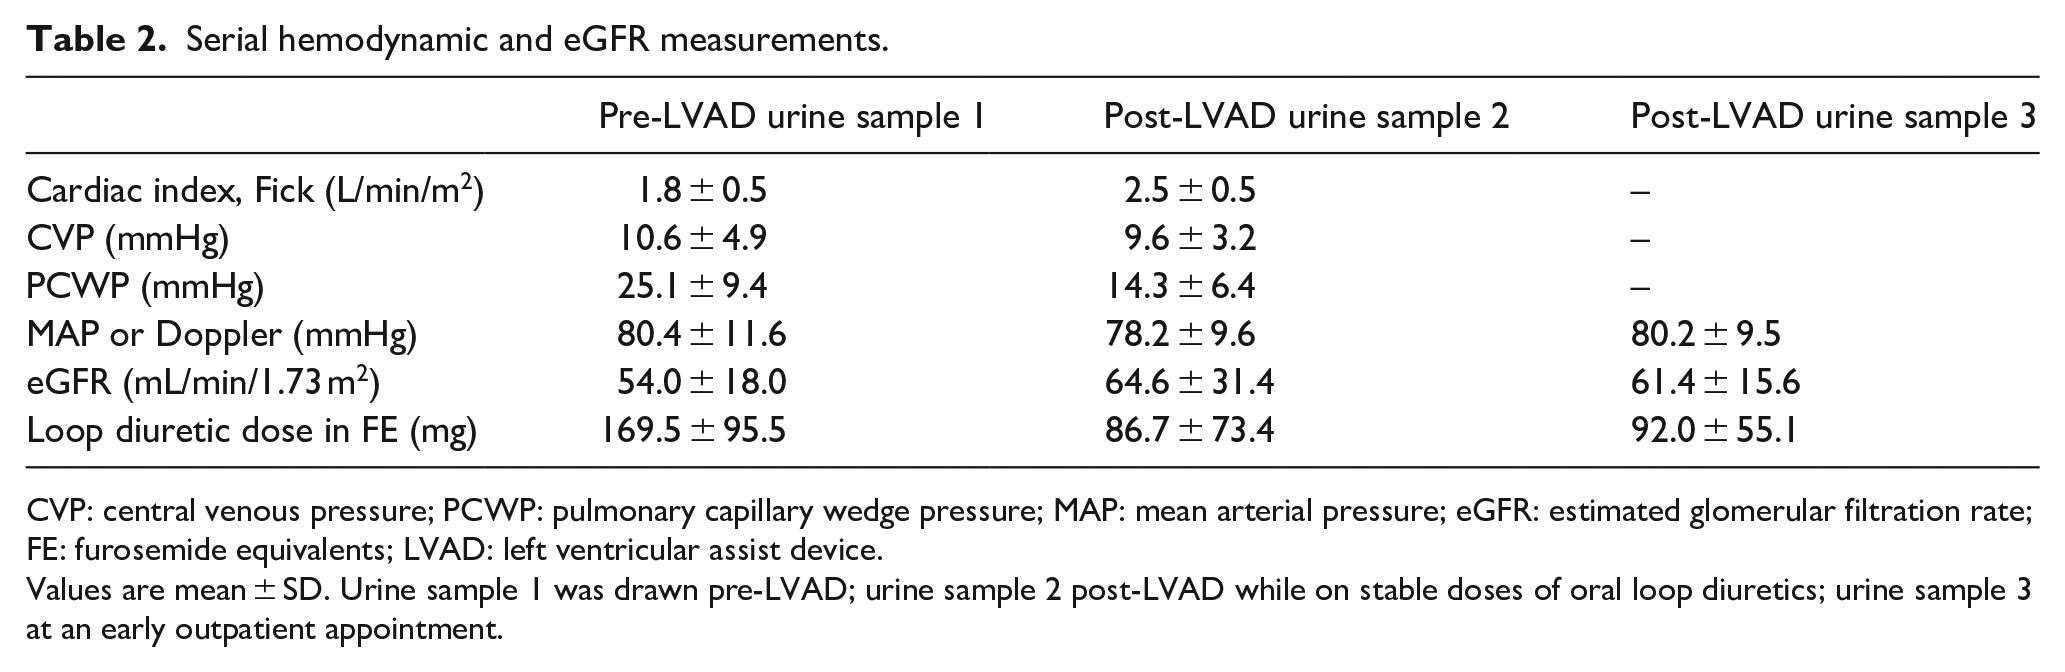
CVP: central venous pressure; PCWP: pulmonary capillary wedge pressure; MAP: mean arterial pressure; eGFR: estimated glomerular filtration rate; FE: furosemide equivalents; LVAD: left ventricular assist device.
Values are mean ± SD. Urine sample 1 was drawn pre-LVAD; urine sample 2 post-LVAD while on stable doses of oral loop diuretics; urine sample 3 at an early outpatient appointment.
Diuretic response
Spot urine samples were collected in patients at three time points shown in Figure 1 and used to calculate FENa and 6-h sodium output. Measures of DR and changes in DR pre- and post-LVAD are reported in Table 3. Baseline CI demonstrated a negative correlation trend with urine sodium concentration (r = −0.34; p = 0.149), FENa (r = −0.42, p = 0.074), and cumulative urine sodium excretion (r = −0.37, p = 0.120), none of which reached statistical significance. eGFR also did not correlate with DR metrics at baseline (Figure 2). Neither baseline CVP nor PCWP correlated with any measure of DR (Supplemental Table 1). Post-LVAD CI and eGFR improved by 0.7 ± 0.6 L/min/m2 and 5.7 ± 32.5 mL/min/1.73 m2, respectively (Table 2). Despite improvements in CI and eGFR, LVAD implantation did not improve DR relative to baseline with a mean change FENa per 40 mg IV furosemide of −0.5 ± 1.0% at timepoint 2 (p = 0.84) and −0.3 ± 1.1% at timepoint 3 (p = 0.45). Across metrics of DR, most patients demonstrated a lack of change in DR post-LVAD even after adjusting for diuretic dose changes (Figure 3).
Serial measurements of diuretic response.
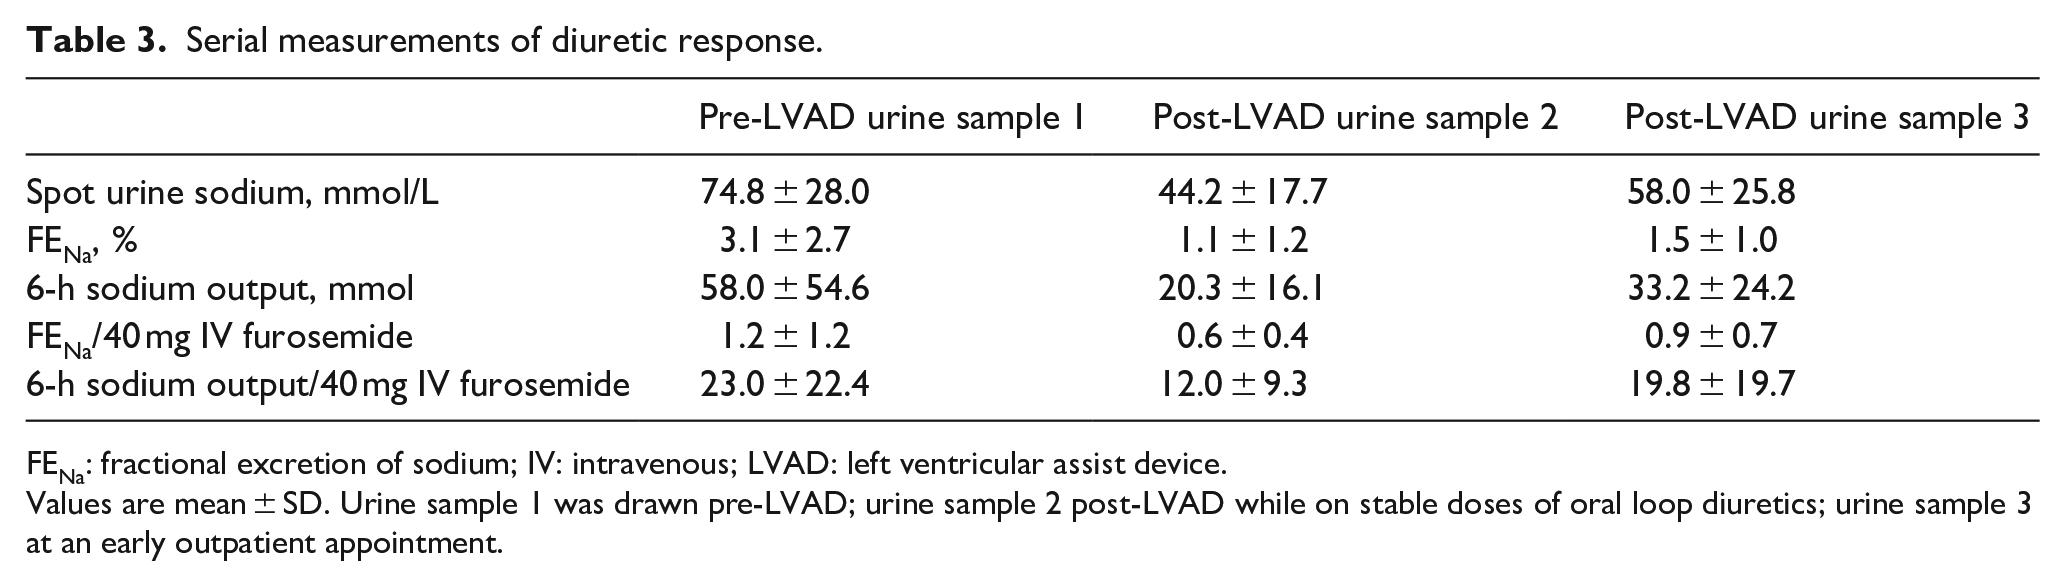
FENa: fractional excretion of sodium; IV: intravenous; LVAD: left ventricular assist device.
Values are mean ± SD. Urine sample 1 was drawn pre-LVAD; urine sample 2 post-LVAD while on stable doses of oral loop diuretics; urine sample 3 at an early outpatient appointment.
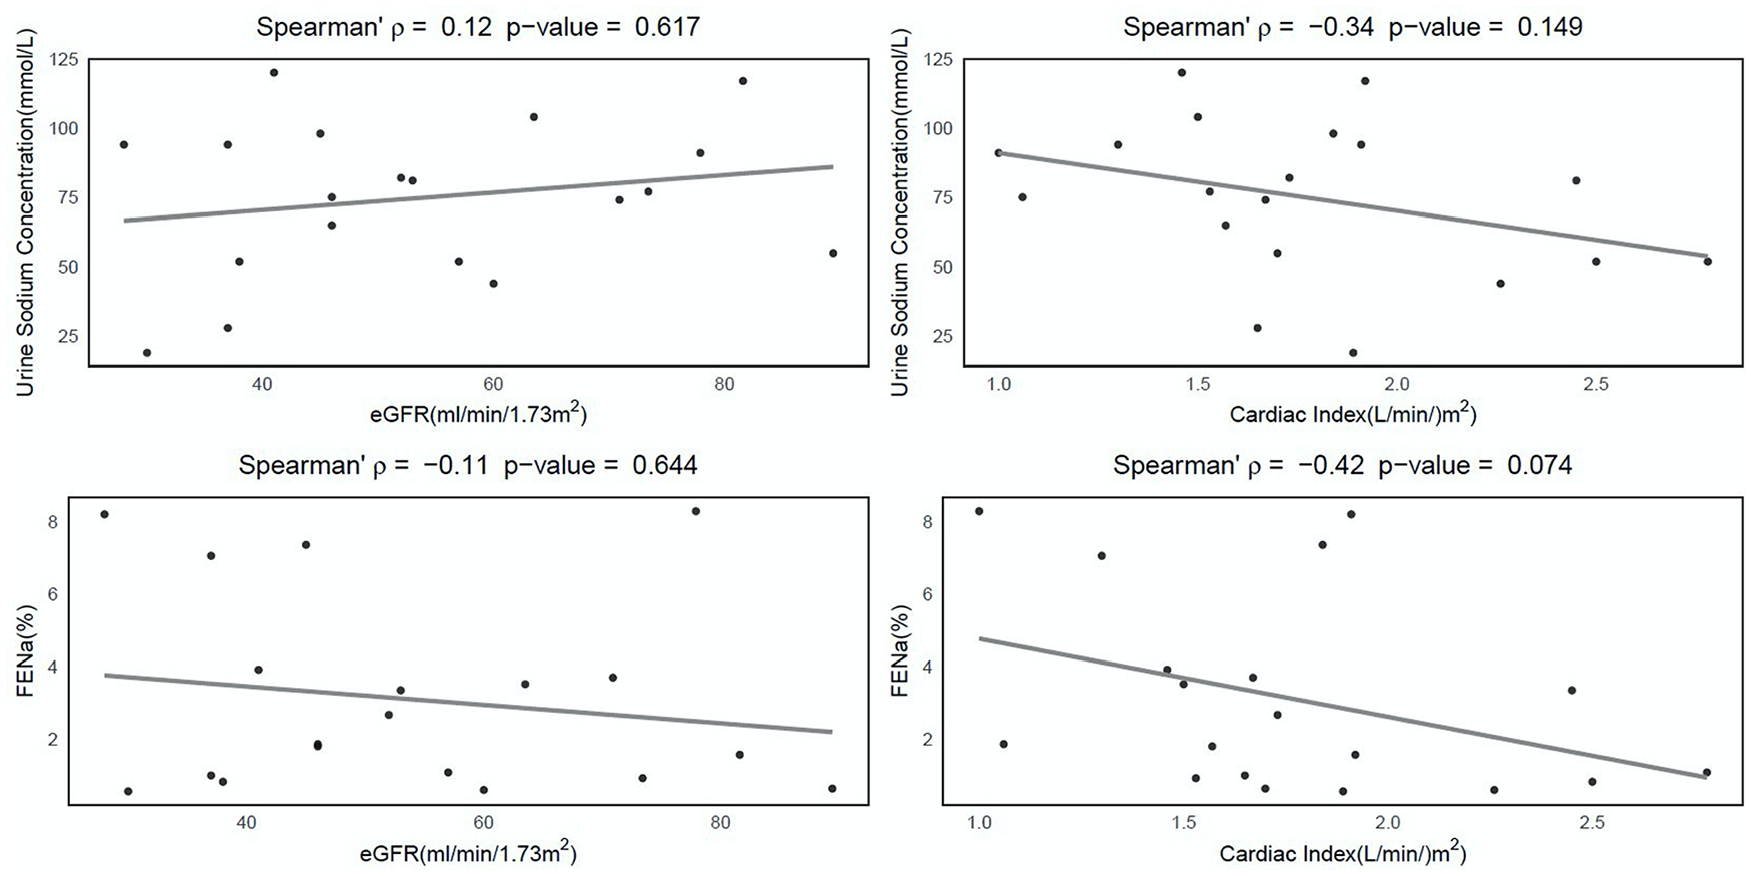
Correlation of eGFR and CI with diuretic response.
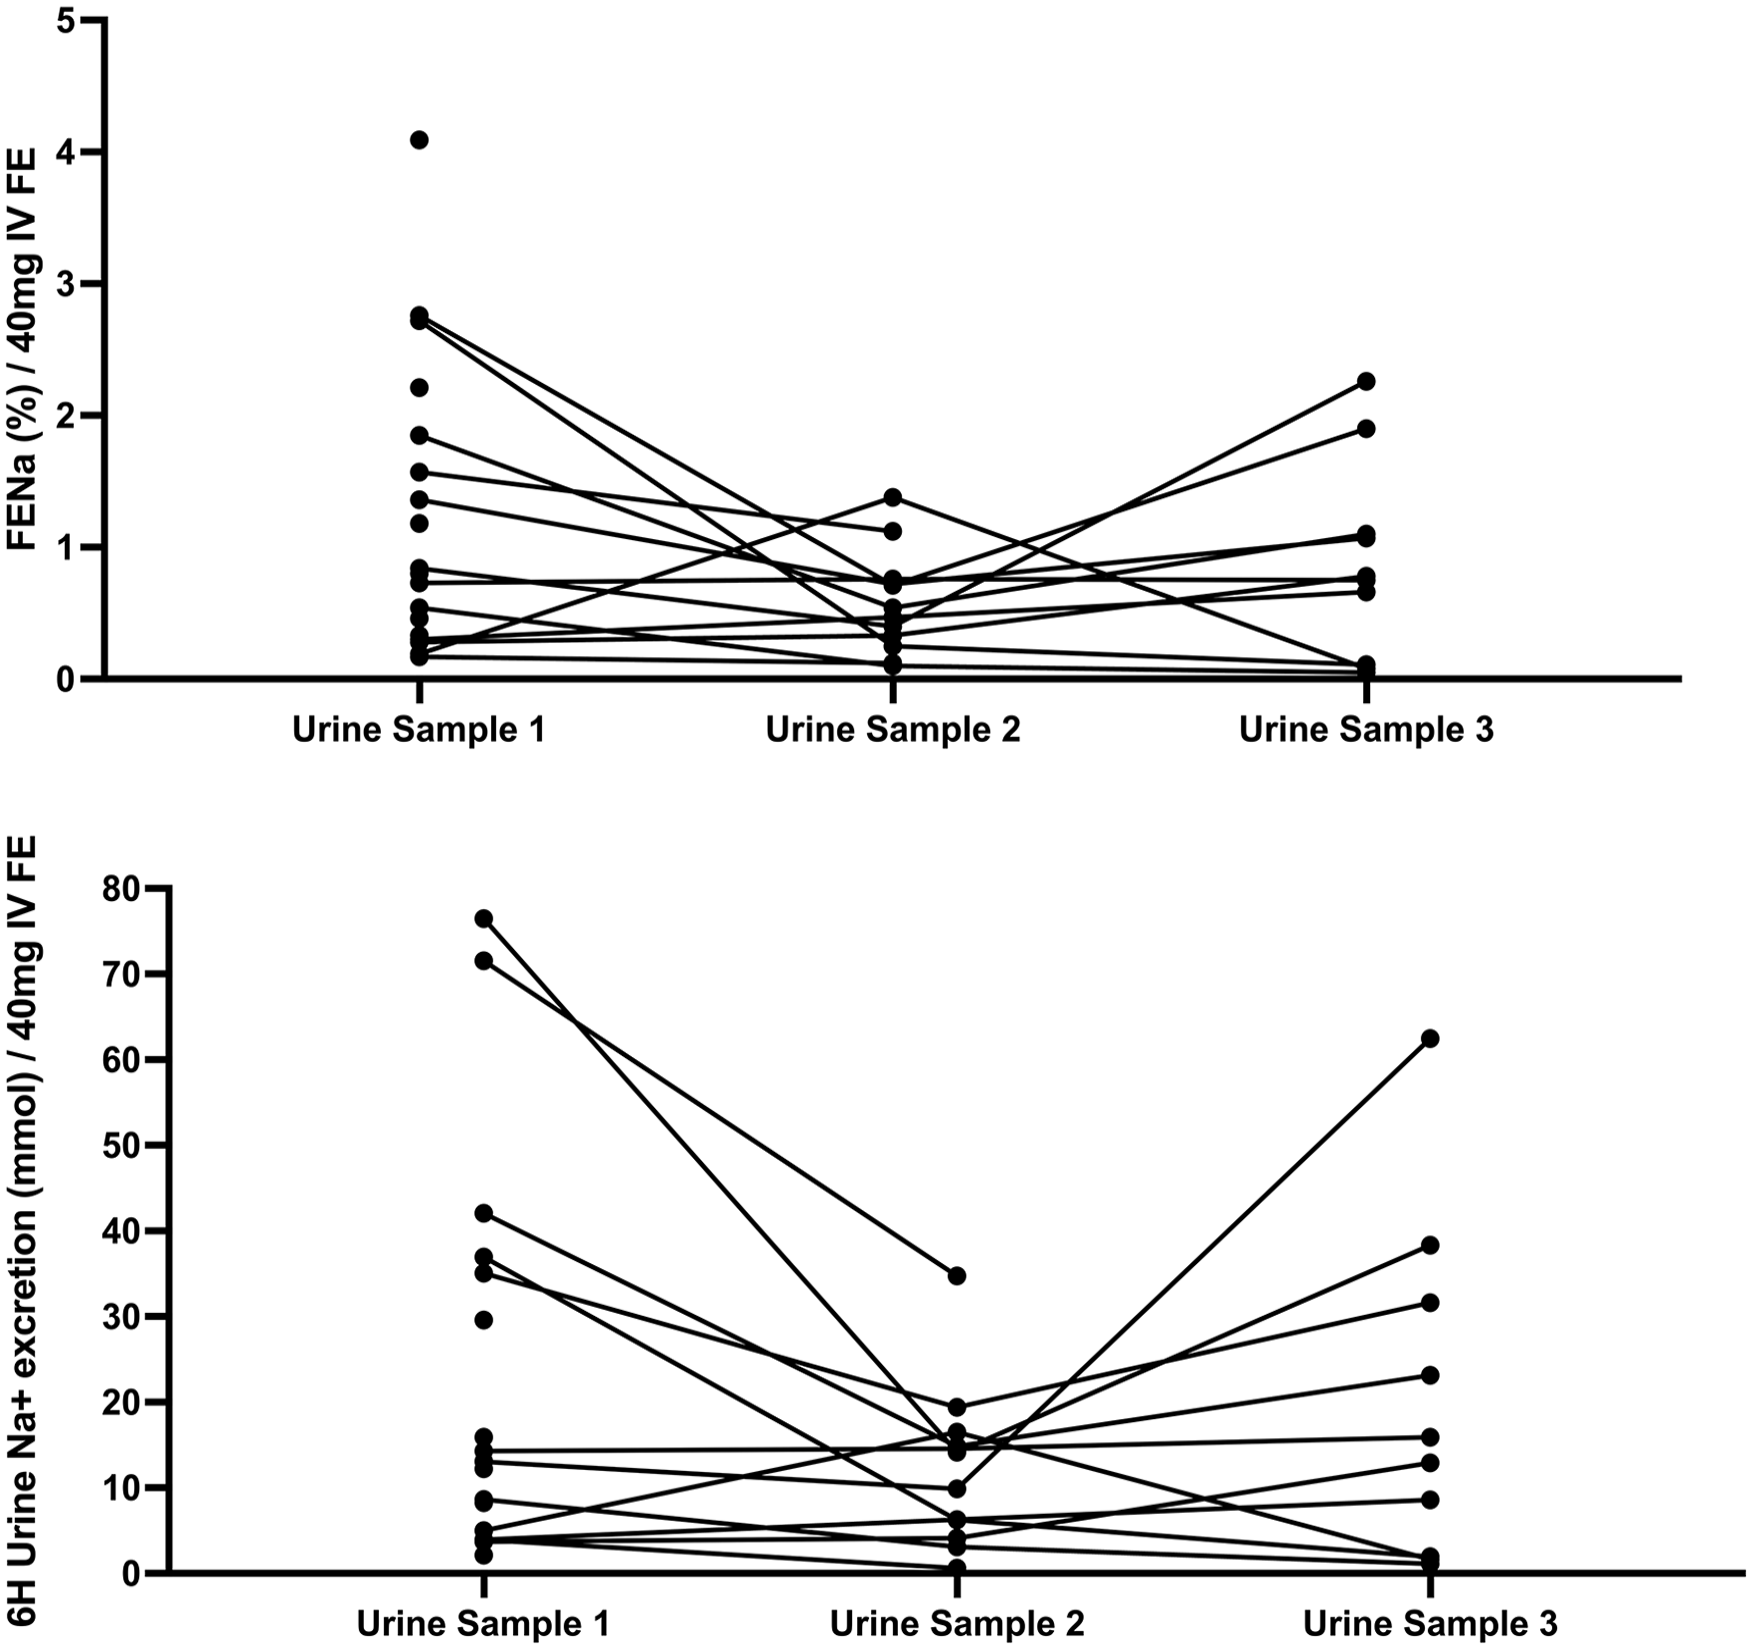
Change in diuretic response.
Post-LVAD outpatient outcomes
Outpatient study visit 3 occurred an average of 50.5 ± 30.9 days after LVAD implant. At this time, 90% of patients required scheduled maintenance loop diuretics and 1 (10%) patient required as needed dosing. Most patients were on torsemide (60%) with 30% on bumetanide and 10% on furosemide. The average home oral loop diuretic dose at study visit 3 was 92 ± 55 mg of FE. 50% of patients had right ventricular failure defined as requirement of right ventricular assist device support at any point post-implant and/or the requirement of continuous parenteral inotrope or inhaled selective pulmonary vasodilator >14 days post-implant. None of the cohort required readmission for HF, one patient necessitated hemodialysis while inpatient, and four patients had died by 90 days.
Discussion
To our knowledge, this is the first prospective study evaluating serial change in DR in stage D HF after LVAD implantation. The main findings of this study are: (1) DR, and therefore tubular sodium handling, did not correlate with eGFR at baseline and (2) DR did not improve in most patients following LVAD despite improvements in eGFR and cardiac index. DR remained low despite implantation of an LVAD with 90% of patients requiring scheduled loop diuretic therapy to prevent hypervolemia approximately 2 months after LVAD implantation.
Changes in renal function are common post-LVAD implant with some patients having stabilization or improvement in eGFR. Proteinuria and eGFR are metrics of renal filtration utilized for risk prognostication in LVAD recipients.1 –3,7,9 Yet, these measures have poor correlation with DR as they are markers of renal filtration and fail to provide insight into tubular sodium handling, the predominant mechanism for sodium regulation and congestion in HF.3,4,16,23,29,30 At the same eGFR, a patient requiring twice as much daily diuretic to maintain euvolemia has different cardio-renal pathology and/or ingrained dietary habits that likely increase the risk of adverse post-LVAD outcomes relative to a patient with lower chronic diuretic requirements. Incorporation of DR into LVAD risk scores may provide additional risk discrimination for potential LVAD recipients. 29 These data can help to preemptively inform the degree to which patients may struggle with hypervolemia post-LVAD implantation. As DR metrics are inexpensive, validated, and easily obtained, the barriers to widespread implementation into clinical practice are predicted to be minimal.
Our study findings mimicked those of stage C HF where DR did not correlate with eGFR or hemodynamic measurements including CI, providing independent prognostic value.9–13 Even at the severe hemodynamic derangements found in Stage D HF, tubular sodium handling and DR remained largely unaffected by baseline or post-LVAD improved cardiac filling pressures and cardiac output. These findings can help explain why more than half of patients require diuretic therapy to prevent congestion following LVAD implementation. Most HF hospitalizations result from symptoms of congestion, not low cardiac output. 31 Therefore, utilizing DR pre-LVAD as an assessment of the patient’s likelihood of continued issues with hypervolemia post-LVAD may inform patient decisions as to how LVAD implantation will improve quality of life.
Future research is needed to investigate the clinical and prognostic importance of DR in a population with Stage D HF receiving LVAD implantation. Additionally, research on the changes in DR following LVAD implantation will enhance our understanding of the mechanisms of diuretic resistance in this population and the changes in cardio-renal interactions once cardiac output is improved. Knowledge of pre-existing DR and the driving mechanisms can inform clinicians on the diuretic regimens to employ in the pre-LVAD and post-LVAD care period to overcome resistance and potentially improve patient outcomes.
Limitations
Several limitations warrant discussion. The small cohort size, observational design, and intermediate follow-up time period limit definitive conclusions. Given the small number of patients with a high drop-out rate, the lack of correlations observed could be due to a type II error. These data should be regarded as hypothesis-generating. Second, this is a single center study evaluating diuretic resistance and DR may vary within the Stage D HF populations at other medical centers, thereby limiting generalizability. Lastly, there is no universal definition of DR or diuretic resistance. However, we used multiple, validated metrics of DR focusing on measured and calculated sodium excretion rather than urine output, as urine output measurements are significantly limited by measurement issues in usual care.
Conclusion
Our findings suggest that DR did not change commensurate with improvements in both eGFR and CI post-LVAD implantation. Larger studies are needed to understand the cardiorenal interactions in patients with Stage D HF undergoing LVAD implantation and DR’s prognostic value in post-LVAD outcomes.
Supplemental Material
sj-docx-1-jao-10.1177_03913988231193446 – Supplemental material for Serial evaluation of loop diuretic efficiency following left ventricular assist device implantation
Supplemental material, sj-docx-1-jao-10.1177_03913988231193446 for Serial evaluation of loop diuretic efficiency following left ventricular assist device implantation by Sarah M Beargie, Lindsey Tolbert, Robert K Tunney, Zachary L Cox, Wu Gong and Sandip Zalawadiya in The International Journal of Artificial Organs
Footnotes
Declaration of conflicting interests
The authors declared no potential conflicts of interest with respect to the research, authorship, and/or publication of this article.
Funding
The authors disclosed receipt of the following financial support for the research, authorship, and/or publication of this article: The project described was supported by the Vanderbilt Institute for Clinical and Translational Research (VICTR) and CTSA award No. UL1 TR002243 from the National Center for Advancing Translational Sciences. Its contents are solely the responsibility of the authors and do not necessarily represent official views of the National Center for Advancing Translational Sciences or the National Institutes of Health.
Supplemental material
Supplemental material for this article is available online.
References
Supplementary Material
Please find the following supplemental material available below.
For Open Access articles published under a Creative Commons License, all supplemental material carries the same license as the article it is associated with.
For non-Open Access articles published, all supplemental material carries a non-exclusive license, and permission requests for re-use of supplemental material or any part of supplemental material shall be sent directly to the copyright owner as specified in the copyright notice associated with the article.