
Abstract
Biventricular assist devices (BiVAD) are capable of providing mechanical support to the left and right ventricles to improve blood supply in heart failure, thereby maintaining patients’ lives and improving their quality of life. But there is evidence that the incidence of aortic valve incompetence and other valvular pathologies is related to BiVAD support. Such as constant speed (CS) control may cause the valve to close completely and lose its normal valve function. The valve function is related to the percentage of valve opening which is approximately 30% of the cardiac cycle. This study developed a power-based control model for BiVAD that could regulate motors’ speed by altering the power to satisfy objectives of keeping valve function and restoring physiologic perfusion. The effects of the power-based controller on the hemodynamics and valve function were investigated by simulating BiVAD under constant power and variable power controls. Different heart failure and activity levels were also mimicked under variable power control to obtain the BiVAD’s critical parameters and the assist ratios. The results show that the power-based control can help the BiVAD to assist a patient with heart failure, and the power settings should comprehensively consider objectives of valve function and physiologic perfusion.
Keywords
Introduction
Heart failure has become one of the leading causes of morbidity and mortality for all human beings. It is estimated that there are around 23 million heart failure patients globally, and the prevalence continues to increase. 1 Mechanical circulatory support is increasingly being used as bridge-to-transplant and destination therapy in patients with advanced heart failure. Technological improvements have increased patient survival and quality of life. 2 In the last decade, VAD systems have substantially progress in size, durability, reliability and noise emission. 3 In clinical practice, VAD often operate at a constant speed, this control method possesses simplicity, reliability, stability, and durability, but it reduces pulsatility which may lead to various complications.4,5 Moreover, this control mode cannot adapt to a patient’s complex and variable physiological states. Therefore, various physiological control systems have been developed to match physiological perfusion requirements. 6
Physiological control systems for VAD should be designed to respond to changes in hemodynamics across a variety of clinical scenarios, patients and clinical demands,7,8 including perfusion needs, preservation of cardiac pulsatility and contractility, and maintenance of valve function. The control strategy of VAD for achieving multiple-objectives should coordinate pump flow and other requirements at different levels and achieve balance.9,10 And most physiological control systems use sensors to measure hemodynamic parameters for feedback to the controller. However, there are no commercially available implantable sensors, which are stable over time, and the use of these sensors may increase the risk of postoperative complications, such as thrombosis, or require extensive regulatory inquisition. 11 Fu and Xu 12 proposed a sensorless fuzzy logic control system that uses motor speed and current as inputs to the system without making invasive measurements. However, the assumption that pump flow is proportional to heart rate ignores the influence of cardiac contractile and peripheral circulation on the required flow. Wang et al. 13 applied a sensorless suction prevention and physiologic control algorithm for axial and centrifugal pumps that required only the inherent parameters (pump speed and power) of the left ventricular assist.
Although VAD have proven successful for end-stage heart failure patients, as patients experience longer periods of support, the complications related to prolonged VAD use become evident. 14 It is estimated that approximately 50% of patients with pulsatile VADs develop aortic valve insufficiency or stenosis. 15 Patients with continuous flow devices have also shown an increased incidence of aortic valve insufficiency that worsens over time after the VAD implant. 16 VADs are designed to allow bypass of the aortic valve at full support, during which the device captures the entire cardiac output and the aortic valve becomes static with little or no blood flow passing through the valve. 17 The exploration of the hemodynamics of valves is beneficial for an in-depth study of the occurrence of valvular diseases caused by VAD’s application and for a more comprehensive evaluation of the control performance of VAD. Most of the above studies are based on the application of LVAD for left heart failure.
Currently, the options for biventricular support are limited the total artificial heart (TAH) or BiVAD, which uses bulky extracorporeal or implantable displacement pumps. 18 The key difference between BiVAD and TAH lies in whether to preserve or replace the natural heart. The LVAD and RVAD can also be referred as a form of BiVAD The development of implantable pumps as mechanical circulatory support (MCS) introduced new therapies for advanced heart failure. Broadly speaking, these devices fall into the categories of temporary and durable. They are used as bridge to transplant and bridge to recovery, and durable devices are also used as permanent devices-destination therapy-remaining implanted in the patient until death. 19 The necessity of durable BiVAD support is generally low and the indications included: myocarditis, cardiomyopathy and pump thrombosis, this will further worsen the patient’s condition. For biventricular heart failure, the use of BiVAD remains a reliable treatment option. 20 Currently, BiVAD have advantages such as small size, increased durability, low thrombosis rates, and strong heat dissipation.21–22 It enhances the blood supply to sustain the patient’s life, thereby improving hemodynamic conditions and enhancing the quality of life for the patient. 23 But BiVAD exhibit lower preload sensitivity and higher after-load sensitivity compared to the natural heart. This makes them prone to causing imbalance in blood flow leading to pulmonary congestion and ventricular suction events. And lack the sensors and biological control mechanisms (i.e., Frank-Starling and baroreceptor responses) to adjust systemic and pulmonary cardiac outputs to match the cardiac demand and to balance the systemic and pulmonic flows.24,25 Many control strategies for BiVAD to prevent suction, restore physiologic perfusion, and maintain left–right flow balance have been proposed and investigated using computer simulation. For sensorless control, Wang et al. proposed a novel sensorless control algorithm for the rotary BiVAD was developed that only requires the measurement of intrinsic pump parameters. 26 A novel multi-objective ANN-based predictive control scheme hybridized with a standard preload based Frank-Starling-like controller has been developed for the application to a BiVAD system. The proposed control scheme was intended to address the issues of pulmonary congestion and ventricular suction, while preserving adequate pump flow to meet the cardiac demand. However, the implementation of MONPC-FSL control relies on the implantation of pressure and flow sensors, and if the sensors fail, the system reliability will be reduced. 27 However, patients with BiVAD have also shown an increased incidence of aortic and pulmonary valve insufficiency that worsens over time. Therefore, it is of great significance to prevent the development of valve diseases and improve BiVAD control strategies.
This article proposed a power-based control model for the BiVAD to evaluate the impact on the numerical hemodynamic. In the power-based controller, only inherent parameter (pump power) of the BiVAD was required. Based on the previous research findings of the research group, a simulation model of the cardiovascular system coupled with BiVAD was established to investigate the impact of the power-based controller on the hemodynamic and valve function. This controller’s performance is based on simulation, and experimental validation is pending.
Methodology
The right heart system and pulmonary circulation network and the occurrence of valvular disorders caused by BiVAD are often ignored when studying the interaction of BiVAD with the cardiovascular system. As a result, it is impossible to know the effect of BiVAD on right-sided cardiac function and pulmonary circulation, and there is a large gap between such simulations and applications.
Therefore, the model basis of this paper is the cardiovascular system that includes the left and right heart and the body and pulmonary circulations. Then couple the rotary centrifugal blood pump model with the cardiovascular system. Two centrifugal blood pumps independently combined as BiVAD and parallel connected to an in silico simulated cardiovascular system. In this study, the pump power model is used to reflect the interactions and effects of the BiVAD with the cardiovascular system, and on the basis of the pump power control, this study will also investigate the critical parameters of the BiVAD when the arterial valves are permanently closed, as well as the relationship between the critical parameters and the patient’s cardiac failure and activity level.
A power controller for a biventricular assist system
The model of the cardiovascular system coupled with BiVAD
An equivalent circuit for the biventricular circulatory system was established based on the similarity between hemodynamics and electricity. The system includes systemic circulation, pulmonary circulation, left ventricle, left atrium, right ventricle, and right atrium. The pressure-volume relationship and the time-varying ventricular elasticity model proposed by Suga. are used to describe the heart’s cyclic systolic and diastolic processes. 28
Two centrifugal blood pumps independently developed by the research group were combined as a BiVAD and parallel connected to an in silico simulated cardiovascular system and parallel connected to an in silico simulated cardiovascular system. 29 The inlet end of the blood pump is connected to the apex of the left ventricle, and the other end is connected to the aorta. The model of the cardiovascular system coupled with BiVAD was developed in MATLAB (MathWorks, Natick, MA, USA, R2022a). The equivalent circuit of BiVAD coupled with the biventricular circulatory system is shown in Figure 1(a). Model parameters and system state variables are refered to the reference. 30
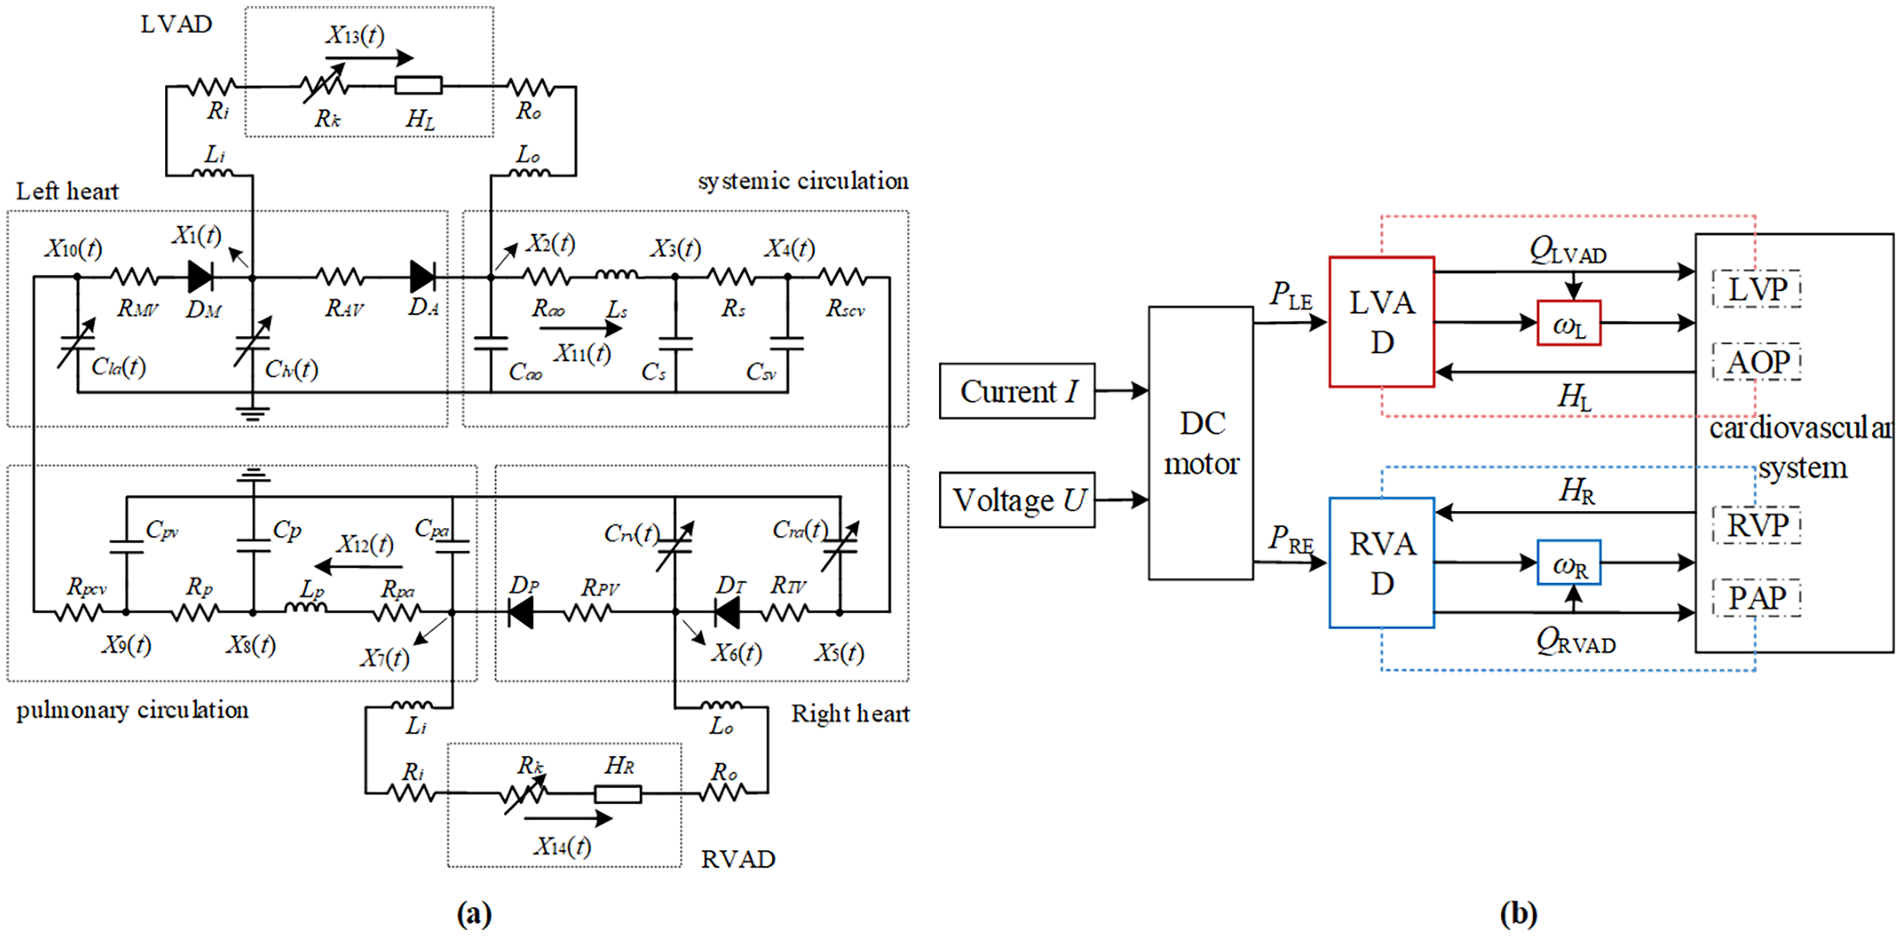
(a) Equivalent circuit of BiVAD coupled with the biventricular circulatory system; (b) power-based control block diagram of biventricular assist devices.
Since the role of the heart valve is to ensure unidirectional blood flow and prevent blood regurgitation, in this paper, a diode with forward conduction and infinite reverse resistance was used in the equivalent circuit model. 31 Variable resistor RK is the suction resistance to simulate suction:

where P is the ventricular pressure and α = −3.5 s/ml, Pth = 1 mmHg. 32
Power controller
Power control adjusts the pump flow to meet perfusion needs by changing the power to control the motor speed. Figure 1(b) shows the control block diagram of the biventricular assist system for pump power. The control variables PLE and PRE represent the pump power for LVAD and RVAD, respectively. PE represents PLE or PRE.
Pump power PE is determined by U and I.

where U and I are the voltage and current of the DC motor of BiVAD, respectively. The control variables PLE and PRE can be manipulated by changing either the current I or the voltage U applied to the BiVAD’s DC motor.
The BiVAD discussed in this paper consists of two rotary centrifugal blood pumps driven by DC motors. As shown in Figure 1(a), the LVAD branch starts from LVP and ends at AOP, while the RVAD branch starts from RVP and ends at the inlet of the pulmonary artery branch PAP. The voltage HL and HR are the differential pressures of VAD. In the pump branch, the resistances Ri and Ro represent the blood flow resistance at the pump inlet and outlet, respectively, while Li and Lo represents inertia of pump inlet and outlet, respectively.
ω is the primary variable that affects the performance of the BiVAD. The relationship between ω and PE delivered to the BiVAD is particularly important. In the system, ω L and ω R represent the speeds of LVAD and RVAD, respectively. ω represents ω L or ω R .
The following equations simplify the differential pressure between the ventricle and the aorta:


where Q(t) is the pump flow, L* is the sum of Li, Lo, and LP, and R* is the sum of Ri, Ro, RK, and RP. LP and RP are the inertia and resistance of pulmonary circulation. Constant δ = 7503 mmHg·mL/s·W. 33 LVP and RVP are the left and right ventricular pressure, AOP and PAP are the aortic and pulmonary arterial pressure.
The mathematical model of the pump can be simplified as:


where δ = 7503 mmHg·mL/s·W, β is the model coefficient, and H is the pump head. The relationship between PE and the ω can be inferred as:

The correlation between PE and ω is highly nonlinear, and ω affected by pump flow Q(t). When the power valve of BiVAD remains constant, ω exhibits periodicity due to the periodic variation of Q(t).
Power controller evaluation
The power controller regulates the speed by adjusting the power to meet blood perfusion needs. In this power controller evaluation, power remained constant with an LVAD of 5.8 W and RVAD of 4.0 W. Variable power was also simulated to evaluate the hemodynamic and the arterial valves’ function. BiVAD. Under the conditions of changes in heart failure and activity level, the hemodynamic parameter values and BiVAD parameters were calculated.
Detection of valve closure and opening
There are two methods of detecting the closure of the arterial valve. One is judged by the on/off state of diodes, and the other is compare the flow between the aorta and LVAD, the pulmonary artery and RVAD to detect the closure of the aortic and pulmonary valves, respectively.
As shown in Figure 1(a), the aortic and pulmonary valves are represented by diodes DA and DP, respectively. Judging by the diodes’ on/off state, the valves’ closure can be detected. The diodes’ conduction and cut-off correspond to the opening and closing of the valves.
Comparing the flow between the aorta and LVAD, the pulmonary artery and RVAD can also detect the closure of the aortic and pulmonary valves, respectively. As shown in Figure 1, when X11(t) = X13(t), the aortic valve closes because no blood flows through the aortic valve. Similarly, the pulmonary valve closes when X12(t) = X14(t).
The valve function is characterized by the percentage of valve opening:

where AVopen and PVopen represent the aortic and pulmonary valves, TEP and T represent the duration of valve opening and RR interval, respectively.
Effect of power on systemic hemodynamics
To explore the effect of power PE on the cardiovascular system’s hemodynamics, a wider range was set for PE. To investigate arterial valve function, the concept of critical state at which arterial valves completely close is put forward for a BiVAD. The critical state was represented by the critical power(PLE,c, PRE,c) and the critical rotating speed(ωLc, ωRc). Due to the periodicity, ωLc and ωRc represent the average rotating speed during each cardiac cycle.
Patients with mild heart failure at rest (Elv,max = 1.0 mmHg/mL, Erv,max = 0.5 mmHg/mL, HR = 75 b/min, Rs = 1.0 mmHg-s/mL, Rp = 0.1 mmHg-s/mL) were chosen to illustrate the impact of power on their hemodynamic. The range of variation for PLE and PRE was set from 0.15 to 7.65 W, with each adjacent group of simulations ΔPE = 0.15 W. A total of 51 simulation experiments were conducted.
Critical parameters of the BiVAD in different physiological states and severity of heart failure
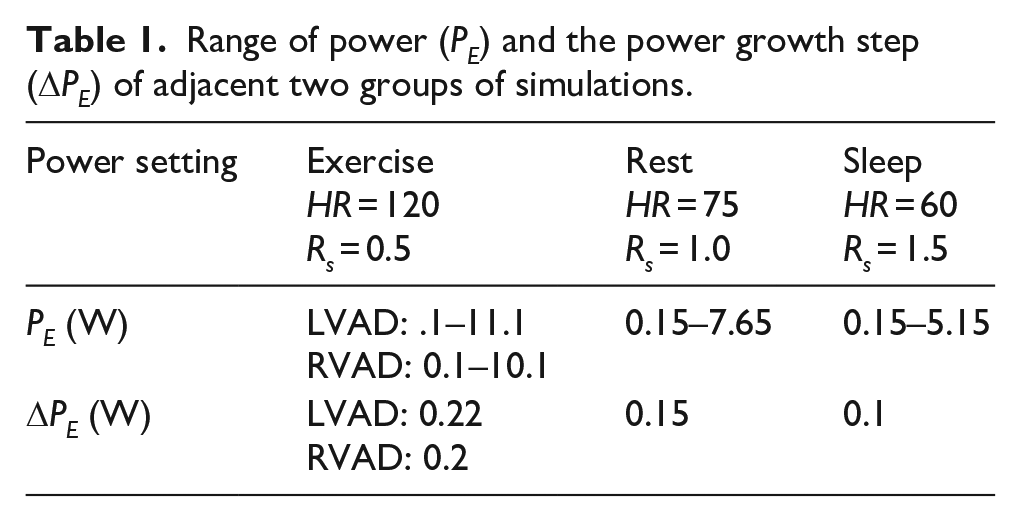
A single physiological condition does not represent the individual hemodynamic behavior of the patient. Therefore, nine different states are mimicked, corresponding to a combination of three different severity of heart failure and three different physiological states of the patient. 30 This paper simulated 37 cardiac cycles of mild heart failure, the initial 20 cycles simulated the motion state during 10 s, while 20–37 cycles simulated the rest state in the next 13.6 s. The assist effect of variable power control also depends on the patient’s physiological states and the severity of heart failure. The critical parameters include the critical power(PLE,c, PRE,c) and the critical rotating speed (ωLc, ωRc). The range of power and the power growth step of the adjacent two groups of simulations under different states are shown in Table 1 to obtain critical parameters under different states. Fifty-one simulation simulations were conducted on nine different states. The 15% of valve opening was also mimicked under these states.
Range of power (PE) and the power growth step (ΔPE) of adjacent two groups of simulations.
The assist ratios of VADs is described in (9) and (10):


where N is a positive integer between 0 and 51 representing the simulation groups at different power values, rL(N) and rR(N) are the assist ratios of LVAD and RVAD, respectively. LCO and RCO represent the mean value of left and right cardiac output, respectively. Which refers to the average value over its period
Results
Constant power control
The simulation results of the heart failure models is shown in Figure 2. The numerical results were consistent with clinical data and validated the feasibility of the heart failure model. Figure 3 depicts the effects of constant power control on hemodynamic parameters. Under constant power control, the mean AOP increased to 98.81 mmHg which could maintain sufficient perfusion compared with heart failure. The mean PAP was 17.83 mmHg, which was similar to the normal level. The LCO and RCO were 5.41 and 5.39 L/min, respectively, indicating that physiological perfusion could be achieved with constant power, and there was no significant difference in cardio output between left ventricle and right ventricle. The ventricular volume curve shifted downwards compared to the heart failure, LVP and RVP at the end of diastole and systole significantly decreased, indicating that BiVAD helped unloading the ventricle.
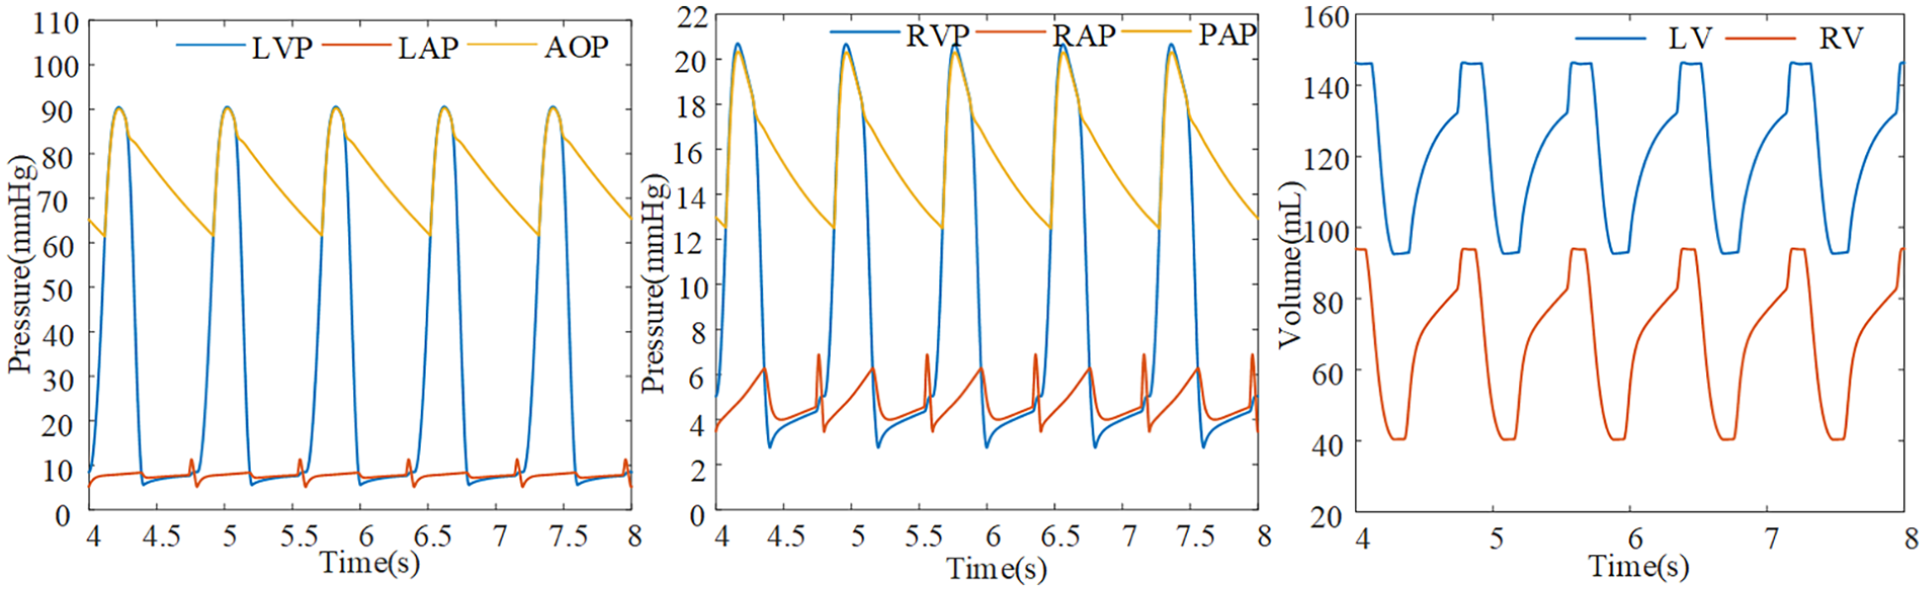
Simulation results of the heart failure model.
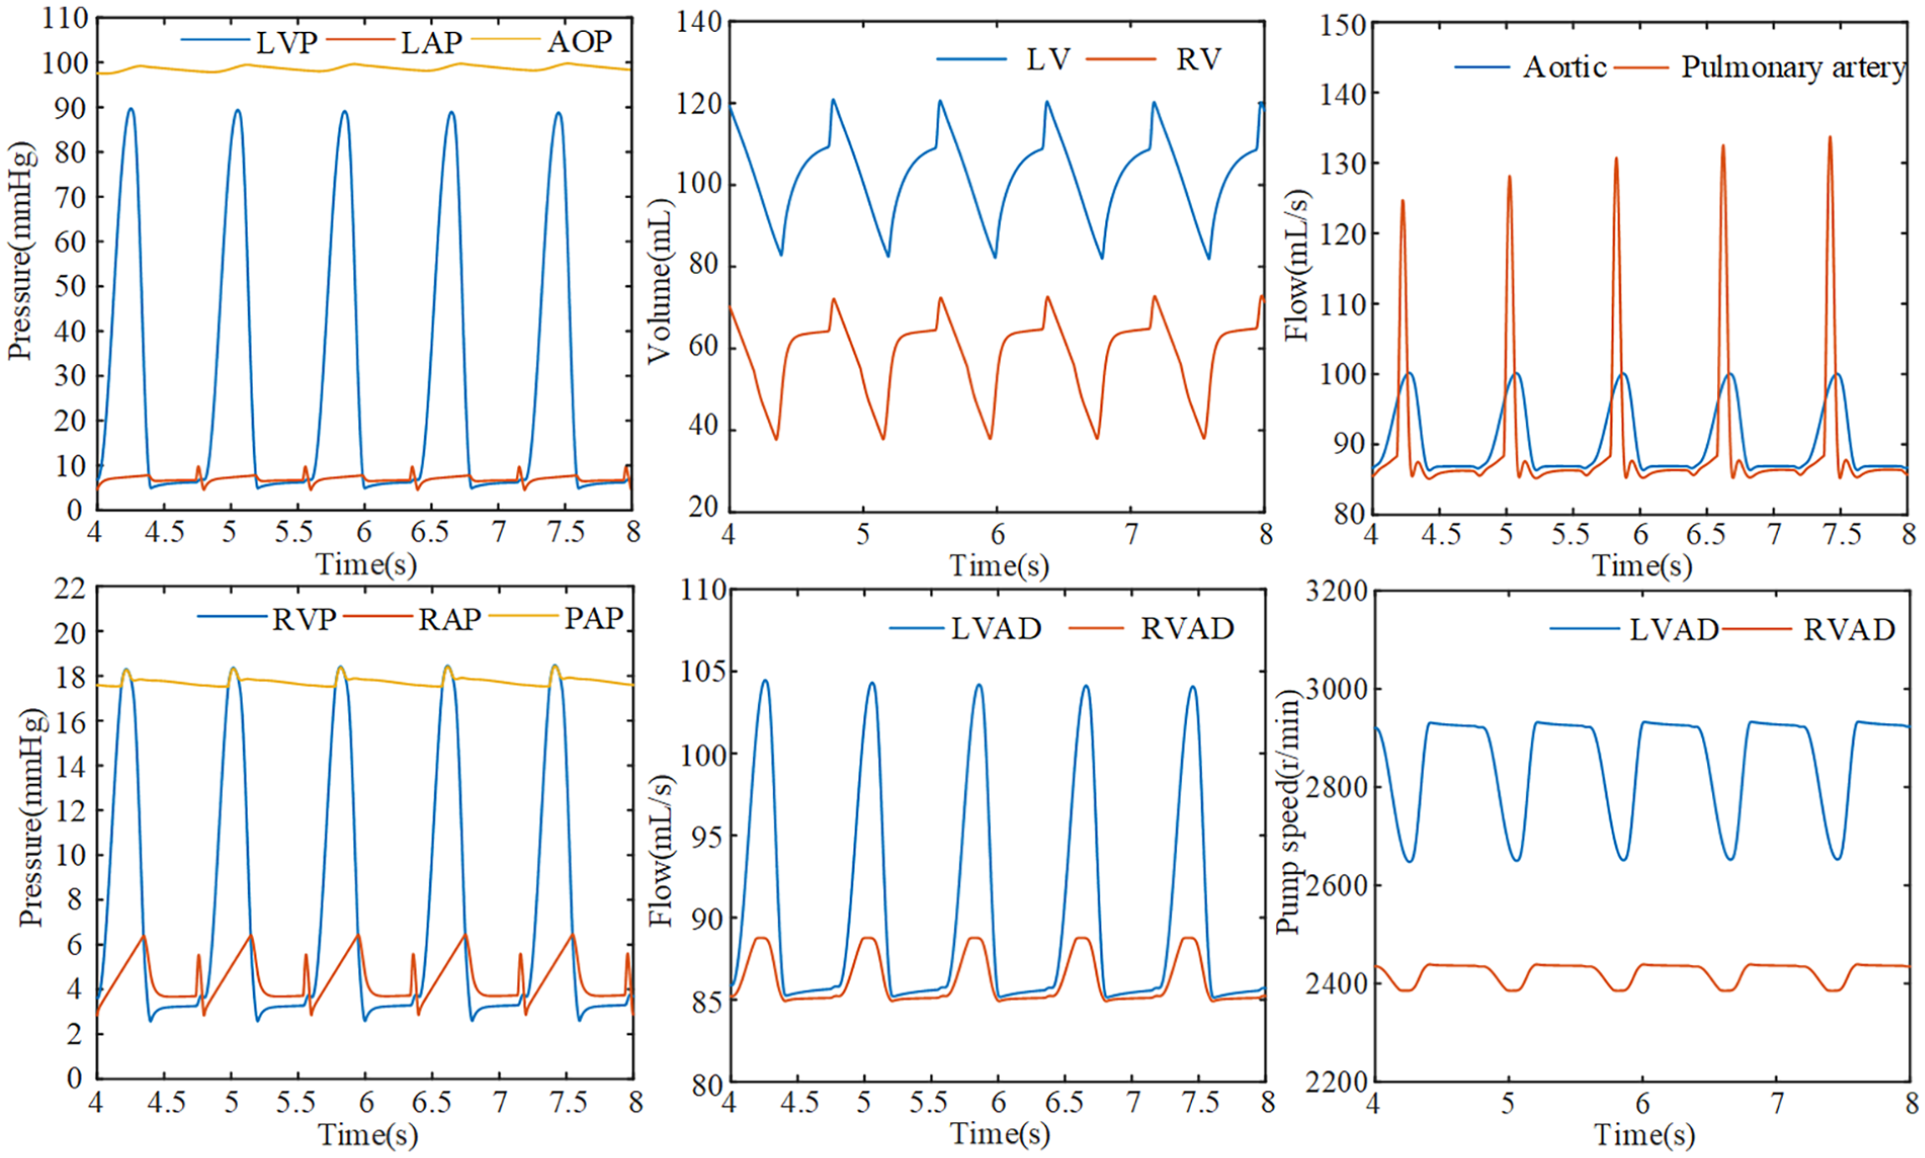
Simulation results under constant power control.
The effect of variable power control on hemodynamics
The effect of power on flows
As demonstrated in Figure 4, at the critical point PLE,c = 6.75 W, the aortic valve was completely closed, corresponding to a critical speed of ωLc = 3006 r/min. The pulmonary valve completely closed when PRE,c = 4.20 W and ωRc = 2444 r/min. The power increased from the initial value of 0.15 W, and the mean blood flow through the aortic and pulmonary valves gradually decreased. The maximum blood flow also fell quickly and significantly.
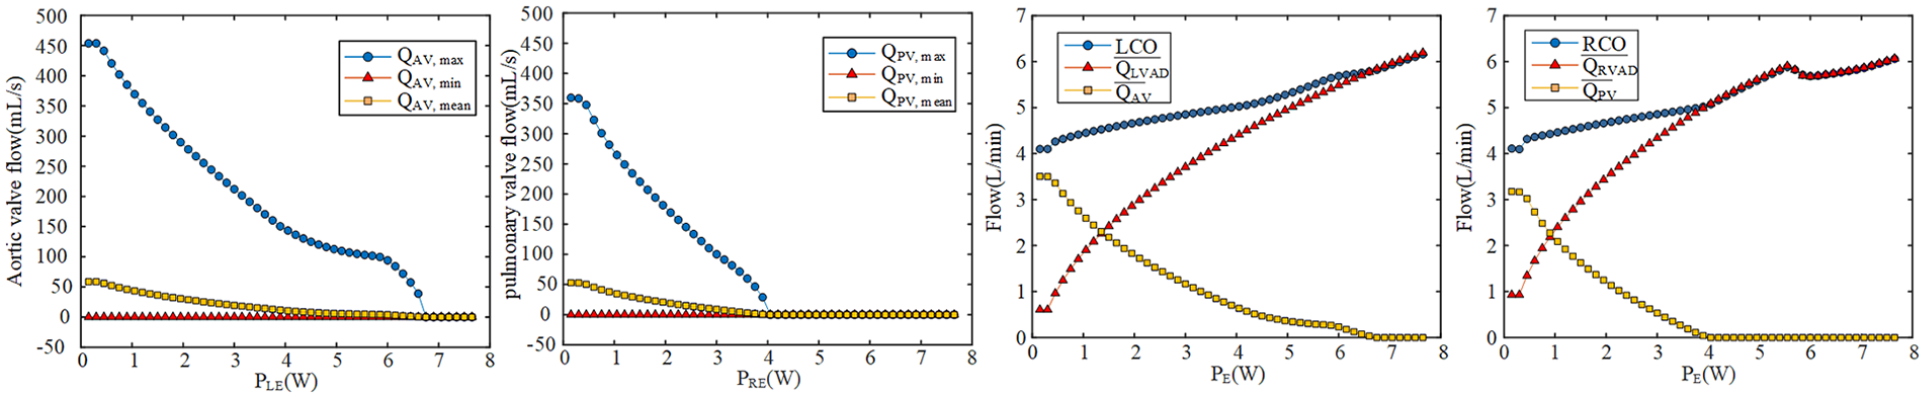
Effect of the variable power control on flows.
In Figure 4, as the power increased, the pump flow also increased. Both valves were completely closed at the critical power PLE,c = 6.75 W, PRE,c = 4.20 W, and blood flow through the valves decreased to 0. After the critical point, the mean pump flow coincides with the cardiac output curve and increased slowly. In the right heart, the first breakpoint (Interruption point of RCO slope) in RCO occurred at the moment of polmonary valve closure where PRE,c = 4.20 W. However, the second breakpoint was at 5.55 W when RCO approached 6 L/min. After the breakpoint, RCO decreased and then increased, reaching 6.06 L/min when PRE = 7.65 W. The change in LCO was relatively gentle, and there is no significant change in slope compared with RCO.
The effect of power on pressures
Figure 5 shows the effect of variable power control on LVP, RVP, AOP, and PAP. When PLE ⩾6.75 W, AOP ascended dramatically, and LVP decreased. The aortic valve closed completely when PLE ⩽6.75 W, LVP remained almost constant, while AOP significantly increased. AOPmax remained nearly constant between 6 and 6.75 W.
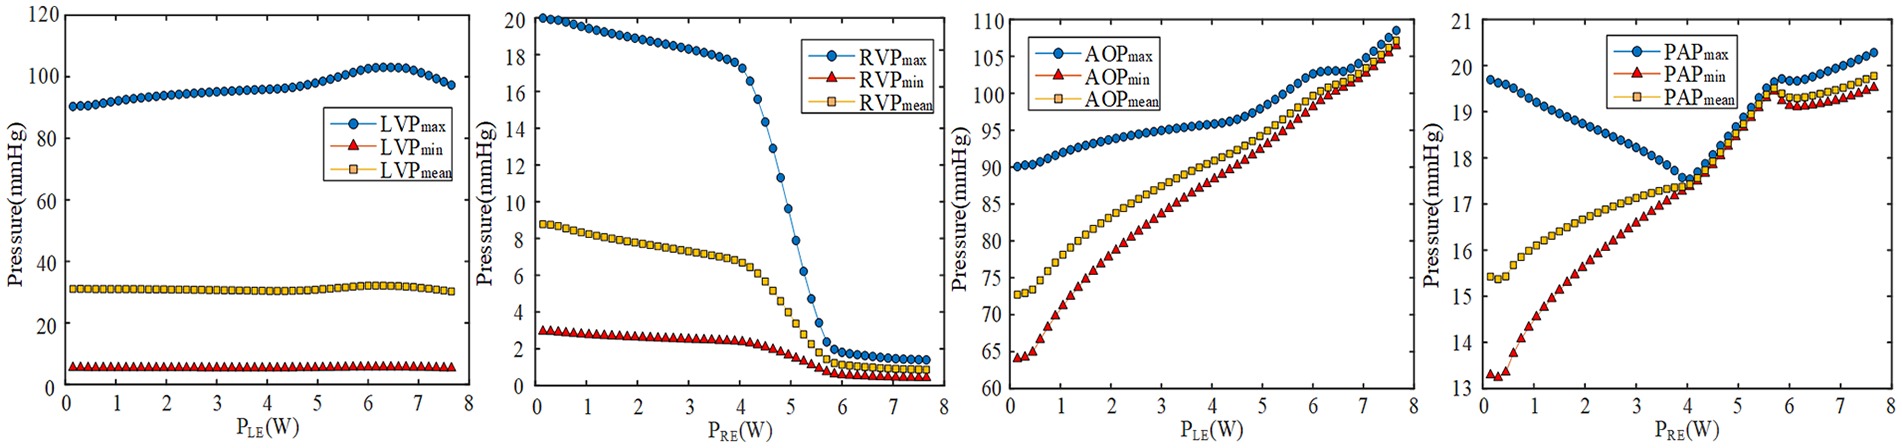
Effect of the variable power control on pressures.
When PRE ⩾4.20 W, the pulmonary valve completely closed because RVP and RVPmax dropped sharply. When PRE ⩽4.20 W, RVP maintained a slow decrease, but PAPmean and PAPmin rised while the PAPmax decreased. When 4.00 W ⩽ PRE ⩽ 5.7 W, the maximum, minimum and mean values of PAP were very close, indicating a significant decrease in pulsatility. When PRE ⩾5.85 W, the RVP continued to decrease below 3 mmHg. At the same time, PAP ended the rapid increase phase, maintaining a relatively low growth rate and consistently above 19 mmHg, while the maximum value exceeded 20 mmHg. This showed that the right ventricular afterload continued to increase, aggravating the severity of the right ventricular failure.
The effect of power on valves opening and systolic duration
As shown in Figure 6, the duration for valve opening gradually decreased as the power increased until closure occurred at the critical point. As PE approached the critical point, the valve opening duration decreased faster.
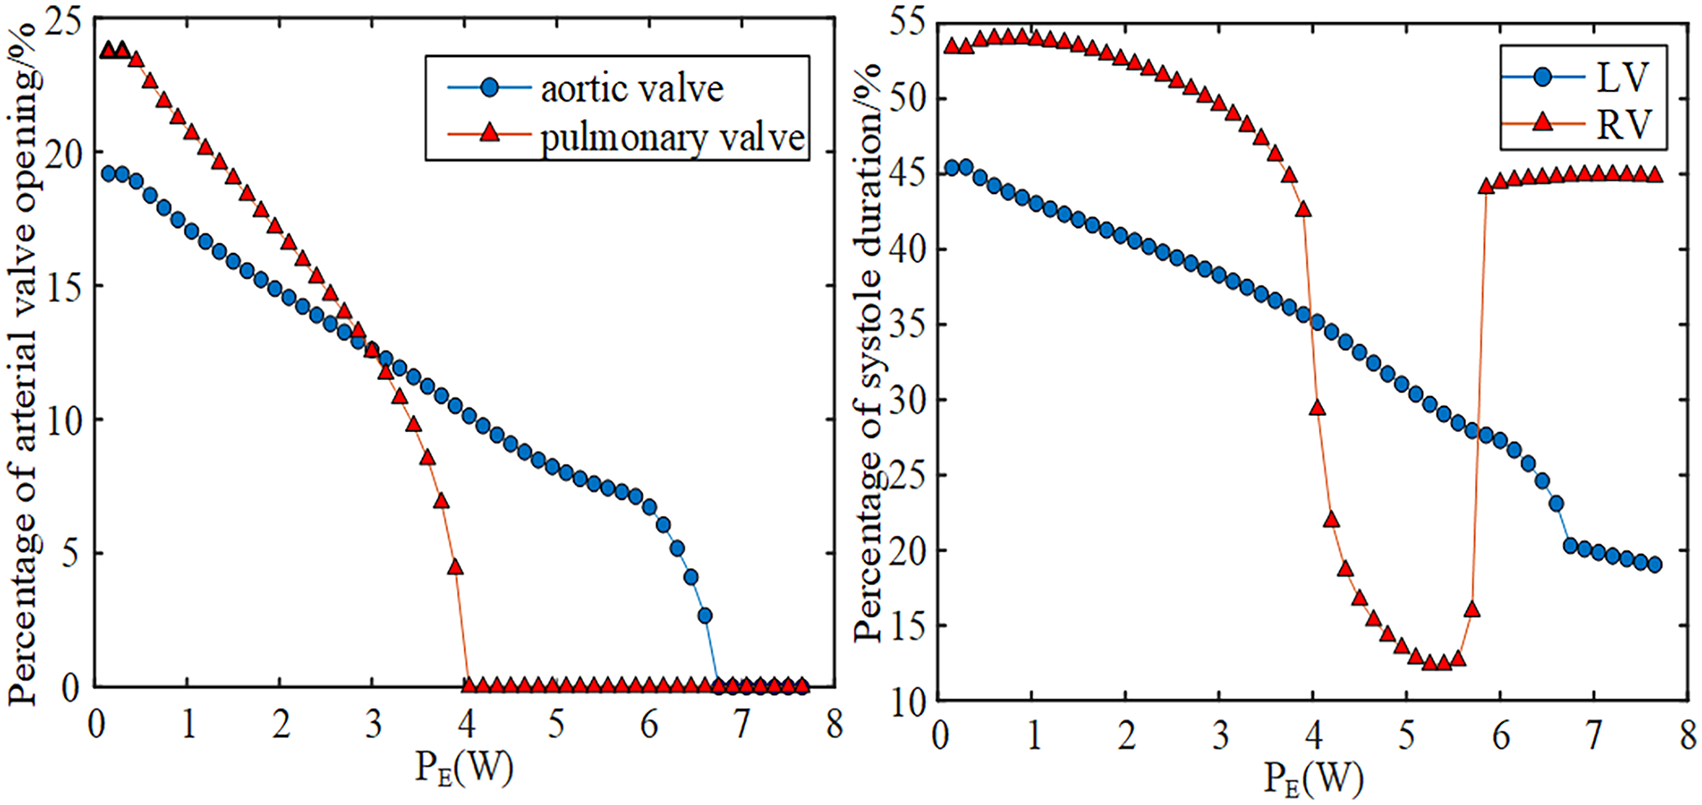
Effect of the variable power control on valve opening and systolic duration.
The percentage of RV systolic was always higher than the left ventricle before PRE,c. When PE > PRE,c, the systolic duration of RV decreased greatly, lower than LV. When PE = 5.70 W, the systolic duration of RV increased greatly, and it was close to 45% of the cardiac cycle. The difference of systole duration between LV and RV was gradually increasing when PE was greater than 5.7 W.
Critical parameters of the BiVAD
When at a mild severity of heart failure, both the range of PE that satisfied the opening of the valve and the range of VAD assistance ratio below 100% were larger, as shown in Figures 7 and 8. When the power reached the critical state, the percentage of valve opening time was reduced to 0, and the VAD assist ratio increased to 100%.
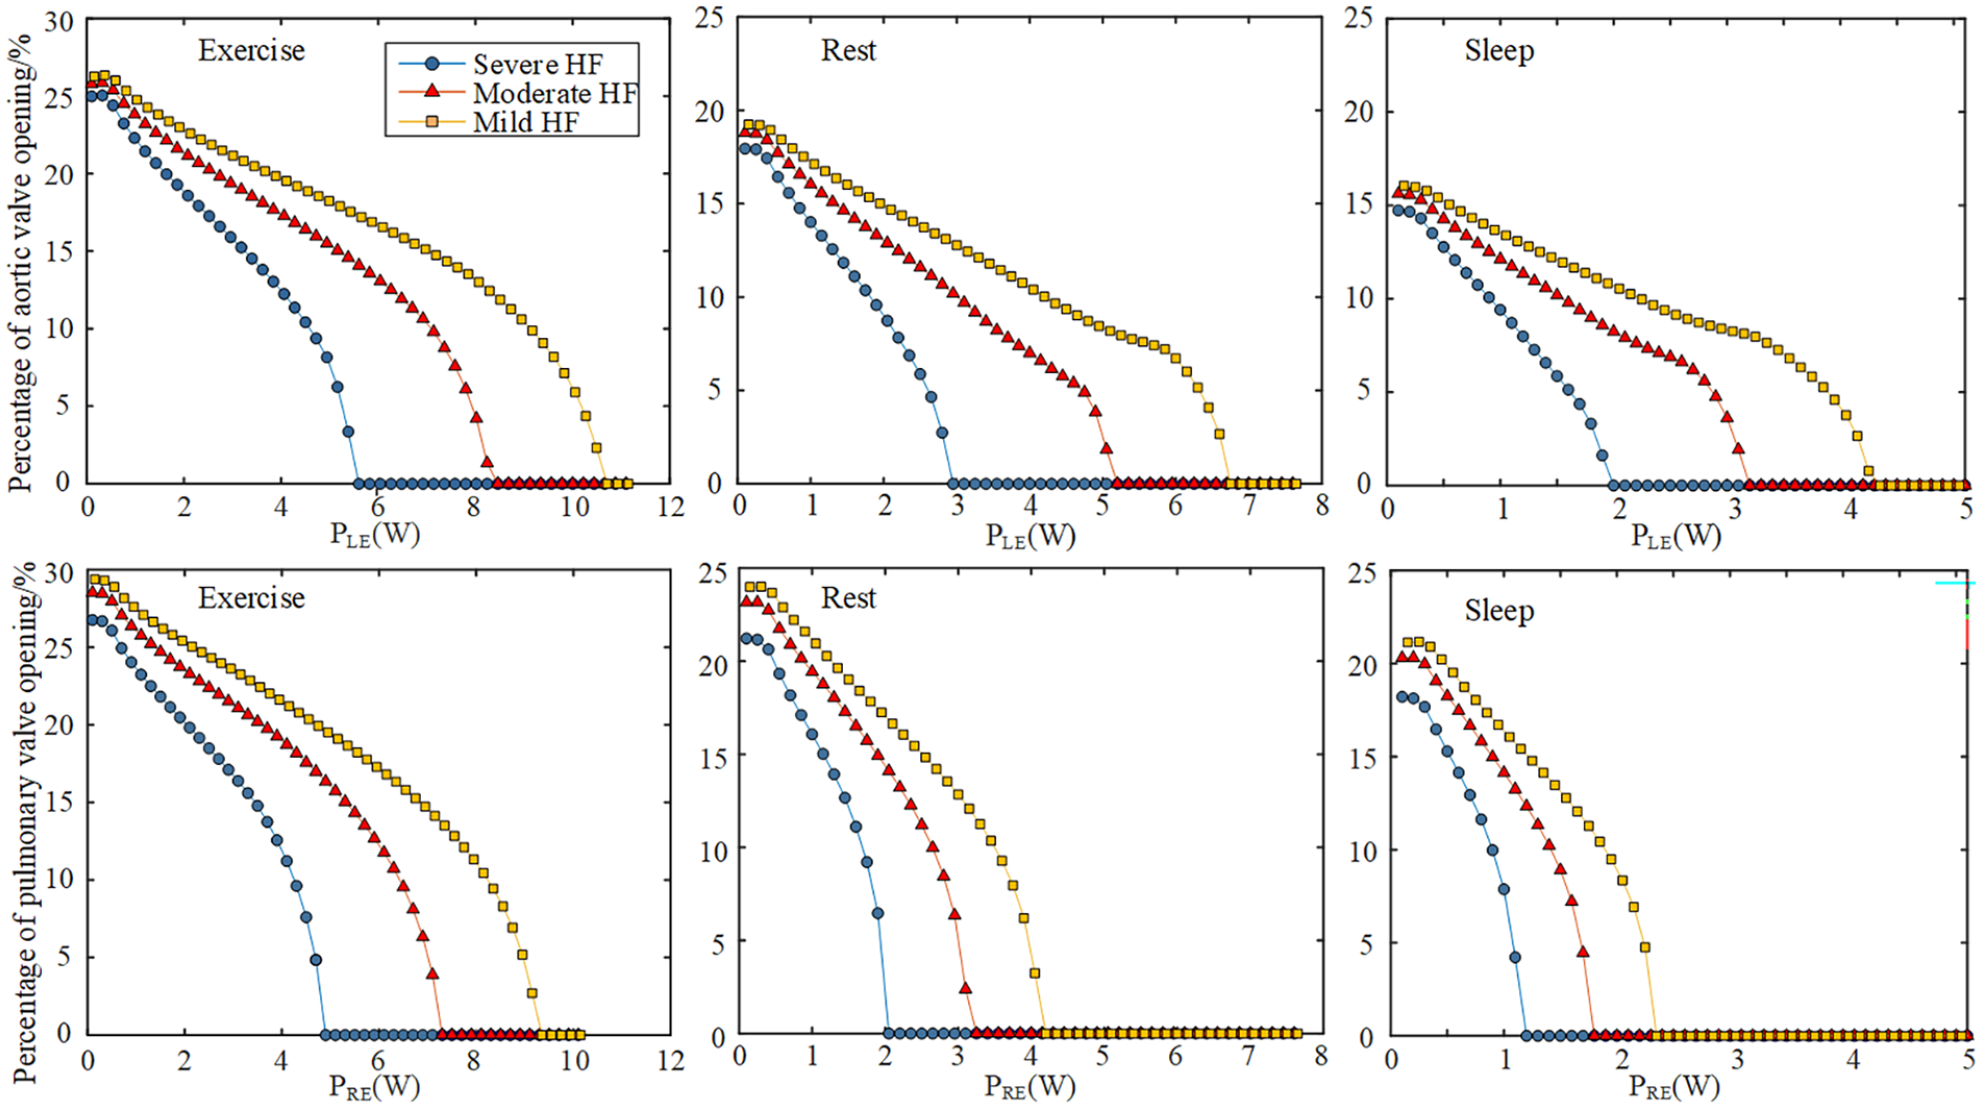
Percentage of valve opening of different physiological states and severity of heart failure.
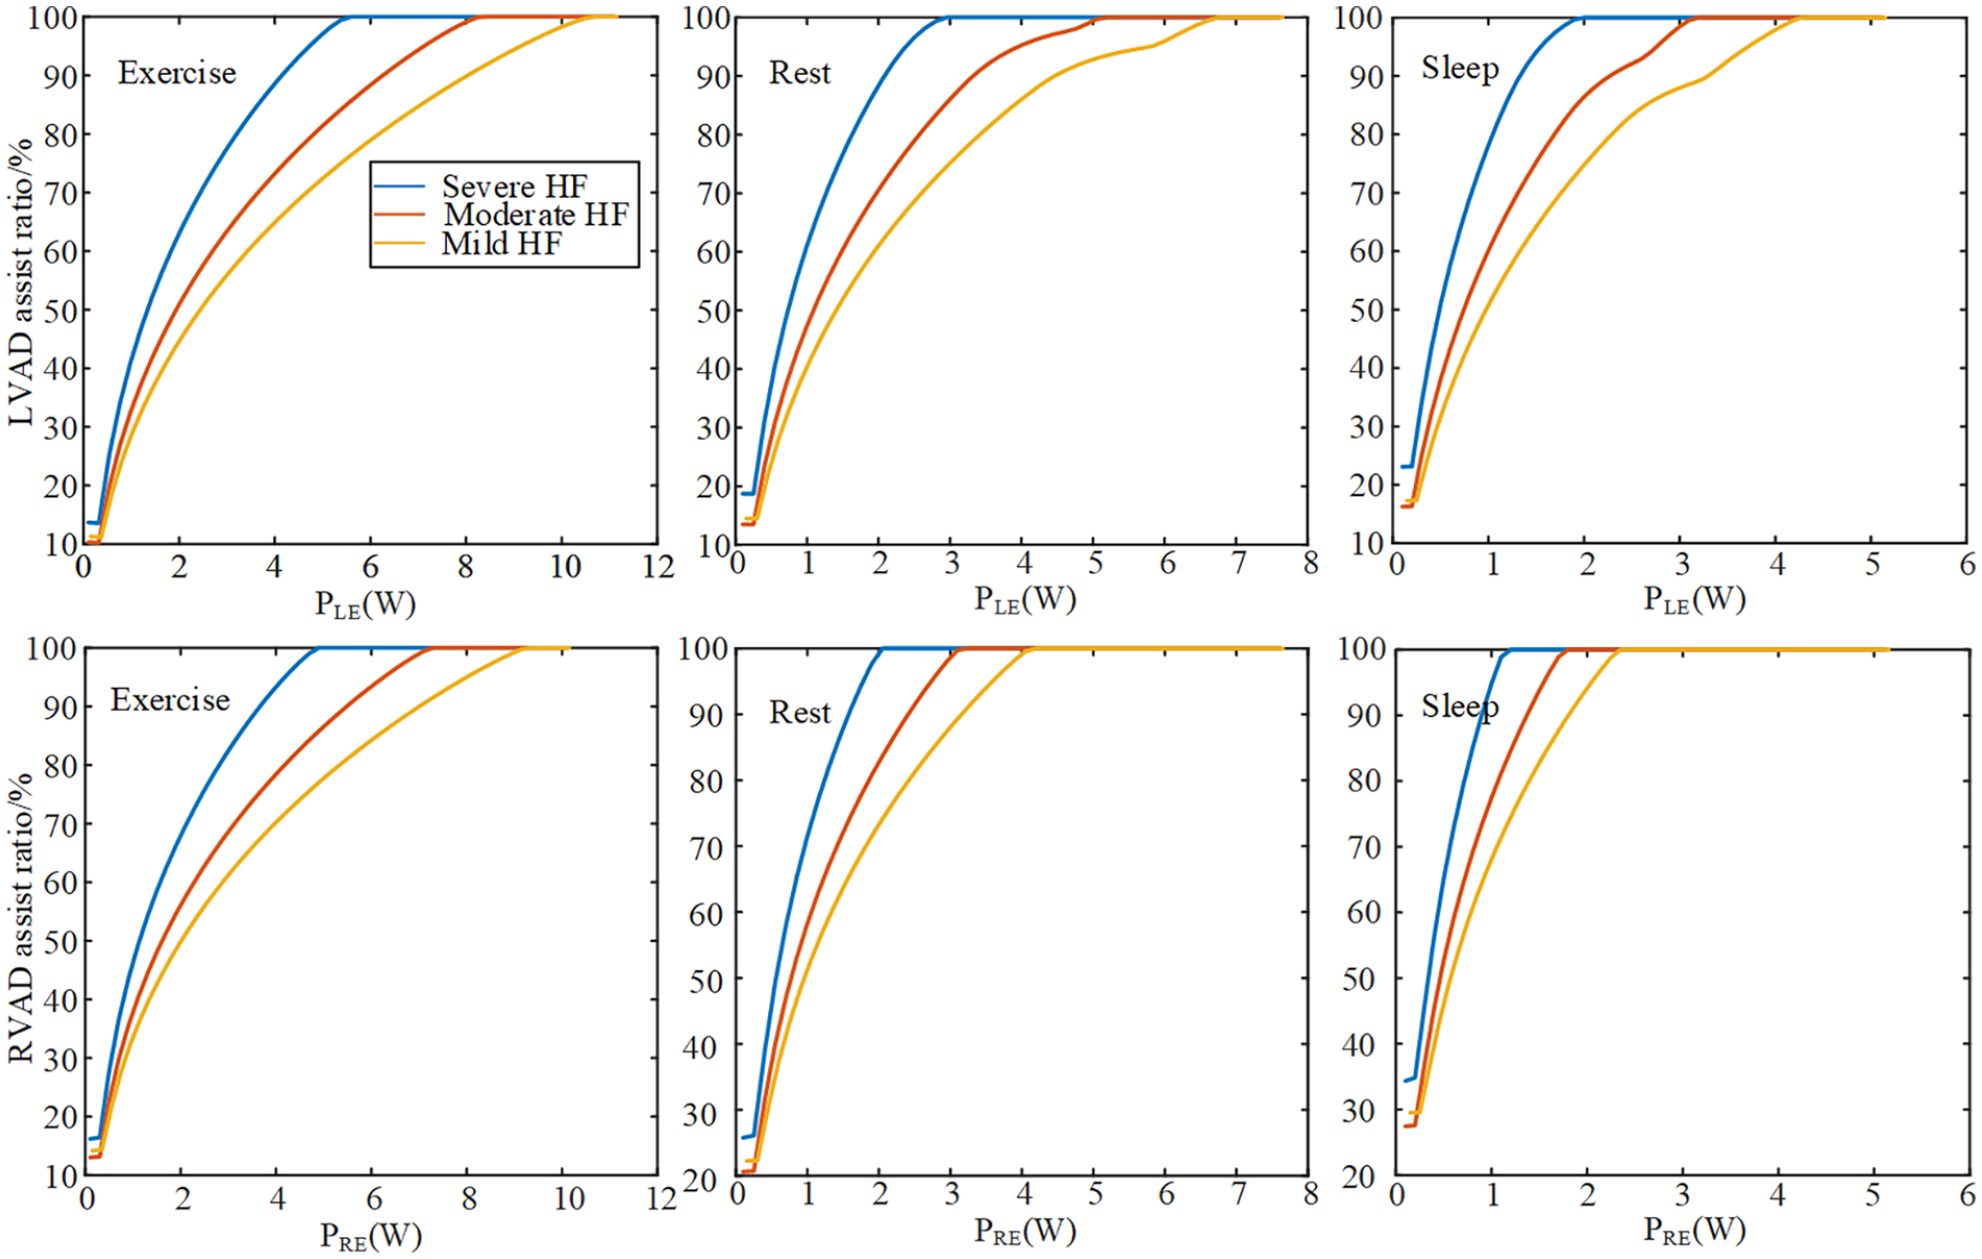
VAD assist ratio in different physiological states and severity of heart failure.
For patients with mild heart failure who are in an exercise state, even when PLE reached 10.00 W, the aortic valve still maintained function. But for severe heart failure, LVAD and RVAD often provided 100% assistance, the pulmonary valve only opened below 1.20 W during the sleep state, which is very difficult to keep the pulmonary valve open.
For patients with severe heart failure in sleep state, the control range of PLE and PRE were less than 2.00 and 1.20 W, respectively. When in resting state, PLE and PRE were less than 2.95 and 2.05 W, respectively and in exercise state, PLE and PRE were less than 5.60 and 4.90 W, respectively, much higher than the other two states.
Figure 9 showed the effects on hemodynamic parameters from the exercising to rest state. In motion state, the mean pump speed of LVAD and RVAD during a cycle remained constant at 2923 and 2753 r/min, respectively. But the mean pump speed fluctuated at first. When changing to the rest state, the mean pump speed of LVAD and RVAD increased to 2284 and 2151 r/min, respectively. LCO declined from 7.42 to 4.71 L/min. RCO decreased from almost 7.46 to 4.83 L/min. For valve function, AVopen and PVopen are 14.5% and 14.1%, respectively. When changing to the rest state, AVopen and PVopen decreased to 0% at first because of the high pump power. And then remained at 14.6% and 13.25% at the resting state.
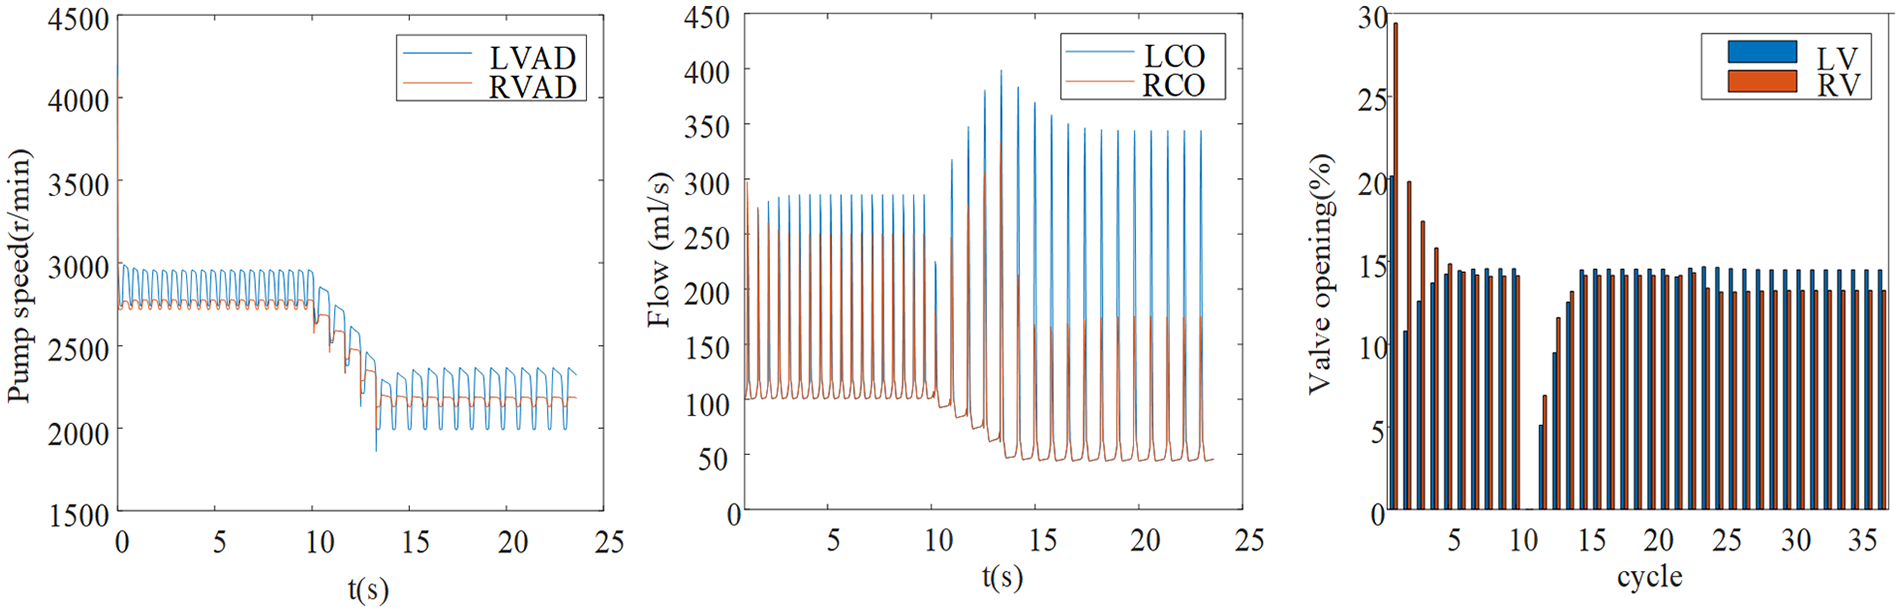
Changes in hemodynamics parameters during physiological activities from exercise to rest.
As shown in Table 2, PLE,c, PRE,c and ωLC, ωRC showed the same trend at the same state, when PLE,c and PRE,c increased ωLC and ωRC also increased, respectively.
Critical parameters and cardiac output under different activity and heart failure.
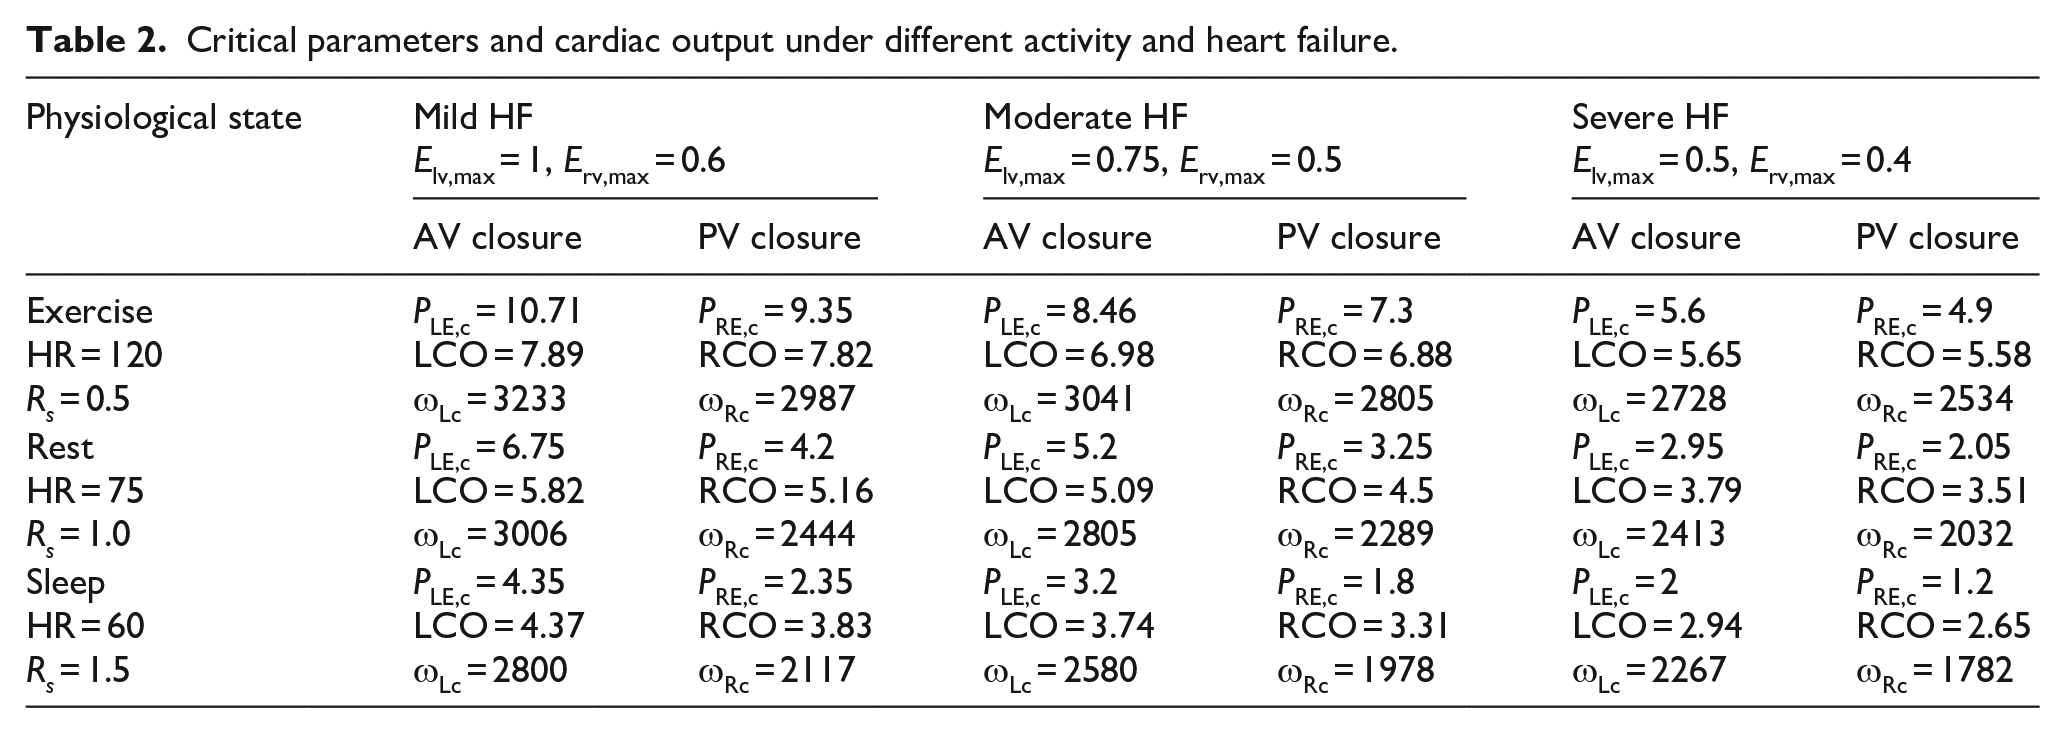
For patients with severe heart failure in an exercise state, the aortic and pulmonary valves completely closed when ωLC and ωRC were 2728 and 2534 r/min. But in mild heart failure, the valve completely closed when ωLC and ωRC were 3233 and 2987 r/min, and LCO and RCO increased from 5.65 and 5.58 to 7.89 and 7.82, respectively. So for the same state, PLE,c, PRE,c and ωLC, ωRC increased with increasing severity of heart failure.
For patients with severe heart failure in a sleep state, the valve completely closed when ωLC and ωRC were 2267 and 1782 r/min. But in the exercise state, the valve completely closed when ωLC and ωRC reached 2728 and 2534 r/min, and LCO and RCO increased from 2.94 and 2.65 to 5.65 and 5.58. So, for the same severity of heart failure, PLE,c, PRE,c and ωLC, ωRC increased with increasing activity levels.
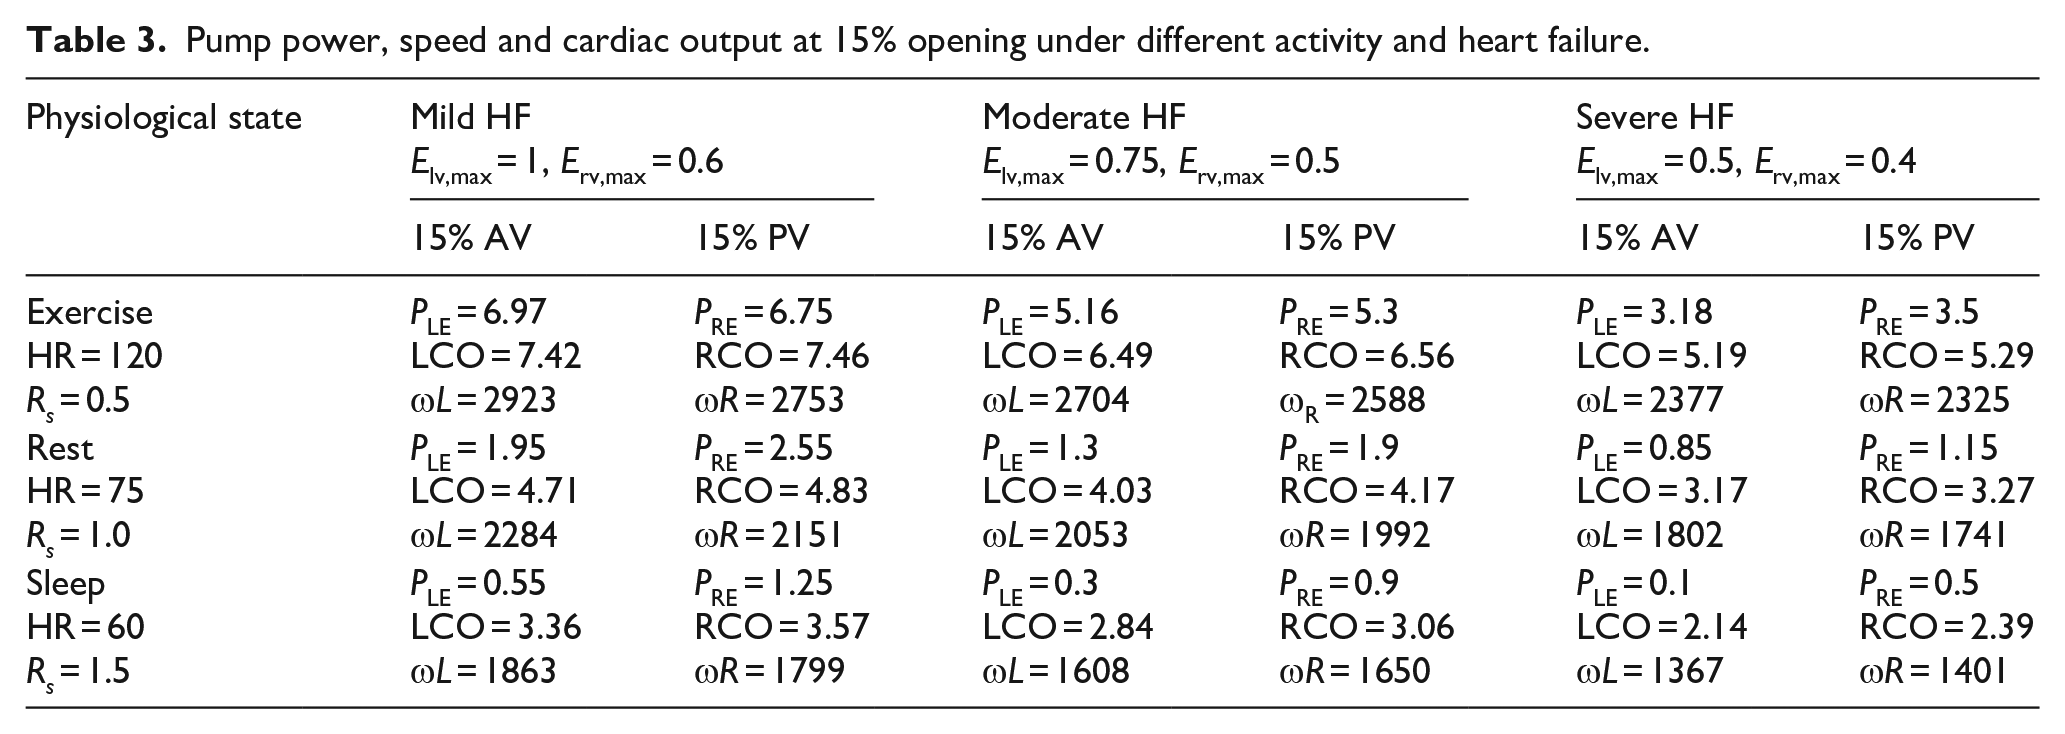
Table 3 shows the pump power, speed, and cardiac output at a 15% percentage of aortic and pulmonary valves opening. Both power and speed shown in Table 3 are lower than in Table 2, indicating that reducing the assist ratio of VAD could significantly improve the valve function. However, under severe heart failure, there were insufficient LCO and RCO in both resting and sleeping states.
Pump power, speed and cardiac output at 15% opening under different activity and heart failure.
Discussion
BiVAD often operates at a constant speed in clinical practice to achieve high reliability and durability or stability. In order to keep valve function and restore physiologic perfusion, this paper put forward a power-based control method. It can be seen that the constant power control can provide support to patients, increase pressure and perfusion volume, and achieve unloading of the ventricle.
In the study of variable power control, the opening and closing of the aortic and pulmonary valves are associated with variable power. The complete closure of the aortic valve may lead to valve incompetence, valvular fusion, and even thrombus formation, which is harmful to heart recovery. For a healthy heart, the normal aortic valve remains open during approximately 30% of the cardiac cycle. The systole phase comprises the isovolumic contraction and ejection phases. When PLE and PRE are higher than the critical values PLE,c and PRE,c, respectively, the aortic and pulmonary valves are completely closed, and there is only isovolumetric contraction in the ventricular systolic phase. When PRE exceeds 5.70 W, the percentage of RV systole duration is close to 45%, indicating an increase in isovolumic contraction time of the RV which may lead to myocardial hypertrophy, which is not conducive to the recovery of heart because of the continuous high pressure in the ventricles and increases myocardial load.
Moreover, the difference in systole duration between LV and RV can lead to ventricular asynchrony, which hinders the heart recovery. Before PLE,c and PRE,c, the main reason for the decrease in arterial valve opening time is the AOP increase caused by the increase in ω L and ω R , which the duration time of LVP and RVP above AOP and PVP gradually decreases, respectively. Sufficient perfusion can still be achieved below PLE,c and PRE,c, so reducing PLE,c and PRE,c may be appropriate. Considering the hemodynamic parameters, maintaining the normal function of the valve as much as possible is necessary. Therefore, if the valve function is the first consideration, PLE and PRE should be set below the critical values. However, PLE, PRE and ω L , ω R in Table 3 are lower than the critical parameter values in Table 2, indicating that reducing the auxiliary ratio of VADs can significantly improve the percentage of the aortic and pulmonary valves opening, enhancing their function. However, under severe heart failure conditions, there are insufficient LCO and RCO in both resting and sleeping states. Therefore, it can be inferred that the BiVAD power control method that maintains valve function may not be suitable for severe heart failure patients. In Figure 6, when the aortic and pulmonary valves are completely closed, LCO and RCO are the flows through LVAD and RVAD, respectively. As can been seen in Figure 6, the pump power required for permanent closure of the aortic valve is much higher than that of the pulmonary valve, but this difference changes as the state changes, so that the LCO is always higher than the RCO whereas the difference between the two is in some cases large in Table 2. In Figure 6, it can be seen that the pump power of the pulmonary valve is slightly higher at 15% opening duration than that of the aortic valve, i.e. PRE is greater than PLE, and the flow through the valve becomes smaller, so that the LCO is less than the RCO in Table 3.
For the case HR = 60, LCO = 4.37, RCO = 3.83 in Table 2. The difference between LCO and RCO will change with different physiological states. But the power required for complete closure of the pulmonary valve decreases faster than aortic valve. As can been seen in Figure 7, PLE,c = 4.35 and PRE,c = 2.35 mean that LCO is greater than RCO.
This study has made some progress in the research of BiVAD, but there is still much works that need to be further improved throughout the entire research process, mainly including the following points:
(a) The proposed power controller was only tested in an established computer simulation model of the cardiovascular system coupled with BiVAD, which can be subsequently further developed by in vitro or in vivo experiments to improve its reliability.
(b) Valve pathology was not taken into account in the study of valve opening or non-opening, and experimental conditions such as valve closure insufficiency could be included in subsequent studies for comparative validation.
(c) The power controller is dependent on the blood pump hydraulic models (i.e., axial flow and centrifugal flow). The model of both LVAD and RVAD was identified based on centrifugal blood pump, generalization is very limited. Different blood pump hydraulic models will be attempted to further verify the power controller in the future.
The results of this study demonstrated that the power-based control of BiVAD could provided physiologic flow under power-based control. Physiologic flow requires providing maximal device support that matches the cardiac demand to ensure adequate end organ perfusion. 34 The BiVAD under constant power control provided support to patients, increased blood pressure and perfusion volume which helped unloading the ventricles. Before the critical parameters (PLE,c and PRE,c), adequate perfusion can still be achieved under variable power control. Therefore, the setting constant power can be appropriately reduced. For different physiological states and severity of heart failure, the range of power that can maintain the opening of the valve is various. If the patient’s activity level continues to change for a given severity of heart failure, PE should not exceed the minimum value that causes valve closure. In summary, when setting the power, clinical objectives of valve function and physiologic perfusion should be comprehensively considered.
Conclusion
This study developed a power-based control model for BiVAD by altering different powers to satisfy adequate perfusion demands and valve function. The results were consistent with the clinical benefit seen in patients, which indicates that the application of the power controller can assist patients with heart failure. For valve function, the power control in different states were discussed and the power-based control can be feasible with maintaining valve function.
Footnotes
Declaration of conflicting interests
The author(s) declared no potential conflicts of interest with respect to the research, authorship, and/or publication of this article.
Funding
The author(s) received no financial support for the research, authorship, and/or publication of this article.