
Abstract
Background:
Type 1 diabetes (T1D) management remains particularly challenging in the presence of external disturbances such as stress or physical activity (PA). The glycemic impact of PA is still not fully understood and lacks standardized modeling approaches. This work seeks to describe the relationship between PA, time-in-range and glucose predictability in people with T1D (PwT1D).
Methods:
This study uses data from the Type 1 Diabetes and Exercise Initiative (T1DEXI) clinical trial, the largest trial to date in PwT1D undergoing both free-living and structured exercise. A characterization pipeline extracts summary statistics including glucose, carbohydrate intake and PA signals. These features are used to perform unsupervised clustering of subjects using various techniques. The relevance of the cluster-defining variables is then assessed, and their relationship to the performance of a long short-term memory (LSTM) neural network trained to forecast glucose 1 h into the future is analyzed.
Results:
The spectral clustering algorithm successfully separates individuals into three groups based on glycemic control metrics. Results indicate that subjects with higher levels of weekly PA exhibit lower prediction errors. This suggests that regular PA enhances the predictability of glucose trends, enabling more accurate forecasting models.
Conclusion:
Since fear of hypoglycemia remains one of the main barriers to PA in PwT1D, these findings are particularly relevant: regular exercise not only promotes better glycemic regulation but also improves the performance of predictive models, which could strengthen automated insulin delivery systems, support more reliable decision-support tools and contribute to safer and more confident engagement in PA.
Introduction
Maintaining stable glycemic control in individuals with Type 1 Diabetes (T1D) continues to be a significant clinical challenge, particularly during and after physical activity (PA). Although exercise offers numerous health benefits, it introduces substantial variability in glucose dynamics through complex physiological responses, increasing the risk of both hypo- and hyperglycemia depending on the activity’s intensity, duration, and type. 1 Fear of hypoglycemia remains one of the main barriers to regular PA, discouraging many individuals despite its recognized benefits and the recommendation to perform at least 150 min of moderate-to-vigorous exercise per week. 1
Given the lack of consensus on how to model the impact of PA on glycemic dynamics, recent studies have focused on detecting PA episodes, 2 classifying exercise types (since different modalities affect glucose differently),3,4 and developing glucose prediction models that account for exercise. The growing availability of wearable sensors and continuous glucose monitors (CGM) has fueled the use of data-driven approaches, ranging from classical statistical and machine learning methods 5 to neural network (NN) architectures.6,7 Among these, long short-term memory (LSTM) networks have shown particular promise due to their ability to model temporal dependencies and capture long-term glucose-insulin-carbohydrate interactions. For example, Neumann et al. 7 compared various predictive models and highlighted the superior performance of subject-specific LSTM models, which better capture individual metabolic patterns. However, such personalized approaches often overlook inter-subject variability and offer limited insight into which subject characteristics are associated with more predictable responses.
Neumann et al. 7 also noted that fully individualized models face data limitations, as each subject typically provides only 288 CGM samples per day (with 5-min sampling), making it difficult to train reliable models without extended monitoring. In this context, unsupervised machine learning techniques such as clustering provide a promising alternative by identifying subpopulations with similar metabolic profiles while preserving clinically meaningful distinctions. 8 In T1D, clustering has been used to define subgroups based on demographic, clinical, and metabolic features linked to future complications (e.g., retinopathy, coronary artery disease, autonomic neuropathy), 9 to refine classification schemes and treatment strategies, 10 and to identify CGM-based phenotypes through pattern analysis. 11
This article aims to explore the interaction between glycemic control, PA behavior, and glucose predictability, with a focus on how PA influences the stability and predictability of glucose dynamics. The participants from the Type 1 Diabetes and Exercise Initiative (T1DEXI) clinical trial (the largest study to date of PA in T1D) 12 are analyzed based on a set of features encompassing glycemic control metrics, PA patterns, demographic characteristics, insulin usage behaviors, among others. Unsupervised clustering algorithms are applied to identify subject subgroups with similar glycemic profiles. Importantly, only glucose-derived features are used for clustering, allowing an independent evaluation of differences in PA behavior and prediction performance across clusters. When an LSTM-based predictor is applied to the time-series data of each cluster, prediction errors are notably lower in the group with higher PA levels, demonstrating that regular PA is associated with more predictable glucose dynamics. These findings highlight the potential of integrating PA-informed analyses into personalized decision support systems (DSS) and artificial pancreas technologies, 13 offering a pathway for safer and more effective exercise management in people with T1D (PwT1D).
Subject data description, filtering, and characterization
This section outlines the T1DEXI trial, detailing data selection and subject characterization using clinical data, sensor signals and self-reported events to ensure consistency for subsequent clustering and predictive modeling tasks.
T1DEXI clinical trial
The data utilized in this research originates from the T1DEXI clinical trial, 12 a study conducted in real-world settings that gathered comprehensive information on PA among individuals living with T1D over a four-week period under free-living conditions. A total of 497 adult participants were enrolled in the study, all of whom had been diagnosed with T1D at least 2 years prior to the trial. At the time of the study, participants were undergoing one of three widely used insulin delivery methods: commercially available hybrid closed-loop (HCL) systems, standard insulin pump (SAP) therapy or multiple daily injections (MDI).
Each participant performed six structured exercise sessions at home following instructional videos. In addition, participants engaged in their regular daily routines, which included unstructured PA sessions. Throughout the study, individuals recorded key health metrics such as dietary intake, insulin doses and continuous glucose levels using the Dexcom G6 CGM device. Participants also wore the Verily Study Watch to continuously track heart rate (HR) and accelerometer (used to estimate step count).
Data filtering and subjects selection criteria
A data filtering process is applied to ensure signal validity and reduce the impact of missing CGM and wearable data, a common limitation in physiological time-series analysis.14,15 Only participants using HCL or SAP therapy are included if they have at least 24 of 28 study days with more than 80% of expected samples from both CGM (recorded every 5-min) and Verily Study Watch (every 10-s) signals. Days with less than 60% completeness in either device or with fewer than two recorded meals are excluded to preserve temporal consistency and provide context for glycemic variability. After applying these filtering criteria, 124 participants remain from the original 414 (under HCL or SAP therapy). The selected group has a mean age and standard deviation (SD) of 39 ± 15 years, diabetes duration of 19 ± 12 years, and HbA1c of 6.6 ± 0.7%, indicating overall satisfactory glycemic control.
Subject characterization
This section details the features extracted from clinical and sensor data to characterize individuals, combining static demographic information and time-series signals for a comprehensive view of glycemic control, insulin use, diet and PA patterns.
Data sources: The characterization integrates data from: (i) demographic and clinical data (age, BMI, T1D duration, HbA1c), (ii) CGM recordings (glucose levels), insulin pump logs (basal and bolus delivery) and insulin-on-board estimate (IOB), (iv) self-reported carbohydrate (CHO) intake logs and carbohydrate-on-board estimate (COB), and (v) wearable sensors (HR and step count) and PA session reports.
The IOB and COB models, adapted from Hovorka et al., 16 are applied to estimate the residual effect of administered insulin and the amount of carbohydrates still being absorbed, respectively. These models generate continuous, temporally resolved signals that capture the dynamic impact of insulin and carbohydrate intake over time, providing more detail than simple bolus or meal event markers for analysis.
Feature extraction: Features are derived differently depending on the data type:
CGM-derived clinical metrics: Key clinical indicators derived from CGM data include the percentage of time in range (TIR), above range (TAR), and below range (TBR), calculated relative to clinically relevant thresholds. Additionally, the coefficient of variation (CV) is computed as a measure of overall glycemic variability. These metrics form the core of the glycemic profile characterization.
Time-series signals: For continuous signals like glucose, step count, and HR, daily summary statistics (mean, SD) and derived metrics, for example, area under the curve (AUC) and daily peak values, are calculated.
Discrete events: For events like insulin boluses, meals, and self-reported PA sessions (including number, duration, intensity, and timing), frequency-related features are extracted (e.g., average daily counts, timing entropy, mean intervals between events).
In total, this process yields 57 distinct metrics per individual. These features serve as the input space for subsequent unsupervised clustering and predictive modeling tasks
Unsupervised clustering of subjects
Unsupervised clustering groups observations based on similarity metrics in a feature space. Here, it identifies subject subgroups with distinct physiological profiles using clinical and behavioral variables. The dataset is standardized (z-score normalization) to ensure fair comparison across variables with different scales, allowing the algorithm to focus on relative variations. 17
Clustering algorithms evaluation
The clustering algorithms evaluated in this work, which require a predefined number of clusters (K), include K-means, 18 Agglomerative Hierarchical Clustering (with Ward linkage), 19 Gaussian Mixture Models (GMM), and Spectral Clustering (SC). 20
Clustering quality is assessed using two widely-used metrics: the Silhouette Score (−1 to 1), which quantifies how much closer an object is to its own cluster than to others (higher is better), and the Davies-Bouldin Index (DBI), where lower values indicate greater inter-cluster separation and lower within-cluster dispersion. For this evaluation, feature selection focuses on variables representing glycemic control (TIR, TAR, and CV) providing a compact but informative description of glucose dynamics. TBR is omitted due to redundancy (TIR + TAR + TBR = 100%), avoiding multicollinearity.
A value of K = 3 is selected based on an exploratory hypothesis aiming to identify subgroups differentiated by glycemic control, yielding three biologically plausible profiles (good, moderate, and poor control) potentially related to PA patterns. Increasing K could provide more granular subgroups but would reduce interpretability and clinical relevance. Table 1 summarizes the clustering results, evaluated using internal validation indices. GMM underperforms, showing the lowest Silhouette and highest DBI values, indicating poorly defined clusters. K-means, Agglomerative Clustering, and SC achieve comparable results (Silhouette 0.319–0.407; DBI 0.841–0.957), suggesting similar cohesion and separation.
Results of clustering algorithms (for fixed number of clusters, K = 3).
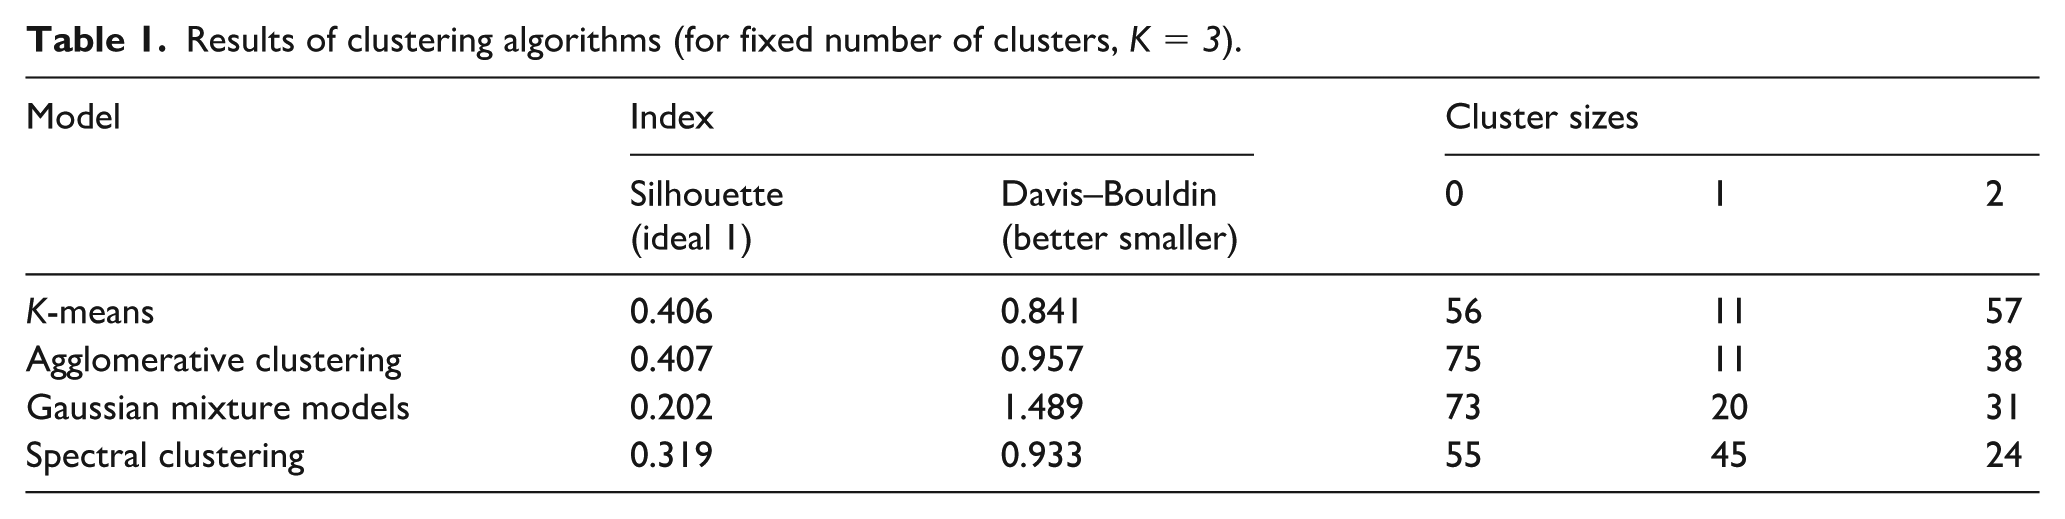
Given these similar performances, further analysis focuses on the clinical relevance of the resulting groups and their ability to differentiate individuals according to glycemic control and PA behavior. As numerical indicators alone may not capture clinical interpretability, an extended DBI evaluation is conducted incorporating the 21 PA-related features (described in previous section) together with the original glycemic variables. This analysis, applied to the clusters obtained using glycemic data only (without retraining), leverages DBI sensitivity to inter-cluster separation. Under this evaluation, SC achieves the lowest DBI (8.35) compared with K-means (13.50) and Agglomerative Clustering (10.32), confirming its superior discrimination of PA behavior. Consistently, visual inspection of the group structures (not shown due to space constraints) indicates that the clusters obtained through SC exhibit more coherent patterns in both glycemic and PA-related features than those formed by the other algorithms.
The final clusters are analyzed together with additional features not used for clustering. A statistical comparison using the Mann–Whitney U test assesses whether these features differ significantly between clusters. Of the 57 extracted features, 30 show significant differences between at least two clusters (p<0.05), as summarized in Table 2. The most relevant distinctions occur in glycemic metrics (TIR, TAR, CV, mean, and SD of glucose), and in behavioral variables related to meal intake, insulin administration (basal, bolus, and IOB-derived features), and PA (number of sessions and weekly duration). Several subject-specific characteristics such as age, HbA1c, and BMI also differ significantly. Notably, Cluster 2 presents the most distinctive profile, with 18 features differing significantly, while Clusters 0 and 1 differ in 11 each.
Statistical significance of differences between clusters for relevant features. Check-marks (✓) indicate variables where statistically significant differences (p<0.05) are detected between pairs of clusters.
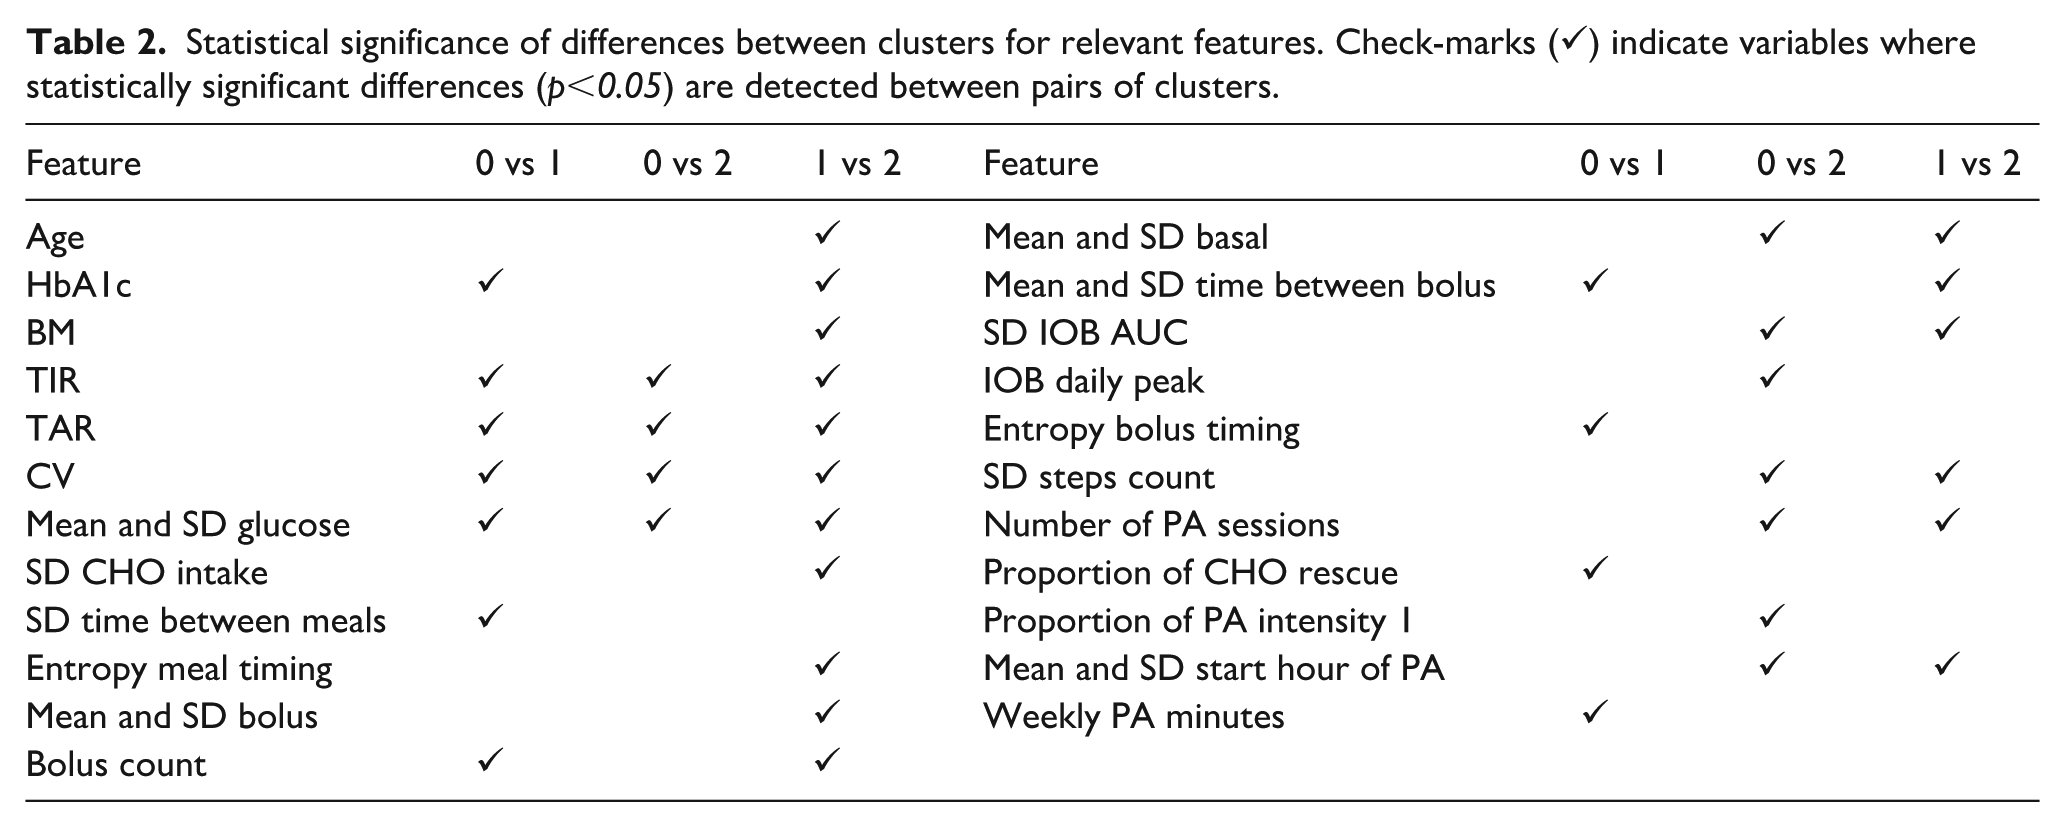
Figure 1 displays boxplots of key metrics (TIR, TAR, TBR, CV, number of PA sessions, and weekly PA duration). Cluster 1 shows the poorest control and lowest PA, with reduced TIR, elevated TAR and CV, and fewer, shorter PA sessions. Cluster 2 exhibits the best glycemic control and activity levels, with the highest TIR, lowest TAR and TBR, markedly lower CV, and greater PA frequency and duration. Cluster 0 displays intermediate patterns in both glycemic and PA metrics. Although age and T1D duration are not shown, Cluster 2 includes the oldest participants (46 years) and longest disease duration (23 years), compared to Cluster 0 (40 and 18 years) and Cluster 1 (35 and 18 years). These results suggest that older individuals with longer-standing diabetes tend to exhibit greater adherence to treatment and PA routines, often exceeding the recommended 150 min of moderate-to-vigorous PA per week. 1
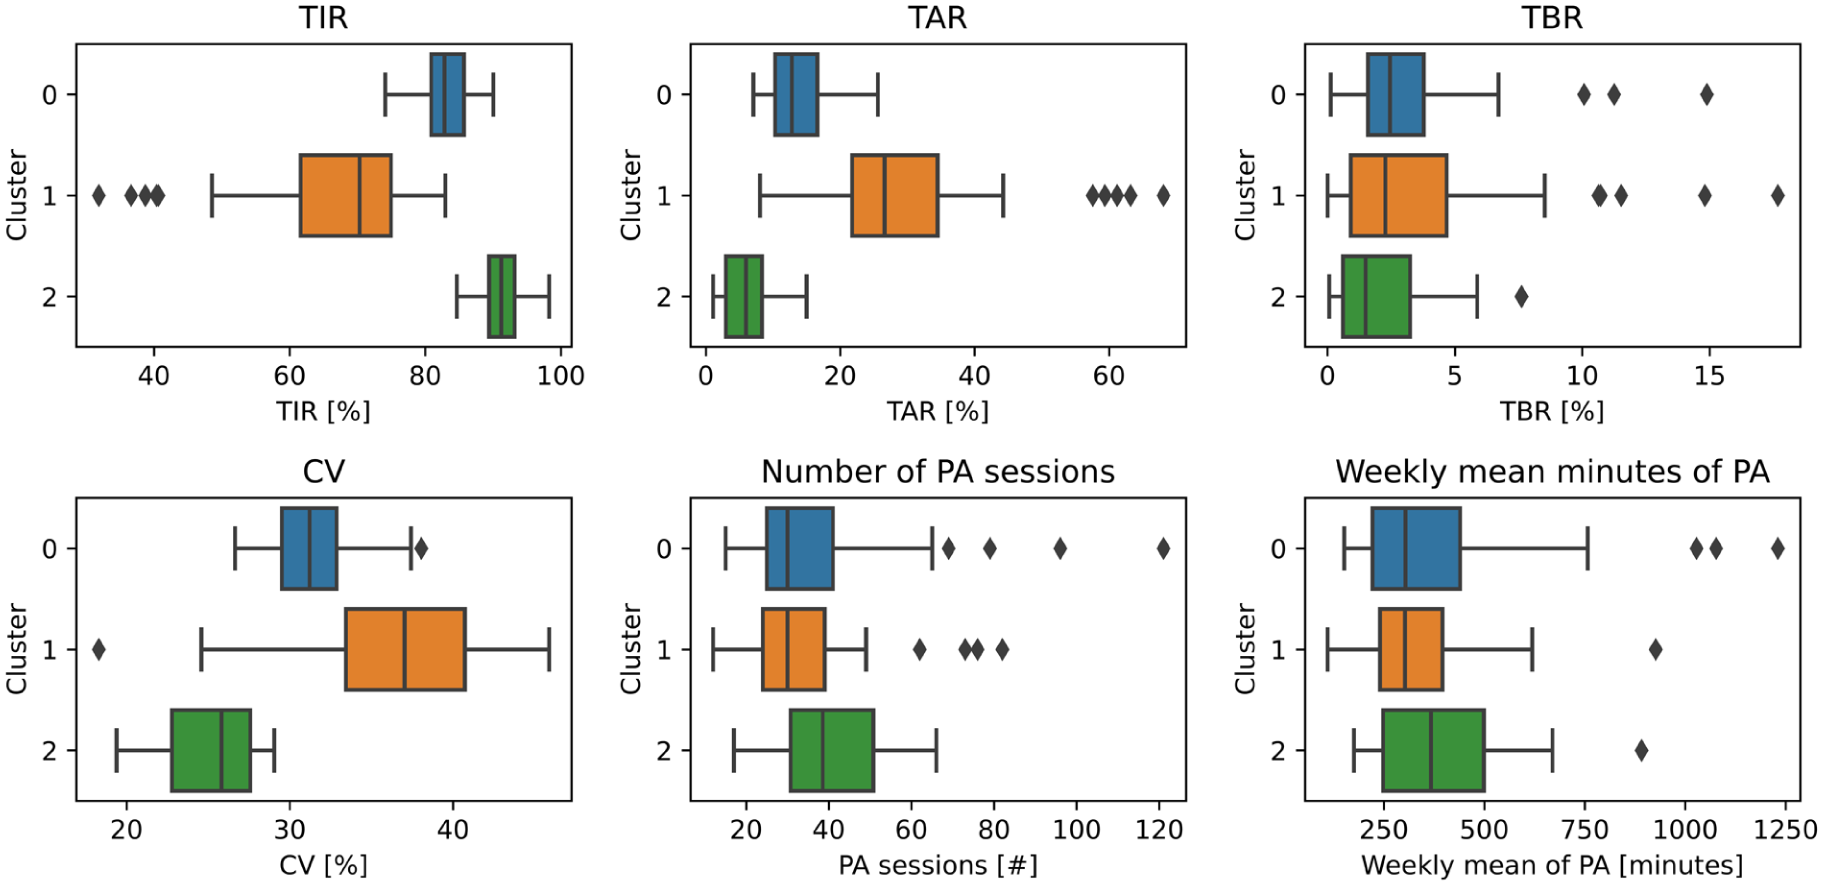
Box-plots of glycemic metrics and PA features by cluster.
Glucose prediction evaluation
To evaluate the clustering results, a glucose predictor based on an LSTM neural network is applied to the SC groups. This section describes the predictor’s architecture, training scheme and performance outcomes.
Neural network predictor architecture and training scheme
The training scheme is based on the use of three out of four available weeks of participant data for training and the remaining week for testing. This approach has been previously employed in related studies 7 to ensure a robust evaluation across different time periods within the T1DEXI data time-series.
Input signals from multiple wearable and monitoring devices, operating at varying frequencies, are resampled to a common 5-min resolution to synchronize processing and match the CGM sampling rate (the target signal). The input set includes CGM glucose measurements, insulin data (IOB, basal and bolus rates), CHO intake (COB and reported CHO), and PA metrics from the Verily Study Watch (step count, HR) and their statistical transformations (mean, SD, skewness) per 5-min window.
A LSTM neural network is employed due to its ability to capture long-term temporal dependencies in time-series, which has proven effective for glucose prediction tasks. 7 The architecture processes sequences of 48 time steps (4 h of history) with 11 input variables per step. It comprises two LSTM layers with 8 units each and tanh activation, followed by two fully connected layers: a 16-neuron dense layer with tanh activation and an output layer with 12 neurons corresponding to the next 12 CGM values (1 h ahead). Dropout layers are included between components to mitigate overfitting by randomly deactivating connections during training with a probability of 0.2. The model is trained using the Adam optimizer to minimize the Mean Absolute Error (MAE) loss over a maximum of 100 epochs, with a batch size of 4096 given the large number of available sequences per participant.
Prediction results at the population and by subject clusters
The trained model is evaluated across prediction horizons of 5, 15, 30, 45, and 60 min. Table 3 summarizes the Root Mean Squared Error (RMSE) at both the population level and within each of the three subject clusters.
Summary of RMSE (mg/dL) performance metrics of the LSTM predictor for glucose prediction at different time horizons in the population set and by cluster.
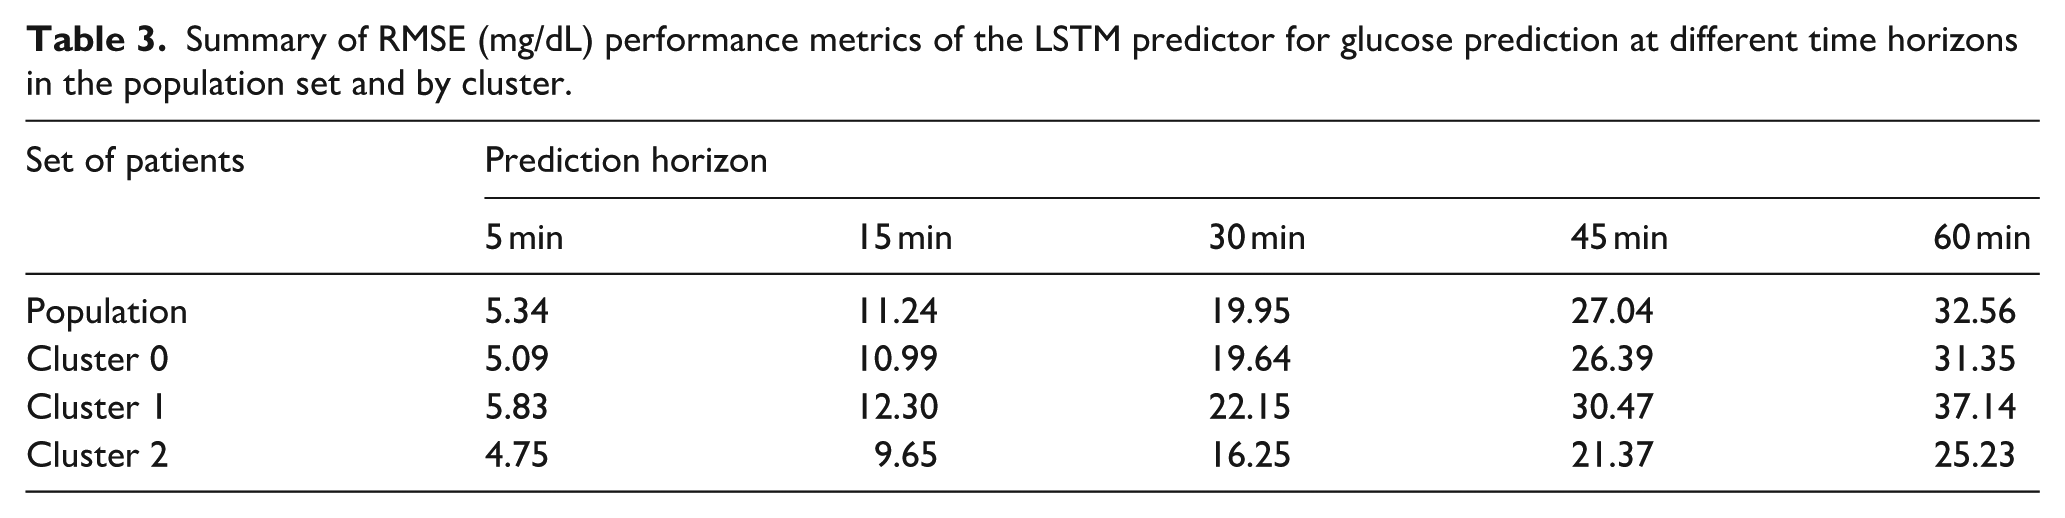
As expected, prediction error increases with longer horizons, consistent with previous findings.5,7 Notably, performance differs substantially across clusters. Cluster 1 consistently exhibits the highest errors, with an RMSE of 22.15 at 30 min (11.0% above the population RMSE of 19.95) and 37.14 at 60 min (14.1% higher than the population value of 32.56). In contrast, Cluster 2 achieves the best performance, with an RMSE of 16.25 at 30 min (18.5% lower than the population average) and 25.23 at 60 min (22.5% lower). Cluster 0 closely aligns with the overall population-level results, showing intermediate values.
A clear relationship emerges between PA patterns, glycemic regularity and predictability: subjects in Cluster 2 (composed of individuals with the best glycemic stability and highest weekly PA levels, aligning with current clinical recommendations in T1D management) achieve the lowest RMSE values across all prediction horizons (5–60 min). In contrast, Cluster 1, which contains individuals with higher variability and poorer control, consistently exhibits higher errors.
In addition, it is well established that fear of hypoglycemia remains one of the main barriers to exercise in individuals with T1D. However, these results suggest that, at least for the population in this study, meeting PA recommendations not only contributes to improved glycemic control but also supports the development of clinically acceptable predictive tools. These tools can provide valuable decision-support information during and after exercise.
Conclusions
The clustering-based stratification highlights the heterogeneous nature of glucose dynamics and their impact on prediction performance. Results from the LSTM-based predictor reveal a consistent link between PA engagement, glycemic stability, and glucose predictability. These results challenge the common perception that PA complicates glucose management, demonstrating instead that regular activity is associated with more stable and predictable glucose dynamics. This relationship supports the development of more reliable DSS for safer PA engagement in PwT1D and may also enhance the performance of artificial pancreas systems, ultimately contributing to better overall glycemic regulation.
Future work will extend the clustering process by analyzing inter-group differences to determine whether clustering based solely on PA-related features can define clinically relevant subgroups. Cluster-specific fine-tuning of the LSTM model will also be investigated to further improve prediction accuracy through personalized forecasting.
Footnotes
Data availability
The authors are not the owners of the dataset used in this study. This publication is based on research using data from the Type 1 Diabetes Exercise Initiative (T1DEXI) Study, available from Vivli Inc. under controlled access (Vivli-ID: VIV00008428). Vivli Inc. has not contributed to or approved, and is not in any way responsible for, the contents of this publication.
Declaration of conflicting interests
The authors declared no potential conflicts of interest with respect to the research, authorship, and/or publication of this article.
Funding
The authors disclosed receipt of the following financial support for the research, authorship, and/or publication of this article: This research was funded by the Universidad Nacional de La Plata (Project I283) and CONICET (PIP 112-2020-0102595).