
Abstract
Conventional blood flow-loop systems, employing animal or rarely fresh human blood, used in in vitro testing of blood-contact devices fail to simulate the actual physiological conditions. This study aims to develop a metabolically sustainable blood flow loop system to be used in cardiovascular device testing, by integrating nutrition, oxygenation, and dialysis modules. Two flow loop systems with human blood were compared: (1) control circuit with oxygenation and (2) experimental circuit with the addition of nutrition, oxygenation, and dialysis modules. Blood was circulated for 12 and 48 h, and hemolysis (NIH, pfHb, bilirubin, haptoglobin), blood gases (pH, glucose, lactate), inflammation (IL-8, TNF-α, C3a), coagulation (fibrinogen, TAT), platelet/endothelial activation (β-TG, vWF), and ferritin levels were measured over time. While pH decrease, lactate increase, and inflammatory/coagulation markers increased in the control group, these parameters were stable or decreased in the dialysis group. NIH was 77%–81% lower in dialysis, and vWF decreased 55%–73% in dialysis while increasing in control (p < 0.05). The improved flow loop system reduced hemolysis, inflammation, and coagulation by maintaining the metabolic balance and biochemical integrity of blood during long-term circulation. This approach has the potential to improve in vitro testing of blood-contacting medical devices.
Keywords
Introduction
In the development of Class III cardiovascular devices, such as mechanical heart valves and ventricular assist devices, in vitro blood flow-loop testing is essential for design validation, reducing animal use, and minimizing first-in-human risks. Yet, current setups show high methodological variability due to differences in blood source, anticoagulation, circuit design, flow conditions, and sampling protocols, while inherent subject-to-subject variation in blood properties further limits interlaboratory comparability.1–3 Therefore, the FDA’s published step-by-step protocol and criteria emphasize the need for standardization in in vitro flow loop design. Recent dynamic loop studies have also highlighted the need for a reliable in vitro thrombogenicity assessment method.4,5
Hemocompatibility assessment of cardiovascular devices, guided by ISO 10993-4, requires monitoring hemolysis, coagulation, platelet/leukocyte activation, and complement activity, typically measured in static or shear flow models. Yet, test conditions strongly affect reliability, and recent reviews highlight that while ISO 10993-4 compliance is essential, it is not sufficient—particularly since coagulation–inflammation crosstalk must also be considered. 6 A major overlooked aspect of cardiovascular device flow loops is their treatment of blood. Classical systems regard blood as an inert fluid, ignoring its metabolically active, tissue-like nature and may utilize clinically unrealistic anticoagulation strategies. Despite lacking nuclei, erythrocytes remain “alive” through glycolysis, redox balance, ATP/2,3-DPG regulation, and ion transport; disruption of these processes impairs deformability, oxygen delivery, and leads to pH drift and lactate accumulation. Such metabolic decline, well-documented in storage lesion studies, can occur within hours without proper nutrition and gas exchange. Consequently, flow loops lacking glucose supply, oxygenation, and waste removal may distort the biological impact of mechanical stress, causing misinterpretation of device performance.7,8
Interaction of cardiovascular devices with blood involve not only hemolysis but also subhemolytic damage, including loss of erythrocyte deformability, platelet and complement activation, and endothelial-like responses. These indices are strongly influenced by blood physiology, while hydrodynamic factors such as shear stress and flow separation in circulatory systems can cause cumulative cellular and plasma injury even below the hemolysis threshold.9–11 Through the standardization efforts in the device-testing literature, e.g. FDA guidance tools, 4 ASTM-based cellular count and activation measurements 12 , it is increasingly recognized that devices that incorporate long-term metabolic support will increase accuracy and clinical predictive power. Studies of artificial organ perfusion have shown that nutrient/oxygen supply and waste control can maintain tissue viability over hours to days, and it is logical to apply similar principles to blood-contact device testing.4,6,13,14
Thus the starting point of the present study is to establish a long-term flow-loop integrating the dialysis circuit (waste removal/ion balance), oxygenation, and nutrition modules to meet the metabolic demands of blood as a “living tissue.” This approach should more accurately capture the biological consequences of mechanical trauma and reducing the variance of multi-pronged hemocompatibility outcomes. As demonstrated in this study, the integrated approach enables the assessment of a comprehensive biomarker panel—including hemorheological deformability, hemolysis (pfHb, NIH), inflammation (IL-8, TNF-α, C3a), coagulation–fibrinolysis (TAT, fibrinogen, D-dimer), platelet and endothelial activation (β-TG, vWF), and oxidative stress (ferritin). Importantly, these biomarkers exhibit greater temporal stability and more closely reflect clinically relevant physiological conditions. Consequently, the reliability of in vitro loop testing is improved, and design comparisons, threshold interpretation, and clinical translatability are placed on a more robust and physiologically relevant foundation.
Materials and methods
In vitro flow loop
This study was approved by the Institutional Ethics Committee of Istanbul Medipol University (E-10840098-772.02-7509, 29/11/2023), in accordance with the Declaration of Helsinki. The blood sample was obtained post-operatively from a cardiopulmonary by-pass (CPB) circuit of patients who has undergone an event-free open-heart surgery. A maximum 500 ml of blood was used for each test run. The blood was divided into two separate blood bags as control and study (dialysis) group. First, the tubing and components were primed and de-aired using a crystalloid solution (0.9% saline). The 250 mL of patient blood was then introduced into this primed circuit. All blood samples were prepared identically, checked for freshness and properties, and monitored with blood gas values. Fresh, heparinized human whole blood was used in the experiments with Hct value was 30% ± 5.7%, and the total blood volume was 200 ± 10 mL. The total hemoglobin at initial time (0 min) was 10.4 ± 2.2 g/dL. Each circuit consisted of a closed circuit, prevented from contact with air. The following parameters were kept constant throughout the experiment: circuit volume: 0.2 L, pump speed: 500 rpm, flow rate: 0.04 ± 0.01 L/min, temperature: 37 °C (normothermal). Circuit components included: Novalung system for ECMO (Fresenius Medical Care, Bad Homburg, Germany), DeltaStream3® (DP3) diagonal rotary pump (Medos Medizintechnik AG, Stolberg, Germany), pediatric oxygenator (Capiox FX05; Terumo Corporation, Tokyo, Japan), polyvinyl chloride (PVC) circuit tubing, heater chamber for warming the blood, roller clamp (to adjust pressure), connectors for collecting blood and measuring pressure, three-way valves, flowmeter, and pressure sensors. The measured length of the main tubing was 102 ± 5 cm for the control circuit and 105 ± 5 cm for the dialysis circuit. The flow rate was measured using an ultrasonic flow sensor calibrated for human blood (Transonic Systems, Inc., Ithaca, NY, USA). The pressure of the pump was measured using pressure sensors (DBPT-0203; Hisern Medical, Shaoxing, Zhjiang, China). A photograph from the experiment and schematic diagram of in vitro blood flow loop were shown in Supplementary Material 1.
Metabolic activity of blood was measured with ABL800 FLEX blood gas analyzer (Radiometer, Denmark). If the glucose levels decrease below 60 mg/dL, commercially available parentanal nutrition (PN) solution (Numeta G13; Baxter, USA) was added to circuit to maintain the blood cell viability in dialysis groups. Dialysis was done with hemodialyzer machine (Prismaflex System; Baxter, USA) and dialyzer filter set (HF20, Prismaflex™; Baxter, USA). For the control group there was only oxygenator to provide gas exchange of the circuit (O2, N2, CO2) without any dialysis or nutrition. During the experiments, blood samples were collected through the sample port at 0, 2, 4, 6, 8, 10, and 12 h for “12 h dialysis” and 0, 3, 6, 12, 18, 24, 30, 36, 42, and 48 h for “48 h dialysis.” For each test of run, sample size is 3, both 12- and 48-h dialysis and their control groups have repeated for three times (n = 3 pairs/group). Blood samples was centrifuged immediately after collection at 1500g for 15 min at 4 °C. Seperated blood plasma was stored at −80 °C until its use in experimental protocols.
Blood gas values
Acid-base balance of the circuit was followed by measuring the partial pressures of oxygen (pO2) and carbon dioxide (pCO2), pH, and bicarbonate values (glucose, lactate, and base deficit/excess (BE)).
Eryhrocyte deformability
The measurement of erythrocyte deformability was conducted by a laser-assisted optical rotational cell analyzer (LORCA MaxSis; Mechatronics, Netherlands). A laser beam is diffracted by RBCs as it traverses through the blood sample. Elongation index (EI) was calculated as follows: EI = (a − b)/(a + b), where “a” is the vertical axis and “b” is the horizontal axis of the diffraction pattern. Deformability curves were obtained by plotting EI versus applied shear stress (SS) level as in our previous work.15,16
Normalized index of hemolysis (NIH)
Hematocrit (Hct) of the blood samples was measured by a hematocrit ruler. Cyanmethemoglobin method was used for the measurement of plasma free hemoglobin (Hb) as described in a previous study. 15 Normalized index of hemolysis (NIH) were calculated according to Sinan et al. 16
Biomarker detection
Concentrations of the following biomarkers were determined from blood plasma samples for each time points of experiments: hemolysis markers: haptoglobin, bilirubin; coagulation activation: fibrinogen, D-dimer, thrombin–antithrombin complex (TAT); platelet activation: von Willebrand factor (vWF), β-thromboglobulin (β-TG); inflammation markers: interleukin-8 (IL-8), TNF-alpha (TNF-α), C3a; iron metabolism: ferritin. 17 All measurements were performed using BTLab® (Shanghai, China) brand commercial ELISA kits according to the manufacturer’s instructions. For each protein, measurements were performed in triplicate and concentration calculations were performed from the standard curve. Optical density measurements were performed using a microplate reader (Multiskan FC; Thermo Scientific, USA) at a wavelength of 450 nm.
Statistical analysis
All statistical analyses were performed by MATLAB® Statistics and Machine Learning Toolbox (MathWorks). Wilcoxon signed-rank test was used for comparison between control and study groups. Data are presented as mean ± standard deviation, and statistical significance is indicated by *p < 0.05, **p < 0.01, ***p < 0.001, ****p < 0.0001.
Results
In this study, hemolysis, inflammation, coagulation, and platelet activation of blood were reported to discuss the dialysis and nutrition supplement effect on flow loop system.
Blood gas values
Figure 1 shows the blood gas values from both groups. In 12-h experiments, pH remained stable in both groups. In 48-h studies, pH in controls declined after hour 42 and reached acidotic levels at hour 48 (p < 0.05), whereas dialysis maintained physiological values. Glucose decreased in both groups, but from hour 36 onward controls had significantly lower levels (p < 0.05). Lactate rose modestly in 12-h experiments and was higher in controls after hour 8. In 48-h studies, lactate in controls increased sharply after hour 24, peaking at hour 48 (p < 0.01), while the rise was limited with dialysis.
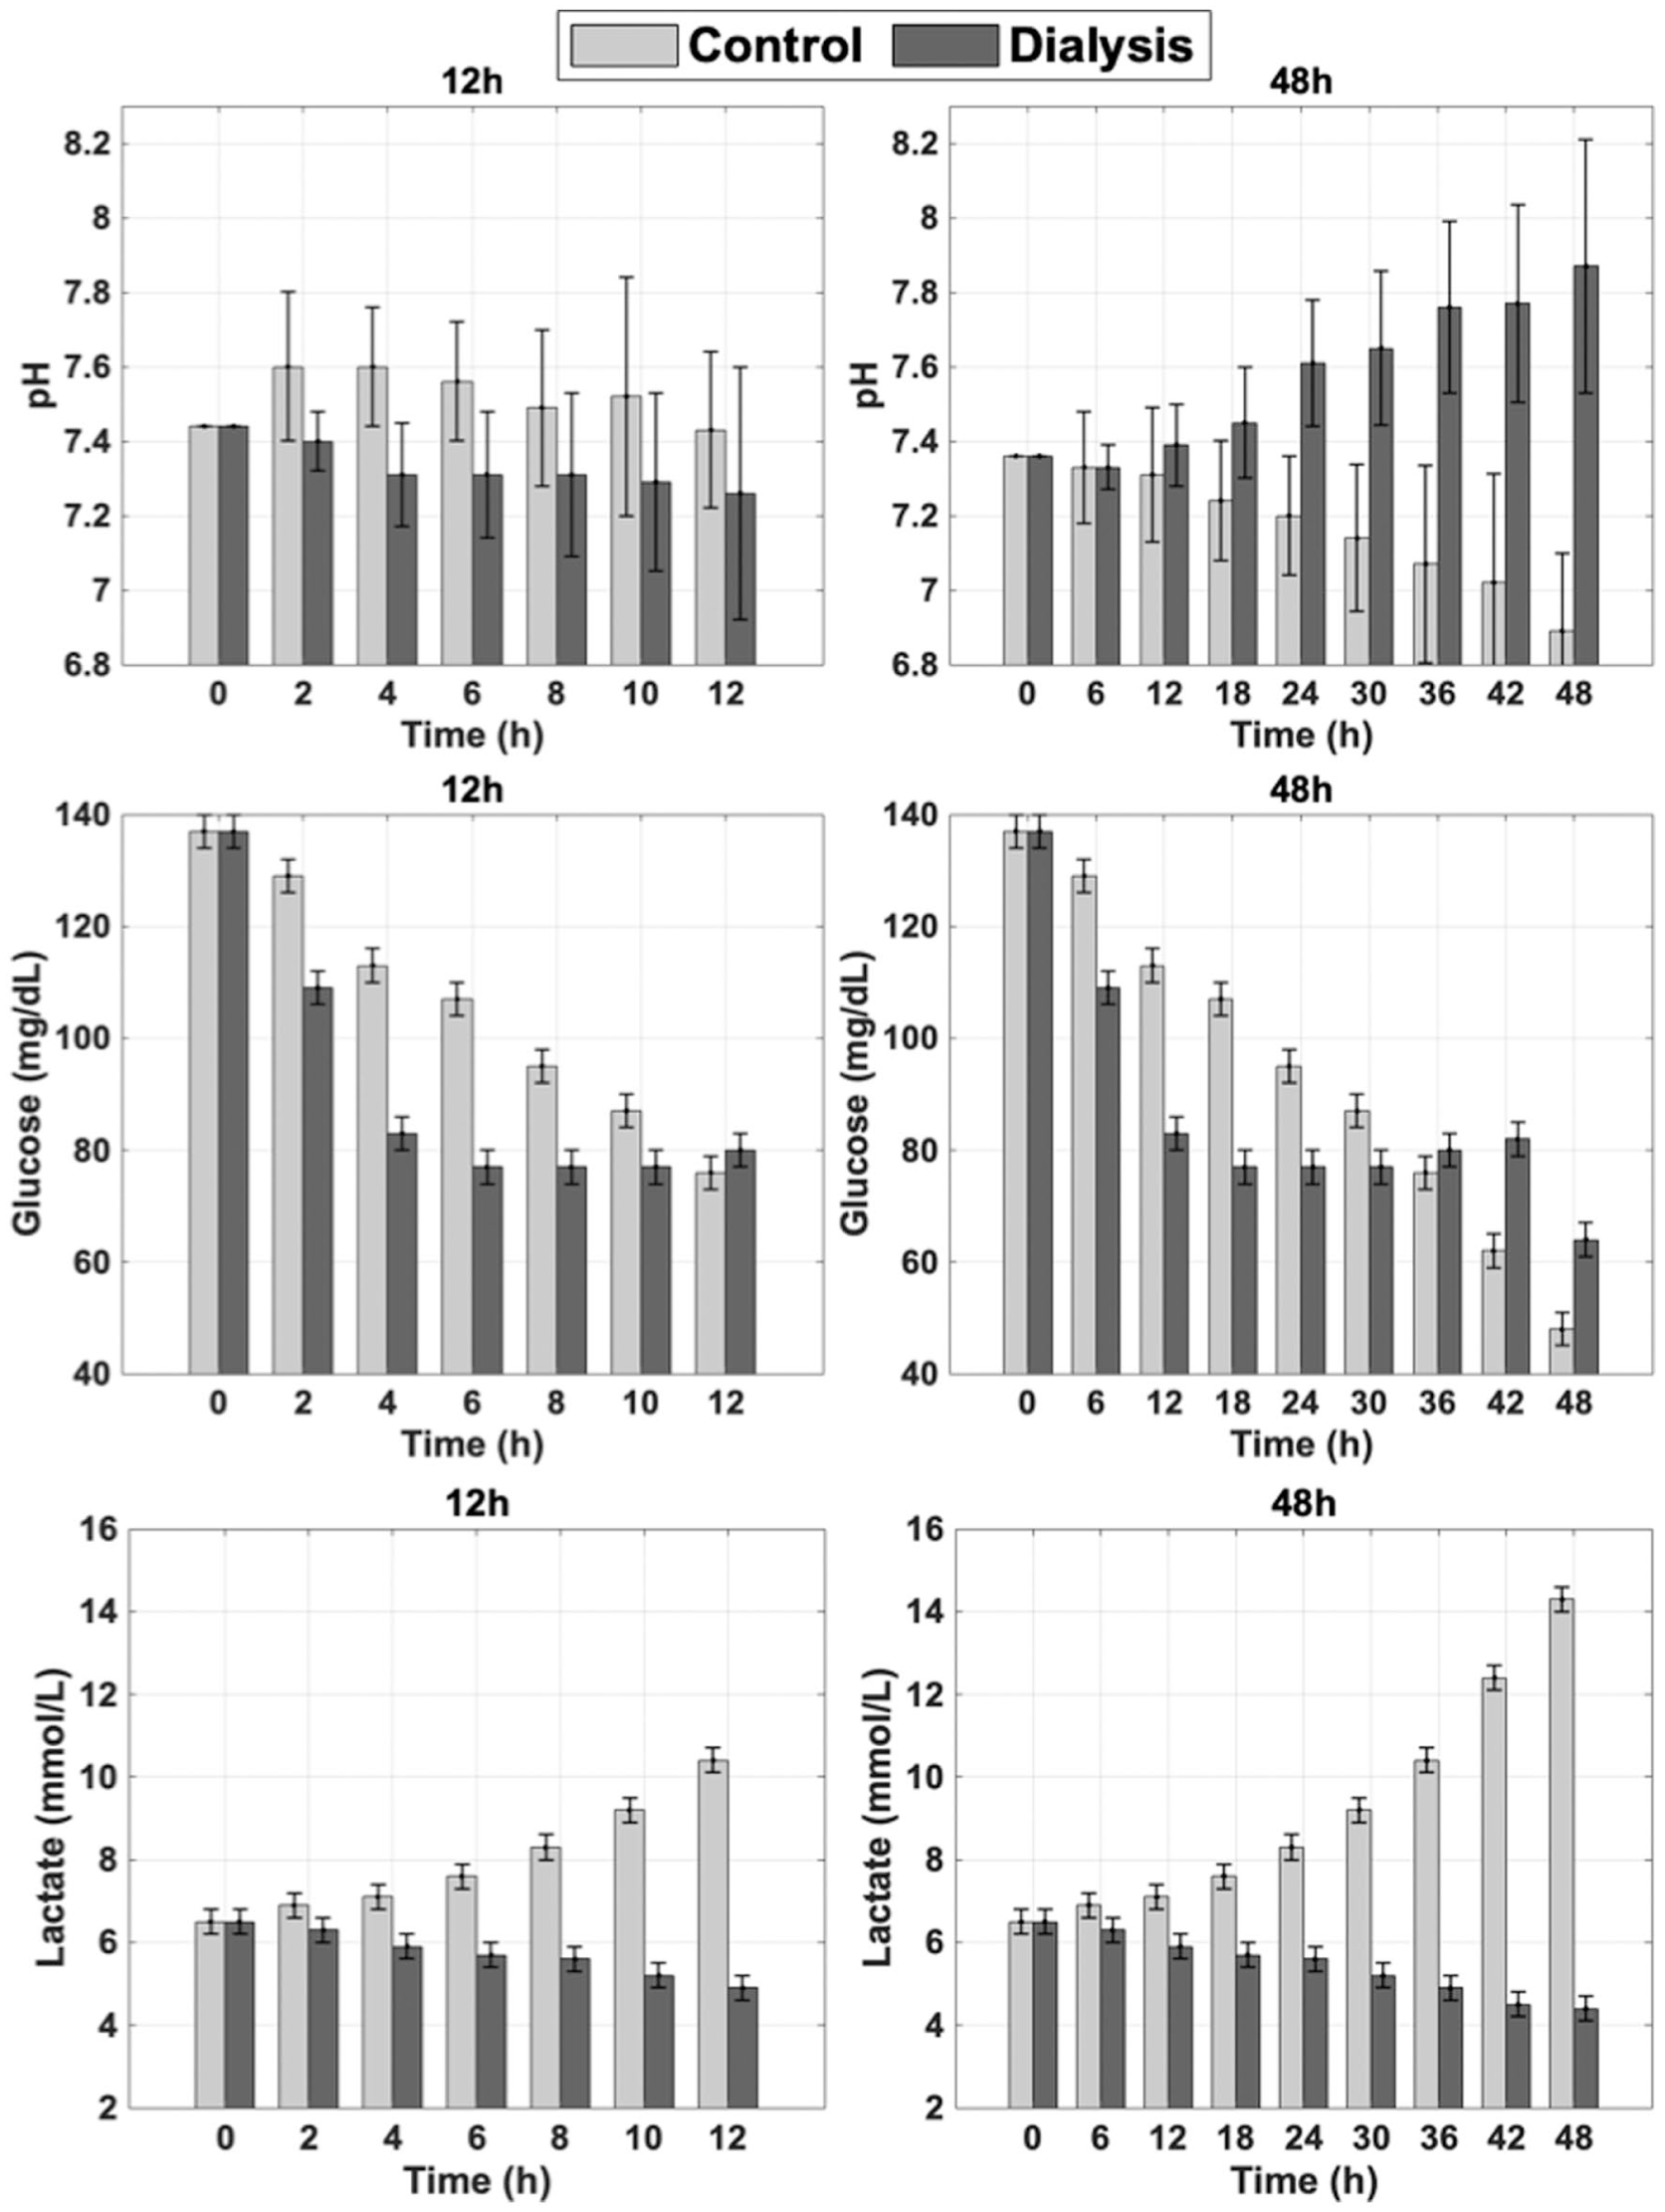
Blood gas values (pH, glucose, lactate) for both 12 and 48 h studies with different times: control (light gray) and dialysis (dark gray). Error bars shows standard deviation.
Erythrocyte deformability
Figure 2 shows erythrocyte deformability in both groups. Controls started with higher EI values across shear stresses, with only minimal changes over time. Dialysis initially caused significantly lower EI values at both low (⩽10 Pa) and high (⩾30 Pa) stresses (p < 0.05), indicating impaired deformability. However, EI increased significantly during incubation, particularly at 48 h (p < 0.05), suggesting partial recovery. The findings in this study suggest that dialysis significantly reduced erythrocyte deformability initially compared to the control group, but this effect partially recovered after prolonged incubation.
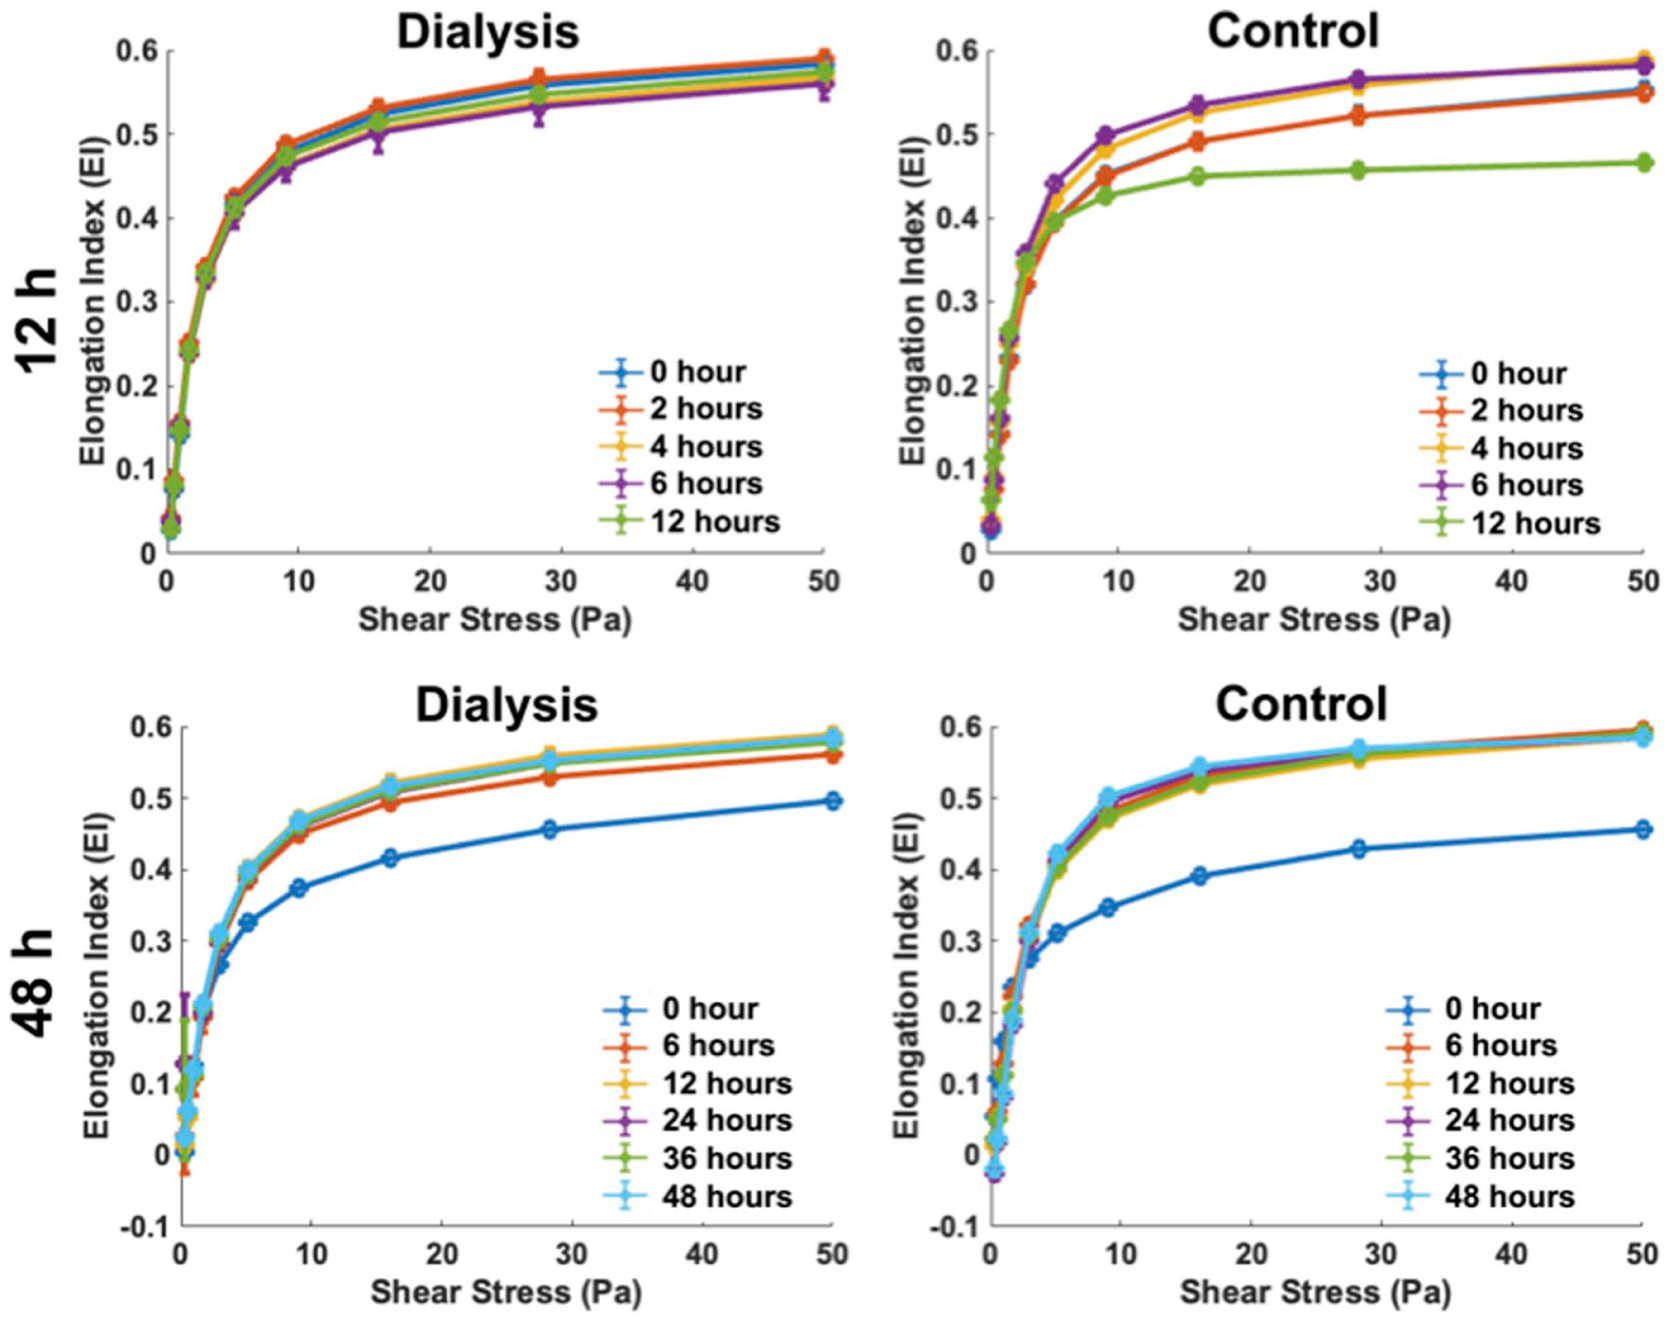
Erythrocyte deformability curves measured at different times in dialysis (left) and control (right) groups from both studies. EI was determined by the LORCA method under increasing shear stresses in the range of 0–50 Pa. Upper panel: measurements up to 12 h; lower panel: measurements up to 48 h.
Normalized index of hemolysis
Figure 3 presents hemolysis data by NIH and ΔpfHb. In 12-h studies, NIH in controls was significantly higher at 6 and 12 h, being approximately four-fold greater than dialysis at 12 h (0.117 vs 0.027 g/100 L; p < 0.0001). The trend persisted at 48 h, with controls approximately five-fold higher (0.052 vs 0.010 g/100 L; p < 0.0001). In the long-term (48 h) experiments, the control circuit exhibited a transient decrease in NIH levels at the 24 h time point (Figure 3, top right), followed by a significant increase at 48 h. PfHb in controls rose linearly, reaching ~32 mg/dL at 12 h and ~60 mg/dL at 48 h, whereas dialysis showed decreasing or stable levels below baseline (R2 = 0.95–0.96).
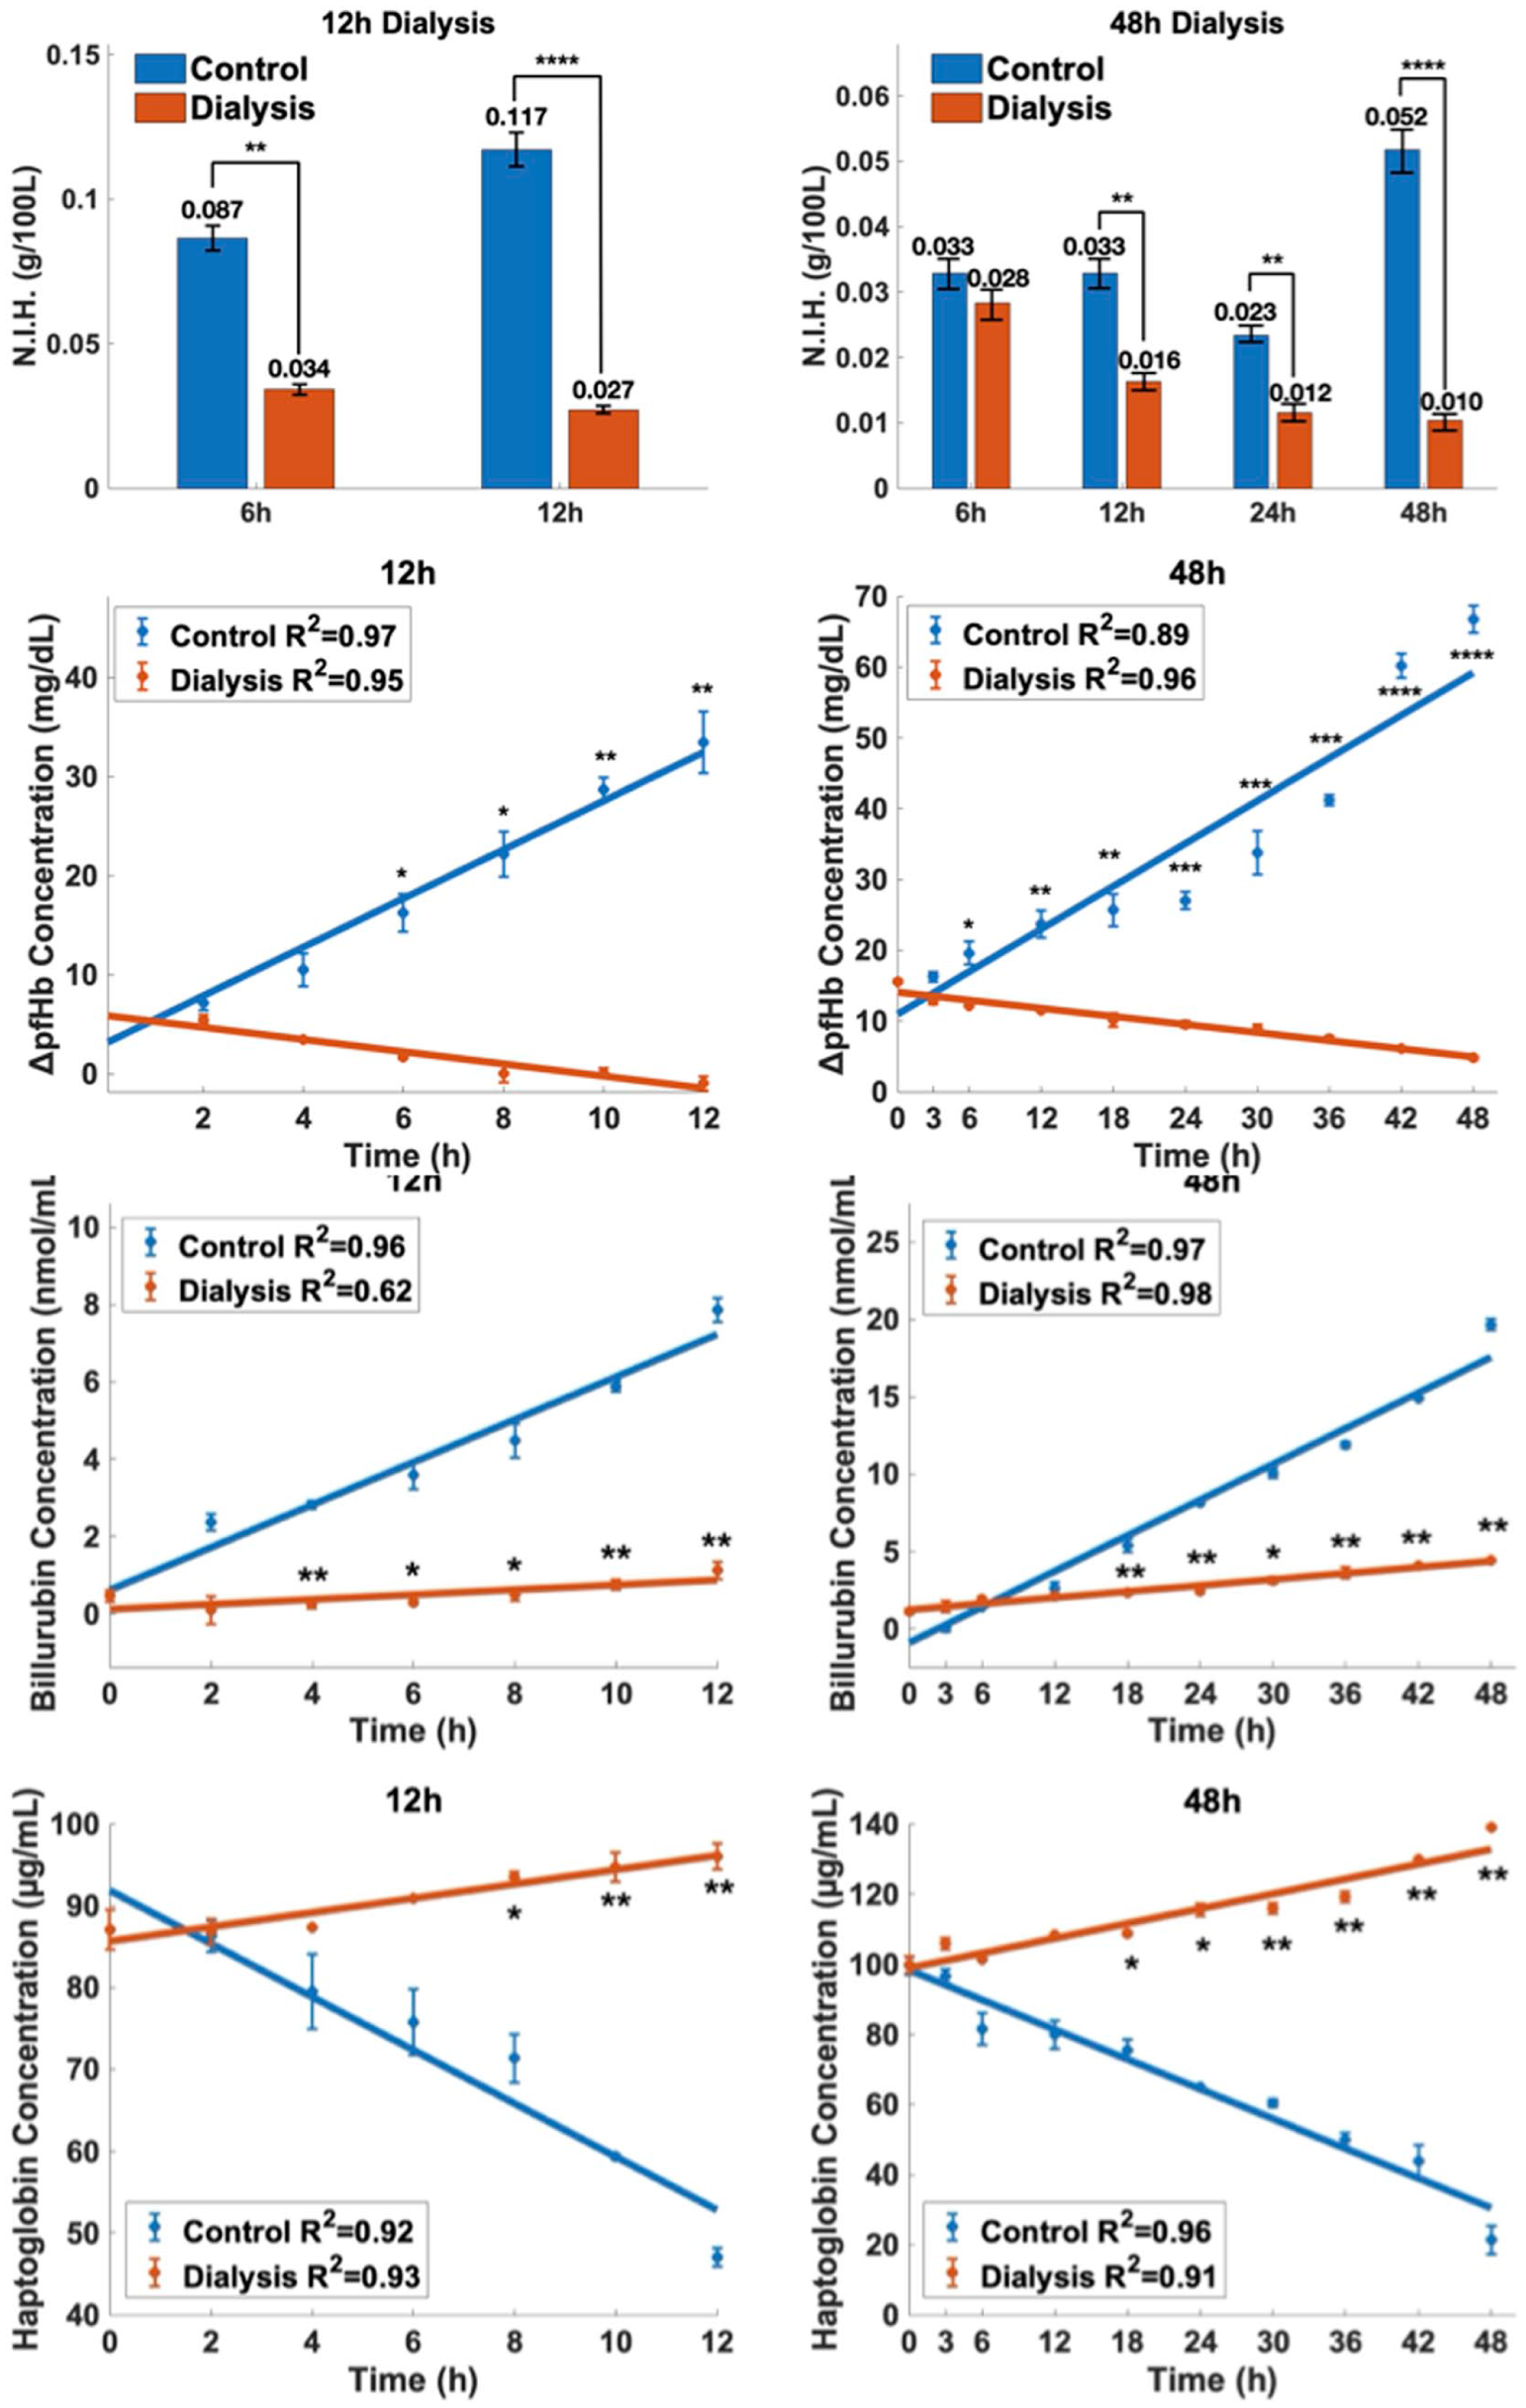
Changes in normalized hemolysis index (NIH), free hemoglobin (ΔpfHb) billurubin and haptoglobin concentrations in the control (orange) and dialysis (blue) groups. Left panels show 12-h experiments and right panels show 48-h experiments. The first row presents NIH values at different time points and the second row shows ΔpfHb increase curves with linear regression analyses. The third and fourth rows depict bilirubin and haptoglobin concentrations, respectively, during the experimental periods. Linear regression fits are indicated with R2 values. Statistical significance is indicated by *(p<0.05), **(p<0.01), ***(p<0.001), ****(p<0.0001).
Biomarker detection
Hemolysis
Figure 3 also presents bilirubin and haptoglobin changes paralleling hemolysis. In 12-h studies, bilirubin in controls rose markedly to ~6 nmol/mL (R2 = 0.96), while dialysis showed minimal increase (~R2 = 0.62), with significantly lower values at multiple time points (p = 0.007–0.003). At 48 h, bilirubin reached ~20 nmol/mL in controls versus ~6 nmol/mL in dialysis (p < 0.01). Haptoglobin showed the opposite trend: controls decreased to ~60 µg/mL at 12 h (R2 = 0.92) and ~40 µg/mL at 48 h (R2 = 0.96), whereas dialysis increased slightly at 12 h (~R2 = 0.93) and rose continuously to ~125 µg/mL by 48 h (R2 = 0.91), with significant group differences at later time points.
Inflammatory response and complement activation
Figure 4 presents C3a, IL-8, and TNF-α levels. In 12-h studies, C3a rose significantly in controls to ~70 ng/mL (R2 = 0.98) but remained stable with dialysis (R2 = 0.20), with group differences at 10–12 h (p < 0.01). At 48 h, C3a in controls approached 100 ng/mL (R2 = 1.00), while dialysis showed minimal increase (R2 = 0.27), with significant differences at all time points (p < 0.001). IL-8 increased linearly in controls (12 h R2 = 0.97; 48 h R2 = 0.97), exceeding 500 pg/mL at 48 h, but declined in dialysis (R2 = 0.97–0.98), with significant differences from hour 4 in 12 h tests and from hour 6 onward in 48 h tests (p < 0.01). TNF-α also rose linearly in controls (12 h R2 = 0.99; 48 h R2 = 0.97), reaching ~30 pg/mL at 48 h, but decreased with dialysis (R2 = 0.96–0.97), with significant differences starting at hour 4 (12 h) and hour 3 (48 h; p < 0.05–0.0001).
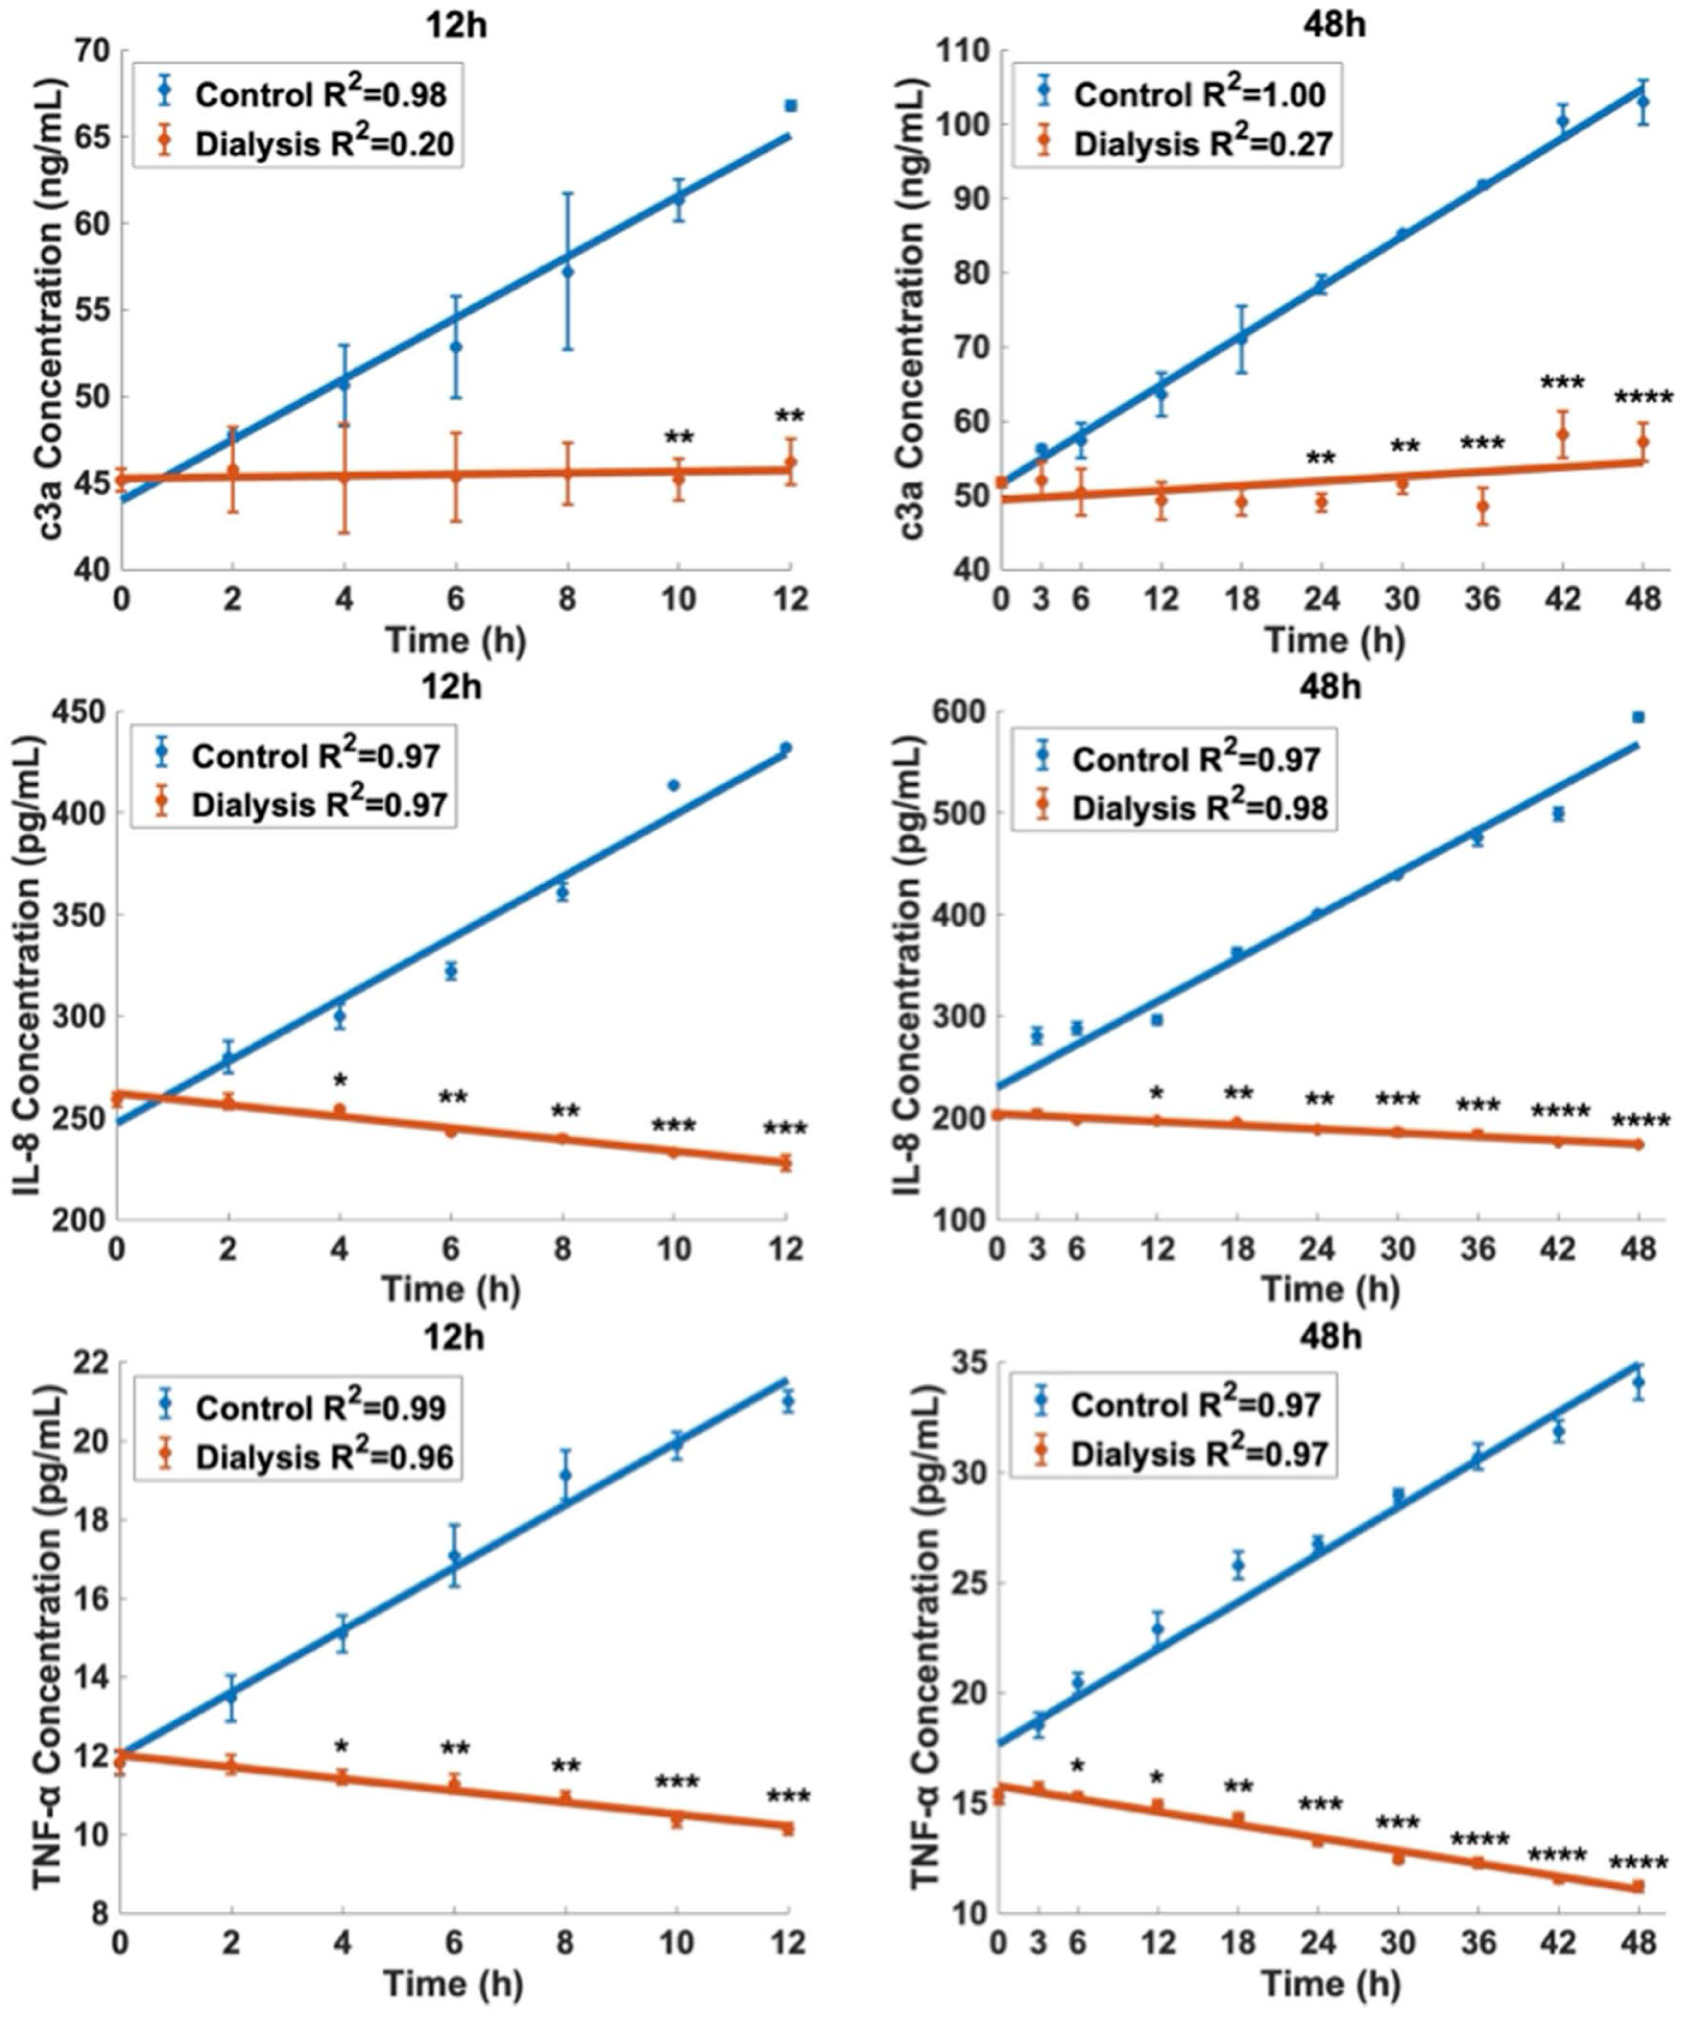
Inflammatory markers which are C3a, IL-8, and TNF-α concentrations in the control (blue) and dialysis (orange) groups during the 12-h (left) and 48-h (right) experimental period. Linear regression analyses are shown with R2 values. Statistical significance is indicated by *(p<0.05), **(p<0.01), ***(p<0.001), ****(p<0.0001).
Coagulation
Figure 5 shows coagulation biomarkers fibrinogen, D-dimer, TAT. In 12-h studies, fibrinogen rose in controls (R2 = 0.97) but declined slightly with dialysis (R2 = 0.95), with significant group differences at multiple time points (p = 0.043–0.002). At 48 h, fibrinogen increased markedly in controls (R2 = 0.99) but remained minimal with dialysis (R2 = 0.97), with highly significant differences at all times (p < 0.001). D-dimer also increased steadily in controls (R2 = 0.98; 0–12 h, R2 = 0.93; 0–48 h), reaching >2000 ng/mL at 48 h, while dialysis showed decreasing or low levels (R2 = 0.94–0.99), with significant differences from hour 4 (12 h) or hour 6 (48 h) onward (p < 0.01–0.0001). TAT rose in controls at both time points (R2 = 0.90–0.98) but decreased with dialysis (R2 = 0.98–0.99), with significant differences starting at hour 4 (p = 0.016–<0.001).
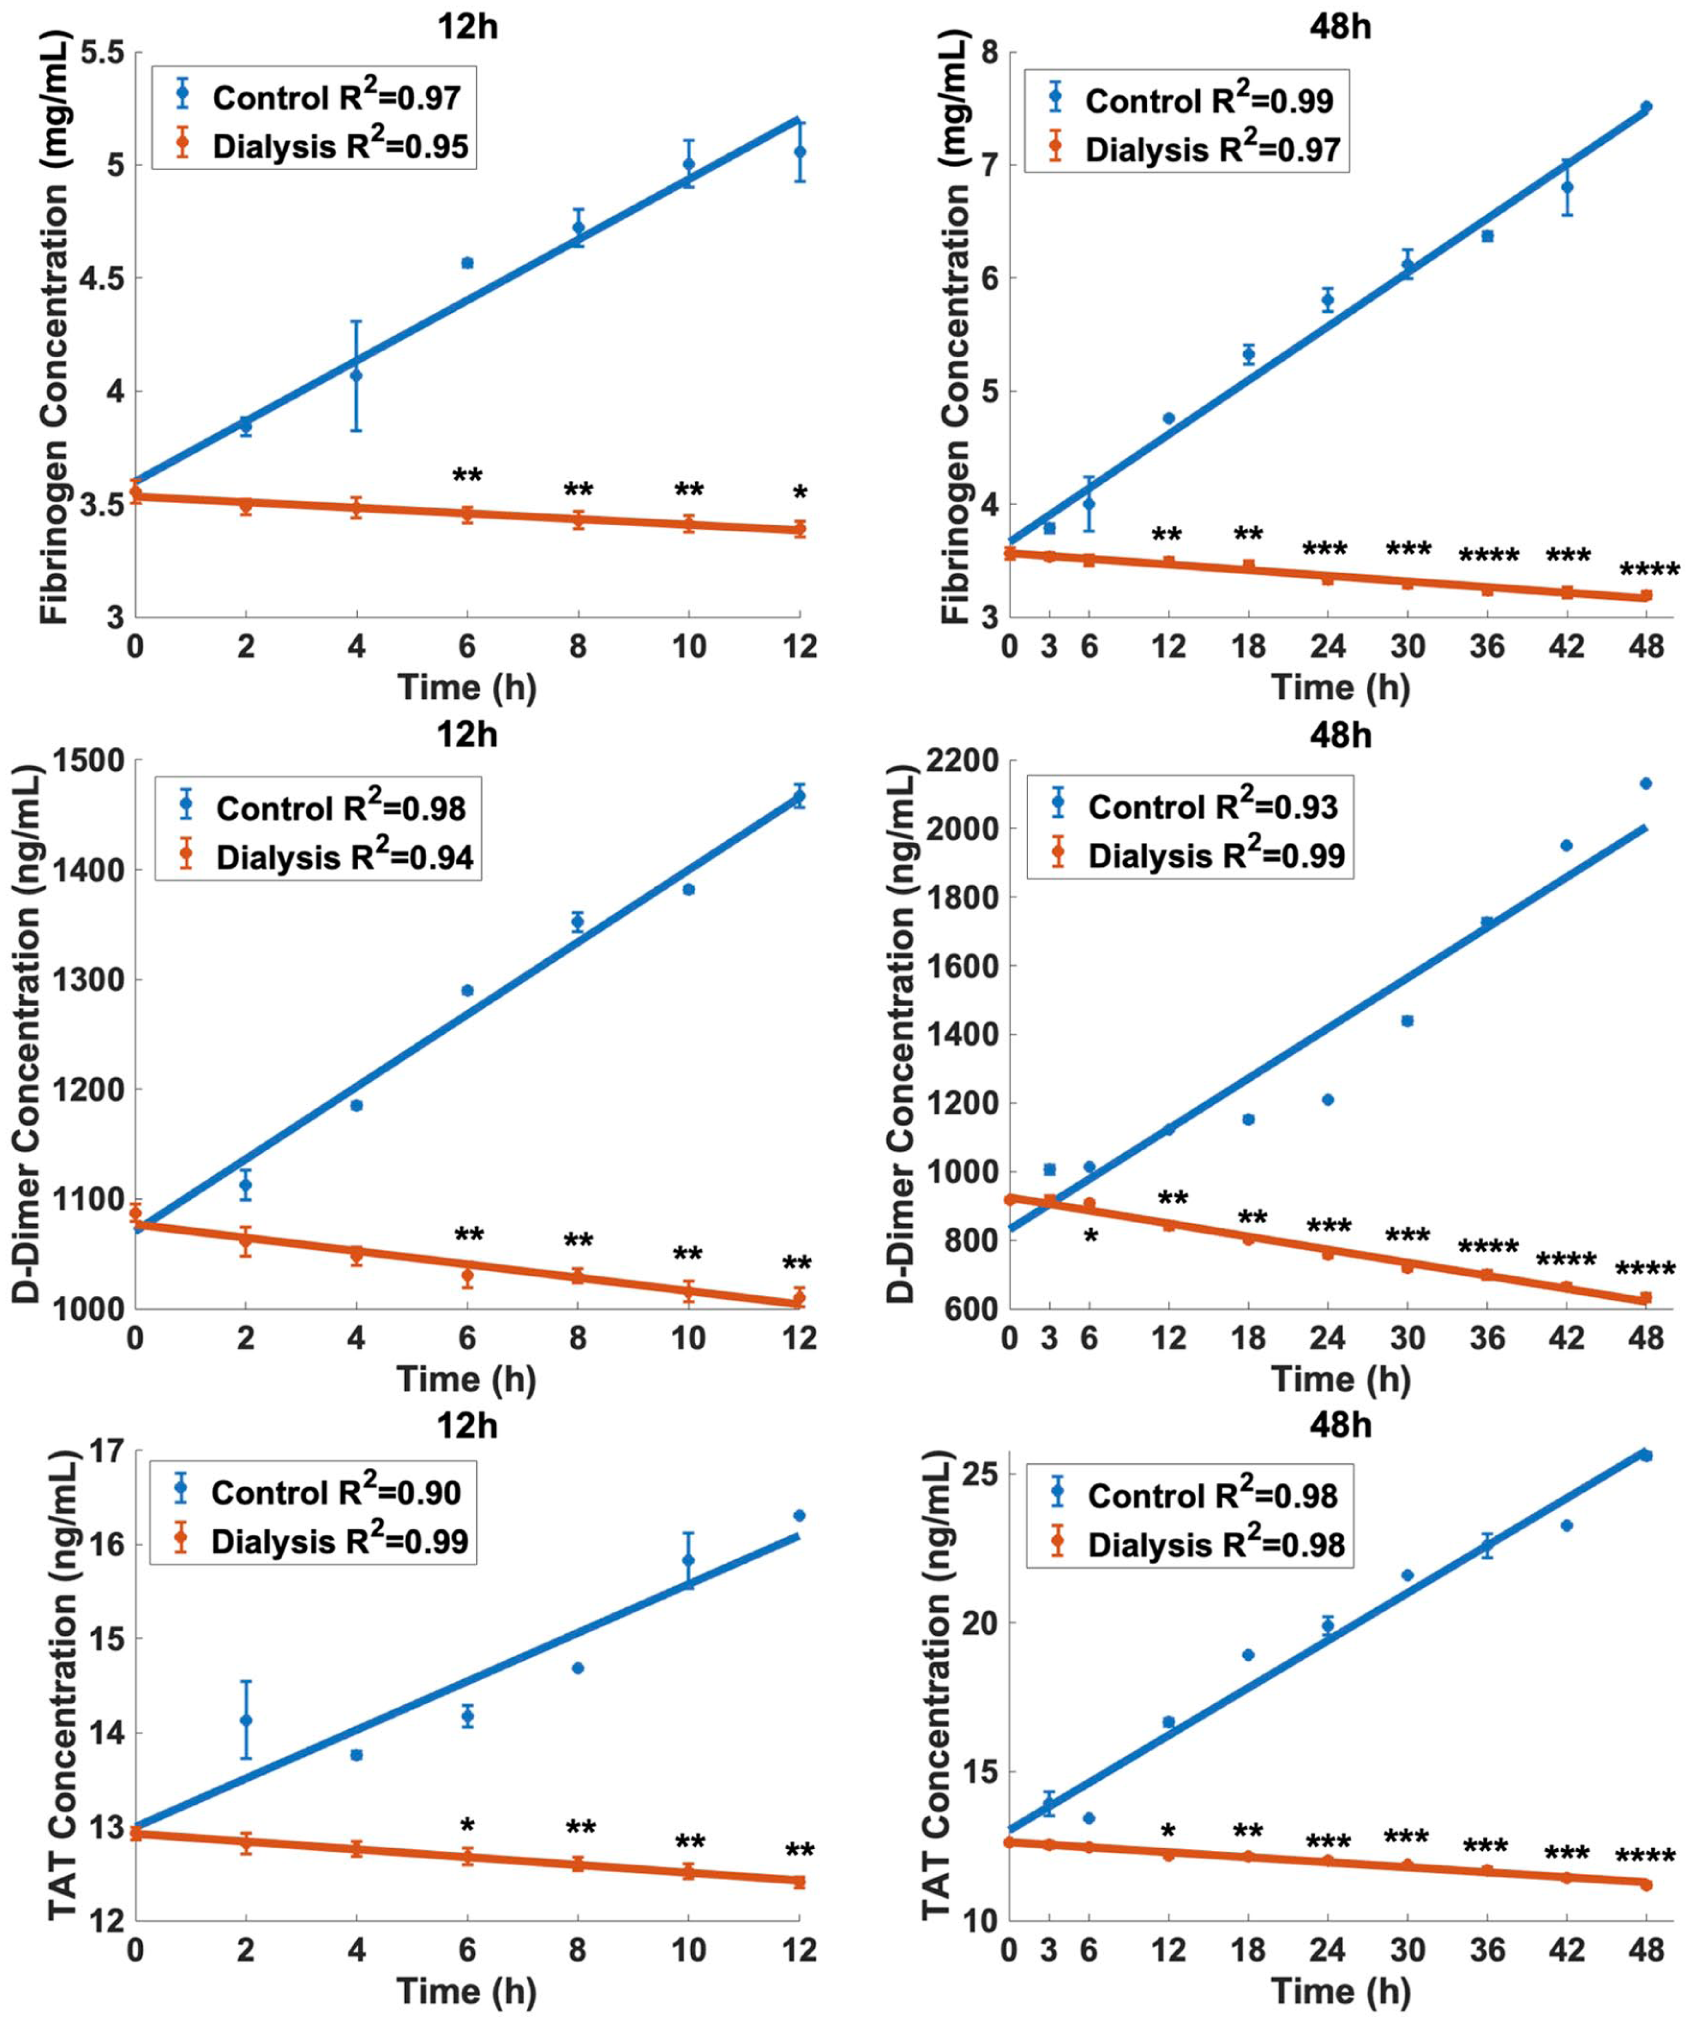
Coagulation biomarkers fibrinogen (mg/dL), D-dimer (ng/mL), and TAT (ng/mL) were evaluated during the 12-h (left) and 48-h (right) experimental periods in the control (blue) and dialysis (orange) groups. Linear regression analyses are shown with R2 values. Statistical significance is indicated by *(p<0.05), **(p<0.01), ***(p<0.001), ****(p<0.0001)
Platelet activation
Figure 6 shows platelet activation biomarkers β-TG and vWF. In 12-h studies, β-TG increased linearly in controls to ~22 ng/mL (R2 = 0.97) but decreased slightly with dialysis (R2 = 0.98), with significant differences at 6–12 h (p = 0.003–0.035). At 48 h, β-TG rose further in controls (~30 ng/mL; R2 = 0.97) but declined in dialysis (R2 = 0.98), with significant differences at all times (p < 0.05–<0.0001). Similarly, vWF increased in controls (~40 µg/mL at 12 h, ~45 µg/mL at 48 h; R2 = 0.96–0.98) but decreased in dialysis (R2 = 0.83–0.98), with significant group differences at 6–12 h in short-term studies and at all time points from hour 6 in 48 h studies (p < 0.01–0.0001).
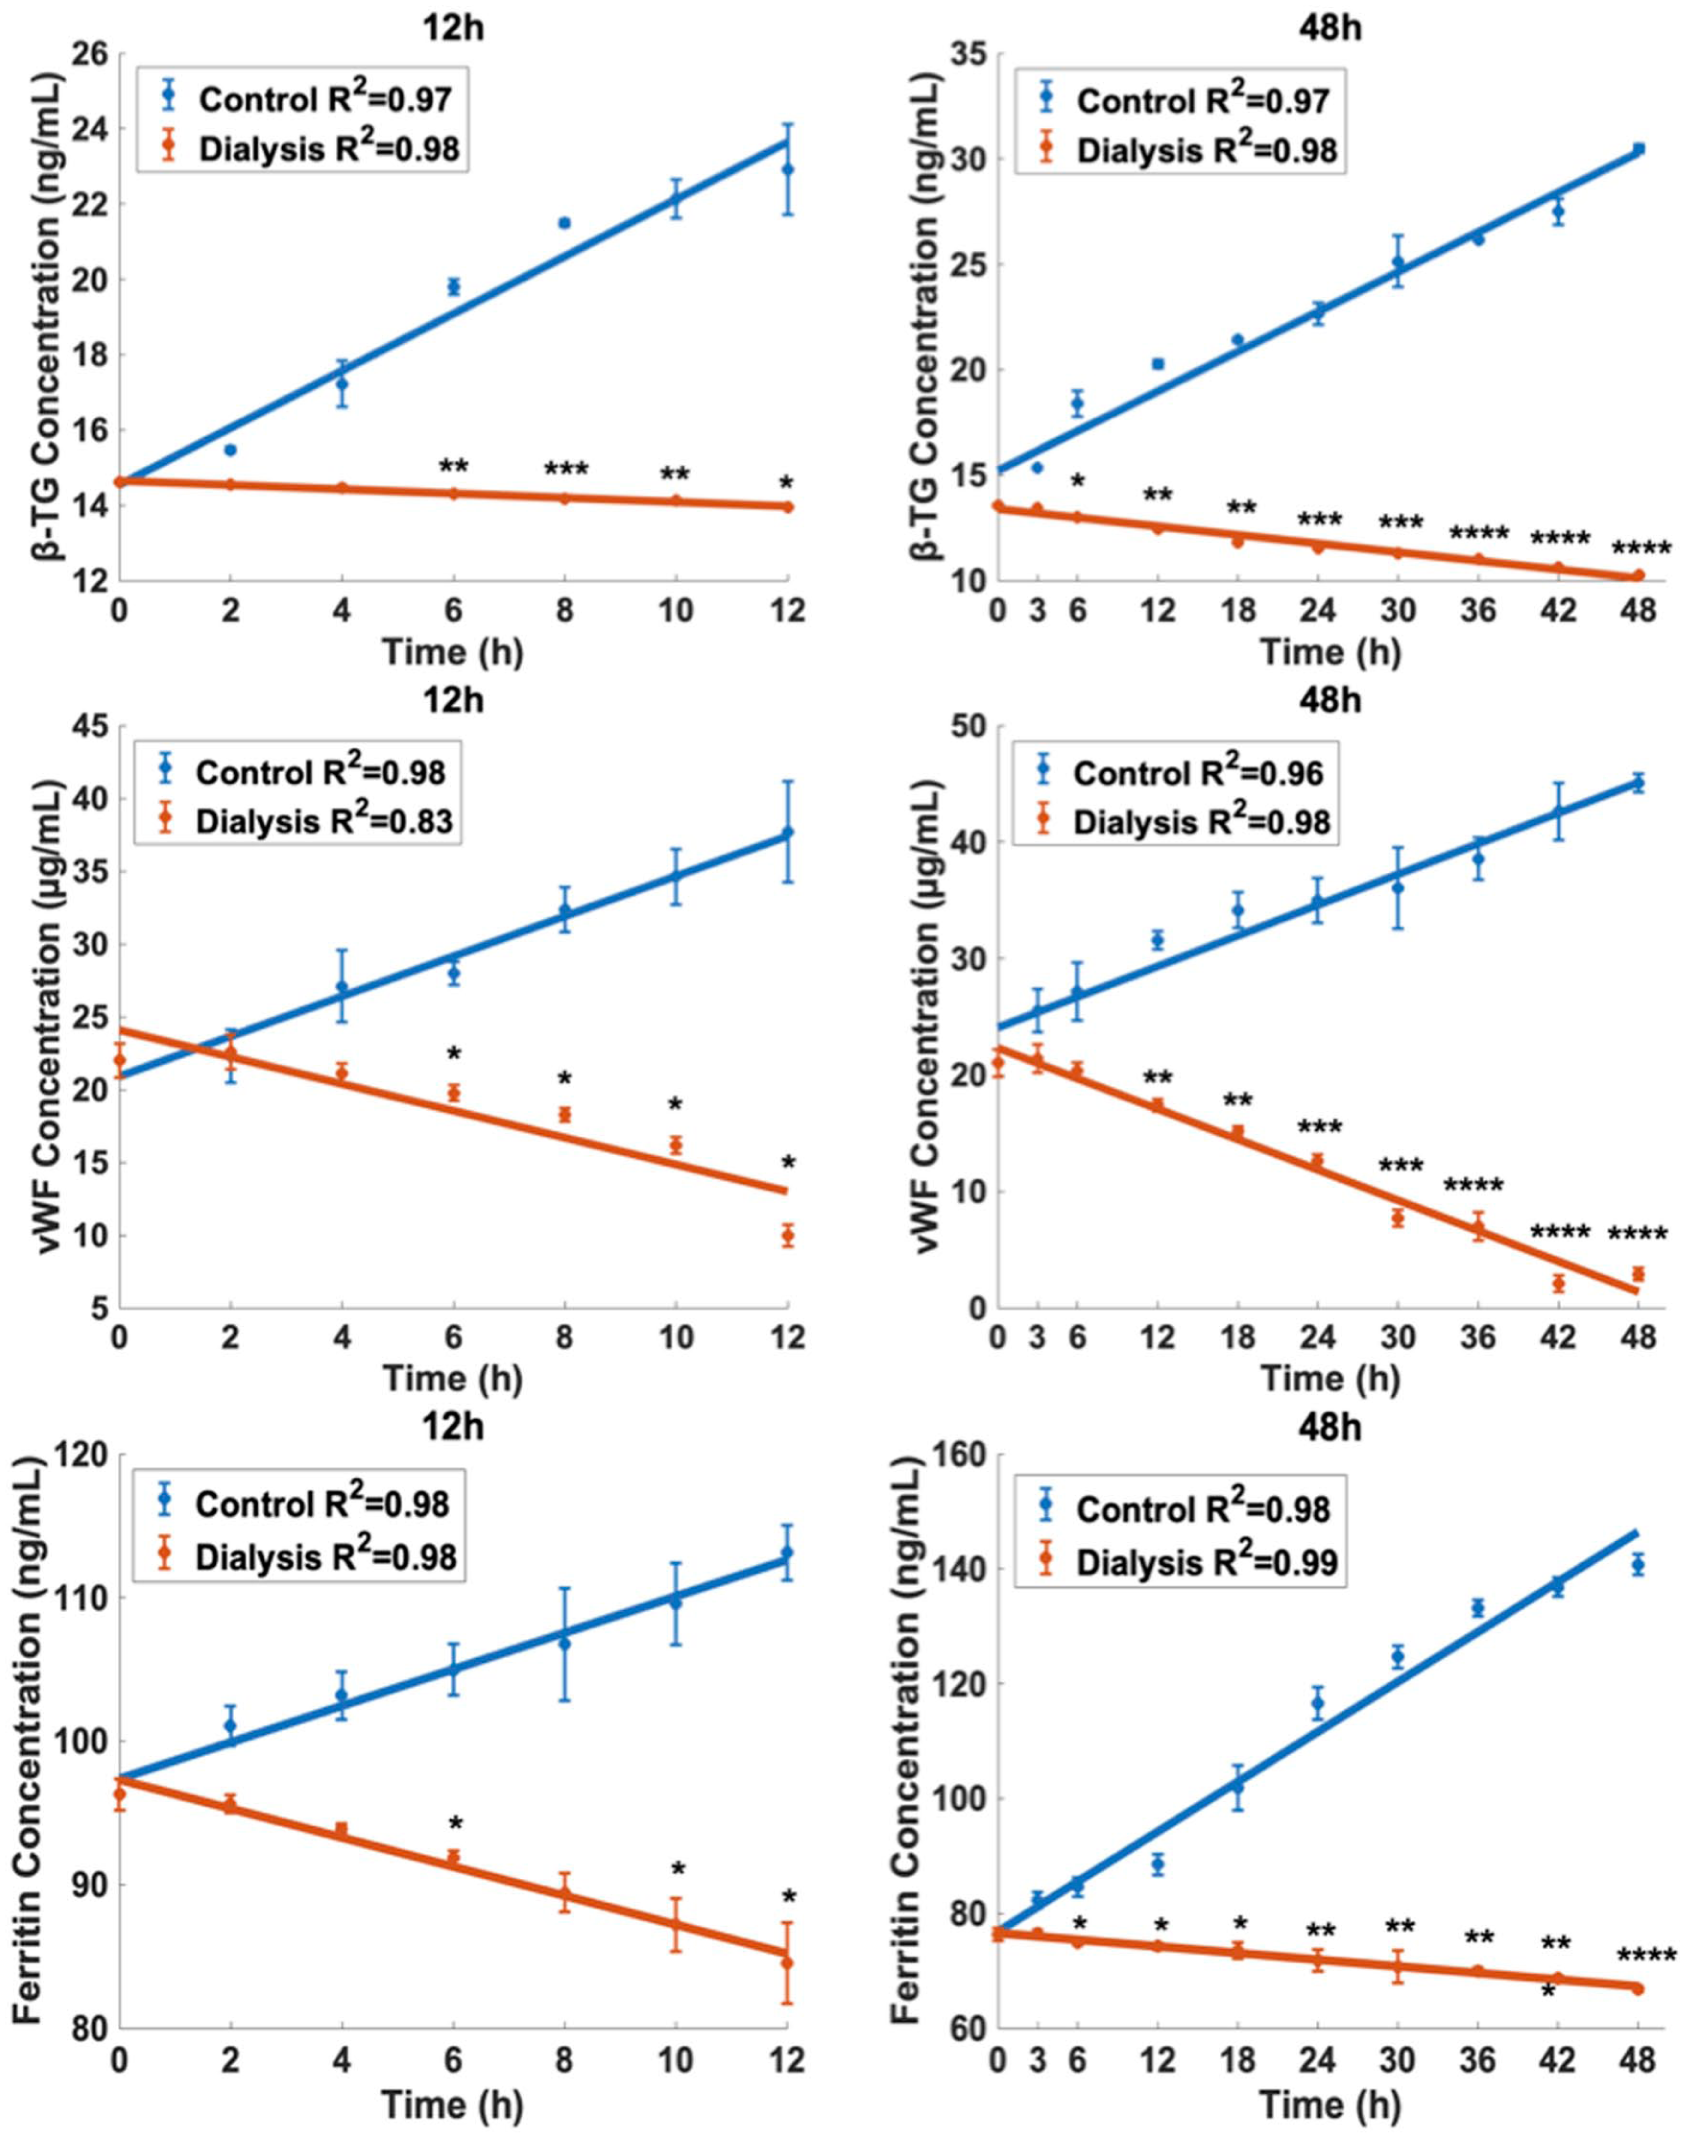
Platelet activation biomarkers (vWF:Ag (U/mL) and β-TG (ng/mL)) and iron metabolism biomarker ferritin (ng/mL) levels in blood serum were analyzed in the control (blue) and dialysis (orange) groups over the 12-h (left) and 48-h (right) experiments. Linear regression analyses are shown with R2 values. Statistical significance is indicated by *(p<0.05), **(p<0.01), ***(p<0.001), ****(p<0.0001).
Iron metabolism
Figure 6 also shows iron metabolism biomarker ferritin level. In 12-h studies, controls increased by ~15% over baseline (R2 = 0.98), while dialysis showed a slight but steady decrease (R2 = 0.98), with significant differences at 6–12 h (p < 0.05). In 48-h studies, ferritin in controls rose sharply (~80% at 48 h; R2 = 0.98), whereas dialysis continued to decline (R2 = 0.99), with significant differences from hour 6 onward (p < 0.05–<0.0001).
Discussion
Existing international standards—specifically ISO10993, 18 ASTMF1841‑19, 19 ASTMF756-17 12 —mainly define hemolysis indices (e.g. normalized index of hemolysis, plasma-free hemoglobin), pressure-flow performance, and limited coagulation endpoints. In contrast, this study presents a testing platform based on a biomarker panel (platelet activation, coagulation and inflammation, iron metabolism, etc.) and metabolic continuity in ex‑vivo human whole blood, allowing more sensitive detection of sub‑hemolytic and inflammatory responses not captured by standard assays. To ensure high clinical fidelity, this study utilized post-CPB patient blood, which presents a realistic matrix of inflammatory mediators, medications, and pre-stressed cellular components. 20 While this introduces variability associated with patient comorbidities, the paired design of the experiment (control vs test circuit using the same patient’s blood) served as an internal control, isolating the effect of the dialysis integration from patient-specific factors. The findings obtained in this study indicate that the dialysis circuit significantly preserved erythrocyte mechanical properties, metabolic balance, and biochemical integrity under long-term in vitro circulation conditions compared to the control group. The data revealed lower levels of blood damage, inflammatory activation, and coagulation responses, both mechanically and biochemically. It is crucial to clarify that this does not imply a cessation of blood trauma. Rather, it indicates that the clearance rate of free hemoglobin by the dialyzer (via transmembrane filtration or surface adsorption) exceeded its generation rate. While the mechanical components continued to induce sublethal damage, the integrated dialysis unit effectively removed the resulting cell-free hemoglobin from the circulating volume. When metabolic parameters were examined, the control group showed decreased pH and elevated lactate at 48 h, suggesting metabolic acidosis, which has been linked to cell damage and hemolysis.21,22 Mechanical stress in heart-lung machines and ECMO circuits similarly accelerates glucose consumption and lactate accumulation.23,24 In contrast, pH remained within physiological limits, glucose consumption slowed, and lactate rise was limited in the dialysis group, indicating greater metabolic stability. Hemolysis markers (NIH, pfHb) significantly increased in the control group but remained minimal in the dialysis group. Considering clinically acceptable limits (NIH <0.05 g/100 L; pfHb <20 mg/dL), 25 hemolysis in the control group was intolerable, while values in the dialysis group stayed acceptable. Temporary reduction of NIH level in the control group of 48 h dialysis experiment is attributed to surface passivation, where protein adsorption onto the circuit materials temporarily mitigates the hemolytic shear forces. However, the cumulative plasma free hemoglobin (ApfHb) concentration in the control group continued to rise linearly (R2 = 0.89, Figure 3, middle right), confirming that hemolysis remained ongoing. In contrast, the integrated dialysis circuit demonstrated a continuous reduction in both NIH and ApfHb concentration, proving its capacity to actively clear hemolytic byproducts despite the mechanical stress. Decreased haptoglobin and increased bilirubin in the control group further confirmed hemolysis. Inflammatory markers (IL-8, TNF-α, C3a) also rose markedly in the control group. IL-8 levels exceeded 500 pg/mL, above the 100–300 pg/mL range in ECMO patients and even beyond high-inflammatory states (>400 pg/mL). 26 C3a, reported to average ~2.0 µg/mL in ECMO, 27 was also surpassed in the control group, while remaining stable or decreasing in the dialysis group. It is important to note that native C3a is rapidly converted to C3a-desArg in vivo. However, in our in vitro closed-loop system, the measured C3a concentrations reflect the cumulative total of C3a and its stable metabolite C3a-desArg. The highly linear accumulation observed in the control circuits (R2 ⩾ 0.98, Figure 4) confirms that the continuous activation of the complement system by the biomaterial surfaces outweighs the degradation rate of the anaphylatoxin. Coagulation/fibrinolysis markers (fibrinogen, D-dimer, TAT) increased in the control group but were lower in dialysis. Literature defines D-dimer >3000 ng/mL as significant fibrin degradation 28 and TAT >18 ng/mL as excessive thrombin formation 29 ; our control values approached or exceeded these limits. Platelet (β-TG) and endothelial (vWF) activation rose in the control group, whereas the dialysis group suppressed this axis, consistent with shear stress-induced vWF degradation and platelet–endothelium–inflammation activation during continuous-flow support. 30 Finally, ferritin increased in the control group but decreased in dialysis; as an acute-phase protein linked to inflammation and hemolysis during ECMO, 31 this rise suggests greater oxidative stress and cell injury. Differences in absolute values observed between experimental sets (e.g. 12 vs 48 h cohorts) are attributable to the biological variability inherent to post-CPB patient blood, emphasizing the importance of the paired-control design employed in this study.
Conclusion
This study showed that under long-term circulation, integrating a dialysis circuit preserved erythrocyte mechanics, metabolic stability, and biochemical integrity more effectively than the control group. Although deformability was initially lower, it improved over time, while NIH and plasma free hemoglobin remained minimal, and bilirubin/haptoglobin confirmed reduced hemolysis. Blood gases (pH, glucose, lactate) were more stable with dialysis, supporting metabolic protection. Inflammatory (C3a, IL-8, TNF-α), coagulation/fibrinolysis (fibrinogen, D-dimer, TAT), platelet/endothelial activation (β-TG, vWF), and ferritin all rose markedly in controls but remained stable or decreased with dialysis. Overall, dialysis reduced mechanical stress, inflammation, and coagulation, ensuring greater biocompatibility in both short- and long-term tests. These findings suggest that incorporating dialysis into in vitro blood-contact device evaluation provides conditions closer to clinical physiology, reducing error and offering a potential framework for future cardiovascular device testing standards.
Supplemental Material
sj-tiff-1-jao-10.1177_03913988261445012 – Supplemental material for Simulating physiological blood maintenance: A dialysis-integrated in vitro flow loop for realistic hemocompatibility evaluation of devices
Supplemental material, sj-tiff-1-jao-10.1177_03913988261445012 for Simulating physiological blood maintenance: A dialysis-integrated in vitro flow loop for realistic hemocompatibility evaluation of devices by Tansu Gölcez, Demet Kul, Elif Uğurel, İrem Günaydın, Özlem Yalçın, Kerem Pekkan and Yahya Yıldız in The International Journal of Artificial Organs
Footnotes
Author contributions
Tansu Gölcez, Yahya Yıldız, and Kerem Pekkan conceptualized and designed the study. Tansu Gölcez performed experiments, analyzed the data, and drafted the manuscript. Yahya Yıldız and Demet Kul contributed to experimental design, data analysis, and interpretation. Demet Kul, İrem Günaydın, and Elif Uğurel assisted with biochemical assays and contributed to statistical analysis and figure preparation. Kerem Pekkan, Özlem Yalçın, and Yahya Yıldız supervised the study, contributed to writing, provided critical revisions, and secured funding. All authors reviewed and approved the final manuscript.
Data availability statement
All the data and detailed protocols are available upon request from the authors.
Declaration of conflicting interests
The authors declared no potential conflicts of interest with respect to the research, authorship, and/or publication of this article.
Funding
The authors disclosed receipt of the following financial support for the research, authorship, and/or publication of this article: This work was funded by The Scientific and Technological Research Council of Turkey (TUBITAK) project numbered 223S322 and European Innovation Council (EIC) HeartWise 101214454 (KP).
Supplemental material
Supplemental material for this article is available online.
References
Supplementary Material
Please find the following supplemental material available below.
For Open Access articles published under a Creative Commons License, all supplemental material carries the same license as the article it is associated with.
For non-Open Access articles published, all supplemental material carries a non-exclusive license, and permission requests for re-use of supplemental material or any part of supplemental material shall be sent directly to the copyright owner as specified in the copyright notice associated with the article.