
Abstract
Introduction:
Conventional imaging fails to quantify the true physical density and mass of organs. This study aims to develop a spectral CT-based physical modeling approach to quantify organ remodeling in type 2 diabetes mellitus (T2DM).
Methods:
A total of 97 subjects (46 T2DM patients and 51 non-diabetic controls) were evaluated. Organ regions (liver, pancreas, spleen) were automatically segmented using a V-Net neural network. A physical density model was constructed based on spectral parameters. We compared organ CT value, effective atomic number, mass, volume, and physical density between groups and analyzed their correlation with HbA1c levels.
Results:
The physical density model showed high accuracy, with measured subcutaneous fat density aligning with standard physical references. In T2DM patients, pancreatic mass and physical density decreased significantly. Conversely, liver and spleen mass increased without significant changes in physical density. Pancreatic physical density showed a significant negative correlation with HbA1c, with rho = −0.411 and p < 0.001.
Discussion:
The spectral physical density model provides a precise, non-invasive metric for assessing organ quality. The strong correlation between pancreatic density and glycemic supports its potential utility in evaluating functional reserve for artificial organ.
Introduction
Type 2 diabetes mellitus (T2DM) is a chronic metabolic disease characterized by insulin resistance and pancreatic β-cell failure. The global incidence of T2DM continues to rise, making it one of the most important chronic diseases affecting health.1–3 It can damage the nervous system of the heart and kidneys, and also affect the structure and function of abdominal solid organs such as the liver, pancreas, and spleen.4–6 Studies have found that the pancreas of diabetic patients is significantly reduced in size and has increased fat content, while the liver and spleen often show abnormal changes in volume and tissue density.7,8
In diabetic patients, changes in abdominal organs often lead to end-stage organ failure, requiring replacement therapy.9–12 In order to effectively manage these organ transplant treatments, it is essential to accurately assess the function and tissue composition of the patient’s organs.
As a non-invasive imaging technique, conventional CT is widely used for structural assessment, but its pixel grayscale values only reflect the linear attenuation coefficient of X-rays and are insufficient to quantify the true physical density (g/mL) of tissues. 13 Furthermore, an increased organ size does not necessarily mean that the organ is functioning properly, as it may also be due to inflammation or edema.
In recent years, with the rapid development of technology, spectral CT is based on the difference in X-ray attenuation of different materials at different energies, combined with hardware such as dual tubes or dual-layer detectors to achieve multi-energy imaging reconstruction, which can obtain more detailed parameters, including effective atomic number, electron cloud density, iodine density, and uric acid and significantly improve the ability to identify soft tissue components.14–17 By combining spectral parameters with physical modeling, the actual physical density of living tissue can theoretically be calculated non-invasively. This provides a potential method for weighing living organs.
In this study, we propose a novel quantitative framework that combines V-Net with spectral physical density modeling. Our goal is to validate the accuracy of the density model and quantify the changes in organ mass and density in patients with T2DM. This method can serve as a non-invasive indicator for evaluating the potential characteristics of structural and density changes in abdominal parenchymal organs, and its clinical value in relation to corresponding tissue composition changes.
Method
Image data
This study retrospectively included patients who underwent abdominal spectral CT scans at Xi’an No. 3 Hospital from January to December 2024 and agreed to include their data in the study. All procedures performed in study were in accordance with the ethical standards of the institutional and national research committee and with the 1964 Helsinki Declaration and its later amendments or comparable ethical standards. This study was approved by the Ethics Committee of Xi’an No. 3 Hospital (no. SYLL-2024-120).
According to the clinical diagnosis results, they were divided into a normal group of 51 cases and an early diabetic group of 46 cases. All subject data were obtained by spectral scanner (IQon Spectral CT; Philips Healthcare, Amsterdam, Netherlands). The scanning parameters were set as follows: tube voltage 120 kVp, tube current 200 mAs, slice thickness 2.5 mm, and gantry rotation speed was set to 0.27 s/r to complete the scan quickly. Conventional images and spectral-based-images (SBI) were reconstructed for all patients. All data were uploaded to a spectral-dedicated post-processing workstation (ISP; Philips Healthcare) for analysis. Conventional CT sequences, effective atomic numbers, and image slice thickness of 1.0 mm were reconstructed based on SBI data and stored in DICOM format.
Image segmentation
The 3D segmentation of the pancreas, liver, and spleen was performed using a V-Net neural network model (uAI Research Portal). The network output is a binary mask image consistent with the spatial coordinates of the original CT image, that is, the ROI of the pancreas, liver, and spleen. To ensure the accuracy of the automated segmentation results, all segmented organ ROIs were reviewed case by case by radiologists with over 10 years of clinical experience, and necessary manual corrections were performed in 3D Slicer 5.2.2 software to ensure the accuracy of the segmentation boundaries.
Density parameter map
This study uses a spectral physical density quantification model to non-invasively measure the density of human organs, and uses conventional CT sequences and effective atomic number sequences to calculate the corresponding density sequence pixel by pixel. Based on the CT imaging principle, this model describes energy attenuation as a linear combination of photoelectric effect and Compton scattering, as shown in equation (1):
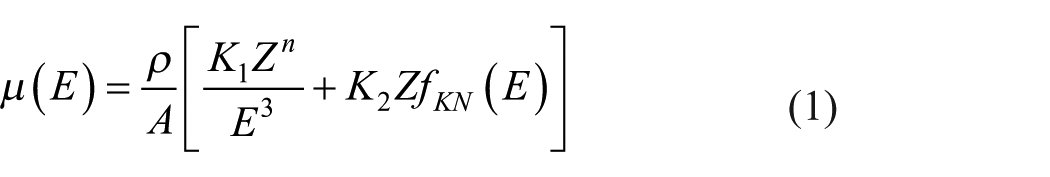
Where
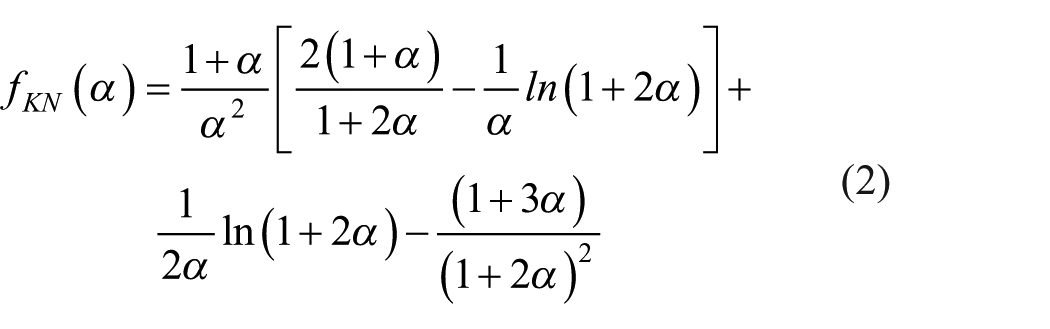
Where
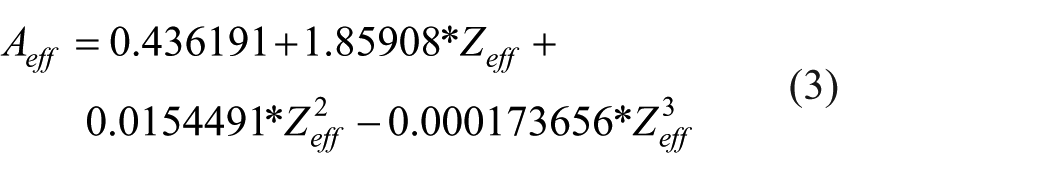
Using clinically available spectral results, the atomic number and atomic mass were replaced by the effective values of the atomic number and atomic mass, where the effective atomic mass
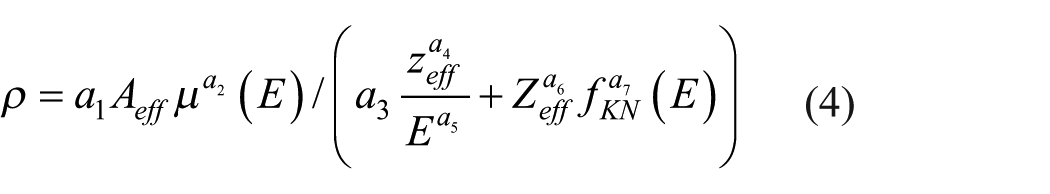
The form of the parameterized model is determined by replacing the constants in the original model with parameters and adding parameters in front of each component of the model to solve the weight problem of these components.
The parameterized model is determined by replacing the constants in equation (1) with parameters and adding parameters in front of each independent component in equation (1) to solve the weight problem of each part, as shown in equation (4):
Where
Internal validation of the physical density model
To verify the accuracy of the proposed physical density quantification model (equation (4)), an internal validation was performed using subcutaneous fat as a reference standard, given its relatively constant physical density in the human body. For all 97 subjects, a ROI was placed in the subcutaneous fat layer of the anterior abdominal wall, avoiding visible vessels and connective tissue. Calculate the average physical density of this region and compare it with the standard physical density of adipose tissue, which is ~0.90–0.92 g/mL, to evaluate the reliability of the model. 18
Statistical analysis
Organ volume was calculated based on voxel size and the number of voxels in each organ ROI. Physical density was calculated using spectral CT parameters and the physical model. Organ mass was calculated based on this: mass = volume × mean physical density.
The volume and mass calculation process were completed in the Python 3.8 environment, and the pydicom and SimpleITK libraries were used to process DICOM data to ensure the consistency of image spatial information. Statistical analysis was performed using SPSS 26.0.0. Group differences were analyzed using Student’s t-test, Welch’s t-test, or Mann–Whitney U test depending on data distribution. Spearman correlation analysis was used to evaluate the relationship between imaging parameters and HbA1c. p < 0.05 was considered statistically significant.
Results
Patient characteristics
Ninety-seven patients were included in the study, including 53 males and 44 females, aged 22–78 years old, with an average age of 56 years old. Among the 97 patients, 46 were recorded as type 2 diabetes patients in clinical data, and patients who were not diagnosed with diabetes or prediabetes were included in the non-diabetes group. There were no significant differences in age, sex, or BMI between the T2DM and non-diabetic groups. Fasting plasma glucose and HbA1c were significantly higher in the diabetic group (p < 0.001). The results were shown in Table 1.
Baseline characteristics of the study population.
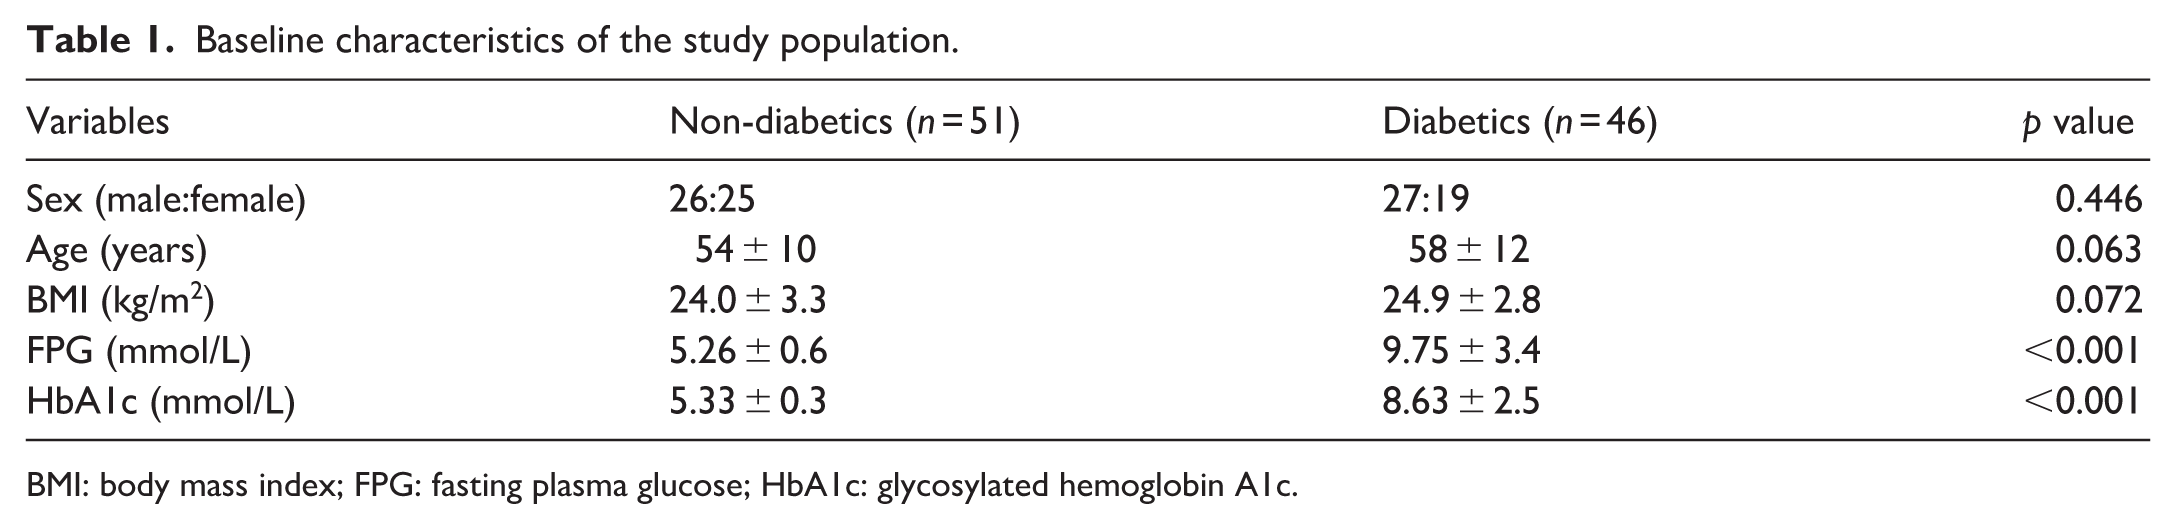
BMI: body mass index; FPG: fasting plasma glucose; HbA1c: glycosylated hemoglobin A1c.
Abdominal organ segmentation
This study used the AI platform (uAI Research Portal) to segment the liver, spleen, and pancreas, and was reviewed and modified by a radiologist with more than 10 years of clinical experience. The organ segmentation results are shown in Figure 1. The green part is the liver, the orange part is the pancreas, and the yellow part is the spleen.
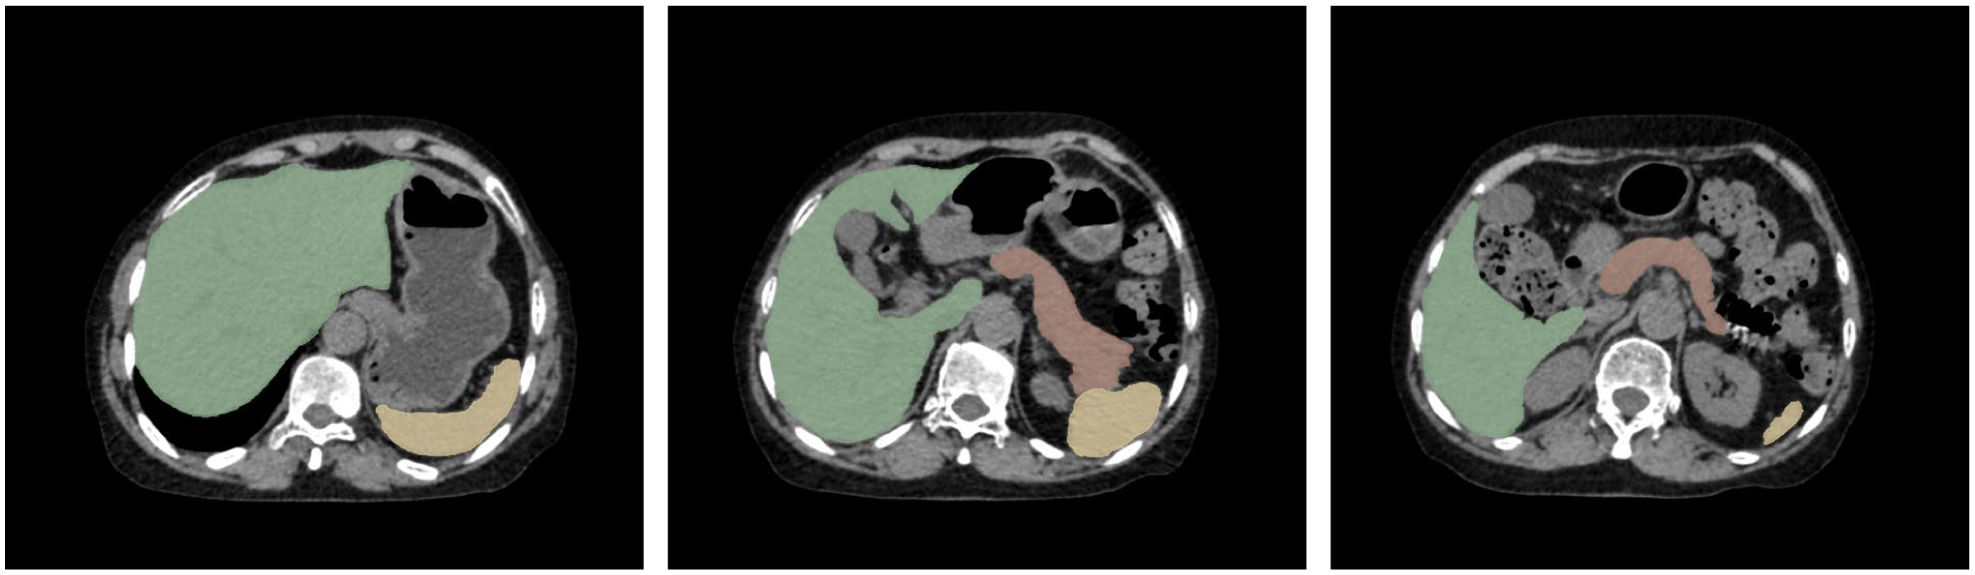
Segmentation results.
Physical density map
According to the formulated physical density model, the physical density value of a voxel can be calculated by inputting the CT value and effective atomic number value of a voxel. Therefore, the CT sequence and effective atomic number sequence are input, and the corresponding physical density value is calculated pixel by pixel, and finally the physical density sequence is generated, as shown in Figure 2.
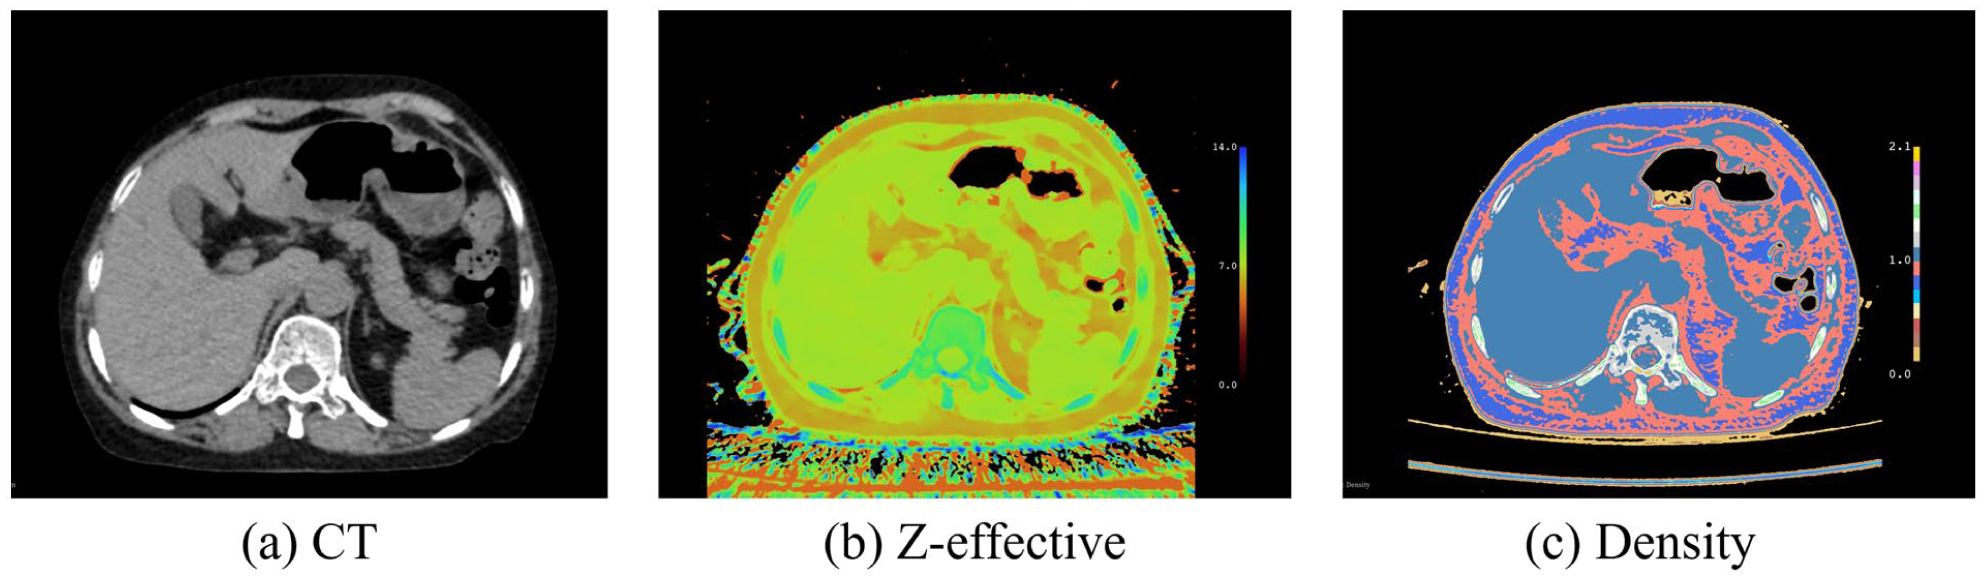
Different parameter map. (a) shows the CT map, (b) shows the Z-effetive map, (c) shows the Physical density map.
Figure 2(a) is a conventional image, Figure 2(b) is a pseudo-color image of the effective atomic number generated by spectral CT, and Figure 2(c) is a pseudo-color image of the calculated physical density map. Since the difference in physical density is small, the contrast of black and white does not look obvious, so we choose to present the image in pseudo-color with a window width of 2 and a window position of 1.
Validation of the physical density model
The internal validation demonstrated high accuracy of the spectral physical density model. Across the study population, the measured physical density of subcutaneous fat was 0.903 ± 0.008 g/mL. This value aligns precisely with the standard physical density of human adipose tissue, confirming that the calculated density maps reflect the true physical properties of the tissue rather than arbitrary grayscale values.
Effects of diabetes on organs
According to the delineated ROI and physical density map, the differences in CT value, effective atomic number, physical density, volume and mass of the liver, pancreas, and spleen between the two groups of subjects were statistically analyzed, and the results are shown in Figure 3 and Table 2. The statistical method was selected according to the data distribution characteristics. For data with normal distribution and homogeneity of variance, the Student’s t-test was used. When the variance was unequal, the Welch corrected t-test was used. For non-normal distribution data, the Mann–Whitney U test was used.
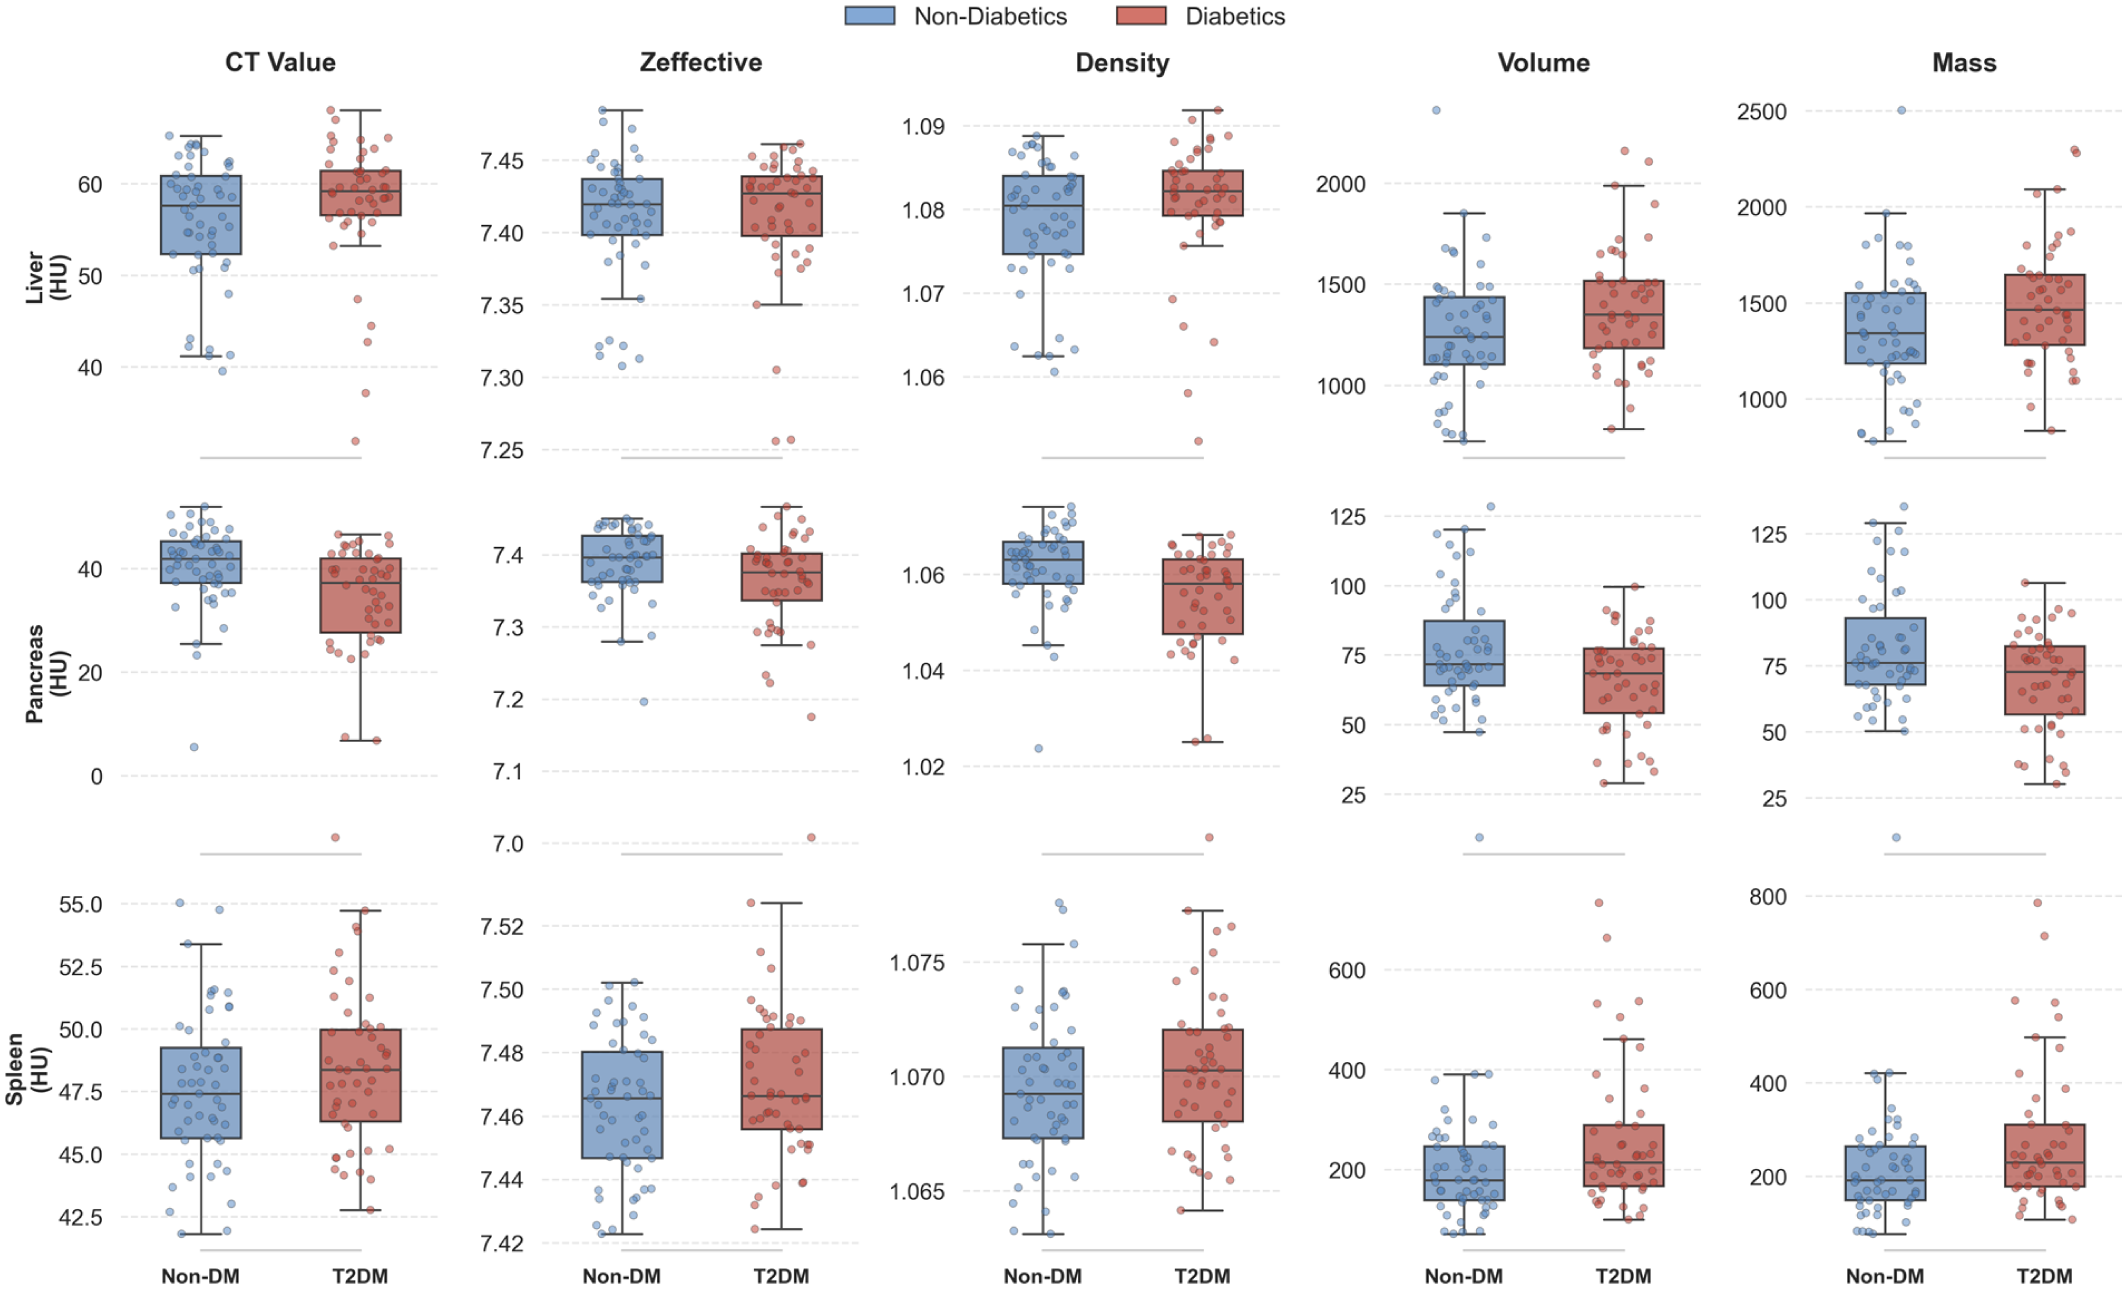
Shows the box plots of CT value (HU), effective atomic number, physical density (g/mL), volume (cm3), and mass (g) of liver, pancreas, and spleen between the normal group and the diabetic group.
Quantitative parameters of liver, pancreas, and spleen.
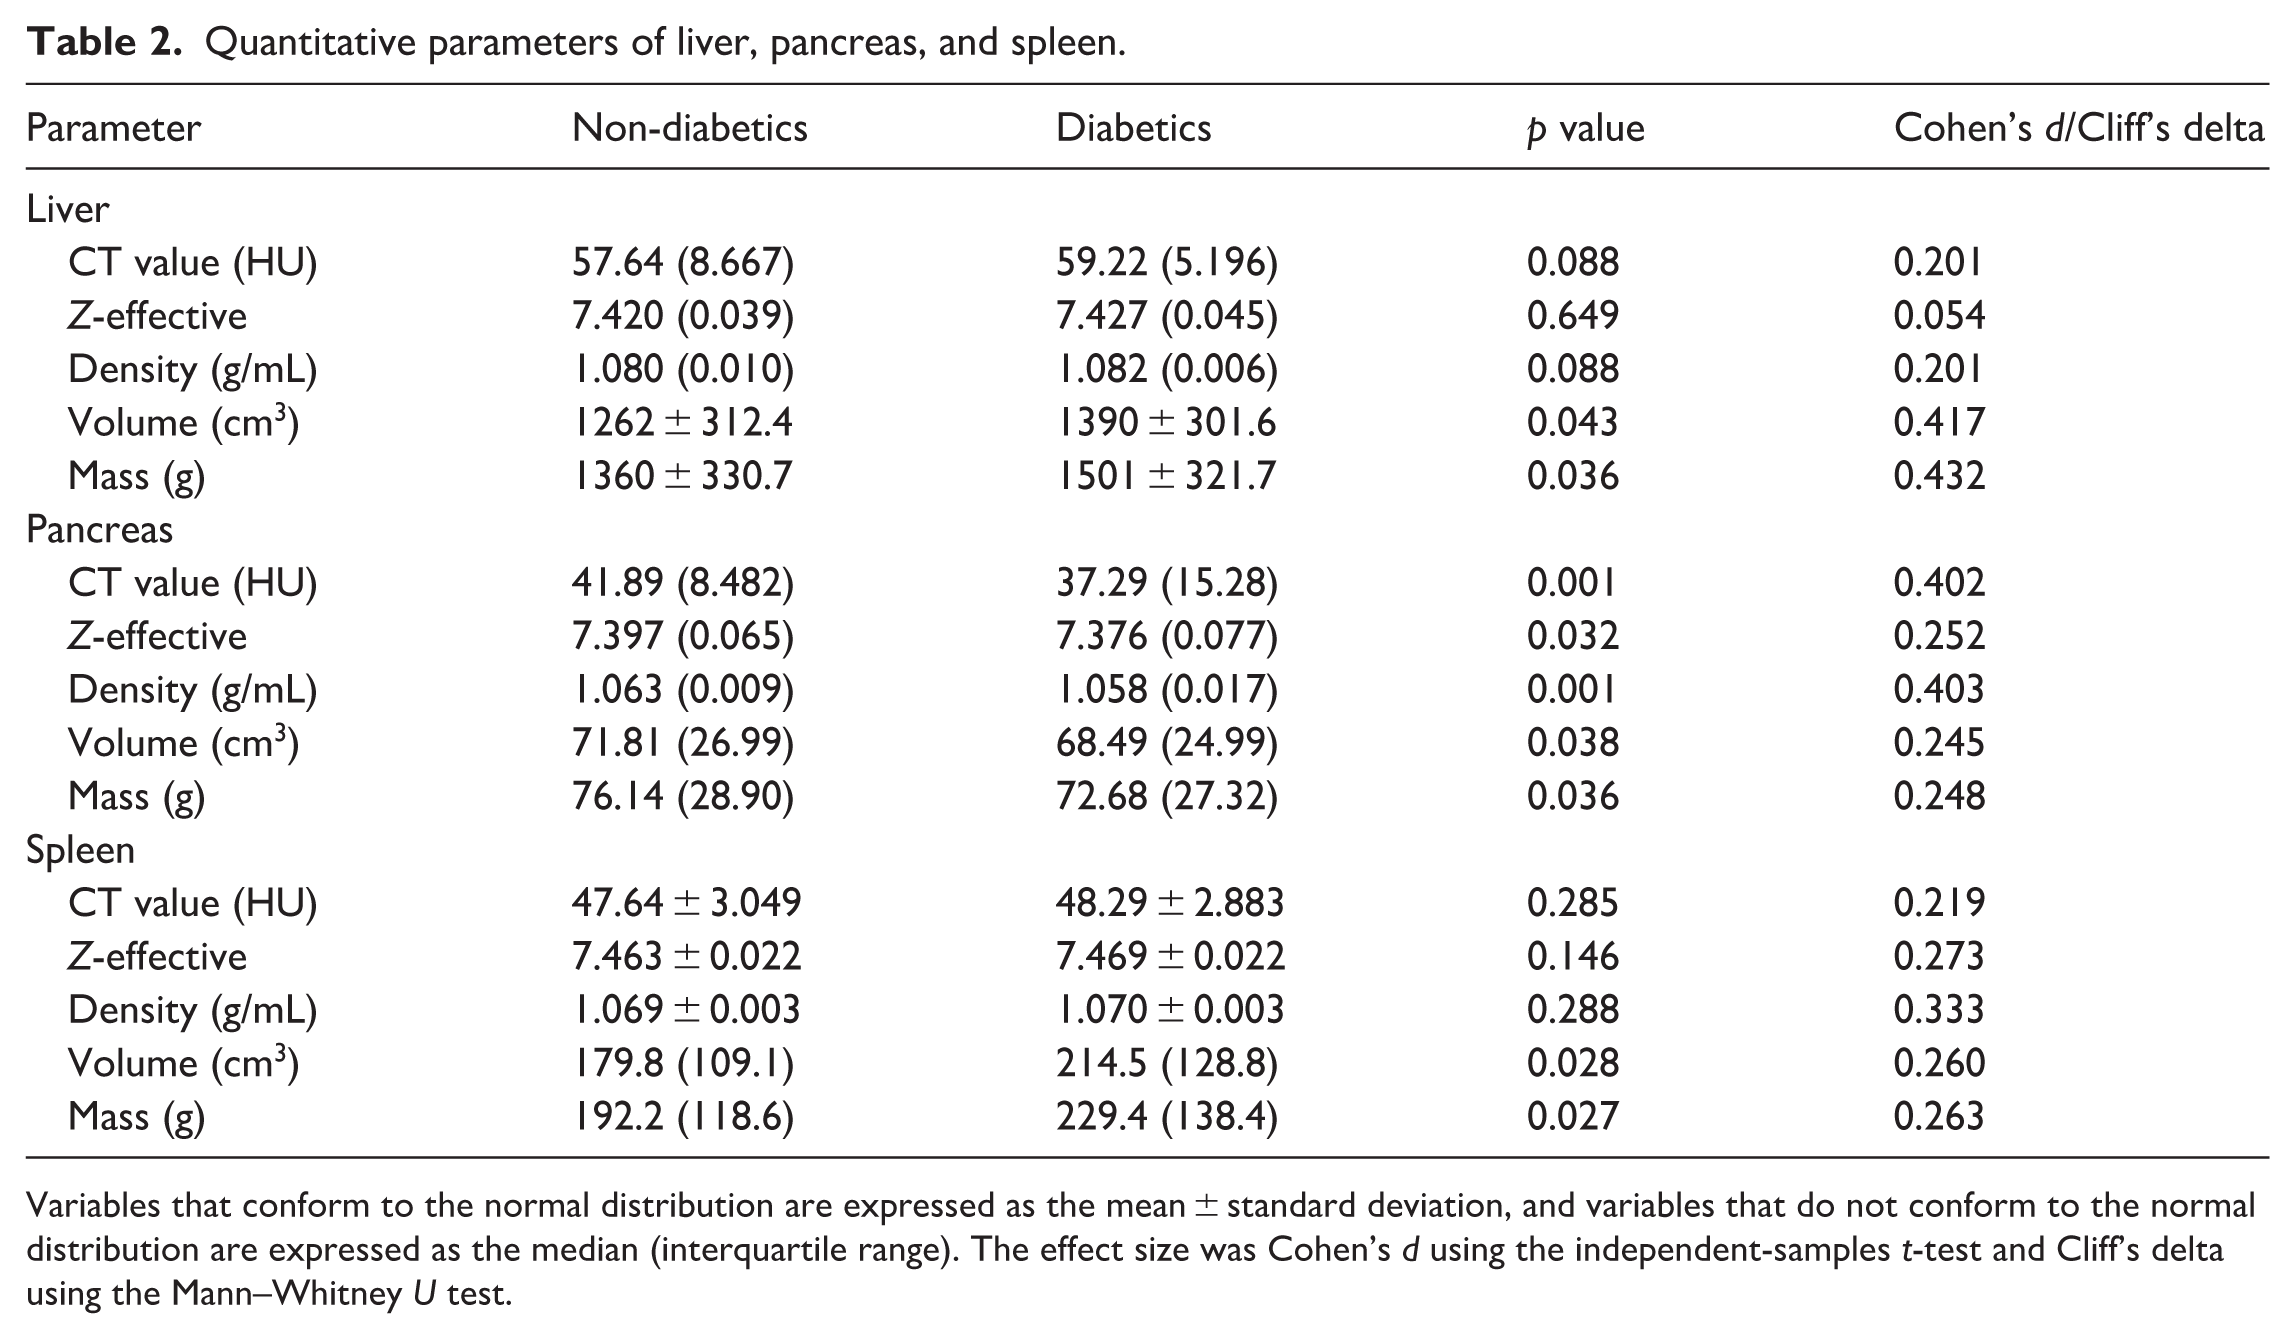
Variables that conform to the normal distribution are expressed as the mean ± standard deviation, and variables that do not conform to the normal distribution are expressed as the median (interquartile range). The effect size was Cohen’s d using the independent-samples t-test and Cliff’s delta using the Mann–Whitney U test.
In T2DM patients, liver volume and mass increased significantly, with p values of 0.043 and 0.036. However, physical density showed no statistically significant difference, as indicated by a p value of 0.088. Conversely, the pancreas in T2DM patients exhibited comprehensive degeneration, characterized by significant decreases in physical density with a p < 0.001, volume with a p value of 0.038, and mass with a p value of 0.036. Furthermore, spleen volume and mass were significantly elevated in the T2DM group, showing p values of 0.028 and 0.027, whereas no significant changes were observed in density.
Correlation analysis
To evaluate the clinical sensitivity of the proposed physical density model, we performed Spearman correlation analysis to assess the relationship between quantitative organ parameters and HbA1c, as shown in Figure 4. For the pancreas, there was a significant moderate negative correlation between HbA1c levels and pancreatic physical density, with a rho value of −0.411 and a p < 0.001, as well as with pancreatic mass, showing a rho value of −0.296 and a p value of 0.003. The heat map shows that the physical density and functional quality of the pancreas in diabetic patients gradually decrease, which is consistent with the pathophysiological characteristics of fatty infiltration and parenchymal atrophy in type 2 diabetes.
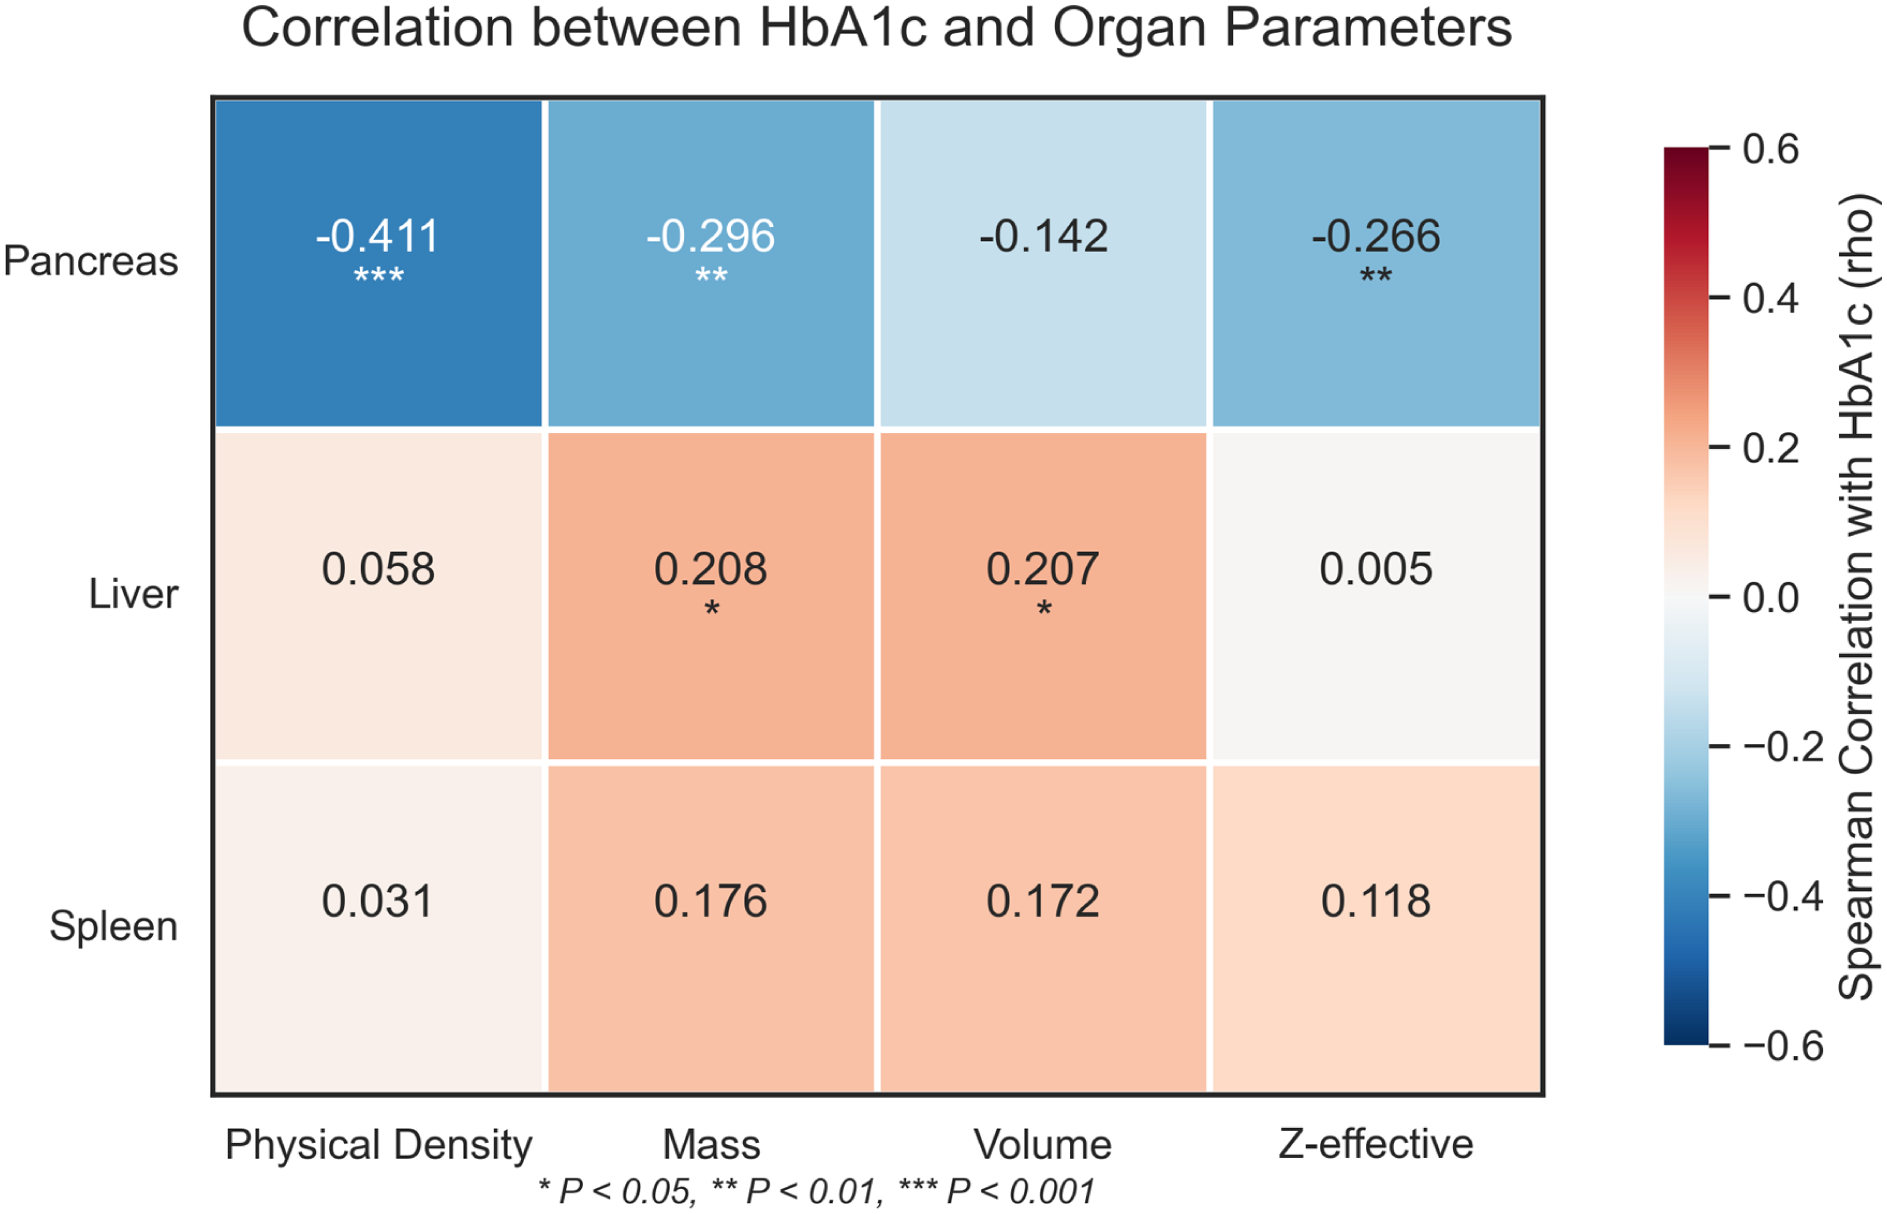
Heatmap of Spearman correlations between HbA1c levels and quantitative organ parameters.
There was no correlation between changes in liver volume and tissue density. Liver volume and mass showed a weak positive correlation with HbA1c, with a rho value of ~0.208 and a p < 0.05, there was no significant correlation between liver physical density and HbA1c, as indicated by a p value of 0.570. These results suggest that the liver enlargement observed in this study was not solely due to linear accumulation of low-density adipose tissue, but may involve other mechanisms. No significant correlation was observed between any splenic parameters and HbA1c levels.
Discussion
This study proposes a non-invasive method for measuring the density and mass of human organs based on spectral CT, which can be used to non-invasively quantify the true mass and physical density of abdominal organs. Unlike traditional CT, which relies on relative attenuation values, our method derives absolute physical density based on the photoelectric effect and Compton scattering interactions. We confirmed the reliability of the model by measuring subcutaneous fat density at 0.903 ± 0.008 g/mL, which showed a high degree of agreement with standard physical values. 18 We interpreted the organ changes in T2DM patients as real alterations in tissue mass and physical density, thus providing a reliable basis for quantitative assessment.
The most important finding of this study is the comprehensive degeneration of the pancreas in T2DM patients, characterized by simultaneous decreases in volume, mass, and physical density. Furthermore, pancreatic physical density showed a significant negative correlation with glucose HbA1c levels, indicating that as glycemic control deteriorates, the pancreas transforms from high-density parenchyma tissue into low-density adipose tissue.8,19
In the field of islet transplantation and artificial pancreas (AP) development, assessing pancreatic function is a significant challenge. Measuring volume alone is often affected by edema or fat, and cannot accurately reflect the number of surviving β cells. 11 Our physical density model effectively quantifies functional tissue. The significant correlation with HbA1c suggests that this metric can serve as a non-invasive surrogate marker for beta-cell functional quality. This density and quality metric can provide crucial baseline data on a patient’s remaining endocrine function when evaluating patients before artificial islet transplantation or determining insulin dosing algorithms for closed-loop AP systems.20,21
Although pancreatic physical density and traditional CT values showed similar statistical correlations with blood glucose levels in our study results, the physical density model has unique advantages in terms of interpretability and application value. Firstly, Hounsfield units are relative values dependent on scanner calibration and X-ray energy, while physical density is an absolute biological characteristic, making it more suitable for multi-center standardization. 22 Secondly, HU values cannot be used to calculate organ mass. By determining the true physical density, our method can calculate the total mass of the organ. 23 The study quantified the quality of organs from patients with type 2 diabetes, providing parameters that traditional CT values cannot provide for determining the size of bioartificial devices and estimating transplant volume.
Furthermore, our study found that the liver mass and volume were significantly increased in the type 2 diabetes group, but the physical density was not significantly reduced. This result suggests that hepatomegaly may not be caused by severe steatosis, but rather by cell hypertrophy, glycogen deposition, or low-grade inflammatory edema.24,25 This finding is crucial in the field of bioartificial liver (BAL) applications. A large liver is not necessarily a fatty liver, nor is it necessarily a functionally normal liver. Our model differentiates between changes in volume and composition.
Meanwhile, the results suggest that increased spleen mass may reflect chronic systemic inflammation associated with type 2 diabetes. Since the spleen is an important immune organ, quantitative measurement is crucial for understanding the immune environment and is a key factor in the biocompatibility and long-term survival of implanted bioartificial devices.26,27
Our study still has some limitations. Although we validated the model using internal fat references, we lacked histological biopsies as the gold standard for organ density. Secondly, this is a cross-sectional study, requiring longitudinal data to track the dynamic changes in physical density during diabetes progression or after treatment intervention. Finally, the study population was limited to a single center. Future research will focus on combining this density model with functional assessments to further validate its utility as a biomarker of organ function.
Conclusion
This study validated an organ physical density model based on spectral CT, which enables non-invasive quantitative measurement of the mass and density of abdominal organs. The study confirmed that pancreatic physical density is a sensitive biomarker of type 2 diabetes severity and is closely related to blood glucose levels. This method provides a promising engineering tool for quantitatively assessing organ function and holds promise for applications in artificial organ therapy and organ transplantation patients.
Footnotes
Acknowledgements
The authors thank the participants for their contribution to this study. We also thank all the collaborators who helped with the data collection.
Declaration of conflicting interests
The authors declared no potential conflicts of interest with respect to the research, authorship, and/or publication of this article.
Funding
The authors disclosed receipt of the following financial support for the research, authorship, and/or publication of this article: This work was supported by the Xi’an Municipal Health Commission in China (grant number 2024yb06). And this study was supported by Beijing Medical Award Foundation (grant number YXJL-2025-0483-0296).