
Abstract
Arteriovenous fistula (AVF) failure in hemodialysis patients is strongly influenced by local hemodynamic factors such as elevated wall shear stress, flow separation, and vortex formation. In this study, computational fluid dynamics (CFD) simulations are performed to investigate the influence of anastomosis angle and blood rheology on AVF hemodynamics. Three non-Newtonian blood models (Carreau, power-law, and Casson) are first evaluated at 45°, 90°, and 135° anastomosis angles and validated against available experimental data. Based on shear stress prediction accuracy, the Carreau model is demonstrated as the best agreement and is selected for further simulations. Subsequently, AVFs with 45°, 90°, 110°, 120°, 135°, 145°, and 160° anastomosis angles are analyzed under maximum, medium, and minimum pulsatile flow conditions. Hemodynamic parameters including velocity patterns, wall shear stress distribution, vortex formation, and pressure drop between the proximal artery and vein are evaluated. Results indicate that increasing the anastomosis angle significantly reduces maximum wall shear stress, high-shear regions, vortex intensity, and pressure drop. Compared with the 45° configuration, the 160° angle reduced maximum shear stress by ~78% under peak flow conditions. Overall, obtuse anastomosis angles demonstrated improved hemodynamic performance, suggesting that larger angles may reduce thrombosis risk and cardiovascular burden in hemodialysis patients. Considering both hemodynamic performance and surgical feasibility, the 120° configuration is proposed as a clinically practical and effective option.
Introduction
Hemodialysis is the most widely used treatment for patients with kidney failure. Vascular access is required to facilitate hemodialysis in patients with end-stage renal disease. 1 Three main types of vascular access are commonly used for dialysis: grafts, catheters, and fistulas. 2 Among these, the arteriovenous fistula is considered the most effective long-term vascular access option.3,4 In this procedure, surgeons create an anastomosis between an artery and a vein in the forearm, utilizing the high arterial pressure and the relatively large venous diameter to enable efficient blood flow for dialysis. The use of arteriovenous fistulas for hemodialysis was first proposed in Karmody and Lempert, 5 who employed the radial artery and the cephalic vein in the forearm. 6
However, not all patients possess vessels suitable for arteriovenous fistula creation. 2 For successful fistula formation, the minimum required diameters of the artery and vein are ~2 and 3 mm, respectively. 7 Following surgical creation, a maturation period of about 6 weeks is typically required for the fistula to develop sufficiently to sustain a blood flow rate of ~600 mL/min. 8 A substantial body of theoretical and experimental research has demonstrated that elevated shear stress promotes thrombosis, whereas low shear stress leads to flow disturbances such as vortex formation and recirculation zones.9,10 These hemodynamic factors ultimately contribute to reduced blood flow and potential fistula dysfunction. Therefore, further investigations into the hemodynamic behavior of blood flow at the fistula site are essential to improve its performance and longevity.11–14 Ene-Iordache and Remuzzi, 15 investigated two types of end-to-end anastomoses, including a configuration with a 49° angle, using a non-Newtonian blood model under both maximum and minimum flow conditions of the pulsatile blood cycle. Their results indicated that shear stress increased along the side walls of the fistula.
Hassan et al., 16 developed fistula models with anastomosis angles of 20°, 30°, 45°, 60°, 75°, and 90°, assuming a Newtonian blood model. Their findings suggested that angles between 45° and 60° are more suitable for fistula creation, as they provide a balance between reduced pressure drop and a lower risk of intimal hyperplasia. Hull et al., 17 demonstrated a direct relationship between flow rate and pressure drop by applying different inlet flow rates to fistulas with 45° and 90° anastomosis angles.
Browne et al., 18 reported that both the velocity magnitude and the intensity of vortex circulation increase with increasing flow rate, based on their experimental investigation of arteriovenous fistulas. de Andrade Silva et al., 19 examined fistula geometries with anastomosis angles of 20°, 25°, 30°, 35°, 40°, and 45°. In their study, blood was modeled as a Newtonian fluid, and a pulsatile flow condition was applied at the arterial inlet. Hemodynamic parameters, including shear stress, velocity, and vortex formation, were analyzed at both maximum and minimum points of the pulsatile cycle. Their results suggested that angles in the range of 20°–30° are optimal for fistula creation. Bozzetto et al.,20,21 reconstructed patient-specific fistula geometries from MRI data and performed simulations using both Newtonian and Carreau non-Newtonian blood models. Their findings indicated elevated shear stress levels at the anastomosis site. Javadzadegan et al., 22 simulated a mature fistula with a side-to-side anastomosis under various flow rates, assuming Newtonian blood behavior. They observed that large vortices formed at low flow rates break down into smaller vortical structures as the flow rate increases. In 2018, de Villiers et al., 23 employed a fluid–structure interaction (FSI) model for fistula simulation and demonstrated that shear stress levels increase in the vicinity of the anastomosis. Santos et al., 24 investigated a patient-specific arteriovenous fistula model and reported that flow rotation increases at the anastomosis and venous regions, accompanied by a reduction in wall shear stress. They also observed that regions of venous narrowing are associated with elevated shear stress values. Carroll et al., 25 simulated both acute and obtuse anastomosis configurations and demonstrated that flow disturbances are significantly lower in obtuse angles compared to acute ones. Stella et al., 26 designed six fistula models with acute anastomosis angles and analyzed them under pulsatile flow conditions. Their results indicated that critical regions of disturbed flow shift toward the distal artery as the anastomosis angle increases.
Previous studies have highlighted the importance of hemodynamic factors in vascular access performance and artificial organ design. Dammers et al. investigated the effects of chronic flow changes on brachial artery diameter and shear stress in arteriovenous fistulas for hemodialysis, highlighting the relationship between elevated shear stress and vascular remodeling in clinical AVF access. 27 Alimohammadi et al. evaluated the hemodynamic effectiveness of aortic dissection treatments via virtual stenting using CFD coupled with lumped parameter models, reporting detailed assessments of wall shear stress and energy loss. 28 Shojaei et al. explored how mechanical and chemical stimuli influence differentiation of human adipose-derived stem cells into endothelial cells under shear and tensile stresses relevant to vascular environments. 29 Corbett et al. combined in vitro experiments and CFD to analyze thrombosis on artificial surfaces with shear stress, providing insights into thromboembolic risks associated with hemodynamics in artificial organ contexts. 30 Mendez Rojano et al. used multi-constituent simulations to investigate thrombus formation at ventricular assist device inlet cannula connections, emphasizing the role of shear stress in thrombogenic potential in artificial organ systems. 31 Motivated by these findings, the present study aims to provide a comprehensive hemodynamic assessment of different anastomosis angles using validated non-Newtonian blood models to identify an optimized configuration that minimizes excessive wall shear stress and pressure drop.
In the study related to Park et al., 32 only three anastomosis angles (45°, 90°, and 135°) were investigated using the Carreau non-Newtonian blood model, and pressure drop was not evaluated. Moreover, previous studies have not systematically examined the influence of different non-Newtonian blood models on hemodynamic parameters in arteriovenous fistulas, with most investigations limited to simplified vessel geometries. To clearly state the novelty and contribution of this work, the main original aspects of the present study are summarized as follows. First, unlike previous investigations that typically considered a single rheological model or focused only on limited geometrical configurations, this study systematically compares three non-Newtonian blood models (Carreau, power-law, and Casson) within realistic arteriovenous fistula geometries and validates their predictions against experimental measurements. Second, after selecting the most accurate rheological model, a comprehensive parametric investigation of seven anastomosis angles (45°, 90°, 110°, 120°, 135°, 145°, and 160°) is conducted under three distinct pulsatile flow conditions (maximum, medium, and minimum flow rates). Third, the study simultaneously evaluates multiple clinically relevant hemodynamic indicators, including wall shear stress magnitude and distribution, vortex formation, flow separation, and pressure drop between the proximal artery and vein. This integrated and validated framework provides a more complete hemodynamic assessment of obtuse anastomosis configurations and offers quantitative guidance for optimizing fistula design from both mechanical and clinical perspectives.
Beyond the geometric comparison of anastomosis angles, the present study introduces a structured and validated computational framework that integrates rheological model assessment, flow-regime differentiation (laminar–turbulent transition based on Reynolds number), and multi-condition pulsatile analysis within a unified CFD environment. Unlike earlier studies that primarily reported qualitative flow observations, this work provides quantitative correlations between anastomosis angle and three clinically critical parameters: peak wall shear stress reduction, attenuation of high-shear spatial extent, and progressive decrease in pressure drop. Moreover, the study demonstrates that obtuse configurations not only reduce shear magnitude but also significantly suppress vortex intensity and flow disturbance, thereby offering mechanistic insight into how geometry influences thrombosis risk and cardiovascular load simultaneously. This dual hemodynamic perspective, considering both local thrombogenic potential and systemic pressure burden, constitutes a novel contribution that advances geometry-based optimization strategies for arteriovenous fistula design.
Governing equations
In the present study, the flow regime within the fistula under maximum, medium, and minimum flow conditions is characterized by comparing the corresponding Reynolds numbers with those reported in Browne et al. 18 In Browne et al., 18 the distal artery was assumed to be closed for simplification, and flow was introduced solely through the proximal artery. Under those conditions, a Reynolds number of 1394 was reported, indicating turbulent flow. It should be noted that turbulence may occur at lower Reynolds numbers when flow is also introduced from the distal artery, as considered in the present study. In the current analysis, the maximum Reynolds number is 1218, which, based on the aforementioned comparison, is considered sufficient to induce turbulent flow. In contrast, the Reynolds numbers corresponding to the medium (Re = 792) and minimum (Re = 356) flow conditions indicate laminar flow regimes. Accordingly, the flow within the fistula is modeled as turbulent under maximum flow conditions, 14 and as laminar under medium and minimum flow conditions.
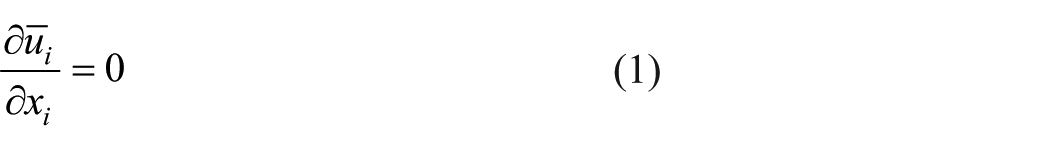
According to equations (1) and (2), the continuity and momentum equations constitute the governing equations of the present simulation. The
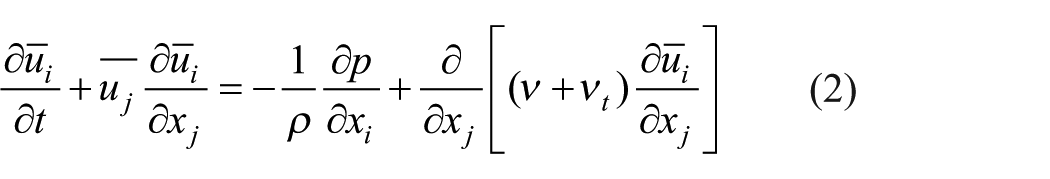
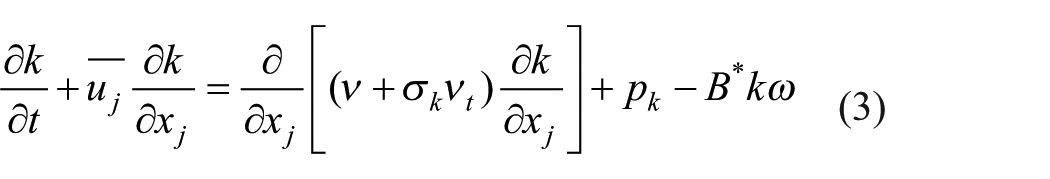
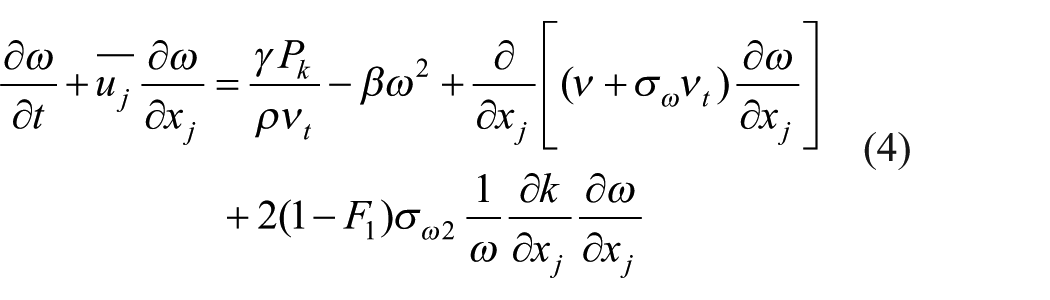
In equations (1) to (4), density (


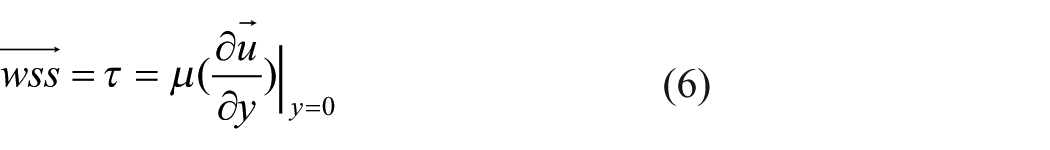
The shear stress on the fistula wall is obtained from equation (6).
For blood simulation, three non-Newtonian models of Carreau, power-law, and Casson (equations (7)–(9), respectively) are considered with the following equations35–37:


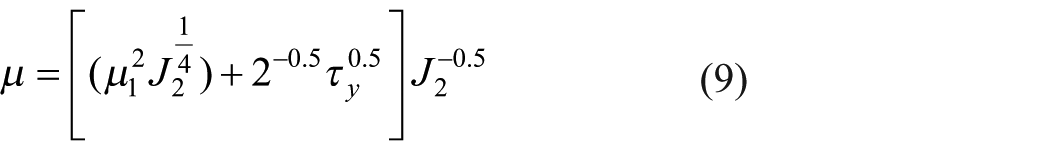
To ensure reproducibility and clarity, the rheological parameters used in the present simulations are summarized as follows. For the Carreau model, the zero-shear viscosity was taken as μ0 = 0.056 Pa s, the infinite-shear viscosity as μ∞ = 0.0035 Pa s, the time constant λ = 3.131 s, and the power index n = 0.3568. These parameters were adopted from established experimental measurements of human blood reported in the literature.35–37 For the power-law model, the zero-shear viscosity
Models that account for the interaction between non-Newtonian rheology and turbulence are not considered in the present study, consistent with previous literature. For instance, in Gavrilov and Rudyak, 38 reports results for Reynolds numbers >5500, showing that the influence of non-Newtonian viscosity on turbulence increases with increasing Reynolds number and diminishes at lower Reynolds numbers. In the current study, the maximum Reynolds number is 1218, which is relatively low; therefore, the effects of non-Newtonian behavior on turbulence are neglected. This assumption is consistent with prior studies in similar flow regimes.3,39–45
In the present study, blood was modeled as a single-phase, homogeneous, incompressible non-Newtonian fluid. Although blood is physiologically a multiphase suspension composed of plasma, red blood cells, platelets, and other formed elements, the continuum single-phase assumption is widely adopted in computational investigations of vascular access hemodynamics.3,14,22,45 At vessel diameters in the millimeter scale and under the considered shear-rate range, the macroscopic hemodynamic parameters, particularly wall shear stress (WSS), flow separation, and vortex formation, can be accurately captured using validated non-Newtonian constitutive models. Since the primary objective of this study is to evaluate the influence of geometric design parameters (anastomosis angle) on global hemodynamic indicators such as WSS distribution, vortex intensity, and pressure drop, a single-phase formulation provides an appropriate and computationally efficient framework. The particulate nature of blood, including explicit platelet tracking through discrete phase modeling, was therefore beyond the scope of the present design-oriented investigation.
Numerical method
The three-dimensional artery–vein anastomosis models used in this study were constructed as idealized geometries based on dimensions reported in the experimental work of Park et al. 32 Since detailed numerical coordinates were not directly provided in the reference, the geometric dimensions were extracted from published figures using PlotDigitizer software to ensure consistency with the experimental configuration. Subsequently, the 3D models of the arteriovenous fistula with different anastomosis angles were created in SolidWorks 2018. The artery and vein diameters, as well as the centerline distance between vessels, were defined according to the extracted dimensions. This approach enabled controlled parametric variation of the anastomosis angle while maintaining geometric consistency with the validated experimental setup.
In the present study, Anastomosis geometries with angles of 45°, 90°, 110°, 120°, 135°, 145°, and 160° were designed using SolidWorks 2018. One representative geometry is illustrated in Figure 1. The artery and vein diameters were defined as 2 and 3 mm, respectively, and a center-to-center distance between the artery and vein of 8.5 mm, consistent with commonly reported dimensions for radiocephalic arteriovenous fistulas and in accordance with the reference experimental configuration. 32 The vessel walls were assumed to be rigid, and fluid–structure interaction (FSI) effects were not considered. Although vascular tissues are not physiologically rigid, the rigid-wall assumption is widely adopted in computational studies of arteriovenous fistulas when the primary objective is comparative geometric analysis.3,14,22 This simplification reduces computational complexity and allows clear isolation of geometric effects, particularly the influence of anastomosis angle on hemodynamic parameters. It is acknowledged that neglecting wall compliance may slightly overestimate wall shear stress and pressure drop values, since compliant walls can absorb part of the pulsatile energy and dampen local velocity gradients. However, because the same rigid-wall assumption was consistently applied across all simulated configurations, the comparative trends reported in this study remain valid and reliable for design-oriented assessment.
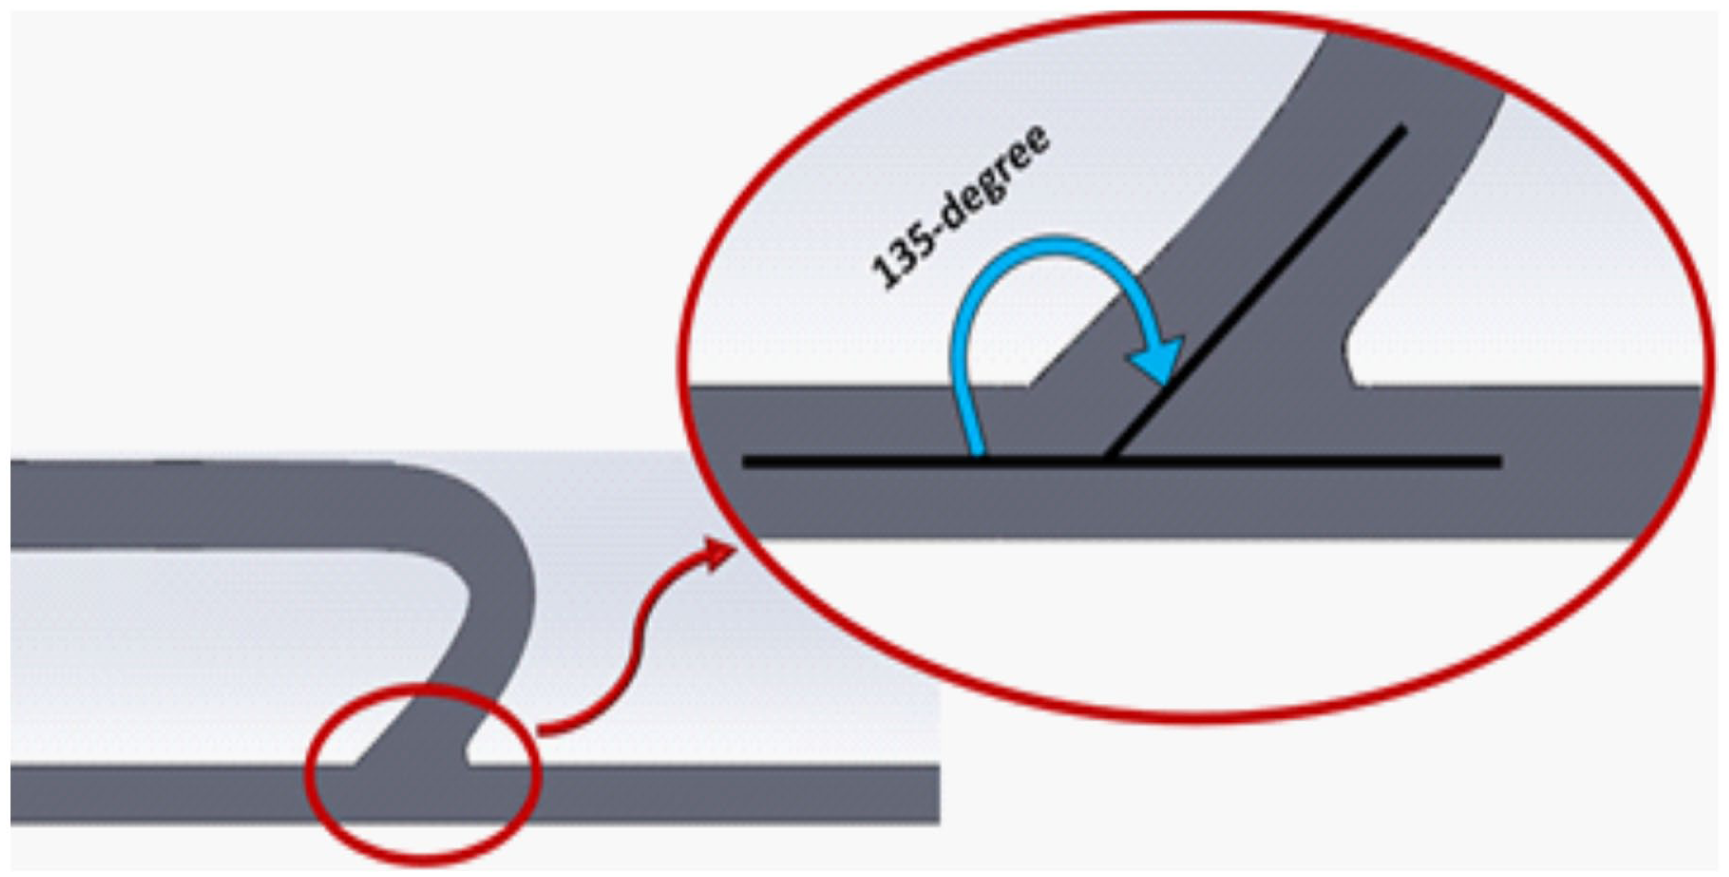
One hundred thirty-five degree fistula angle.
The pressure-velocity coupling was handled using the PIMPLE algorithm, which combines features of both SIMPLE and PISO schemes and is implemented in the pimpleFoam solver in OpenFOAM. This approach ensures numerical stability and accuracy for incompressible flow simulations. In the numerical simulations, a first-order Euler scheme and a limited linear scheme46–48 were employed for the temporal, convective, respectively. For spatial discretization, a second-order upwind scheme was employed for the diffusive terms of the momentum, ĸ, and ω transport equations to enhance accuracy in capturing velocity gradients and wall shear stress distributions. Pressure interpolation was treated using a second-order scheme to maintain consistency and reduce numerical diffusion. The use of second-order accurate discretization methods ensures reliable prediction of key hemodynamic parameters, particularly maximum wall shear stress and pressure drop, which are sensitive to numerical resolution.
The boundary conditions were defined to replicate physiologically relevant hemodynamic conditions and to ensure reproducibility. A velocity inlet boundary condition was applied at the proximal and distal artery based on three representative points (maximum, medium, and minimum flow rates) extracted from the pulsatile waveform reported in the reference experimental study. 32 At the venous outlet, a zero-gauge pressure boundary condition was prescribed, allowing the pressure field and pressure drop to develop naturally within the computational domain. The distal artery was treated consistently with the reference configuration used for validation. All vessel walls were defined with a no-slip boundary condition, assuming rigid walls. These boundary conditions enable accurate computation of velocity distribution, wall shear stress, and pressure drop between the proximal artery and proximal vein.
All numerical simulations were conducted using the open-source computational fluid dynamics platform OpenFOAM (version 8) using solver pimpleFoam. Three representative points of the pulsatile waveform, corresponding to maximum, medium, and minimum flow rates, were selected to characterize the hemodynamic conditions. For each point, a steady-state solution was obtained within the transient solver framework. The flow was considered laminar at the medium and minimum flow rates, while turbulence modeling was applied at the maximum flow rate based on the corresponding Reynolds number. With the use of transient solver of pimple foam, which can be utilized for modeling steady state flow, we simulate the steady state flow within fistula in three representative point of a pulsatile curve. The quantitative evaluation of wall shear stress (WSS) was performed at these representative steady-state conditions. In addition, the primary objective of this study is to investigate the effect of anastomosis angle on vortex formation, which is assessed qualitatively through flow field visualization. The results show that increasing the anastomosis angle reduces the likelihood and intensity of vortex formation, supporting the validity of the adopted modeling approach.
Mesh independence study
The fistula geometry at the junctions consists of three branches. The computational domain was discretized using a hybrid meshing strategy generated in ICEM 18. Structured hexahedral elements were employed in the straight arterial and venous segments to improve numerical accuracy and reduce computational cost, while unstructured tetrahedral elements were used in the anastomosis region due to its geometric complexity. The typical mesh contained ~500,000 elements, which was selected as the optimal grid resolution based on a mesh independence study. To ensure solution accuracy, three different grid densities (~250k, 500k, and 1000k elements) were tested. The velocity profiles are compared across various mesh densities. The velocity profiles were compared along two vertical and horizontal cross-sections near the anastomosis, specifically at a distance of 46 mm from the proximal artery and 6 mm from the arterial central axis, respectively. The variation between the 500k and 1000k grids was found to be negligible (<2% for velocity profile), confirming grid independence. Special refinement was applied in the near-wall region to accurately resolve velocity gradients and wall shear stress. Boundary layer refinement with progressively reduced cell size toward the wall was implemented to ensure proper capture of shear stress distribution. This approach ensured accurate evaluation of maximum wall shear stress, which is a key parameter in the present study. As shown in Figure 2, the 500k mesh is selected as the optimal grid for the simulations.
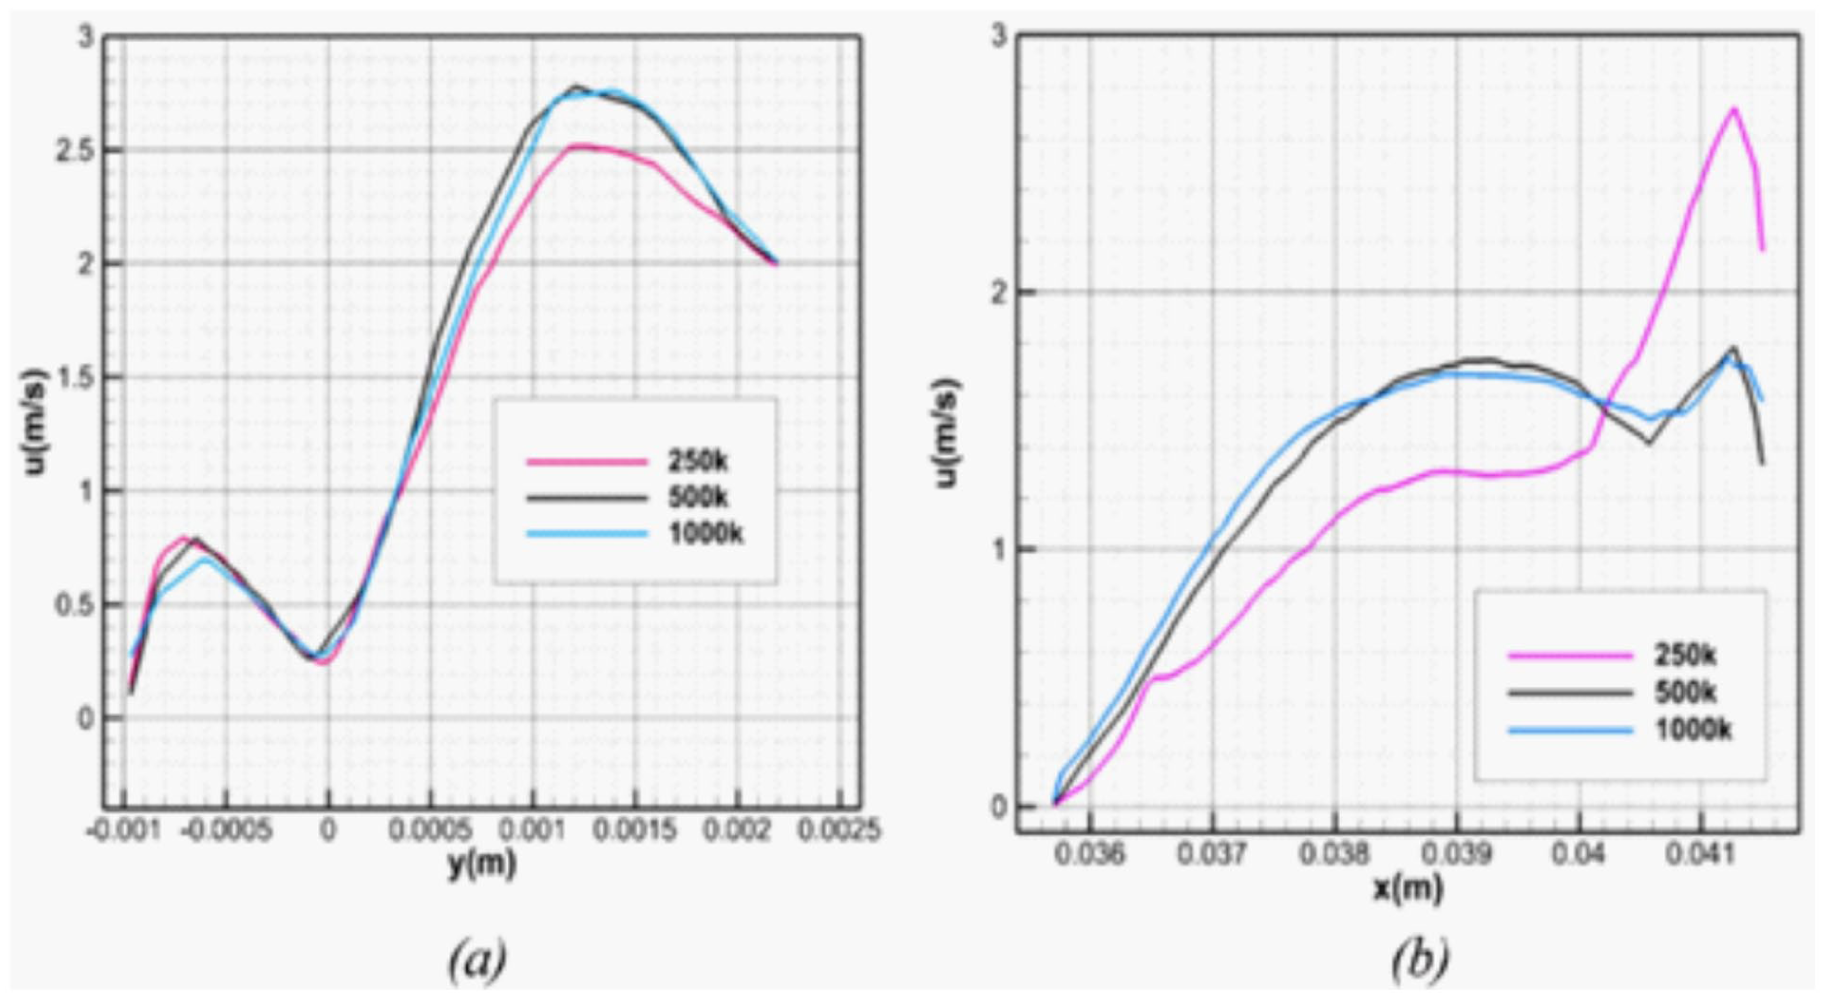
Mesh independence study in the (a) vertical and (b) horizontal sections near to the anastomosis.
Convergence of the numerical solution was assessed using both residual-based and physical-quantity monitoring criteria. For each simulation, the scaled residuals of continuity and momentum equations were required to decrease below 10−6 to ensure adequate numerical convergence. In addition to residual reduction, key hemodynamic parameters, including maximum wall shear stress and pressure drop between the proximal artery and proximal vein, were continuously monitored during the iterations. A solution was considered converged when these monitored values reached a stable plateau and exhibited variations of <1% over successive iterations for steady-state cases. This combined residual and physical-parameter monitoring approach ensured numerical stability and reliability of the reported hemodynamic results.
Results
Checking the accuracy of different non-Newtonian models in three fistulas at 45°, 90°, and 135° angles
In this research, the experimental data from Park et al. 32 are used to validate the numerical results. They investigated three types of end-to-side anastomosis with angles of 45°, 90°, and 135°, employing an artificial non-Newtonian blood analog. Three flow rates corresponding to the maximum, minimum, and intermediate values of the pulsatile blood flow curve were examined. Finally, the maximum shear stress was analyzed as the primary factor associated with fistula failure. 49 The experimental data used for validation were obtained from the clinical patient-based measurements reported by Park et al. 32 In that study, shear stress distributions were measured in a clinically representative arteriovenous fistula configuration using μ-PIV techniques. Therefore, the validation dataset reflects patient-specific physiological conditions rather than purely idealized in-vitro or animal models. Using clinical patient-derived experimental data enhances the physiological relevance of the present numerical validation. However, it should be noted that the geometry employed in the current simulations was reconstructed from the reported dimensions rather than directly obtained from medical imaging of the same patient, which may introduce minor geometric discrepancies. Nevertheless, the close agreement in maximum wall shear stress supports the reliability of the computational framework.
In the first section, the flow patterns and maximum shear stress are compared for three different non-Newtonian models (Carreau, power-law, and Casson) at anastomosis angles of 45°, 90°, and 135°. 32 The velocity measurements reported in Park et al. 32 are used to generate contour plots, which are then compared with the simulated velocity contours. Figure 3(a) illustrates the points along the pulsatile blood flow curve that were used in the experiment. Figure 3(b) presents the experimental results at the maximum flow rate, which were reported with an 8% error 32 while Figure 3(c) shows the velocity boundary conditions employed in the present study. It should be noted that all simulations are performed under steady-state conditions.
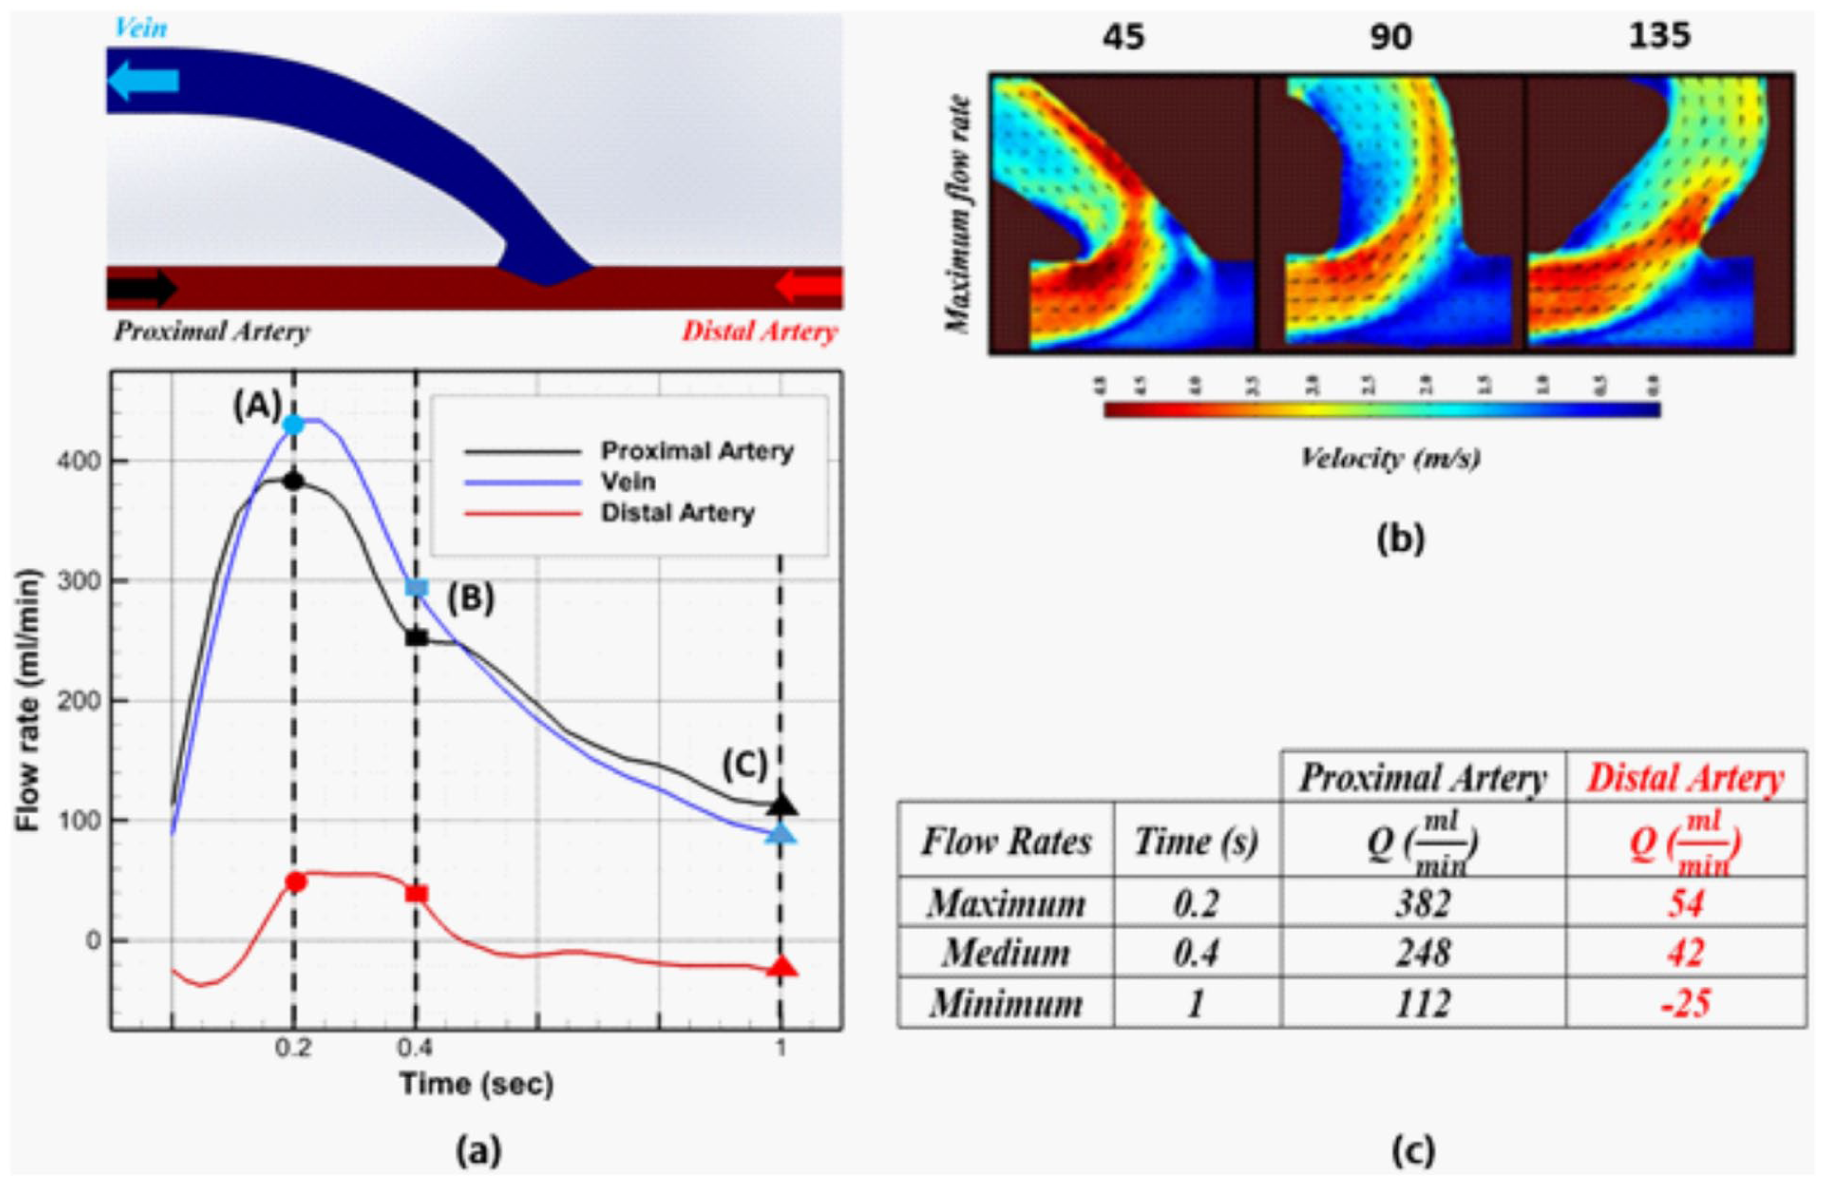
(a) Points of blood pulsatile curve for boundary conditions of simulation, (b) velocity contour of the experimental results, 32 and (c) velocity boundary conditions used in the present study.
Flow pattern at maximum flow rate
The pulsatile flow data at t = 0.2 s were used to represent the maximum flow rate condition in the simulations. Figure 4 presents the velocity contours obtained for the three non-Newtonian blood models (Carreau, power-law, and Casson) under this condition. At an anastomosis angle of 45°, the maximum velocity predicted by all three models is ~3.7 m/s. At 90°, the maximum velocities are 3.5, 3.6, and 3.6 m/s for the Carreau, power-law, and Casson models, respectively. At 135°, the corresponding values are 3.3, 3.5, and 3.5 m/s. According to the experimental results shown in Figure 3(b), the maximum velocity at 45° is 4.8 m/s, while at 90° and 135° it is 3.3 m/s. It should be noted that the experimental velocity fields were reported as contour plots and are associated with an uncertainty of ~8%. Based on this comparison, the predicted maximum velocities deviate from the experimental values by 22.9%, 22.9%, and 20.8% at 45°; 7.9%, 5.2%, and 5.2% at 90°; and 13.0%, 7.9%, and 7.9% at 135° for the Carreau, power-law, and Casson models, respectively.
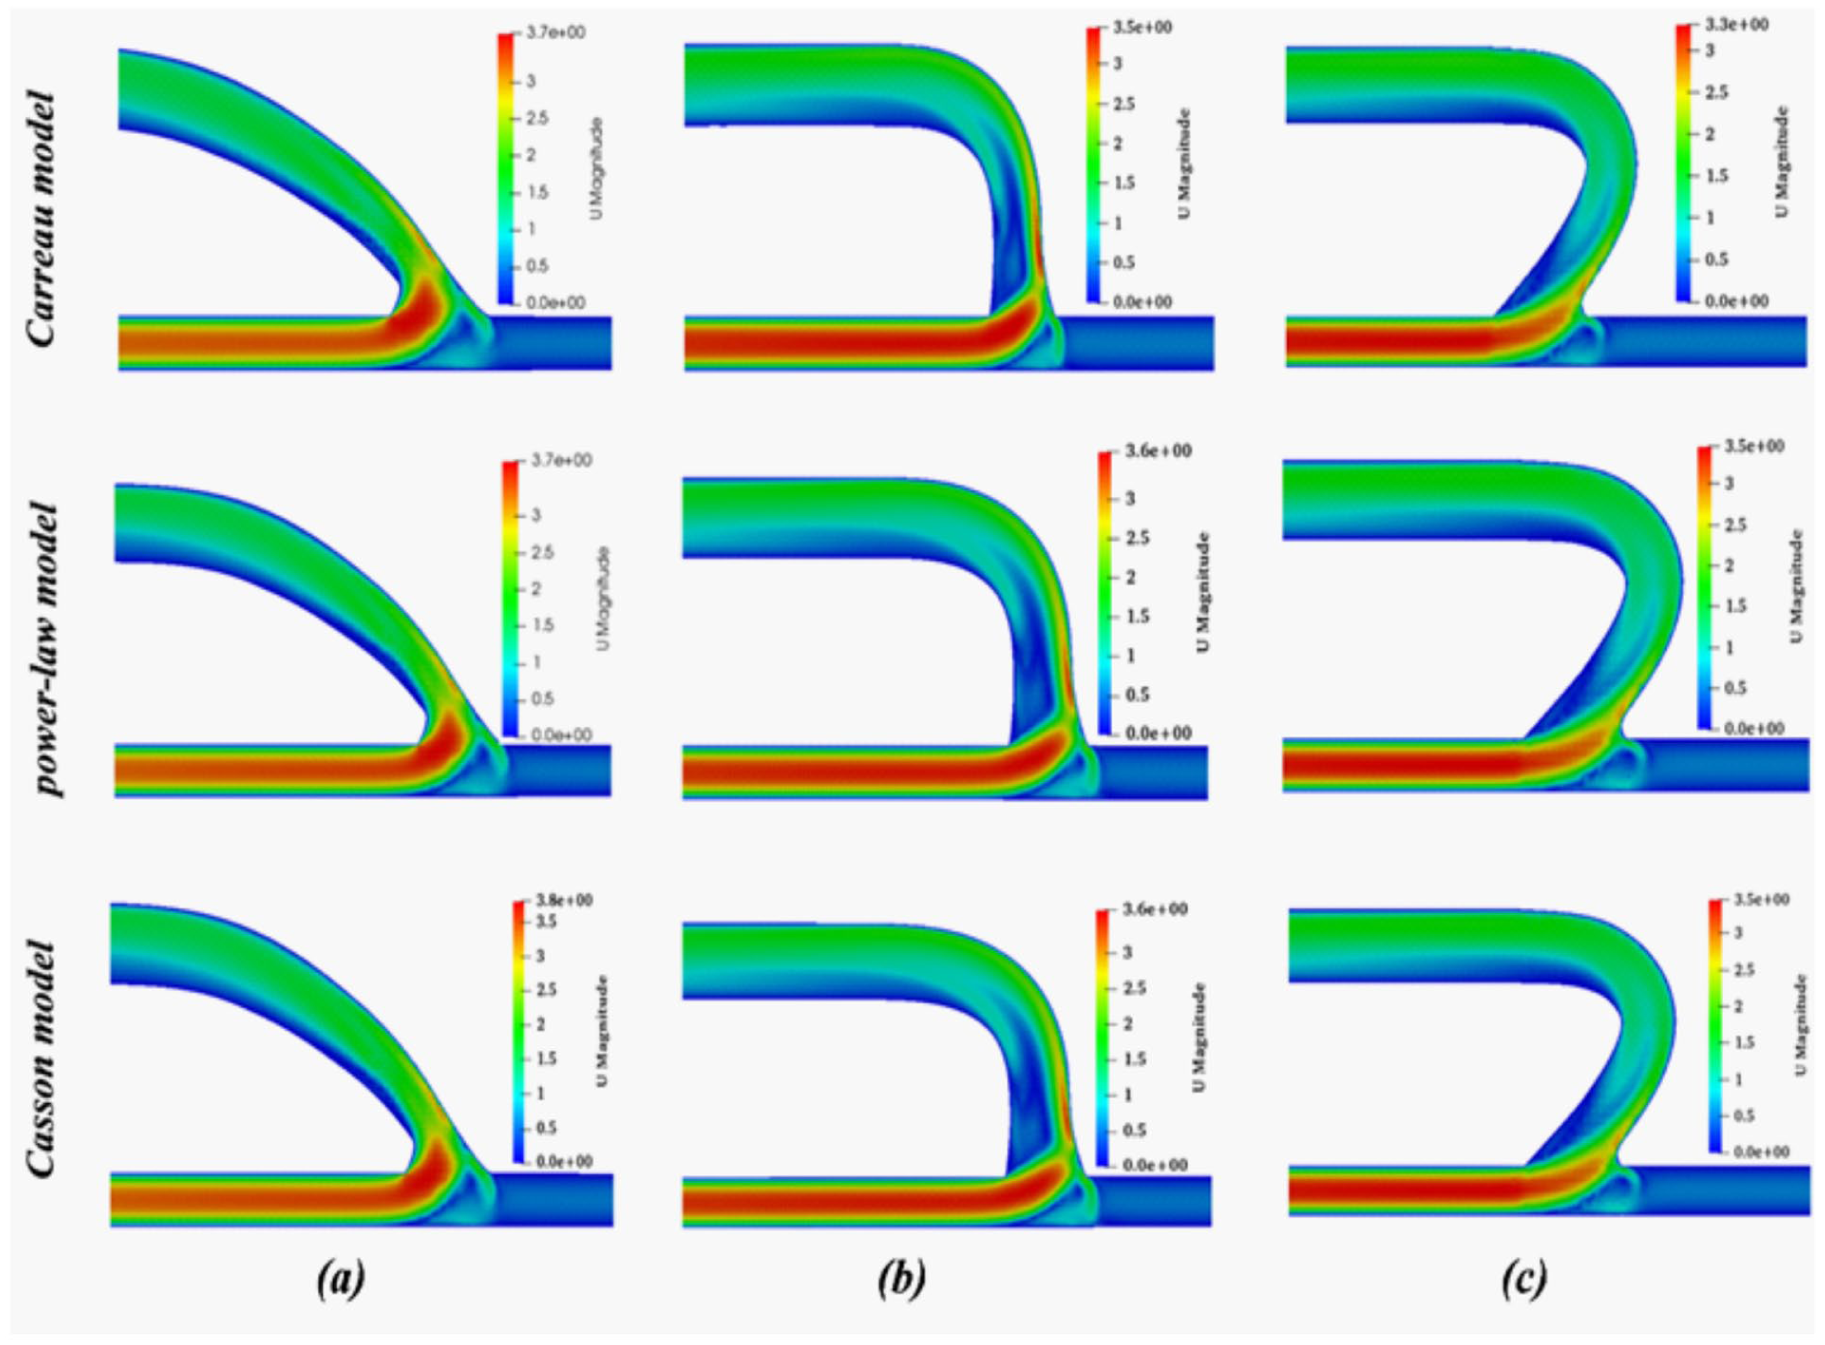
Velocity contour for different non-Newtonian models at three angles (a) 45°, (b) 90°, and (c) 135° in the maximum flow rate.
The results indicate that the simulations are consistent with the expected flow physics. Among the evaluated models, the Casson non-Newtonian model provides more accurate predictions of the velocity field compared to the power-law and Carreau models, and is therefore more suitable for velocity estimation. Additionally, the results obtained from the Casson and power-law models exhibit closer agreement with each other.
Shear stress at maximum flow rate
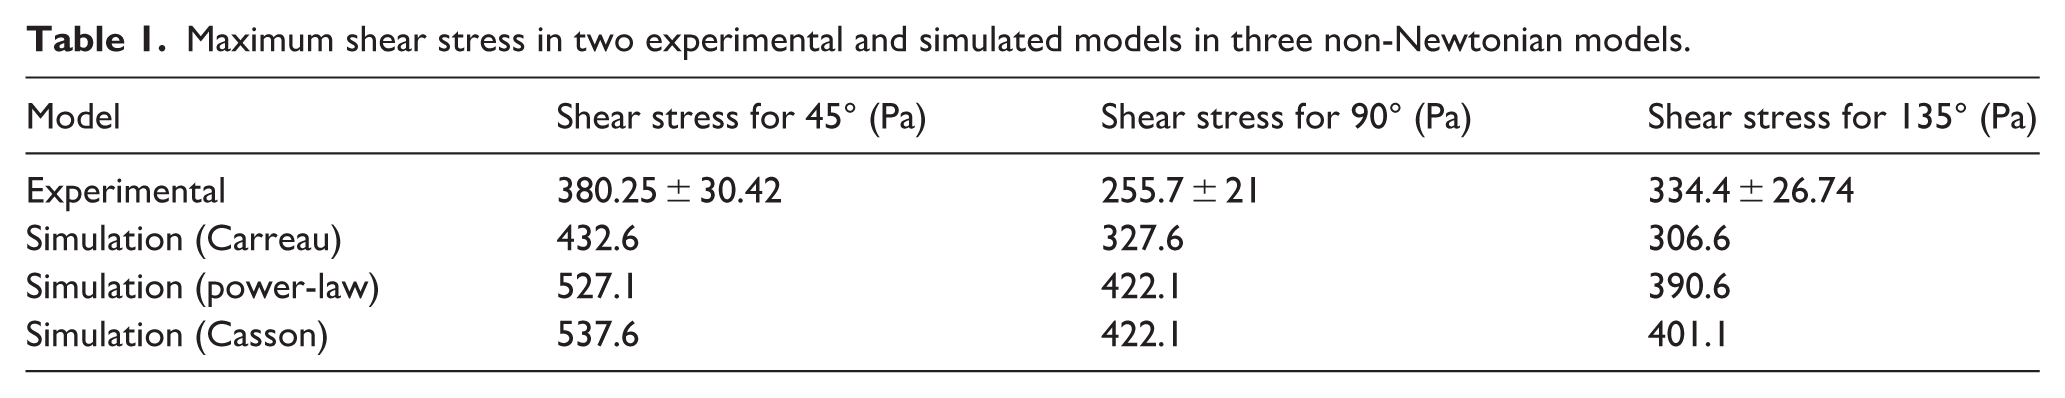
The selection of the Carreau model is based on the quantitative comparison presented in Table 1, where the predicted maximum wall shear stress values for the three rheological models are evaluated against the experimental measurements of Park et al. 32 The results indicate that the deviations from the experimental values at 45° are 13.7%, 38.6%, and 41.4% for the Carreau, power-law, and Casson models, respectively. At 90°, the corresponding deviations are 28%, 65%, and 65%, while at 135°, they are 8.2%, 16.8%, and 20%, respectively. As shown, the Carreau model consistently exhibits the smallest deviation from the experimental shear stress values across the investigated anastomosis angles. In contrast, the power-law and Casson models overestimate shear stress to a greater extent, particularly at 90° and 135° configurations. Therefore, although the velocity predictions of the three models are relatively similar, the Carreau model yields shear stress values that are in closer agreement with the experimental data. Based on the lowest relative error in maximum wall shear stress prediction, the Carreau model was selected as the most accurate rheological representation for subsequent parametric simulations.
Maximum shear stress in two experimental and simulated models in three non-Newtonian models.
The wall shear stress (WSS) was computed directly from the velocity gradient at the vessel wall according to equation (6). For each configuration and flow condition, the maximum wall shear stress was defined as the single peak value over the entire inner surface of the fistula wall. Therefore, the reported maximum shear stress values represent the global maximum WSS within the computational domain rather than an averaged quantity over a predefined region. In addition to reporting this peak value, contour plots were analyzed to evaluate the spatial distribution and extent of high-shear regions, enabling qualitative assessment of thrombosis-prone areas. This definition ensures consistent comparison across different anastomosis angles and flow conditions.
Analysis of the simulation resutls of all angles of anastomosis
For further investigation of anastomoses with obtuse angles, fistula geometries with angles of 110°, 120°, 145°, and 160° were simulated under maximum, medium, and minimum flow rate conditions using the Carreau non-Newtonian model. The results were analyzed in terms of flow patterns to assess the potential for sedimentation, wall shear stress to evaluate the risk of thrombosis, and pressure drop between the proximal artery and proximal vein. These hemodynamic parameters were systematically compared across the different anastomosis angles. The probability of sedimentation at the anastomosis site was evaluated based on qualitative observation of anastomosis regions, particularly near the upper and lower walls of the anastomosis in acute-angle configurations. As the anastomosis angle increased, the intensity and spatial distribution of the vortical zones decreased, indicating reduced sedimentation potential. Therefore, the reported “probability of sedimentation” refers to vortical regions, which is purely qualitative visualization and characterized by disturbed flow patterns.
In the present study, the term “risk of thrombosis” refers to a hemodynamic risk indicator rather than a direct clinical prediction of thrombus formation. Generally, thrombosis risk in this work is assessed qualitatively based on the evaluation of maximum WSS and spatial extent of high-shear regions. This approach enables geometry-based comparison of hemodynamic conditions associated with thrombogenic potential while remaining consistent with the scope of a CFD-driven design optimization study.
The maximum flow rate corresponding to the peak systolic phase of the pulsatile waveform was selected to evaluate the worst-case hemodynamic condition, since wall shear stress, velocity gradients, and pressure drop typically reach their highest values at this time point. Assessing this condition enables identification of the most critical thrombosis-prone and mechanically demanding scenario for each anastomosis configuration.
Flow pattern
Figures 5 and 6 illustrate the velocity vector fields at different anastomosis angles under maximum, medium, and minimum flow rate conditions. A reduction in velocity is observed in regions where the cross-sectional area increases near the anastomosis. For all angles and flow conditions, flow separation occurs due to the abrupt redirection of the flow as it passes through the anastomosis. Consequently, a significant portion of the flow is directed toward the right wall, leading to locally increased velocity. This increase in velocity near the vessel wall is associated with elevated shear stress and a higher risk of thrombosis. In contrast to the maximum and medium flow rates, at the minimum flow rate, a portion of the flow is diverted toward the distal artery, thereby reducing the effective flow through the fistula. Over time, the presence of vortical structures may promote sedimentation within the flow domain, which can further reduce the flow rate and impair fistula performance.
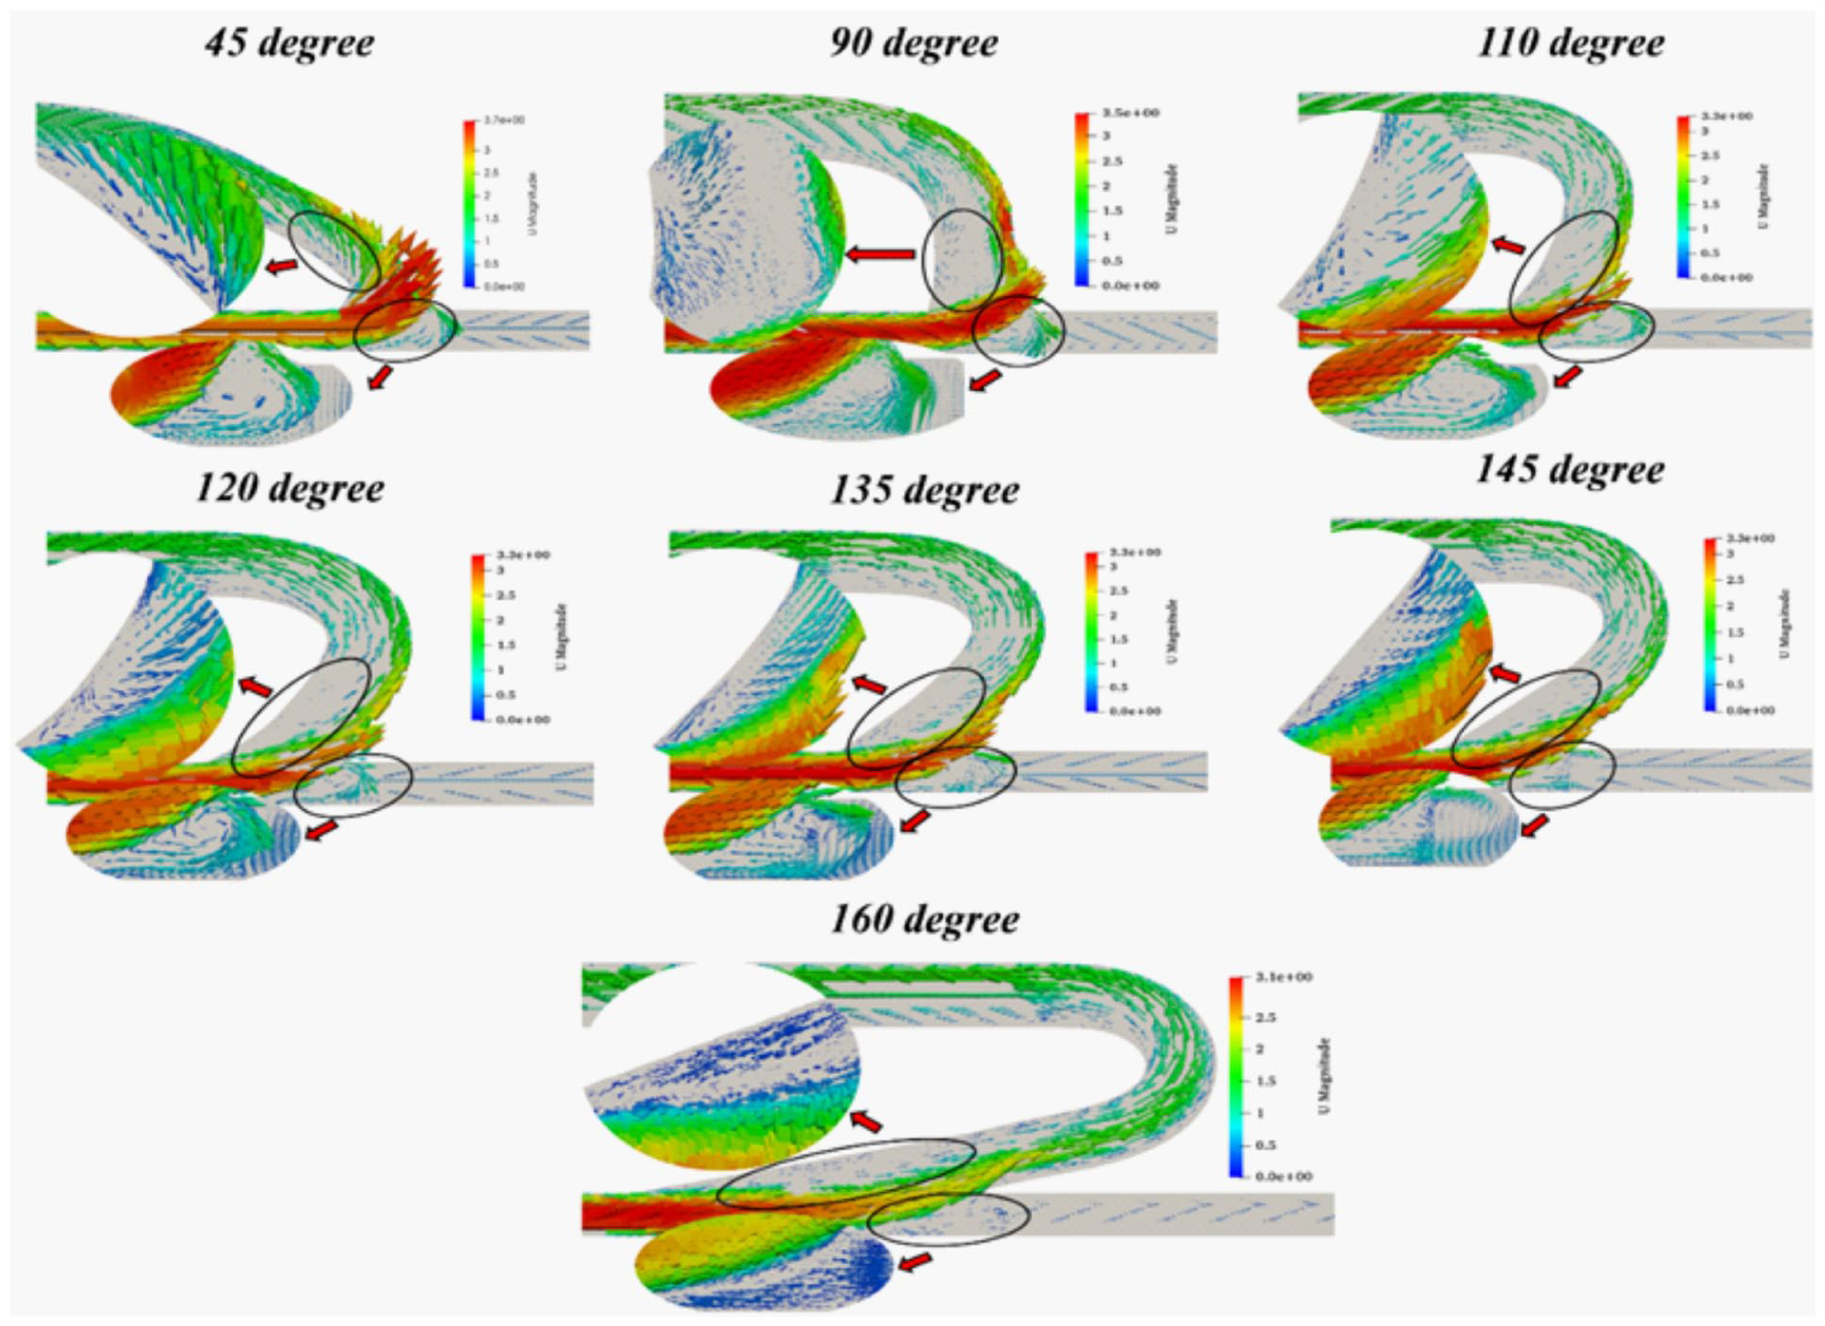
Velocity vectors for the seven anastomosis angles in the maximum flow rate.
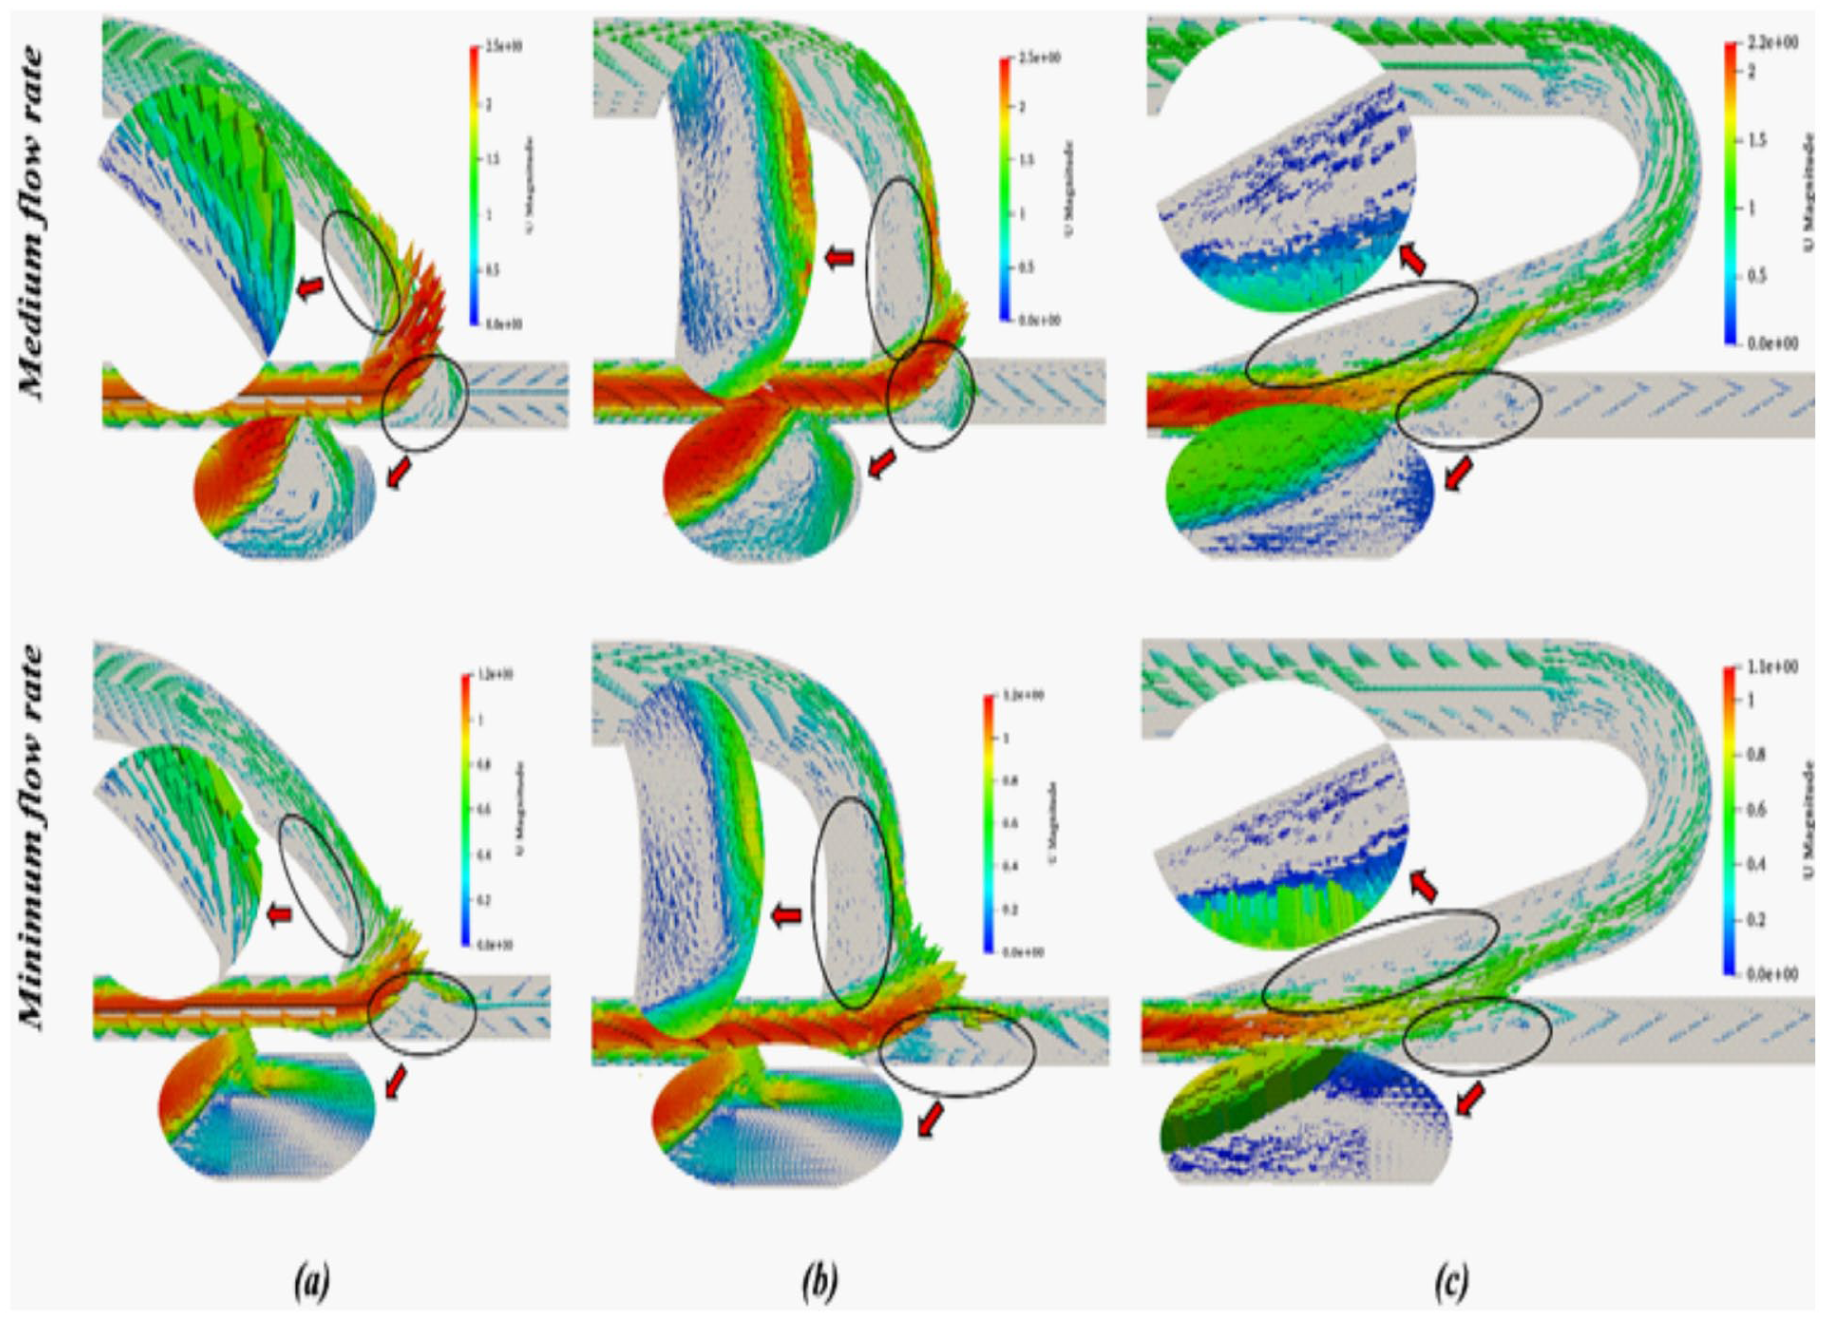
Velocity vectors for the anastomosis angles (a) 45°, (b) 90°, and (c) 160° in the medium and minimum flow rate.
The velocity vector fields in Figures 5 and 6 indicate that two vortices are formed at the anastomosis site for angles ranging from 90° to 145°. At an anastomosis angle of 160°, no vortex formation is observed at the bottom of the anastomosis under maximum and medium flow rate conditions, suggesting a reduced risk of sedimentation. Under minimum flow conditions, the vortex at the bottom of the anastomosis shifts toward the right side and becomes significantly smaller compared to those observed at higher flow rates. At an angle of 45°, no vortex is formed at the top of the anastomosis under minimum flow conditions. In contrast, at 90°, a relatively larger vortex develops at the top region of the anastomosis compared to other angles, increasing the likelihood of sedimentation. Overall, as the anastomosis angle increases, the size and intensity of vortices gradually decrease, thereby reducing the associated risk.
Shear stress
An improved understanding of the factors influencing thrombosis and its clinical implications remains essential. Hemodynamic parameters, particularly wall shear stress, were first recognized in the early 1970s and have since been extensively investigated for their role in thrombus formation. It has been reported that an increase in shear stress at the vessel wall elevates the likelihood of thrombosis, which may subsequently lead to vessel occlusion and impaired blood flow.49–55 As shown in Figures 7 and 8, the maximum wall shear stress decreases with increasing anastomosis angle from 45° to 160°. In addition to the reduction in peak shear stress, the spatial extent of regions experiencing high shear stress also decreases. Furthermore, with increasing anastomosis angle, these regions shift from upstream locations toward the anastomosis site.
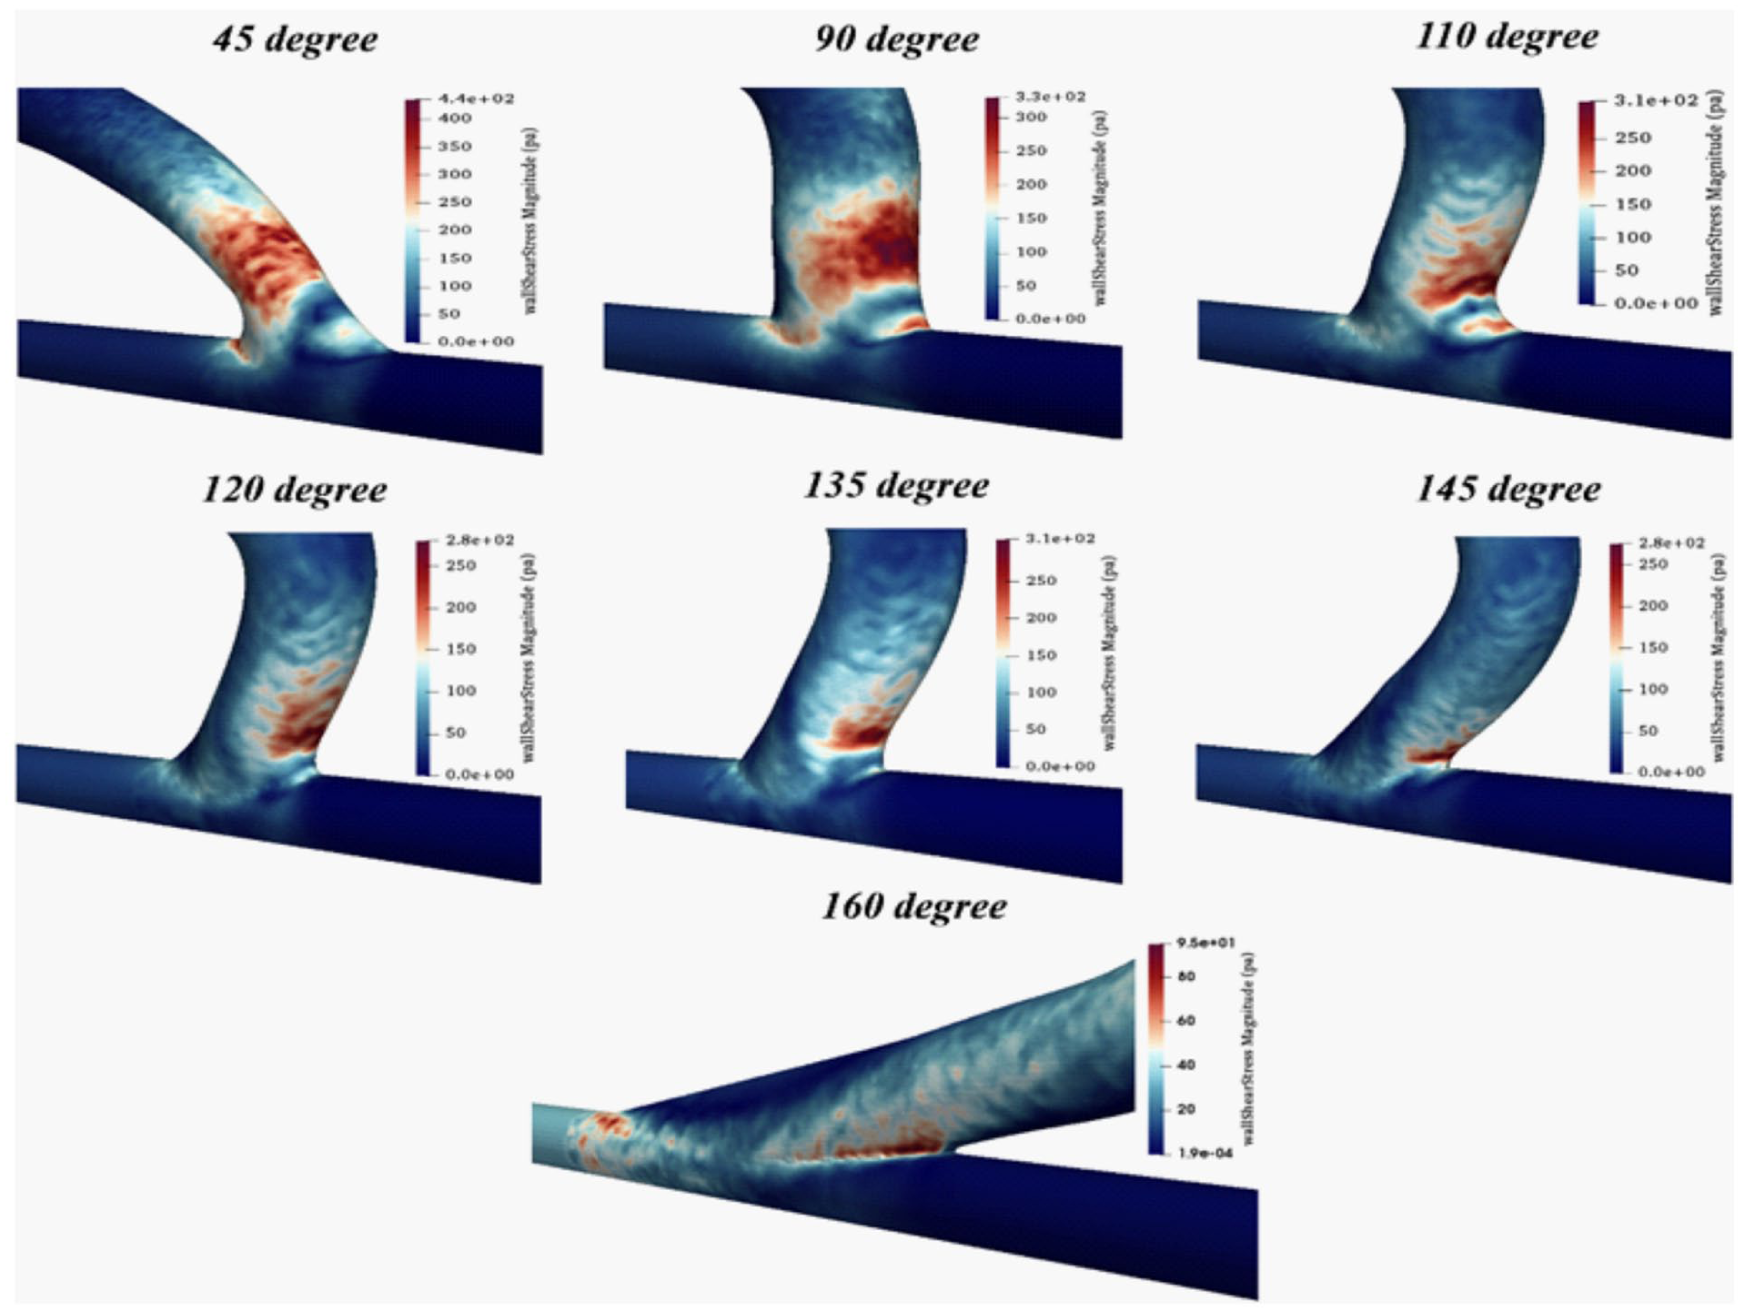
Shear stress contures for the seven anastomosis angles in the maximum flow rate.
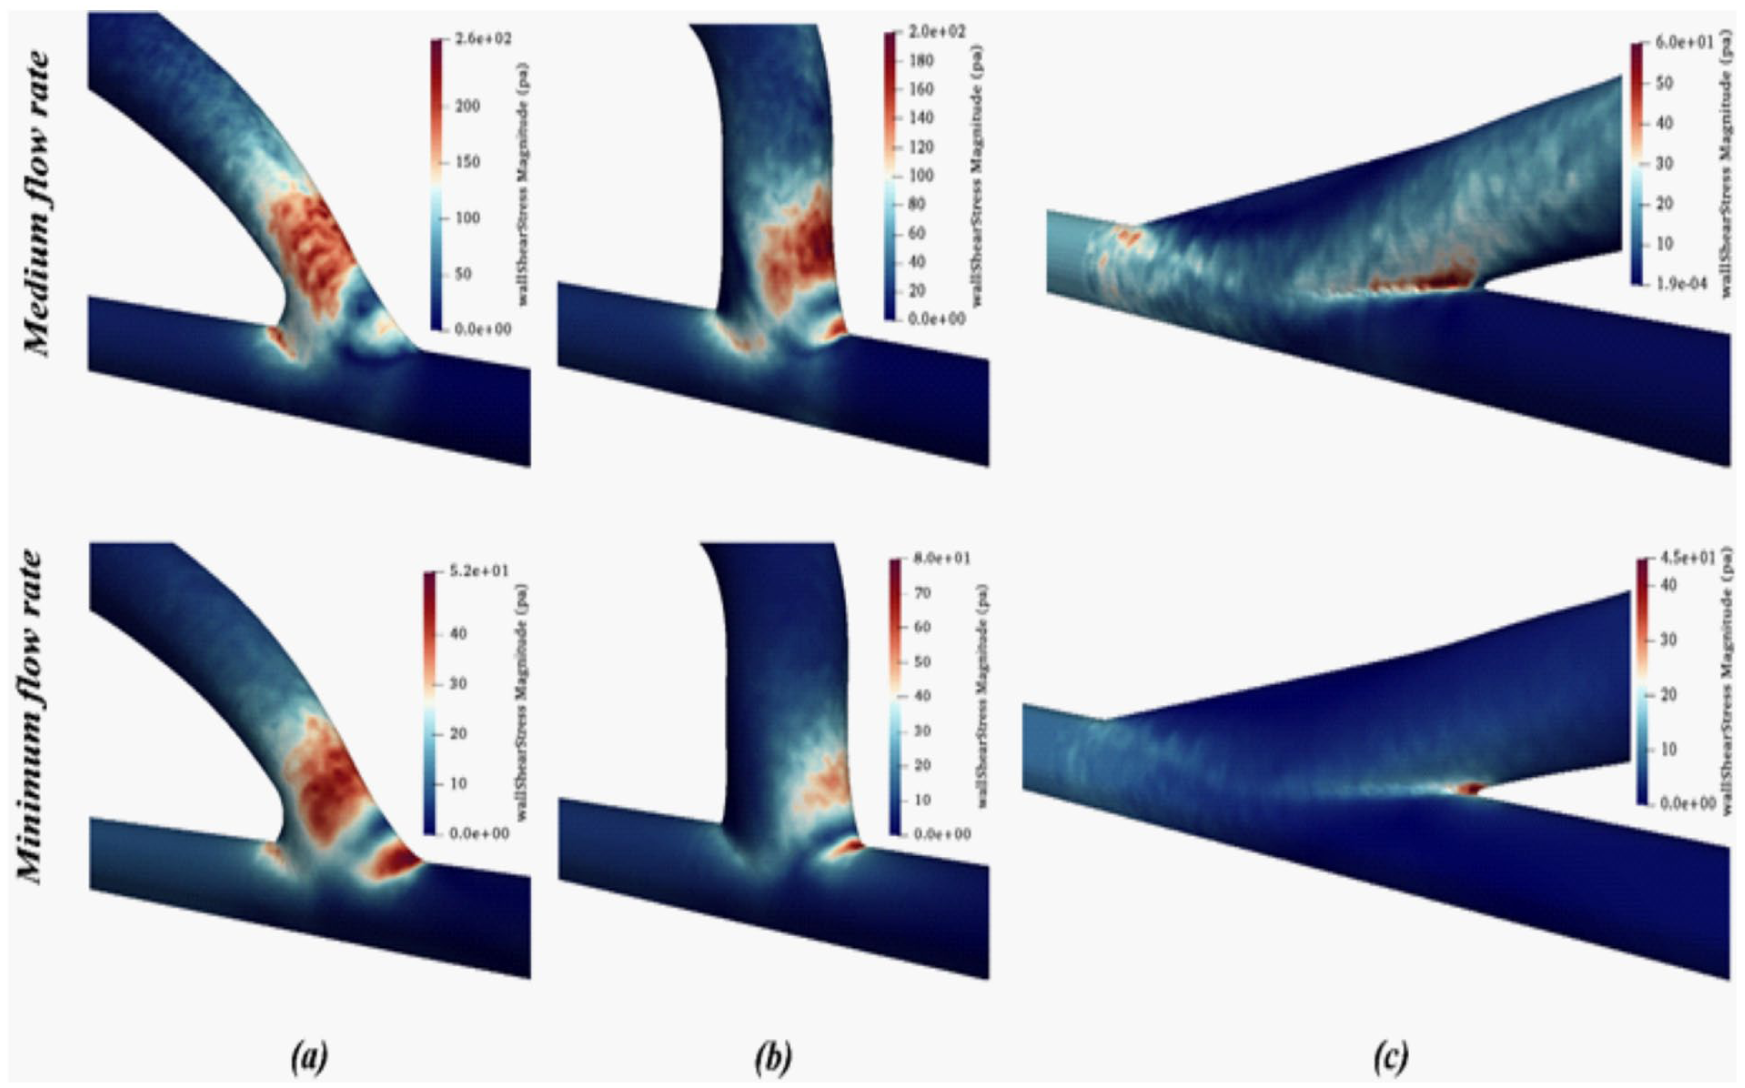
Shear stress contures for the anastomosis angles (a) 45°, (b) 90°, and (c) 160° in the medium and minimum flow rate.
It should be noted that, due to the significant differences in shear stress values between acute and obtuse anastomosis angles, the use of a single color scale for all cases would obscure regions of high shear stress in the obtuse configurations. Consequently, separate color scales are employed for each angle to ensure accurate visualization and comparison of the shear stress contours.
The hemodynamic trends observed in this study can be physically interpreted through the interaction between flow momentum, viscous effects, and geometric redirection at the anastomosis site. The anastomosis angle fundamentally controls how abruptly the arterial jet is redirected into the venous segment. In acute configurations, the sharp change in flow direction produces strong velocity gradients near the vessel wall, leading to elevated wall shear stress (WSS). These intensified gradients arise from rapid deceleration and flow impingement on the venous wall, which locally amplifies shear forces. As the anastomosis angle becomes more obtuse, the transition of momentum from artery to vein becomes smoother, reducing near-wall velocity gradients and consequently lowering peak WSS values. Wall shear stress represents the tangential viscous force exerted by blood on the endothelial surface and is directly proportional to the velocity gradient at the wall. Therefore, changes in geometry that modify flow acceleration, separation, or impingement directly influence WSS magnitude and spatial distribution. The substantial reduction in maximum WSS observed for obtuse angles reflects improved momentum alignment and reduced flow disturbance. From a biomechanical perspective, minimizing extreme shear levels may contribute to improved endothelial stability and reduced thrombogenic stimulus, particularly under peak flow conditions.
Table 2 presents the maximum wall shear stress values for the seven anastomosis angles. A quantitative comparison shows that increasing the anastomosis angle from 45° to 160° resulted in ~78% reduction in maximum wall shear stress under peak flow conditions (from 432.6 to 94.5 Pa). When increasing the angle from 90° to 145°, a reduction of ~16% was observed at maximum flow rate (from 327.6 to 275.1 Pa). Similarly, under medium flow conditions, the maximum WSS decreased by ~76% when the angle increased from 45° to 160° (from 254.1 to 59.85 Pa). These quantitative reductions demonstrate that the transition from acute to obtuse configurations produces a substantial decrease in peak shear stress, particularly when comparing 45° to angles above 120°. The magnitude of reduction becomes more pronounced at higher flow rates, highlighting the hemodynamic advantage of obtuse anastomosis geometries under peak systolic conditions. In contrast, under minimum flow rate conditions, the trend differs: the highest shear stress is observed at 90° (79.8 Pa), while the lowest value occurs at 160° (42 Pa).
Maximum shear stress values at maximum, medium, and minimum flow rates for seven anastomosis angles.
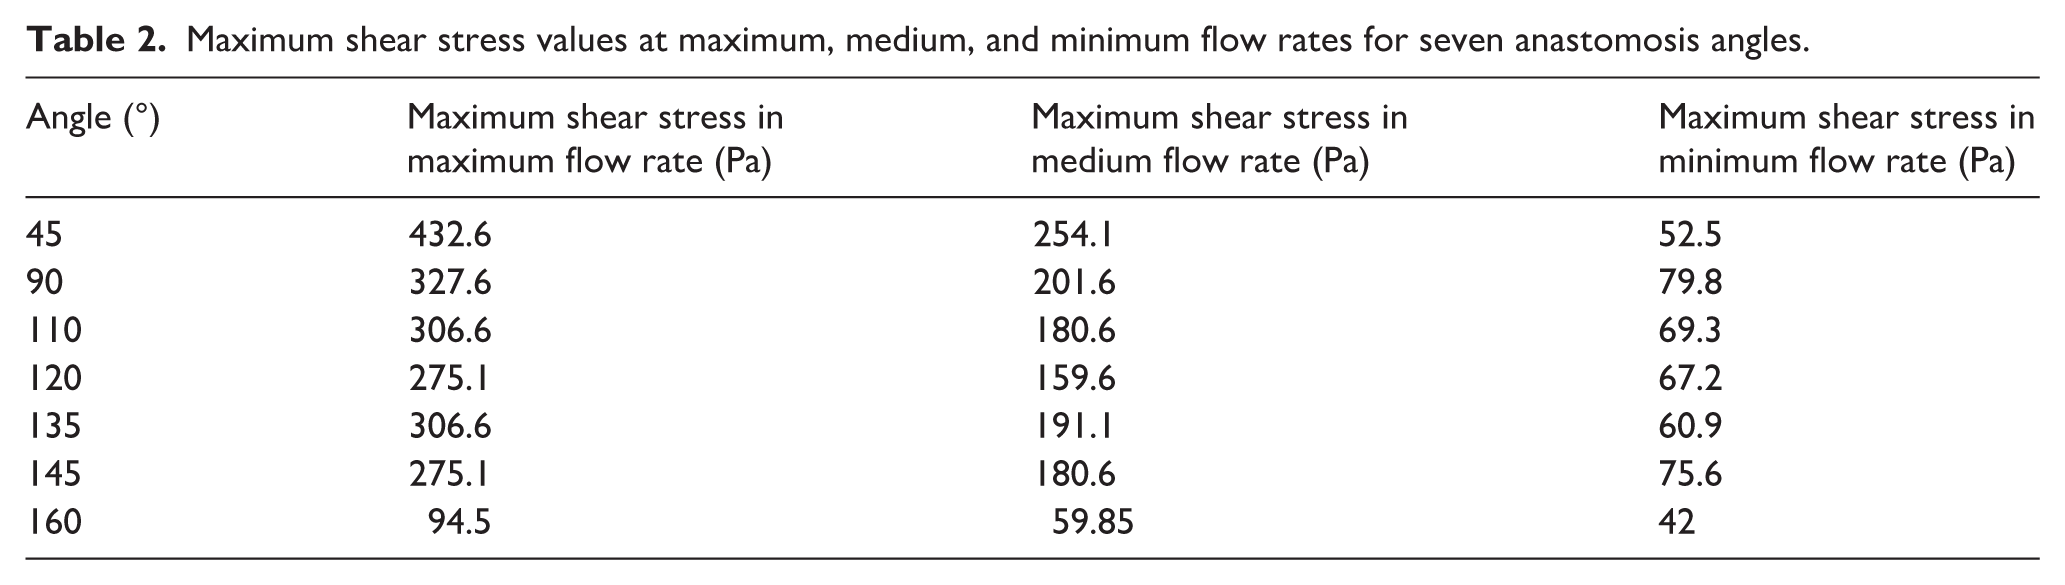
At the maximum and intermediate flow rates, the maximum shear stress decreases progressively as the anastomosis angle increases from 45° to 120°. In contrast, as the angle increases from 120° to 135°, the shear stress rises by ~30 Pa. With a further increase in the anastomosis angle from 135° to 160°, the shear stress again follows a decreasing trend, reaching its minimum value at 160°. Additionally, at the minimum flow rate, the variation in maximum shear stress is negligible across different angles.
In the present work, the term “high shear stress region” does not refer to a predefined threshold value. Instead, it denotes areas of the vessel wall located near the peak wall shear stress (WSS) values observed in each configuration. The primary objective of this work is to compare the maximum WSS and the spatial distribution of regions with elevated shear stress across seven anastomosis angles. This qualitative assessment of WSS contours provides insight into how geometric variations influence both the magnitude and extent of elevated shear regions. The results show that, with increasing anastomosis angle, not only does the maximum WSS decrease, but the extent of regions experiencing high shear stress is also reduced. This trend supports the identification of more favorable configurations for fistula design based on combined magnitude and distribution of shear stress.
Although the 160° anastomosis angle demonstrated the lowest maximum wall shear stress and pressure drop, its practical implementation may be limited due to surgical complexity and anatomical constraints. While wall shear stress generally decreases as the anastomosis angle increases, the improvement beyond 120° becomes progressively smaller relative to the associated technical difficulty. The 120° configuration provides a substantial reduction in maximum shear stress and high-shear regions compared to acute angles, while remaining surgically feasible. Therefore, the 120° angle is proposed as a clinically practical and hemodynamically efficient compromise rather than the absolute minimum-stress configuration.
Pressure drop
Heart failure is one of the most serious complications associated with arteriovenous fistulas. Due to the higher blood flow through the fistula compared to normal physiological conditions, the heart must work harder to compensate for the associated reduction in blood pressure. Over time, this increased cardiac workload can weaken the heart muscle and ultimately lead to heart failure in dialysis patients. 56
The pressure drop was defined as the difference between the area-averaged static pressure at the proximal artery inlet cross-section and the area-averaged static pressure at the proximal vein outlet cross-section. Specifically, pressure values were extracted by performing surface averaging over the corresponding inlet and outlet cross-sections to avoid local numerical fluctuations. This definition reflects the overall hydraulic resistance imposed by the anastomosis geometry and allows consistent comparison of energy loss among different anastomosis angles and flow conditions.
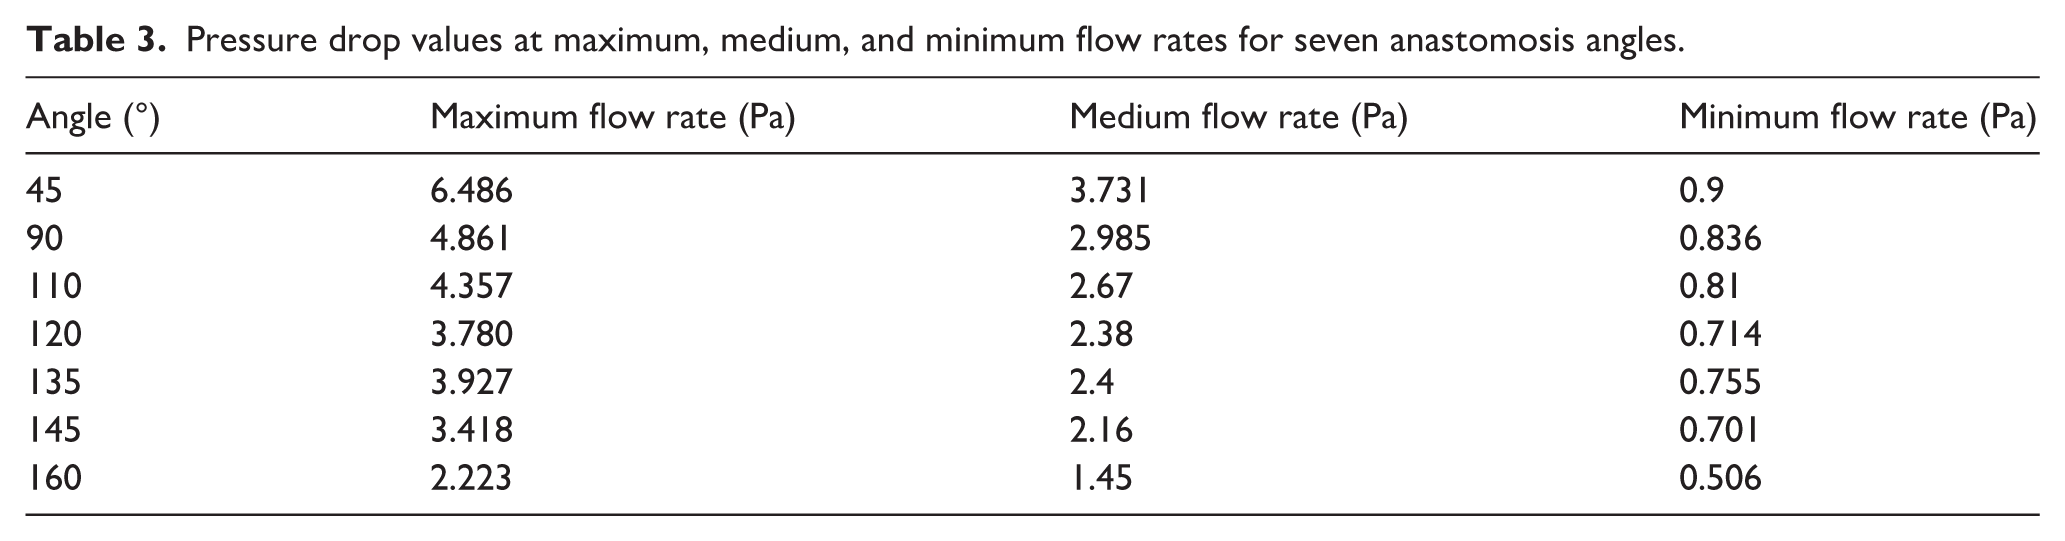
Table 3 presents the exact values of the pressure drop between the proximal artery and proximal vein for seven anastomosis angles. The results indicate that, at the maximum flow rate, the pressure drop decreases by ~65% as the angle increases from 45° to 160°. At the medium and minimum flow rates, the reductions are ~61% and 44%, respectively. For all three flow rates, the pressure drop decreases as the anastomosis angle increases from 45° to 120°. However, as the angle increases further to 135°, the pressure drop rises. With a subsequent increase from 135° to 160°, the pressure drop resumes its decreasing trend, reaching its minimum value at 160°. Therefore, increasing the anastomosis angle can reduce the pressure drop and, consequently, the risk of heart failure in dialysis patients.
Pressure drop values at maximum, medium, and minimum flow rates for seven anastomosis angles.
The pressure drop across the fistula quantifies the overall hydraulic resistance imposed by the anastomosis geometry. Larger pressure losses indicate greater energy dissipation due to abrupt directional changes and enhanced viscous friction. The progressive decrease in pressure drop with increasing anastomosis angle demonstrates that obtuse configurations allow more efficient flow transmission with reduced energy loss. This reduction in hydraulic resistance is clinically relevant, as it implies lower cardiac workload required to maintain adequate flow through the fistula. Collectively, the observed reductions in WSS and pressure drop highlight the mechanistic advantage of smoother geometric transitions in optimizing both local and global hemodynamic performance.
To ensure the reliability of the computational framework, the numerical results were first validated against experimental data reported in the literature under steady-state conditions at the maximum flow rate. 32 Since the available benchmark data corresponded to peak flow conditions, three non-Newtonian blood models (Carreau, power-law, and Casson) were systematically evaluated and their predicted maximum wall shear stress (WSS) values were quantitatively compared with the experimental measurements. The Carreau model demonstrated the smallest deviation from the experimental WSS data and was therefore selected as the most appropriate rheological model for further investigation. Following this validation step, the selected model was employed to conduct simulations at three representative flow rates (maximum, medium, and minimum) across various anastomosis angles. Based on the computed WSS distributions and pressure drop values, the optimal anastomosis angle was identified. This two-step procedure, benchmark validation under steady-state conditions followed by extended parametric analysis, ensures both numerical accuracy and robustness of the design-oriented conclusions presented in this study.
Conclusion
This study systematically investigated the influence of blood rheology and anastomosis angle on the hemodynamic performance of arteriovenous fistulas using computational fluid dynamics. Among the three evaluated non-Newtonian blood models, the Carreau model provided the closest agreement with experimental shear stress measurements and was therefore selected for extended simulations. Analysis of seven anastomosis angles under three flow conditions demonstrated that increasing the anastomosis angle significantly improves hemodynamic characteristics. Specifically, maximum wall shear stress, the spatial extent of high shear stress regions, vortex intensity, and pressure drop between the proximal artery and vein decreased as the angle increased. At peak flow rate, the 160° configuration reduced maximum shear stress by ~78% compared to the 45° configuration. Similar trends were observed for pressure drop, indicating reduced cardiovascular load. Although the 160° angle exhibited the most favorable hemodynamic performance, surgical complexity may limit its practical implementation. Considering both mechanical performance and operative feasibility, the 120° anastomosis angle appears to provide an optimal balance between reduced thrombosis risk and surgical practicality. These findings highlight the importance of anastomosis geometry in AVF design and provide quantitative guidance for improving long-term fistula performance in hemodialysis patients.
Footnotes
Declaration of conflicting interests
The authors declared no potential conflicts of interest with respect to the research, authorship, and/or publication of this article.
Funding
The authors received no financial support for the research, authorship, and/or publication of this article.