
Abstract
Objective:
To prove the feasibility of Multimodal Fiber Optic Spectroscopy (MFOS) analysis in bladder cancer (BCa) detection, grading, and staging.
Materials and methods:
Bladder specimens from patients underwent TURBT or TURP were recorded and analyzed with MFOS within 30 min from excision. In detail, our MFOS combined fluorescence, Raman spectroscopy, and diffuse reflectance. We used these optical techniques to collect spectra from bladder biopsies, then we compared the obtained results to gold standard pathological analysis. Finally, we developed a classification algorithm based on principal component analysis-linear discriminant analysis.
Results:
A total of 169 specimens were collected and analyzed from 114 patients, 40 (23.7%) healthy (from TURP), and 129 (76.3%) with BCa. BCa specimens were divided according to their grade—34 (26.4%) low grade (LG) and 95 (73.6%) high grade (HG) BCa—and stage—64 (49.6%) Ta, 45 (34.9%) T1, and 20 (15.5%) T2. MFOS-based classification algorithm correctly discriminated healthy versus BCa with 90% accuracy, HG versus LG with 83% accuracy. Furthermore, it assessed tumor stage with 75% accuracy for Ta versus T1, 85% for T1 versus T2, and 86% for Ta versus T2.
Conclusions:
Our preliminary results suggest that MFOS could be a reliable, fast, and label-free tool for BCa assessment, providing also grading and staging information. This technique could be applied in future for in vivo inspection as well as of ex vivo tissue biopsies. Thus, MFOS might improve urothelial cancer management. Further studies are required.
Introduction
Urothelial carcinoma (UC) builds up to 90% of the whole bladder tumors and therefore is one of the most common cancers worldwide with a high mortality and recurrence rate.1,2 Furthermore, an accurate and precise diagnosis is mandatory, as a treatment delay of more than 3 months in a Muscle Invasive Bladder Cancer (MIBC) may impact severely on prognosis with a worsening in the survival rate. 3 Currently, the gold standard for diagnosis of UC is histopathological examination, which still has some weaknesses. Firstly, it cannot give results in real time, requiring a relatively long tissue processing and staining procedure. Furthermore, current histopathological analysis suffers from an important inter-observer variability that runs from 0.3 to 0.7 in the best circumstances.4–6 Finally, specimen quality provided from Trans-Urethral Resection Bladder Tumor (TURBT) may be insufficient, due to the lack of orientation and to the absence of the muscle layer, with detrimental effect also on patient prognosis, with up to 45% of patients necessitating a II Look TURBT to proper define cancer staging.7–9 In this framework, fluorescence and Raman spectroscopy could provide an additional tool for examining fresh tissue biopsies in order to get a quick, automated diagnosis of the disease, as well as for detecting in vivo BCa more easily, when implemented within the cystoscope, thus reducing the number of inadequate resections. In fact, these techniques have already been used with promising results, demonstrating the feasibility of such approach.10,11
In this study, that provides further results from preliminary data from Baria et al., we will evaluate the possibility of multimodal fiber optic spectroscopy (MFOS) technique ex vivo to properly discriminate between healthy bladder tissue and BCa, and to determine urothelial carcinoma stage and grade with a comparable accuracy, specificity, and sensitivity with the current gold standard histopathological analysis. 12
Materials and methods
Patients
Patients planned for TURBT because of BCa or listed for Trans-Urethral Resection of Prostate (TURP) because of Benign Prostatic Enlargement (BPE) have been prospectively enrolled since 2017. Inclusion criteria were: patient’s willingness to participate, legal age, full capacity to sign informed consent, and the eligibility for each surgical operation according to the best clinical practice and the urological guidelines. Exclusion criteria were: concomitant use of Hexaminolevulinate (Hexvix®)—a photosensitizing agent which could impair spectral measurements—concomitant ongoing UTIs, concomitant bladder stone presence, recent or persistent bladder catheterization at the time of surgery, concomitant presence of other pelvic cancer (both prostate, urethral, uterine), previous chemotherapy or radiotherapy of the pelvis, and patient refusal at informed consent. All patients who met inclusion criteria were consecutively enrolled.
As a feasibility study, no power sample calculation was possible before applying the technique ex vivo. However, to provide strong enough evidences, a minimal sample size of 100 patients was deemed sufficient to have reliable statistical data.
Methods
Patients which respected inclusion criteria were enrolled at the moment of hospital admission in our Urology Ward for surgical operation in the days when the MFOS instrumentation was available. Age, history of bladder cancer, smoke habit, and anamnesis were recorded before surgery. During the bladder or prostate resection, cold-cup biopsies of both BCa or healthy bladder mucosa were collected and sent for inspection through label-free Multimodal Fiber Optic Spectroscopy (MFOS) within 30 min, as previously described by Baria et al. 12 One or more specimens could have been collected from a single patient, according to number of lesions and/or surgeon discretion. MFOS examination—based on fluorescence (separately excited at 378 and 445 nm), conventional Raman (785 nm), and reflectance (with a halogen lamp) spectral recordings—takes less than 2 min, requires no labeling process and maintains specimen characteristics unaltered. Subsequently, specimens were sent to standard histopathological analysis; the latter was performed by a single expert uro-pathologist, thus reducing inter-observer variability. MFOS data were then compared to current gold standard methodology in order to develop a classification algorithm based on the spectral information obtained for each technique. We aimed at discriminating healthy bladder mucosa from UC biopsies, Low Grade (LG) from High Grade (HG) tumors, and distinguishing the three UC stages (Ta, T1, and T2).
Grading and staging of BCa were made according to World Health Organization 2016 criteria and TNM classification respectively.13,14
Statistical analysis
We applied the same statistical analysis presented in the previous manuscript from Baria et al. 12 In particular, for each comparison and for each spectroscopic technique, Principal Component Analysis (PCA) was used for reducing the dimensionality of the spectral dataset, and then a classifier was developed through Linear Discriminant Analysis (LDA) in order to maximize the area under the Receiver Operating Characteristic (ROC) curve. In fact, the ROC curve reports all possible combinations of sensitivity and specificity of a classification model, and the area under the curve (AUC) is a commonly used parameter for estimating the classifier accuracy.15–17 Afterwards, sensitivity and specificity could be derived from each ROC by manually selecting a proper threshold. Then we tried combining the results obtained from all techniques in order to create a “multimodal score” for tissue classification; however, spectroscopic modalities that could not improve the overall accuracy were excluded from the scoring algorithm. Finally, our results were validated using fivefold cross-validation PCA-LDA and PCA-QDA (Quadratic Discriminant Analysis) routines in MATLAB.
Study primary endpoint
Primary endpoint was to evaluate the MFOS capacity to discriminate in safe and reliable way between healthy bladder mucosa and BCa, in particular with high sensitivity and specificity (>90%).
Study secondary endpoints
Secondary endpoints were the possibility of MFOS to further discriminate in BCa positive specimen tumor Grade and Stage. Specifically, for staging, we examined the capability of MFOS to discriminate between MIBC and NMIBC (Non-Muscle Invasive Bladder Cancer).
Ethics
Present study underwent Ethical Committee approval by COMITATO ETICO AREA VASTA CENTRO (CEAVC) in 2016 under the code 10325 and was registered in clinicaltrials.gov under this code NCT04310813. Study protocol was conformed to the principles of the Declaration of Helsinki. A written informed consent was signed by each patient enrolled in the study. The presented methodology was considered safe and provided no adjunctive risks for patients undergoing this procedure.
The present manuscript is written in accordance to CONSORT statement in reporting feasibility studies. 18 CONSORT Checklist is available at the end of the manuscript.
Results
Across the study period, from November 2017 to February 2019, in the days of availability of MFOS instrumentation, 118 patients were screened and respected inclusion criteria. Among them, four (3.4%) refused to participate, therefore, a total of 114 patients were enrolled into the study, while the total number of specimens collected was 169. Of these specimens, 40 (23.7%) were healthy and were collected from 36 (31.6%) patients who underwent TURP and 129 (76.3%) UC specimens from 78 (68.4%) patients who underwent TURB for BCa. Among the BCa positive specimens there were 34 (26.4%) Low Grade NMIBC and 95 (73.6%) High Grade BCa. All Low Grade BCa were stage Ta, thus not invasive of the subepithelial connective tissue, while among High Grade samples there were 20 (20.6%) muscle invasive, 47 (49.5%) invasive of the subepithelial tissue, but not of the muscolaris propria, and 28 (29.9%) stage Ta.
A recent urine cytology was available for 18 (15.8%) patients, with 11 (61.1%) positive for UC, 2 (11.1%) doubt, and 5 (27.8%) negative. However, TURBT was negative for BCa in one positive urine cytology case, plus it was positive for HG BCa in one negative urine cytology and for LG BCa in four negative urine cytology cases.
As an ex vivo technique at present stage, no adverse events or unintended effects were reported.
Fluorescence spectroscopy
Figures 1 and 2 show the results obtained from the examination of bladder tissue biopsies through fluorescence spectroscopy with the 378 and 445 nm excitation, respectively. There are significant spectral differences between healthy bladder and UC specimens: tumor spectra are characterized by a redshift in the emission peak and a stronger fluorescence emission at longer wavelengths (Figures 1(a) and 2(a)), resulting in 88% classification accuracy (Figures 1(b) and 2(b)) for our PCA-LDA models. Sensitivity and specificity for our suggested thresholds are reported in Table 1. However, differentiating tumor grade and stage is a far more complex task, as their spectra show many “overlaps.” In this regard, the advantage in using PCA-LDA analysis consists of neglecting overlapping areas and exploiting the spectral regions with major differences between grades/stages. In this way, blue-excited LG and HG spectra could be differentiated with 77% accuracy, while our analysis based on UV-excited fluorescence provided little discrimination capability (61%). We also found Ta and T1 spectra to have similar profiles (Figures 1(e) and 2(e)), while T2 tumors have relatively higher fluorescence emission between 580 and 650 nm than the other two stages; hence, T2 tissues could be diagnosed with ~70% accuracy for both excitation wavelengths.
Classification accuracy according to the different spectroscopic techniques using in multimodal fiber optic spectroscopy.

N: normal; T: tumor; LG: low grade; HG: high grade; Fluo: fluorescence; 5fCV: fivefold cross validation; AUC: area under the curve; Spec: specificity; Sens: sensibility.
5fCV is a statistical method which divides the dataset in five parts (folds), using four of them for training the diagnostic algorithm and the fifth for testing its performance. This procedure is repeated five times by rotating all folds between training and testing sets. We reported the average accuracy obtained from the five tests.
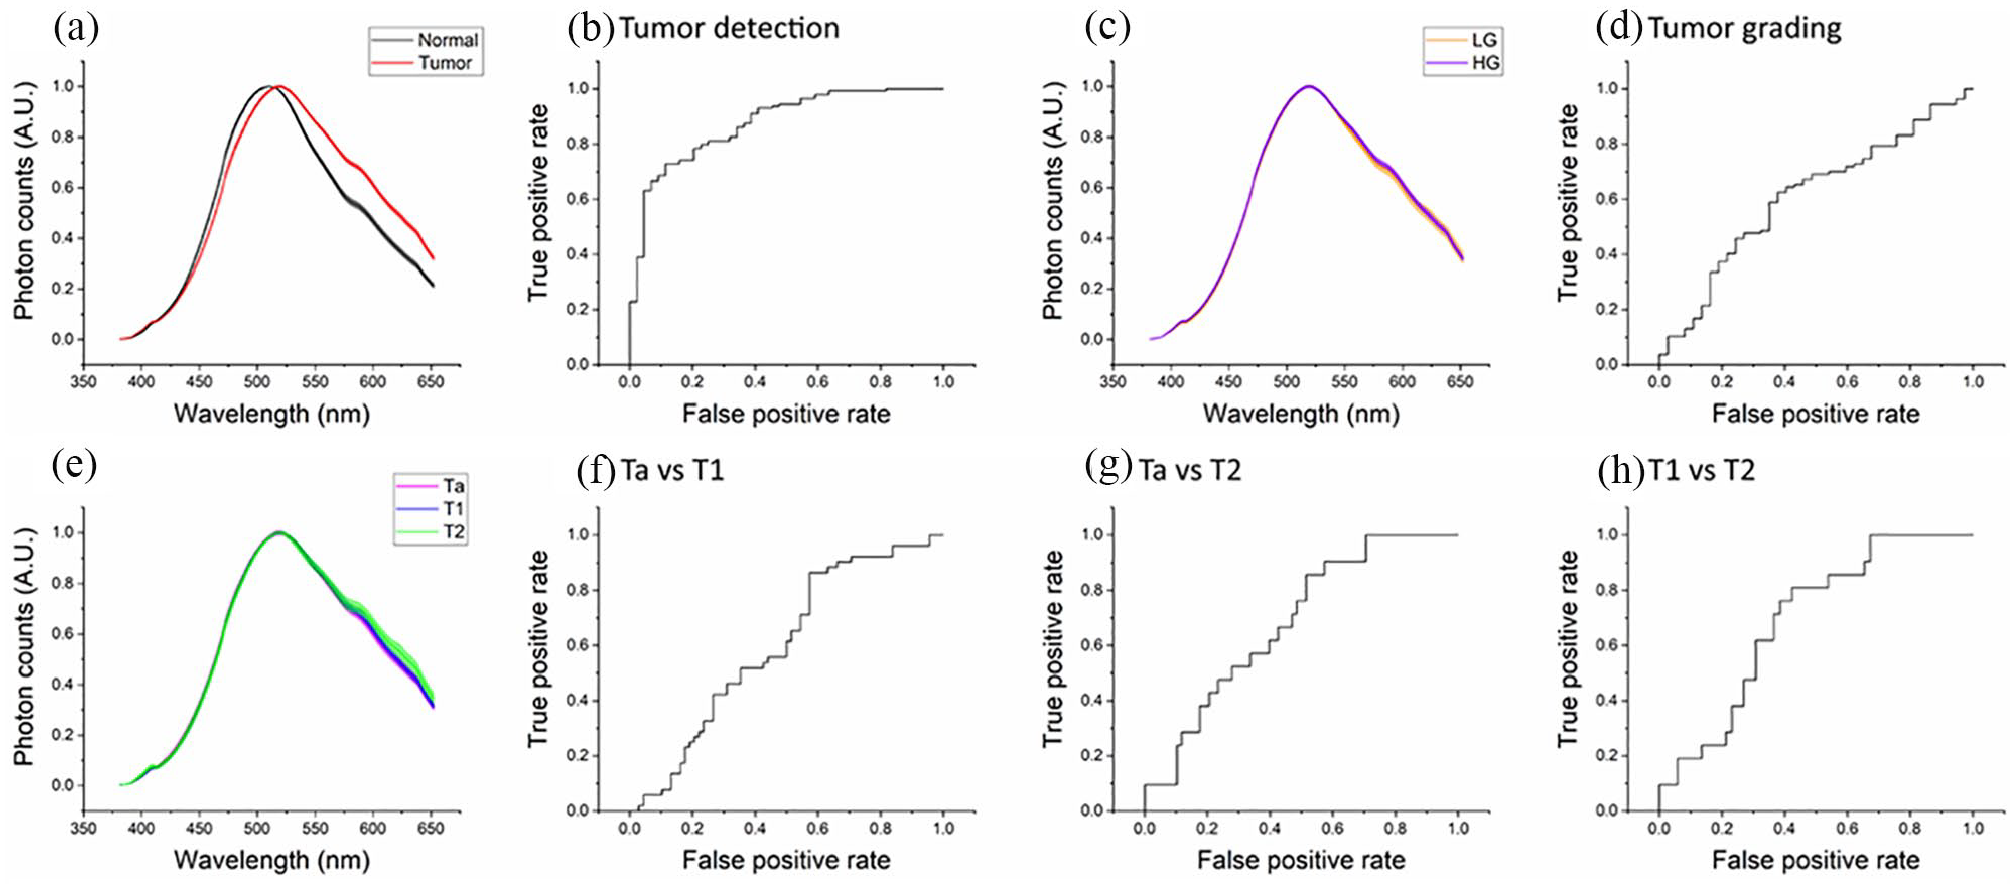
Results obtained from the analysis of fluorescence spectra excited at 378 nm: (a, c, and e) comparison between the mean spectra ± standard errors (SEs) of, respectively: normal (black) and tumor (red) biopsies; LG (orange) and HG (violet) tumors; Ta (magenta), T1 (blue), and T2 (green) tumors and (b, d, f–h) ROC curves of each PCA-LDA classifier used for discriminating normal biopsies from tumor tissues (b) or differentiating tumor grades (d) and stages (f–h). The points of each ROC curve correspond to all the possible combinations of specificity and sensitivity provided by its classifier, while its AUC can be used to evaluate the overall accuracy of the classification model.
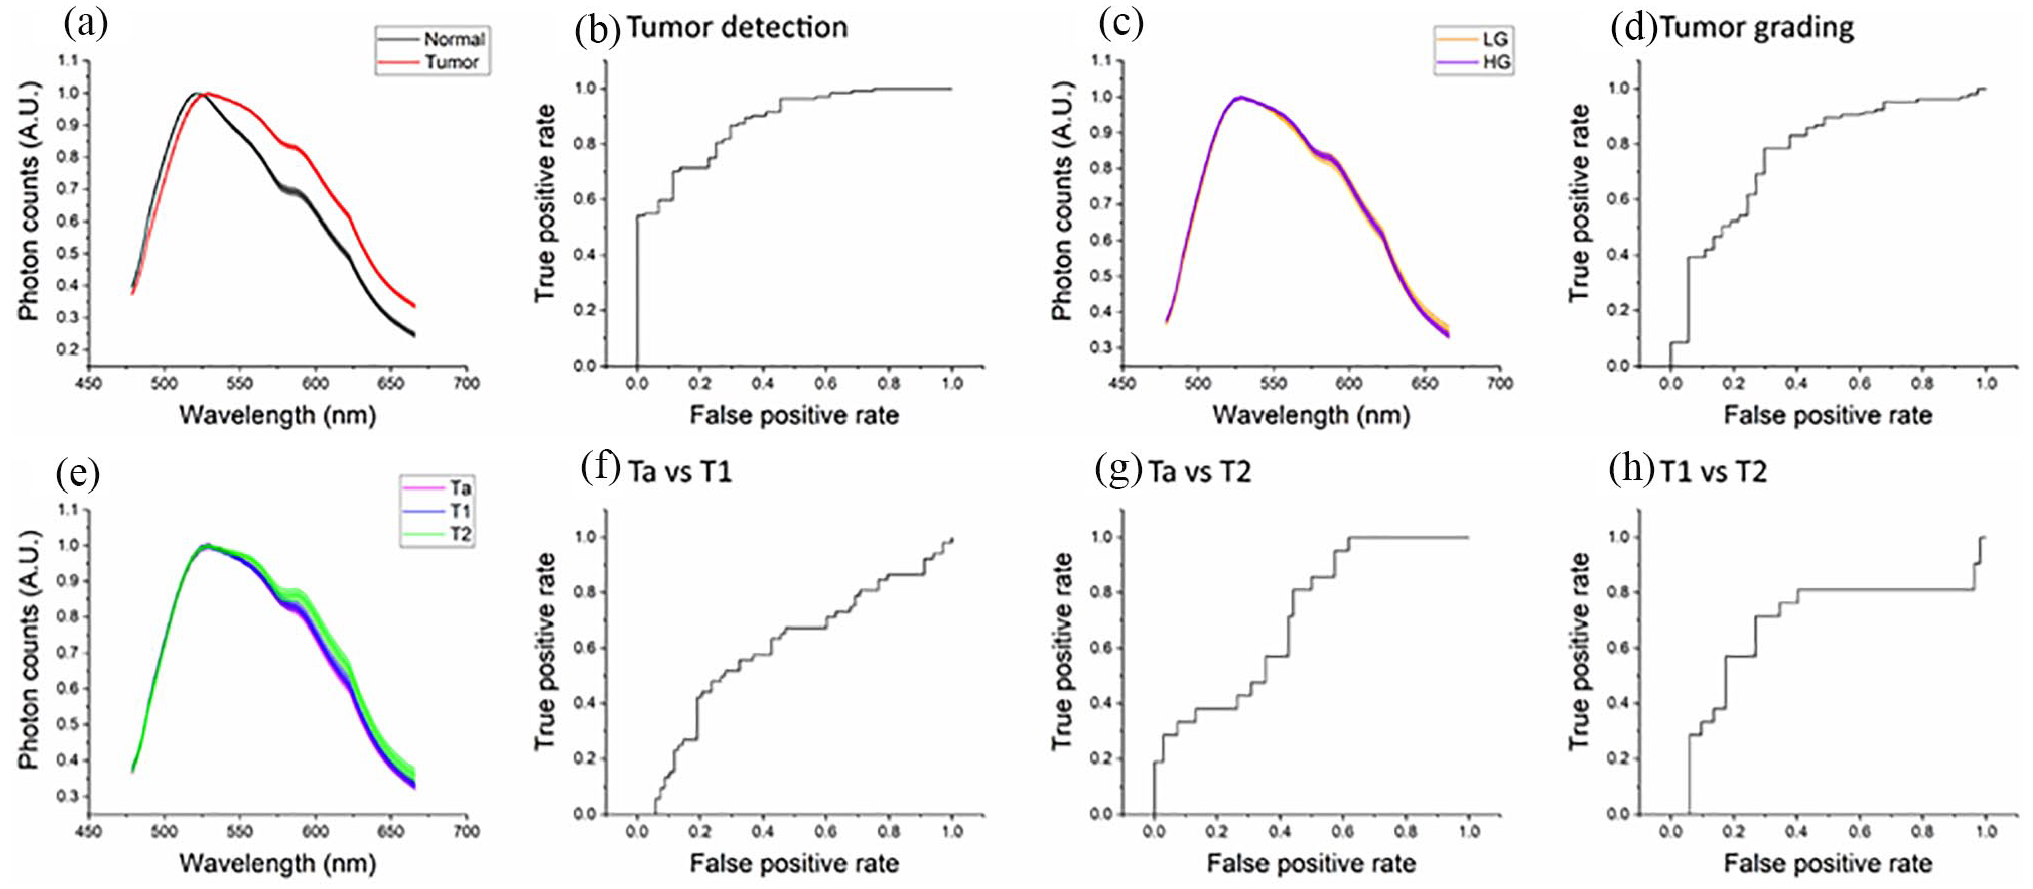
Results obtained from the analysis of fluorescence spectra excited at 445 nm: (a, c, and e) comparison between the mean spectra ± standard errors (SEs) of, respectively: normal (black) and tumor (red) biopsies; LG (orange) and HG (violet) tumors; Ta (magenta), T1 (blue), and T2 (green) tumors and (b, d, f–h) ROC curves of each PCA-LDA classifier used for discriminating normal biopsies from tumor tissues (b) or differentiating tumor grades (d) and stages (f–h). The points of each ROC curve correspond to all the possible combinations of specificity and sensitivity provided by its classifier, while its AUC can be used to evaluate the overall accuracy of the classification model.
Reflectance spectroscopy
Figure 3 shows reflectance average spectra and the corresponding ROC curves. These spectra are strongly characterized by oxyhemoglobin absorption peaks at 540 and 580 nm, as well as by a different behavior in the region between 600 and 700 nm (Figure 3(a), (c) and (e)). We found 69% accuracy for detecting UC tissues and 67% for differentiating LG and HG tumors; with respect to staging, the analysis of reflectance spectra allowed the discrimination of Ta samples from invasive tumors with AUC⩽70%.
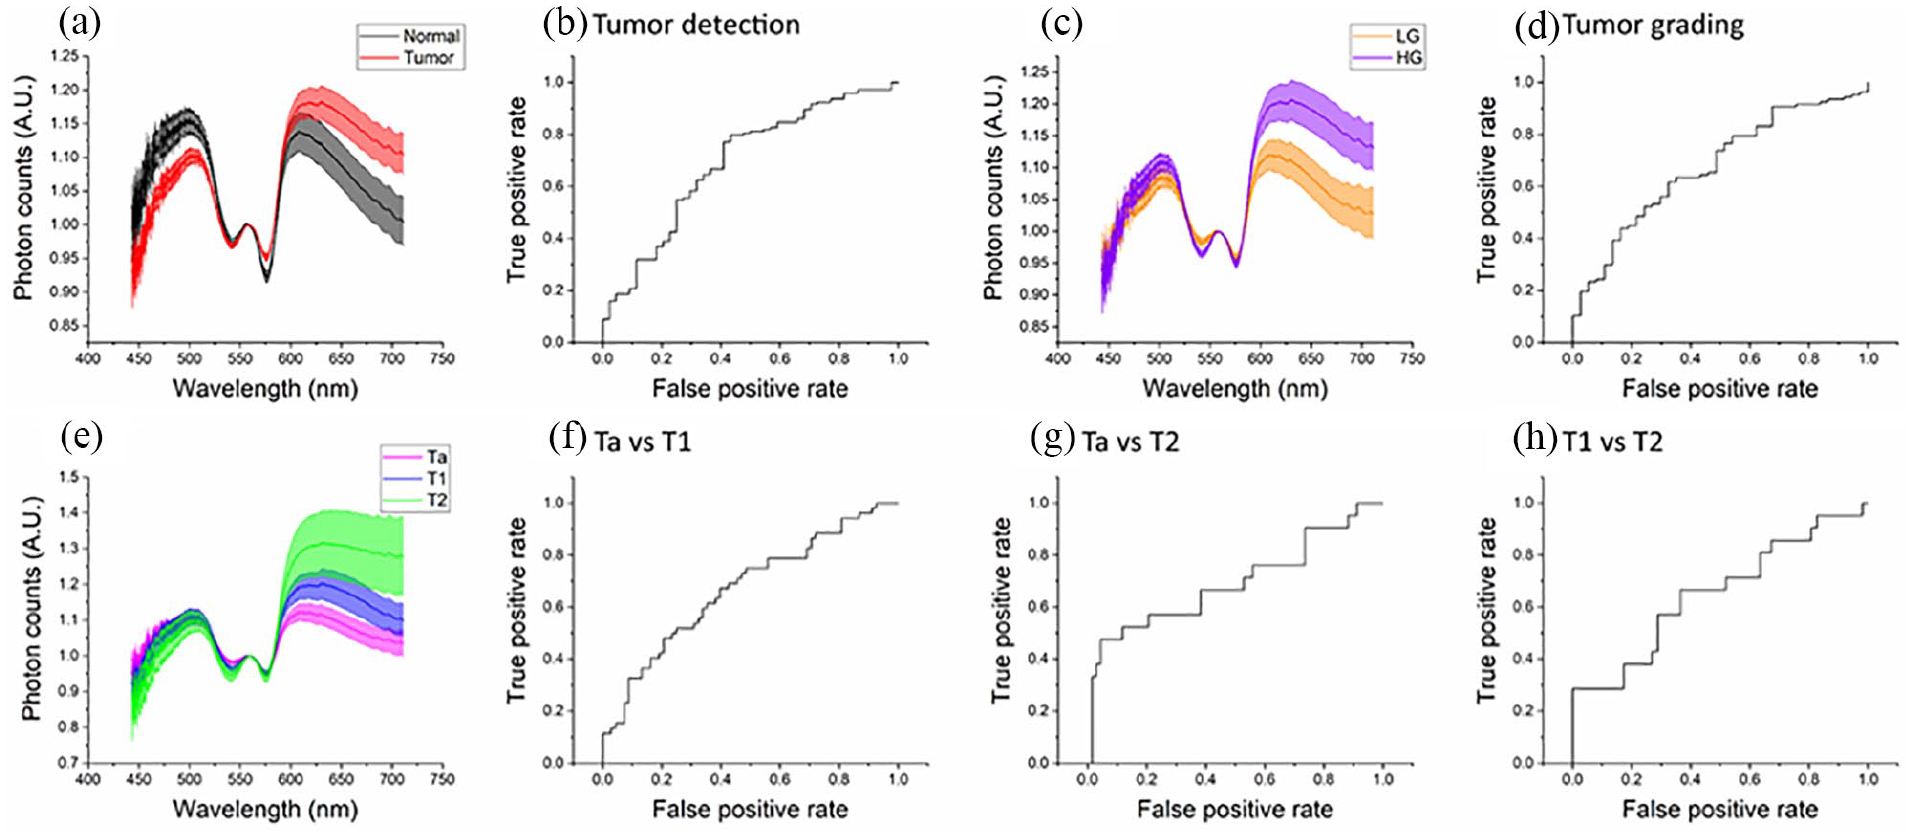
Results obtained from the analysis of reflectance spectra: (a, c, and e) comparison between the mean spectra ± standard errors (SEs) of, respectively: normal (black) and tumor (red) biopsies; LG (orange) and HG (violet) tumors; Ta (magenta), T1 (blue), and T2 (green) tumors and (b, d, f–h) ROC curves of each PCA-LDA classifier used for discriminating normal biopsies from tumor tissues (b) or differentiating tumor grades (d) and stages (f–h). The points of each ROC curve correspond to all the possible combinations of specificity and sensitivity provided by its classifier, while its AUC can be used to evaluate the overall accuracy of the classification model.
Raman spectroscopy
Raman spectra and ROC curves are reported in Figure 4. All the examined tissues show typical Raman bands around 640, 700, 960, 1100, 1250, 1470–1680 cm−1—which could be associated with the presence of amino acids, nucleic acids, amide I, II and III, lipids, and proteins—as well as other bands outside the fingerprint region (2040, 2200, and 2380 cm−1). The PCA-LDA algorithms obtained 77% accuracy for discriminating healthy bladder from UC, 71% for LG versus HG, 71% for discriminating Ta and T1 biopsies, and 77%–83% for detecting T2 tumors from the other two stages.
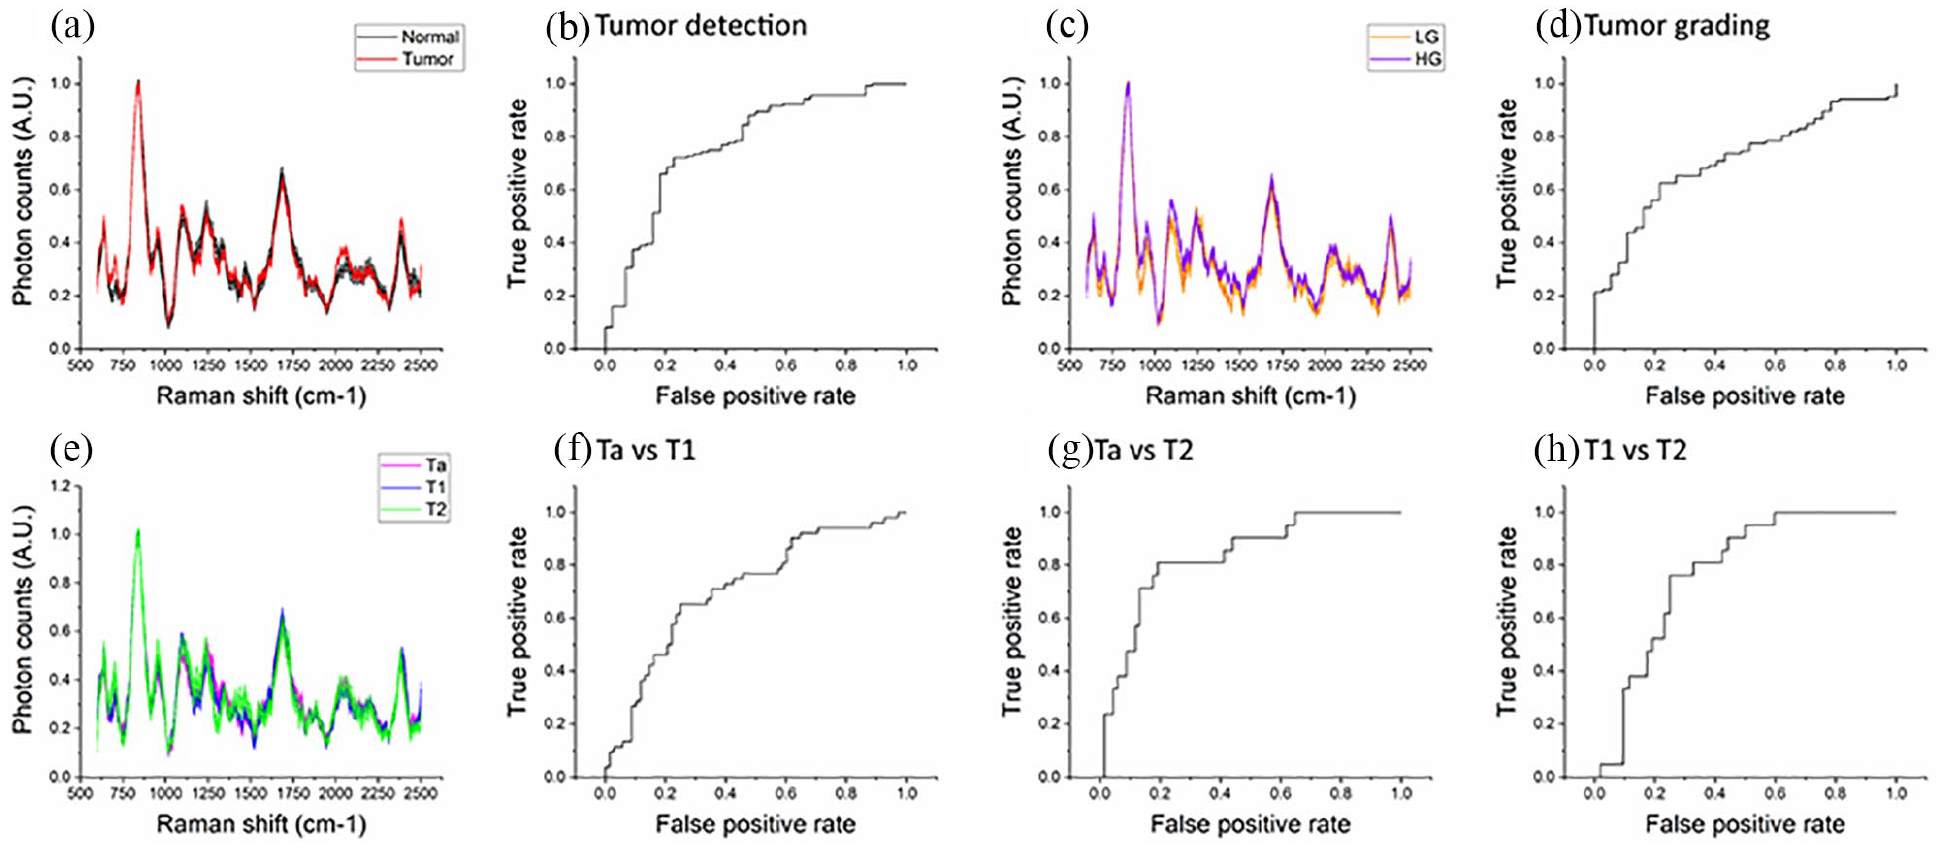
Results obtained from the analysis of Raman spectra: (a, c, and e) comparison between the mean spectra ± standard errors (SEs) of, respectively: normal (black) and tumor (red) biopsies; LG (orange) and HG (violet) tumors; Ta (magenta), T1 (blue), and T2 (green) tumors and (b, d, f–h) ROC curves of each PCA-LDA classifier used for discriminating normal biopsies from tumor tissues (b) or differentiating tumor grades (d) and stages (f–h). The points of each ROC curve correspond to all the possible combinations of specificity and sensitivity provided by its classifier, while its AUC can be used to evaluate the overall accuracy of the classification model.
Multimodality
The results obtained from single spectroscopic techniques could be linearly combined in an additional scoring algorithm in order to increase the classification accuracy. We applied such approach for all tissue comparisons previously mentioned (Figure 5): multimodality significantly improved tissue differentiation in all cases, except for tumor detection (where it allowed only a small increase from AUC 88%–90%). In detail, we can see that multimodality may detect tumor with an 80% specificity and 81% sensitivity (Table 1). Regarding Grading, specificity is 73%, while sensitivity 84%. When we applied multimodality for tumor staging, specificity and sensitivity were respectively 71% and 73% for Ta versus T1, 71% and 95% for Ta versus T2, and 73% and 81% for T1 versus T2. These findings were further corroborated through fivefold cross-validation procedures, whose results are shown in Table 1 as well.
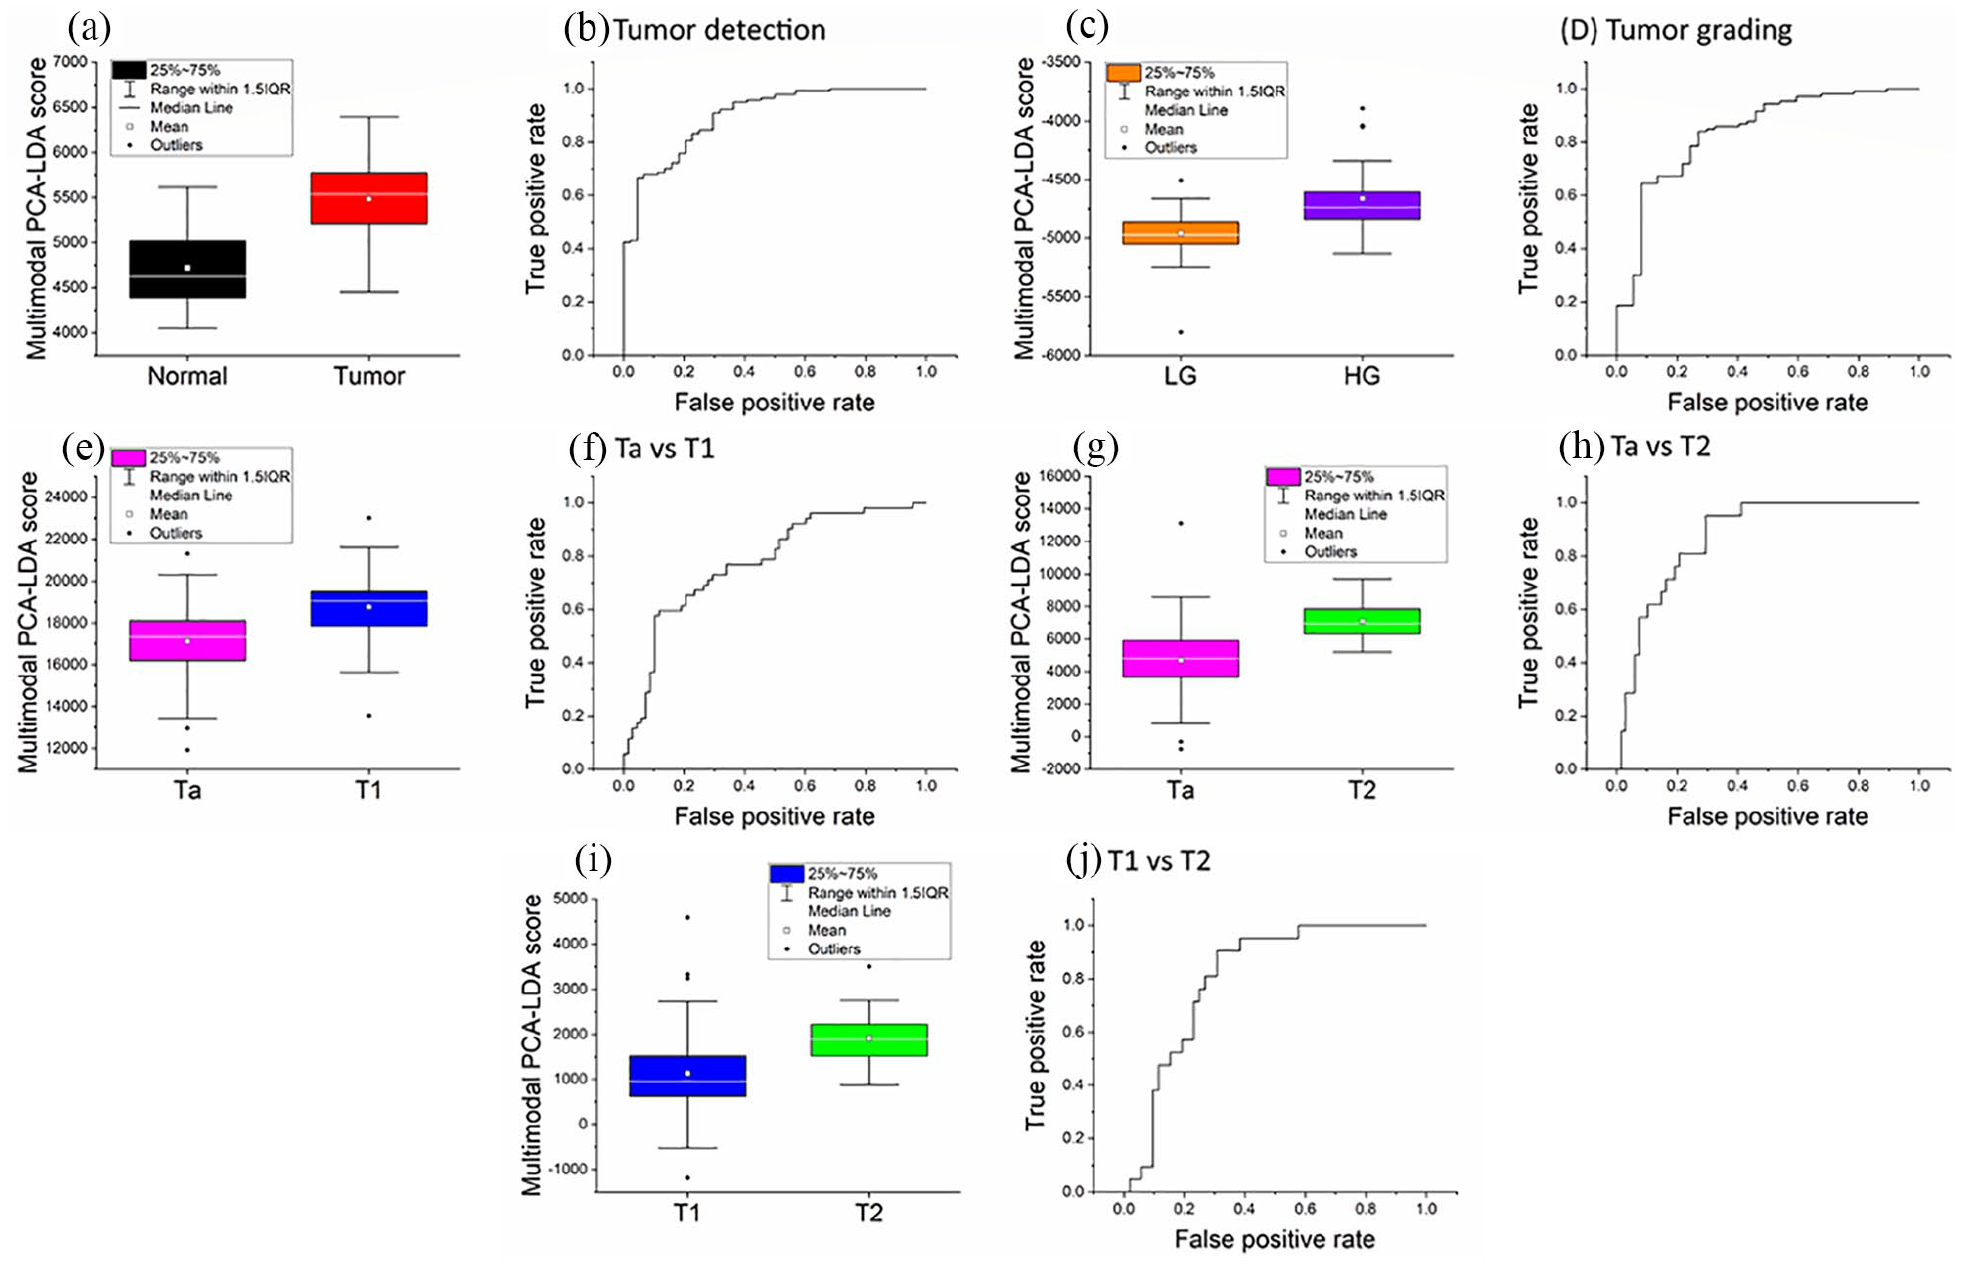
Results obtained from the combination of multiple spectroscopic techniques (multimodality). For each comparison between tissue types, a linear combination of fluorescence, Raman, and reflectance PCs was created through LDA; the resulting classifier assigned a “multimodal score” to each specimen: (a, c, e, g, and i) box-and-whisker plots reporting the multimodal scores of, respectively: normal (black) and tumor (red) biopsies; LG (orange) and HG (violet) tumors; Ta (magenta), T1 (blue), and T2 (green) tumors and (b, d, f, h, and j) ROC curves of each multimodal classifier used for discriminating normal biopsies from tumor tissues (b) or differentiating tumor grades (d) and stages (f, h, j). The points of each ROC curve correspond to all the possible combinations of specificity and sensitivity provided by its classifier, while its AUC can be used to evaluate the overall accuracy of the classification model.
Discussion
In our preliminary study we provided the results in an ex vivo setting of MFOS for BCa detection, grading, and staging, based on statistical analysis and evaluation of optical and spectroscopical properties of tissues. These methods, in particular Raman, have already been tested in different human neoplasms, providing important results especially in brain tumors.19–22 Indeed, physical properties regarding spectral profiles depend entirely on composition and tissue characteristics, and multimodal approach maximizes the different peculiarities of optical spectroscopy analysis. Dealing with fluorescence spectral profiles, these findings are common to both excitation wavelengths and may be attributed to different concentrations of NADH, FAD, collagen, and porphyrins in healthy and diseased tissues. It directly depends on tumor tissue composition; thus, fluorescence seems a promising technique for detecting UC tumors with high sensitivity and specificity in a label-free modality. Regarding reflectance, LG and Ta spectral profiles are more similar to healthy mucosa than HG and invasive tumors, respectively. Moreover, the 600–700 nm region seems particularly interesting due to the role of light scatter size in the slope and (relative) intensity of reflectance spectra. 23 Since tumor cell nuclei are bigger than normal ones, the observed differences could be due to the higher degree of cellular abnormality in HG tissues and UC advanced stages. 24 In Raman spectroscopy, the presented spectra contain information on the molecular composition of bladder tissue, and their analysis provides sensitivity and specificity values which seem to be promising especially for UC staging. This could be due to the higher penetration of near-infrared (NIR) wavelengths, which may play an important role in discriminating different level of tumor invasiveness into these tissues. The multimodal approach grants the possibility to combine all these methods, taking the best advantages from each one, and to enhance the technique capability to discriminate between healthy and tumor and to provide grading and staging.
Therefore, the rationale of this new technique is to improve the detection and the diagnosis of UC, with all the advantages of combining Raman, fluorescence, and reflectance into a single multimodal approach. Consequently, this label-free technique on bladder cancer, if confirmed in vivo, may become useful, as it reduces the inter-observer variability and may provide immediate data during endoscopy.
Moreover, future developments might allow an immediate use of spectroscopy during cystoscopy, thus reducing false positive and false negative and potentially decreasing unnecessary TURBTs. Indeed, the fiber diameter of 2 mm—six French—can fit with cystoscopy instruments, thus exploring uncertain areas in the bladder and characterizing them before biopsy, in order to assess, in almost real-time, grade and stage, and reduce the time from diagnosis of muscle invasive disease to intervention.3,7,8 This technique in ex vivo might also help pathologist to provide diagnosis, thus reducing inter-observer variability and helping them to better define the correct grade and whether BCa is or not muscle invasive.4–6
In addition, a further advantage of our technique relies in its opportunity to vary the cut-off of the probe to discriminate between the different characteristics. Therefore, specificity or sensitivity could be adapted according to physician’s request, by modifying MFOS cut-offs. Indeed, the cut-offs in our study were chosen to maximize the AUC in ROC curves, which was considered the principal validation tool of the analysis. Hence, through this approach we could have an almost 100% certainty to exclude suspected area from biopsy, that may be visualized as red patches during cystoscopy and yield cancer only in 8%–12% of the cases.25,26 The miniaturization of the probe can lead to further evolutions of the technique, allowing its application for upper tract urothelial cancer, particularly for the ability to provide grading.
Indeed, the development and subsequent application of this technology would definitely carry economic aspects. In fact, the total expense of using a multimodal endoscope during surgery can be estimated by considering instrumentation, personnel and consumables costs, including reasonable profit margins, within a standard 3-years depreciation period. The resulting amount—which we estimated as 90,000–100,000 €/year—should be divided by the number of cystoscopies and TURBT of an average hospital (e.g. 3000 per year), meaning a cost approximately equal to 30 € for each surgical operation/cystoscopy. Taking this into account, and considering that the mean cost of a TURBT is estimated in at least 2000 €, if this technology could avoid a minimum of 50 surgical operations for year, it would lead to consistent savings. This is particularly relevant when we consider that it might avoid re-TURB and also provide an additional information in case of negative or doubt urine cytology.
However, all these results are just preliminary and relies on an ex vivo approach, thus the technique should be further confirmed in vivo. The study provides more expanded data of its previous one from Baria et al. 12 Nevertheless, the sample number, despite its consistency, should be furtherly implemented in order to achieve larger numbers and possibly reduce the error and to increase technique accuracy. Besides, extending the sample number, it could be useful to include data on carcinoma in situ, which represent the conditions where a real-time evaluation in vivo would be helpful in order to guide a decision whether to treat it or not. Another limitation is that the technique has not yet been tried in a blind approach, pathology, and MFOS, as this is just a feasibility study.
In any case, this study proves that spectroscopy may be useful in medicine, especially in bladder cancer, and that we should move forward to strengthen our knowledge in this field.
Conclusions
MFOS based on Raman, Fluorescence and Reflectance is able to discriminate between BCa and healthy bladder tissue, moreover it may give information about tumor grading and staging. Even if our results are just preliminary, they may open new interesting perspectives in urothelial cancer management, since MFOS can provide useful and promising information on tissue characteristics.
Footnotes
Declaration of conflicting interests
The author(s) declared no potential conflicts of interest with respect to the research, authorship, and/or publication of this article.
Funding
The author(s) received no financial support for the research, authorship, and/or publication of this article.