
Abstract
Background:
Prostate cancer is the second most commonly diagnosed cancer in men. The diagnostic accuracy in prostate cancer can be increased by employing a preliminary multiparametric MRI followed by a fusion-targeted biopsy.
Methods:
To compare the diagnostic accuracy of fusion-targeted biopsy with the standard systematic biopsy in prostate cancer patients, we enrolled 139 patients on which we performed 139 prostate biopsies consisting of three targeted samples followed by 12 regular systematic samples. Based on histology, we analyzed the diagnostic performance of the two methods.
Results:
Both methods were equally good at detecting clinically significant cancer (83.3%, 50/60), while systematic biopsy detected more clinically insignificant cancers. However, the best diagnostic performance is obtained by combining the two methods.
Conclusion:
The two methods are best seen as synergistic, and the addition of fusion biopsy can be used to detect more clinically significant prostate cancers than systematic biopsy alone.
Keywords
Introduction
Prostate cancer (PCa) is the second most commonly diagnosed cancer in men, representing about 15% of cancer diagnoses. 1 PCa is usually suspected on the basis of serum prostate-specific antigen (PSA) levels and abnormal digital rectal examination (DRE), but its definitive diagnosis depends on histopathological evidence.2–4 The standard biopsy technique is ultrasound (US)-guided systematic biopsy (SB), performed by either the transrectal or transperineal approach. 5
However, SB suffers from several limitations such as failure to detect some clinically significant PCas (at least in part due to undersampling 6 ), inaccurate tumor risk stratification (undergrading 7 ), and on the other hand, detection of clinically insignificant cancers (overdiagnosis 6 ). Random biopsies of peripheral prostate tissue (where PCa is most frequently diagnosed) often discover low-grade tumors, with a large economic and emotional impact for the patient. 8
Recently, growing evidence has shown that the diagnostic accuracy can be increased by means of a preliminary multiparametric magnetic resonance imaging (mpMRI) of the prostate which is followed by a MRI-US targeted fusion biopsy (FB).9–12
The aim of this study is to compare the diagnostic performance of the combination FB + SB compared to each of the two methods used alone.
Materials and methods
Patient selection
From March 2017 to March 2020, mpMRI was proposed to all patients evaluated for suspected PCa at our Institution, when indicated. 13 In total 283 mpMRIs were performed on 252 patients.
Two genitourinary radiologists interpreted the images according to the PI-RADS reporting system. 14 Disagreements were resolved by discussion.
FB was proposed to all patients with PI-RADS 3 or greater, and to selected patients with PI-RADS 2 (those with suspicious PSA values and/or suspicious DRE). In total, 139 biopsies were performed on 139 patients.
Biopsy protocol and instrumentation
FB was performed by means of “GE–V-NAV” system, composed of an GE LOGIQ S8 XD US a 7.5 mHz End-Fire Probe, an RF emitter and two receivers applied to the probe. A dedicated software enables the import of the MRI data sets, allowing for a direct overlapping of the MRI images and US images. All patients showed at least a target lesion, some more than one. Once the lesion was identified, it was virtually marked. The target biopsy is then performed through continuous communication between the probe and a magnet, placed near the patient’s abdomen.
After successful fusion is achieved, the screen can be set to represent real time US/MRI overlap.
The end fire probe has a more oblique trajectory, allowing direct peripheral/lateral sampling; this may allow superior sampling of this area (where PCa is more frequently diagnosed). Moreover, this kind of probe offers the operator a wider range of control and accuracy when approaching the prostate.
A standard bioptic protocol was performed, always consisting of three fusion-targeted samples followed by 12 systematic US-guided samples.
Histopathological analysis
For each case, the 15 biopsy cores were placed each in its own cassette and processed by the pathology department according to standard procedures.15,16 Where present, PCa was graded separately for each core using ISUP grade groups (GG). 17 Two pathologists (ADA, AC) evaluated each case separately and disagreements were resolved by discussion.
Statistical analysis
The study population was divided in three groups: negative for cancer (no PCa), positive for non-clinically-significant PCa (ncs-PCa, Gleason score: 3 + 3 = 6), and positive for clinically significant PCa (cs-PCa, Gleason score ⩾ 3 + 4 = 7). Cases of prostate intraepithelial neoplasia (PIN) and atypical small acinar proliferation (ASAP) were considered as negative.
Statistical analysis was performed using R version 4.0.0.
Clinicopathological parameters were reported using descriptive statistics. The agreement between SB and FB findings was assessed using weighted Cohen’s kappa. Continuous variables were tested for normality with visual inspection (histograms and Q-Q plots) and the Shapiro-Wilk normality test. For normal variables, univariate analysis was performed using the t test and one-way ANOVA with post-hoc Tukey’s HSD test; non-normal variables were analyzed using the Mann-Whitney U test and the Kruskal-Wallis test with post-hoc Dunn’s test. A p value <0.05 was considered significant for all tests.
Results
In total, 139 patients were enrolled, with an average age of 67.19 ± 7.73 years (range, 48.97–84.10 years). The mean PSA value was 11.87 ng/mL (range, 0.25–100 ng/mL); the median PSA density was 0.15 ng/mL/cm³ (range, 0.01–1.96 ng/mL/cm³), and the median prostate volume was 63.32 cm³ (range, 10.98–277.31 cm³). These findings are summarized in Table 1.
The study population, both in its entirety and divided in groups based on clinical significance.
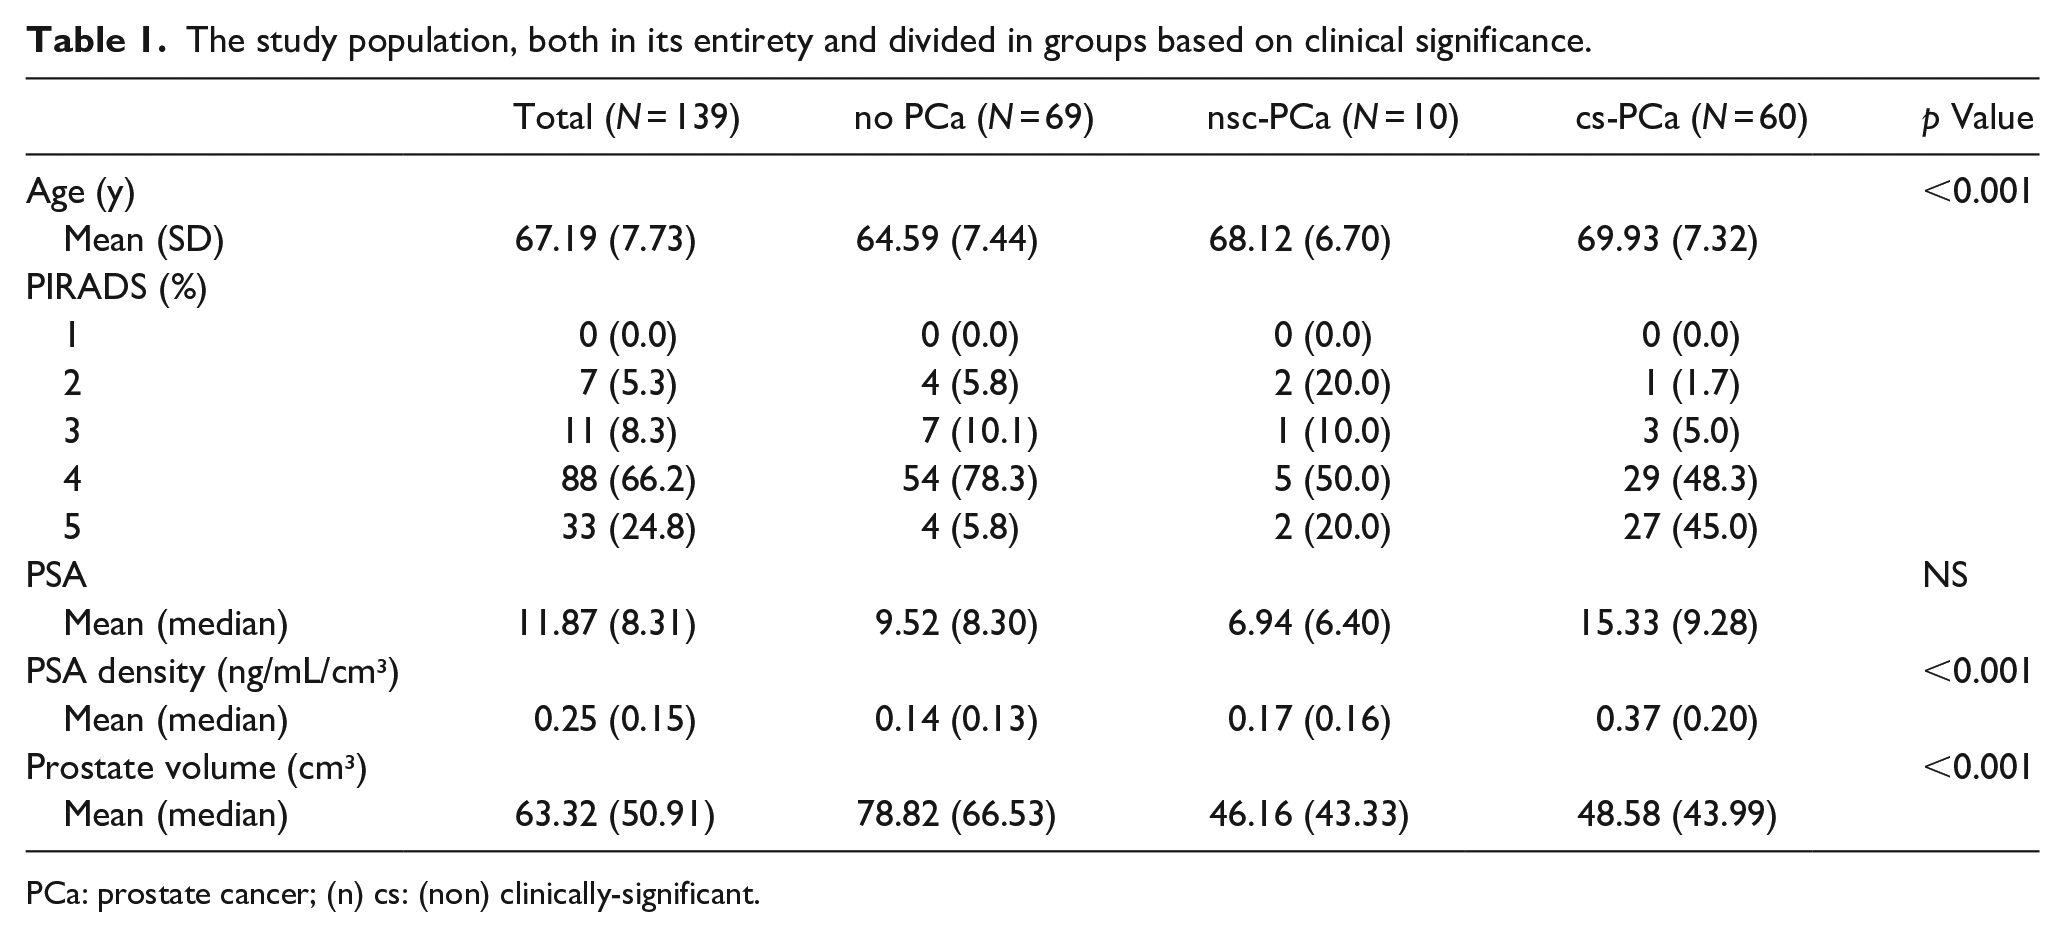
PCa: prostate cancer; (n) cs: (non) clinically-significant.
The agreement between biopsy findings in SB and FB cores was very good to almost perfect (Cohen’s κ: 0.80, p < 0.001) and the comparison between the two methods is shown in Figure 1.
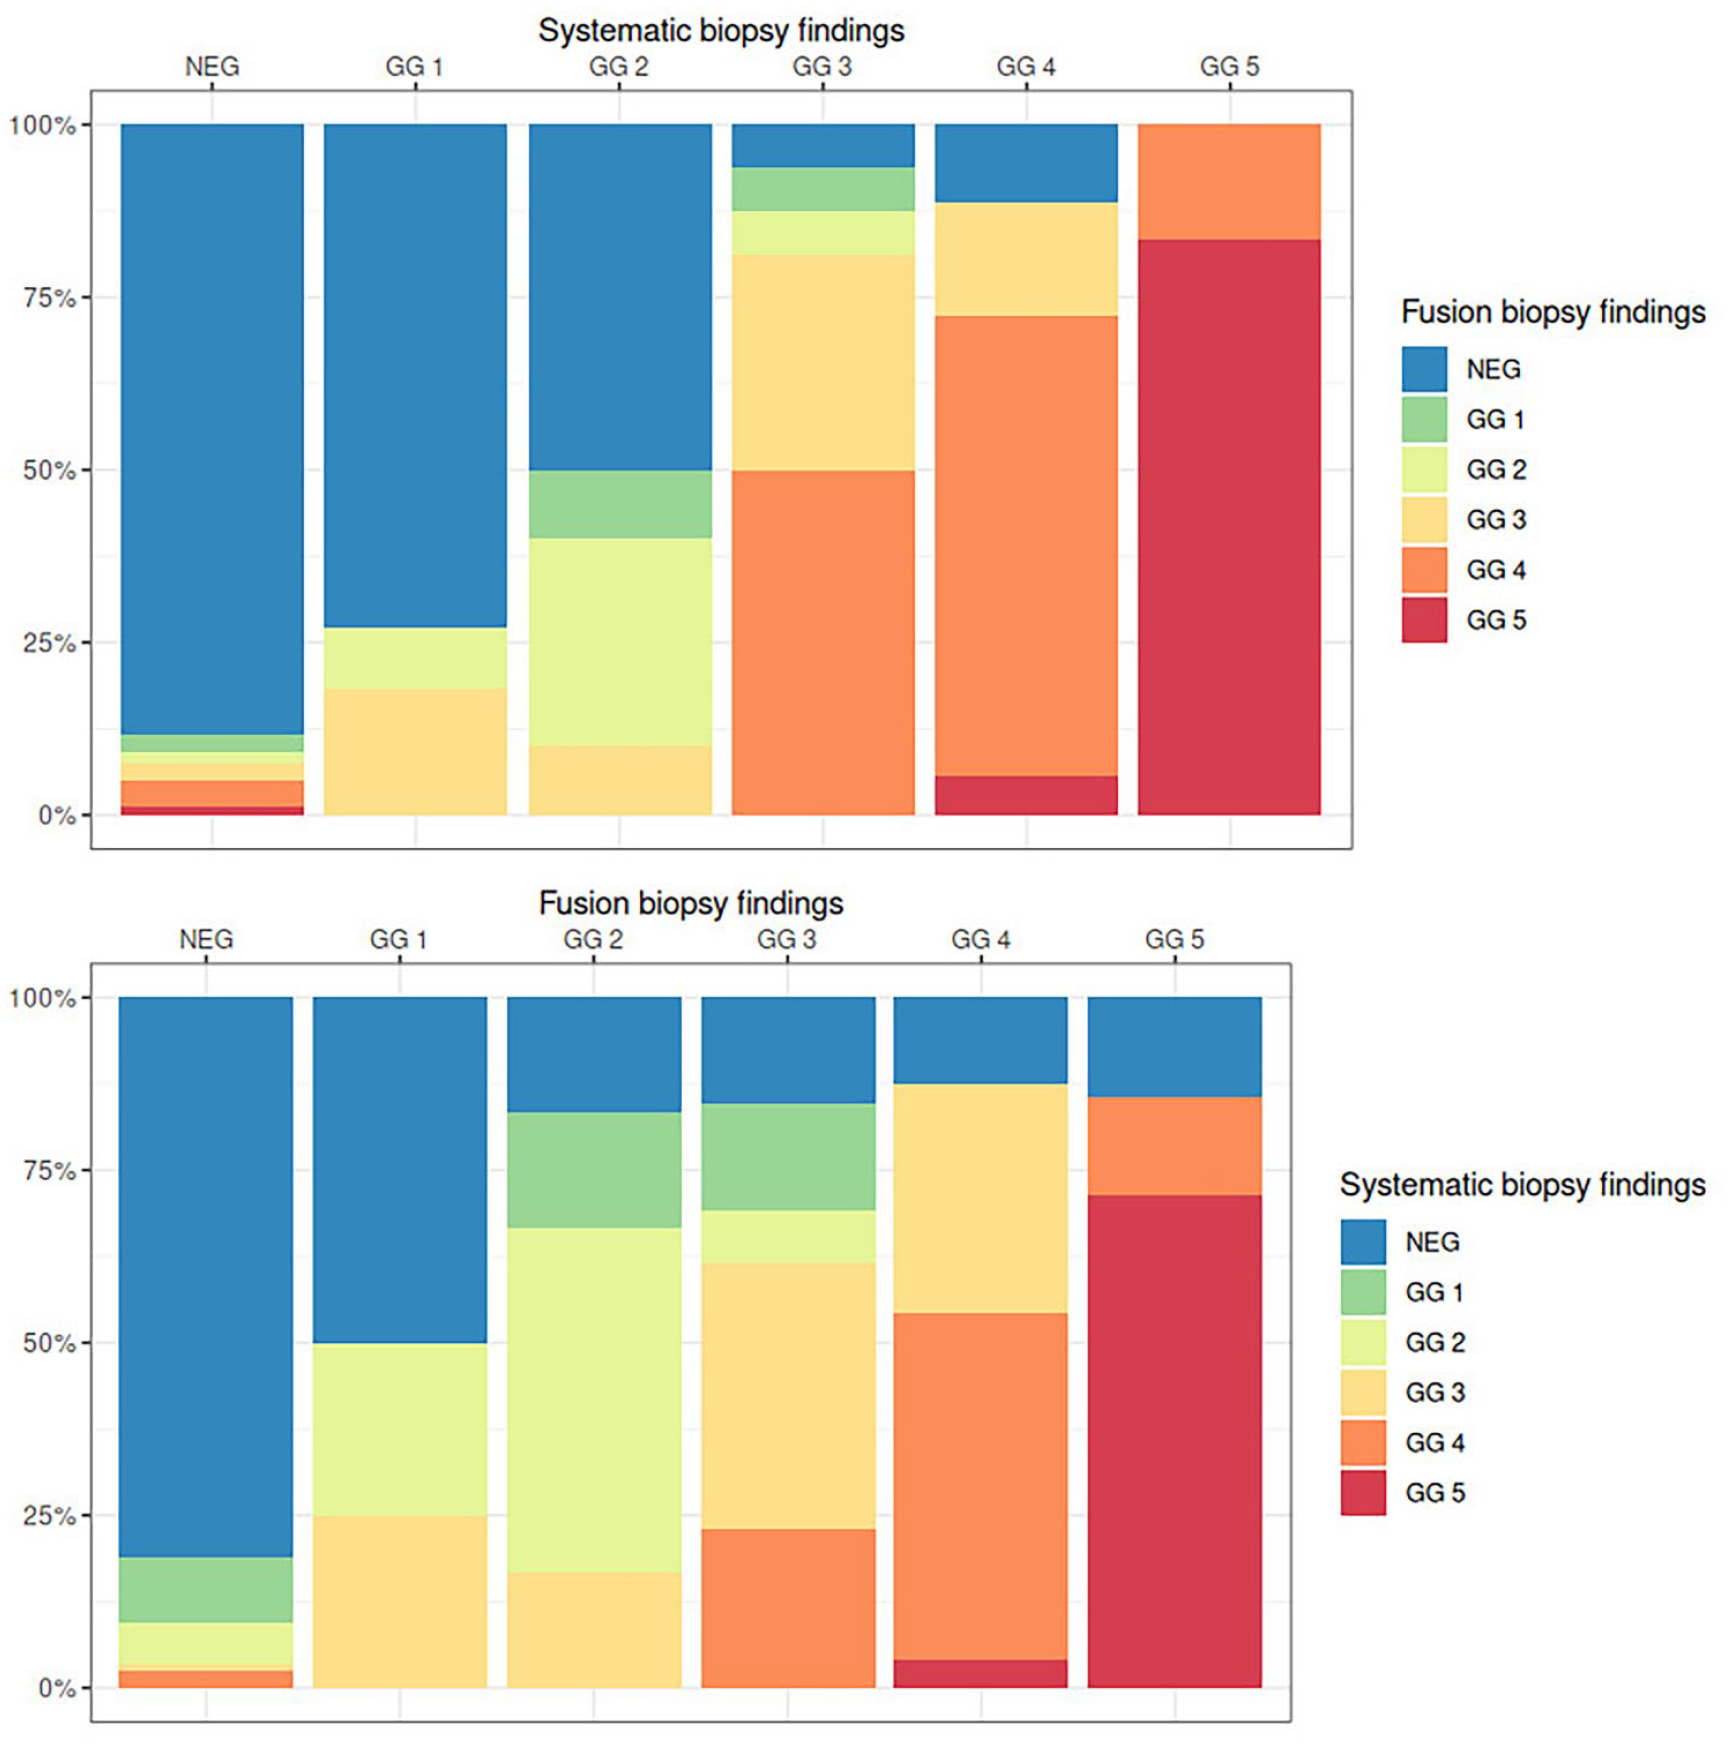
Bar plots showing the comparison between the worst pathological finding in the fusion and in the systematic biopsy cores, for each case. Strikingly, approximately 14% each of clinically significant cancers diagnosed by fusion biopsy (bottom graph, four rightmost columns) were diagnosed as negative (blue) by systematic biopsy. Of all cases diagnosed as GG1 by systematic biopsy (second column, top graph), fusion biopsy diagnosed approximately 75% (blue) as negative, ~10% (light green) as GG2, and ~15% (yellow) as GG3.
FB, compared with SB, detected 2 more ncs-PCa cases and 10 additional cs-PCa cases (Table 2): the 2 ncs-PCa cases were both negative at SB; the 10 cs-PCa cases were graded by SB as no-PCa (n = 5), ASAP (n = 2) and GG1 (n = 3).
Cases upgraded by fusion biopsy.
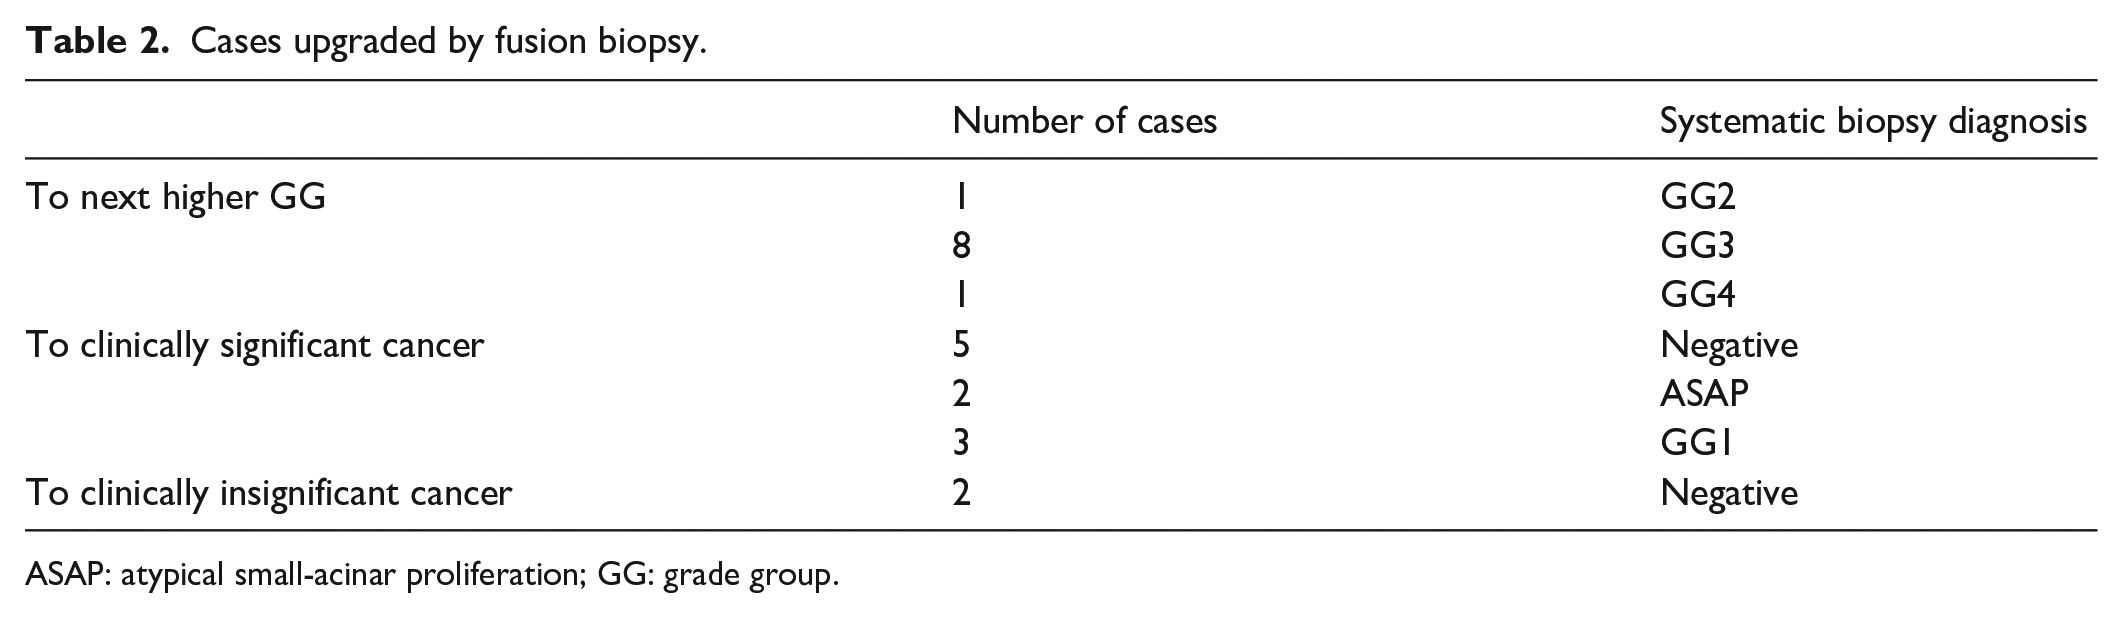
ASAP: atypical small-acinar proliferation; GG: grade group.
SB, on the other hand, detected 8 more ncs-PCa cases and 10 additional cs-PCa cases (Table 3). The 8 ncs-PCa cases were diagnosed by FB as negative (n = 6), PIN (n = 1), and ASAP (n = 1); the 10 cs-PCa cases were diagnosed as no-PCa (n = 8) and GG1 (n = 2).
Cases upgraded by systematic biopsy.
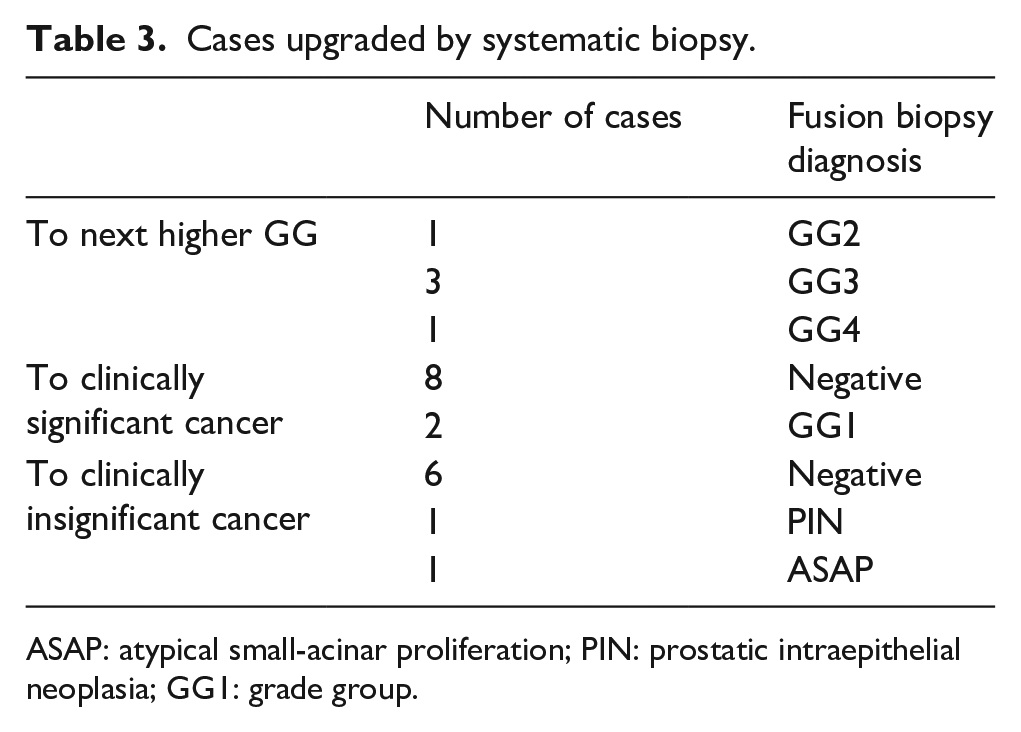
ASAP: atypical small-acinar proliferation; PIN: prostatic intraepithelial neoplasia; GG1: grade group.
The detection rate of cs-PCa was identical for the two methods (83.3%, 50/60), while ncs-PCa was detected more often by SB: 80.0% (8/10) versus 20.0% (2/10). Therefore SB was more sensitive in overall cancer detection: 87.1% (61/70) versus 77.1% (54/70).
We then analyzed cases upgraded by FB (n = 22, 16%). Apart from the 12 cases described previously (with different clinical significance found by the two methods), 10 cases were correctly identified as cs-PCa by both methods, but FB found a higher GG. These cases were distributed as follows: n = 1 GG3 by FB and GG2 by SB, n = 8 GG4 by FB and GG3 by SB; n = 1 GG5 by FB and GG4 by SB.
In the reverse scenario, the 23 cases upgraded by SB were analyzed. Apart from the 18 cases described previously (where the clinical significance found by the two methods differed), there were five additional cases correctly identified as cs-PCa by both methods but with a higher GG found by SB. These cases were distributed as follows: n = 1 GG3 by SB and GG2 by FB, n = 3 GG4 by SB and GG3 by FB; n = 1 GG5 by SB and GG4 by FB.
None of the clinico-pathological variables in the present series was able to predict upgrading to cs-PCa by FB or by SB (p > 0.05).
Figure 2 shows cases classified according to clinical significance and stratified by PIRADS score. Only 14.3% (1/7) of PIRADS 2 cases were cs-PCa; the proportion of cs-PCa cases raises in PIRADS 3 and 4 cases (respectively 27.3% (3/11) and 33.0% (29/88)) and is highest in PIRADS 5 cases (81.8%, 27/33). Most clinically insignificant tumors were diagnosed in PIRADS 2 cases (28.6%, 2/7), with lower percentages in PIRADS 3, 4, and 5 cases (respectively 9.1%, 5.7%, and 6.1%).
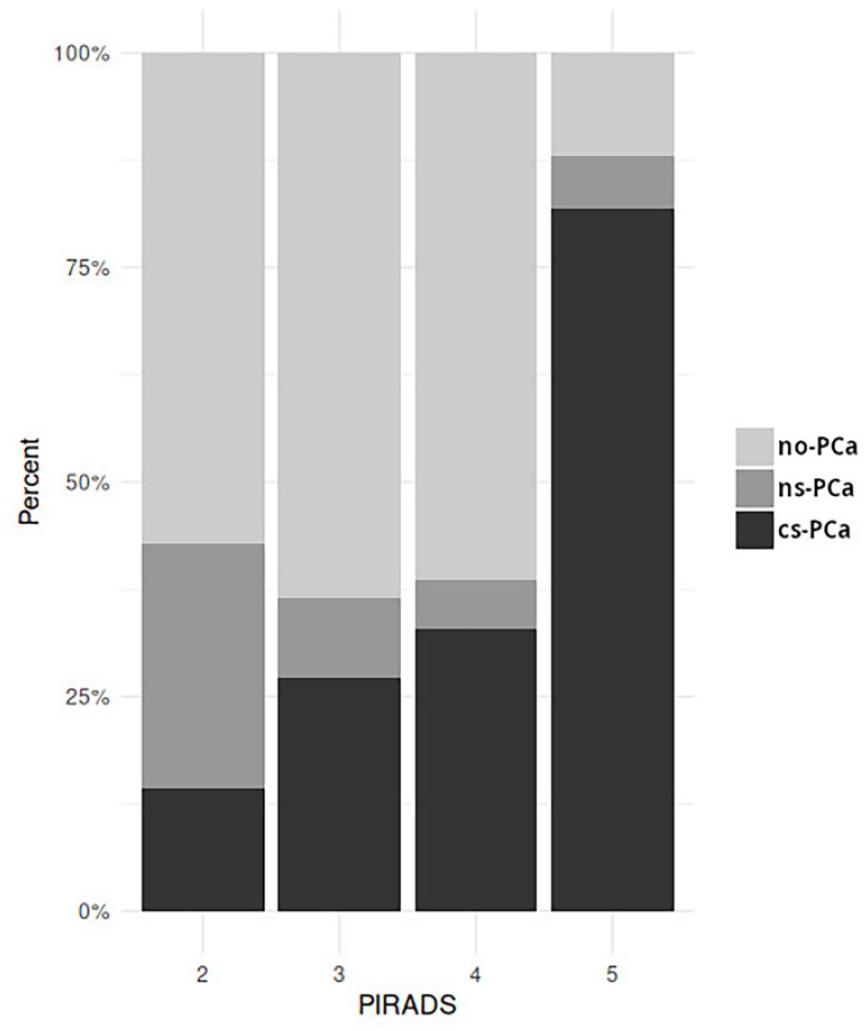
Bar plots showing the comparison between PI-RADS score and biopsy findings. Prostate cancers have been divided in three groups: negative (no-PCa), positive for non-clinically-significant (ns-PCa, Grade Group 1) cancer, and positive for clinically significant (cs-PCa, Grade Group ⩾ 2) cancer. PI-RADS 2 cases were mostly negative (57%) or positive for clinically insignificant cancer (29%), whereas PI-RADS 5 cases were mostly positive for clinically significant cancer (82%) with only a small fraction of cases free from cancer (12%).
Univariate analysis showed an association between age and the presence of any cancer and between age and only cs-PCa (p < 0.001 for both). With one-way ANOVA, age differed significantly (p < 0.001) between no-PCa and cs-PCa only. A similar association was observed between PSA density and presence of any cancer (p < 0.001) and between PSA density and only cs-PCa (p < 0.001) but not ncs-PCa. In analysis of variance (Kruskal-Wallis), PSA density differed significantly between no-PCa and cs-PCa (p < 0.001). The same association was observed with prostate volume (for all three: p < 0.001). The raw PSA level did not show any of these associations (p > 0.05). The PI-RADS score was significantly different in the three groups (no-PCa, ncs-PCa, cs-PCa), with p < 0.0001.
Discussion
PCa is an heterogeneous disease. 18 SB, despite its central role in the diagnosis of PCa, suffers from undergrading inherent in the sampling technique. Histopathological analysis of prostatectomy specimens upgrades 25%–42% of cancers, compared to the presurgical biopsy. 7 Several techniques are being researched to overcome these limitations. 19 The employment of mpMRI with subsequent FB is one such attempt. 20
FB is theoretically the superior method to detect and confidently biopsy the suspect lesion. Nevertheless, in the present series, FB undergraded 8 ncs-PCa patients and 10 cs-PCa patients, when compared to SB. On the other hand, SB underestimated 2 ncs-PCa patients and 10 cs-PCa patients when compared to FB. This experience clearly shows that the best diagnostic option consists in associating the two bioptic techniques to obtain the best diagnostic rate. The above considerations are in agreement with the published literature 21 and with the EAU 22 that suggest to always associate FB and SB. It is interesting to observe how the detection rate of cs-PCa patients is similar for the two methods, while the global diagnostic power, including clinically insignificant cancers, is higher for SB. This is probably due to the limitations of mpMRI in identifying low-grade lesions.
Between 2014 and 2015, at least three reviews of the literature were published suggesting a superiority of FB compared to SB in the diagnosis of high-grade PCas. 23
The PROMIS study showed that mpMRI and FB versus SB in biopsy-naive men was significantly more sensitive than SB alone in detecting PCa.24,25
In the PRECISION study, the detection rate of ISUP GG 2 or higher tumors was significantly higher in men assigned to mpMRI and FB than in those assigned to SB. In contrast, the detection of clinically insignificant tumors (ISUP GG 1 tumors) was significantly higher in patients assigned to SB, consistent with the findings of the present study. 22
However, not all FBs are equal. Indeed, the wide use of mpMRI has led to the development of various techniques and methodologies. The best standard has not currently been found.9–12 And above all, despite the wide technological support, prostate biopsy remains an operator-dependent procedure. Operator expertise is an important predictor of the detection of PCa, regardless of the procedure used. 26
FB and mpMRI also play a notable role in the management of PCa patients being managed with active surveillance. A recent study evaluated their role in the early reclassification of GG1 cancer diagnosed with SB alone. 27 Consistent with data postulating that when a patient with a GG1 PCa is found to have higher-grade cancer at a follow-up biopsy, sometimes the higher-grade component does not represent progression, but simply better sampling, 19 34% of mpMRIs were positive, and 50% of the subsequent FBs reclassified the patient as GG2 or higher. 27 The addition of FB to SB can thus improve the identification of patients manageable with active surveillance, reducing undergrading due to undersampling.
An interesting topic is the ideal number of biopsy cores per lesion in FB. In the present study, three fusion-targeted samples were collected. In a recent study, the optimal number of cores to be obtained from each suspicious lesion in FB was postulated to depend on the characteristics of the lesions. Accordingly, while obtaining two to three biopsy cores could be adequate in PI-RADS 4 and 5 lesions, which have a high risk of cancer, a minimum of four biopsy cores should be obtained from PI-RADS 3 lesions to ensure accurate histopathological results. 28
We know that inconsistency and selection bias can represent a limitation of the present work. Based on these findings, an improvement in the diagnostic techniques should be sought. One additional limitation of the present study is the lack of definitive pathology from radical prostatectomy. This doesn’t allow to identify the cases undergraded by both methods. However, the comparison between the two methods remains unaffected.
In conclusion, the adoption of FB allowed the diagnosis of 10 additional cases (17%) of clinically significant PCa which would otherwise have been missed by standard SB. However, FB cannot replace SB because a similar number of cases (n = 10, 17%) were diagnosed by SB but missed by FB. Therefore, the two techniques at the moment are best seen as synergistic. When possible, FB should be associated to SB, in order to detect a greater number of clinically significant PCas.
Footnotes
Declaration of conflicting interests
The author(s) declared no potential conflicts of interest with respect to the research, authorship, and/or publication of this article.
Funding
The author(s) received no financial support for the research, authorship, and/or publication of this article.
Ethical approval
The corresponding author certifies that, when applicable, a statement has been included in the manuscript documenting institutional review board, ethics committee or ethical review board study approval; principles of Helsinki Declaration were followed in lieu of formal ethics committee approval; all human subjects provided written informed consent with guarantees of confidentiality.