
Abstract
Objective/background:
Benign prostatic hyperplasia (BPH) is increasing substantial burden on health care systems. Men with high body mass index (BMI) have bigger prostate volumes (PV) with subsequent increase in lower urinary tract symptoms (LUTS) than men with normal BMI. The purpose of this research was to investigate the correlation between Obesity and PV in patients with BPH.
Method:
The study included 560 patients (50–80 years) with BPH. Weight and height measured to calculate BMI. TRUS was used to measure PV. Patient demographics such as IPSS score and prostate specific antigen (PSA) were also noted.
Results:
Patients in the study had a mean age of 65.3 ± 9.45 years and the mean BMI was 23.97 ± 4.89 kg/m2. The mean PV of each BMI group were 37.45 ± 0.81, 57.89 ± 1.52 and 77.94 ± 2.17 (ml) for normal, overweight and obese groups, respectively, and the average PV score was 57.76 ± 1.50 ml. The mean PSA score was 3.26 ± 0.94 (ng/dl) with a range of 0.6–10.4. There was significant correlation between BMI and PV (p = 0.001) as well as between BMI with PSA and IPSS (p = 0.02, 0.001, respectively).
Conclusion:
The results showing strong correlation between BMI and PV also BMI with PSA and IPSS. Therefore reducing weight may lead to a lower prostate volume in the elderly stage, making LUTS less noticeable and improving quality of life.
Introduction
Benign prostatic hyperplasia (BPH) is a common cause of lower urinary tract symptoms (LUTS) in older men. 1 With advancing age prostatic tissue apoptosis failure results in growing prostate gland size. 2 BPH is more common in men over the age of 40 or in their fifth decade.3,4 A presumption basis for BPH diagnosis is provided by prostate size. 5 Males who are obese and older than 40 years old are more likely to have BPH and tumours.6 –8 Frequency, urgency, post-void dribbling, nocturia, overflow incontinence, and dysuria are among the symptoms of LUTS. 9 BPH symptoms are due to mainly increase transitional prostatic zone around the urethra. According to estimates, the proportion of BPH in patients (men) older than 60 years old was over 75%.10,11 Obesity raises intra-abdominal pressure, which leads to worsening of LUTS.12,13 Inflammation and microvascular illness brought by central adiposity are favourable characteristics such oxidative stress and ischaemia lead to BPH. 14 Chronic inflammation is main root source of pro-growth cytokines and other growth-related factors. 15 According to another theory, altered oestrogen to androgen ratio due increase adipose tissue and lower testosterone levels promotes the development of BPH. 16 Various publications showed obesity increases likelihood of developing BPH and aggravating LUTS.15 –17
In Our institution, Department of Urology manages large number of BPH patients medically and surgically. This study sought to explore the relationship between obesity and prostatic enlargement (BPH) and identify a risk factors that could be modifiable and could aid in the epidemiologic study of obesity and BPH.
Material and methodology
The Institutional Ethics Committee authorised the study protocol (116MC/EC/2021), which was carried out in accordance with the Declaration of Helsinki’s principles. The study was a prospective cohort analytical study. In total, 560 patients between ⩾50 and <80 ages were seen consecutively in urology outpatient department between January 2022 and March 2023 were recruited following informed and written consent.
Patients those underwent a transrectal ultrasound (TRUS) guided prostate biopsy due to elevated prostate-specific antigen (PSA) levels or abnormal digital rectal examination findings were evaluated prospectively and patient with benign pathology were also included. A clinical evaluation, including the International Prostate Symptom Score (IPSS) questionnaire, PSA level, Body mass index (BMI) and TRUS findings were performed of each BPH patient. The IPSS was used for the evaluation of LUTS. Patients were divided into three groups according to Asian classification of BMI: 18.5–22.9 (normal), 23.0–24.9 (overweight) and >25 (obese). According to the IPSS, LUTS is characterised as mild between 0 and 7, moderate between 8 and 19 and severe between 20 and 35.
Patients using five alfa reductase inhibitor or antiandrogen, bladder stones, neurogenic bladder, previous prostate surgeries, prostate cancer were excluded from the study.
Statistical analysis
The results summarised by percentages and frequencies (categorical variables) and means, percentiles, standard deviations (numerical variables). Associations between variables and outcome were investigated using contingency tables with relative risks and appropriate hypothesis testing. A one-way analysis of variance (ANOVA) was used to assess the relationship between BMI, PV, PSA and IPSS. The relationship between variables was considered positive when the Pearson correlation (r) was greater than zero. A p-value of <0.05 was considered significant.
Results
Subject characteristics
The mean age of the patients was 65.3 ± 9.45 years and mean BMI was 23.97 ± 4.89 kg/m2. About 46 (8.3%) were diagnosed with hypertension and 54 (9.7%) with diabetes mellitus.
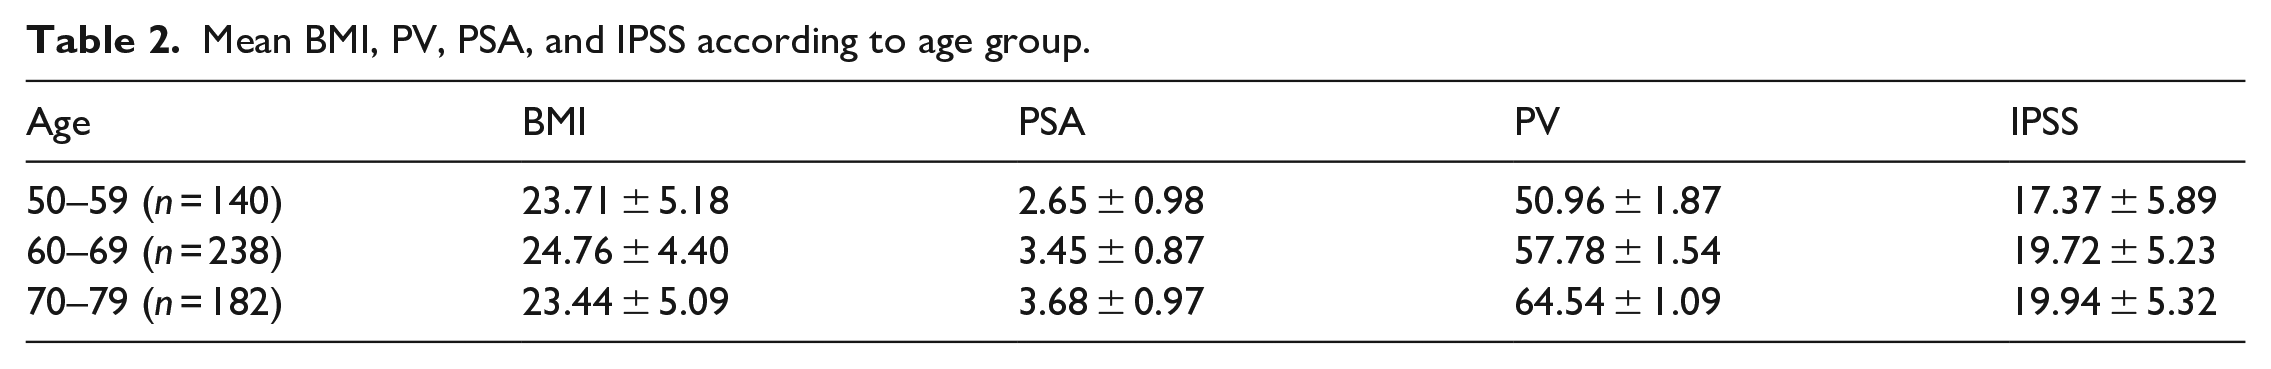
The BMI distribution of 560 patients were as follows: 161, 182 and 217 in the normal weight (28.75%), overweight (32.5%), and obese (38.75%) groups, respectively (Figure 1). Mean PSA, BMI, PV and IPSS including sub scores according to each age group are shown in Table 1. Tables 2 and 3 shown the comparisons of the study subjects in each group.
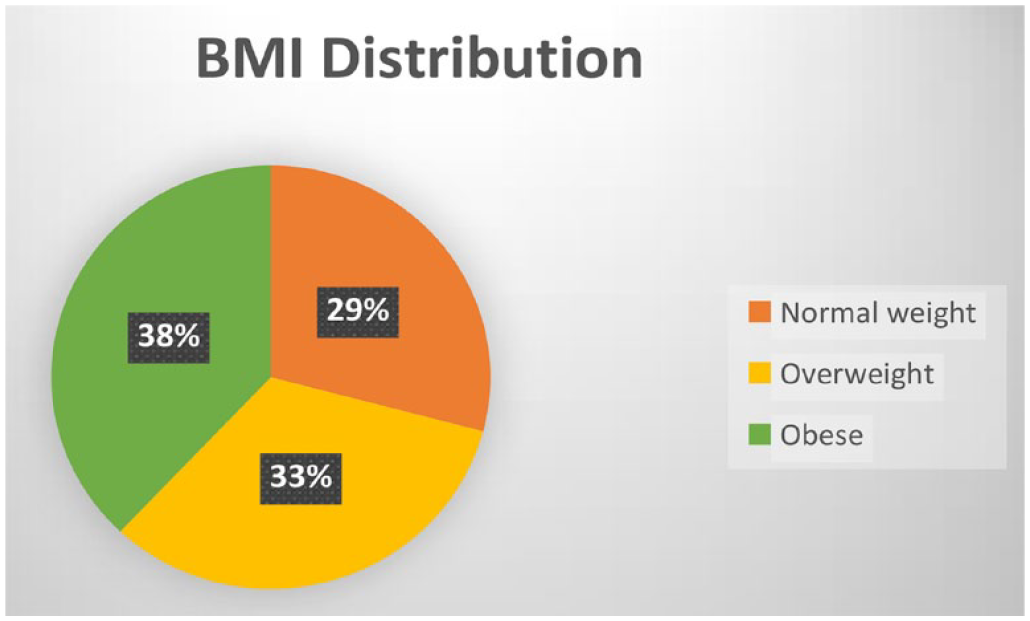
BMI distribution among study participants.
Baseline characteristics of participants.
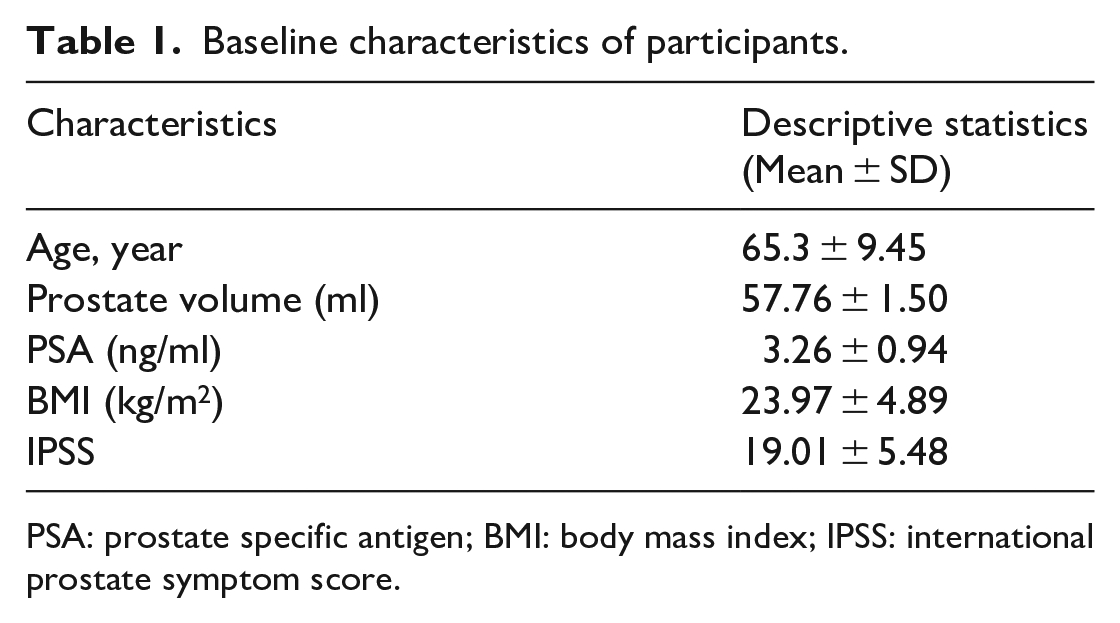
PSA: prostate specific antigen; BMI: body mass index; IPSS: international prostate symptom score.
Mean BMI, PV, PSA, and IPSS according to age group.
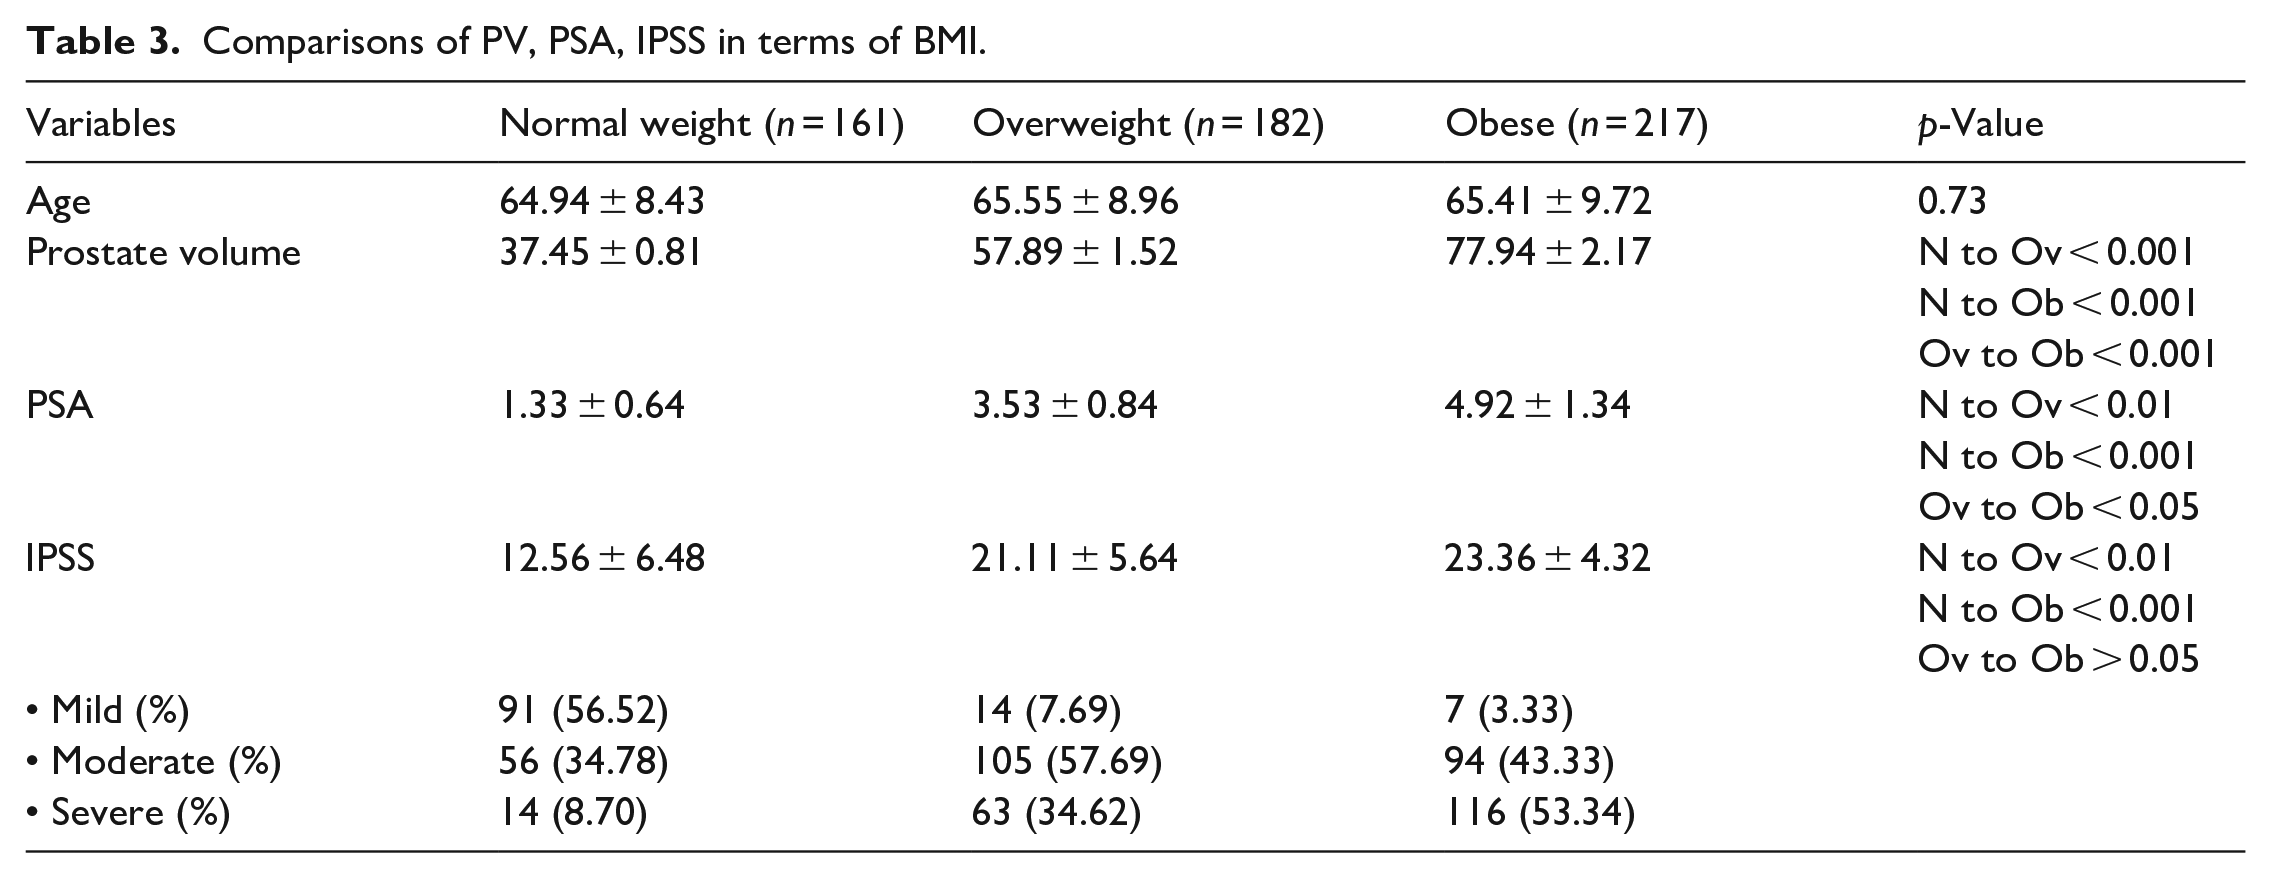
Comparisons of PV, PSA, IPSS in terms of BMI.
Prostate specific antigen
The mean PSA value was 1.33 ± 0.64, 3.53 ± 0.84 and 4.92 ± 1.34 ng/ml in each BMI group. There were significant differences in PSA values among the groups (p < 0.001) (Table 3).
Prostate volume
The mean PV was 37.45 ± 0.81, 57.89 ± 1.52 and 77.94 ± 2.17 ml in each BMI group. PV was largest in the obese group. There were significant differences in PV among the BMI groups (p < 0.001) (Table 3).
International prostate symptom score
The mean IPSS was 12.56 ± 6.48, 21.11 ± 5.64 and 23.36 ± 4.32 in each BMI group. The IPSS and sub scores for LUTS were highest in the obese group. There were significant differences in IPSS among the BMI groups (p < 0.001) (Table 3).
Associations between PSA, PV, IPSS and BMI
We examined the relationships between PSA, PV, IPSSand BMI. In the univariate analysis by Pearson’s correlation coefficient, BMI correlated with PV (p = 0.001), PSA (p = 0.023) and IPSS (p = 0.02). The correlation coefficients of PSA, PV and IPSS were 0.320, 0.142 and 0.470, respectively (Figure 2).
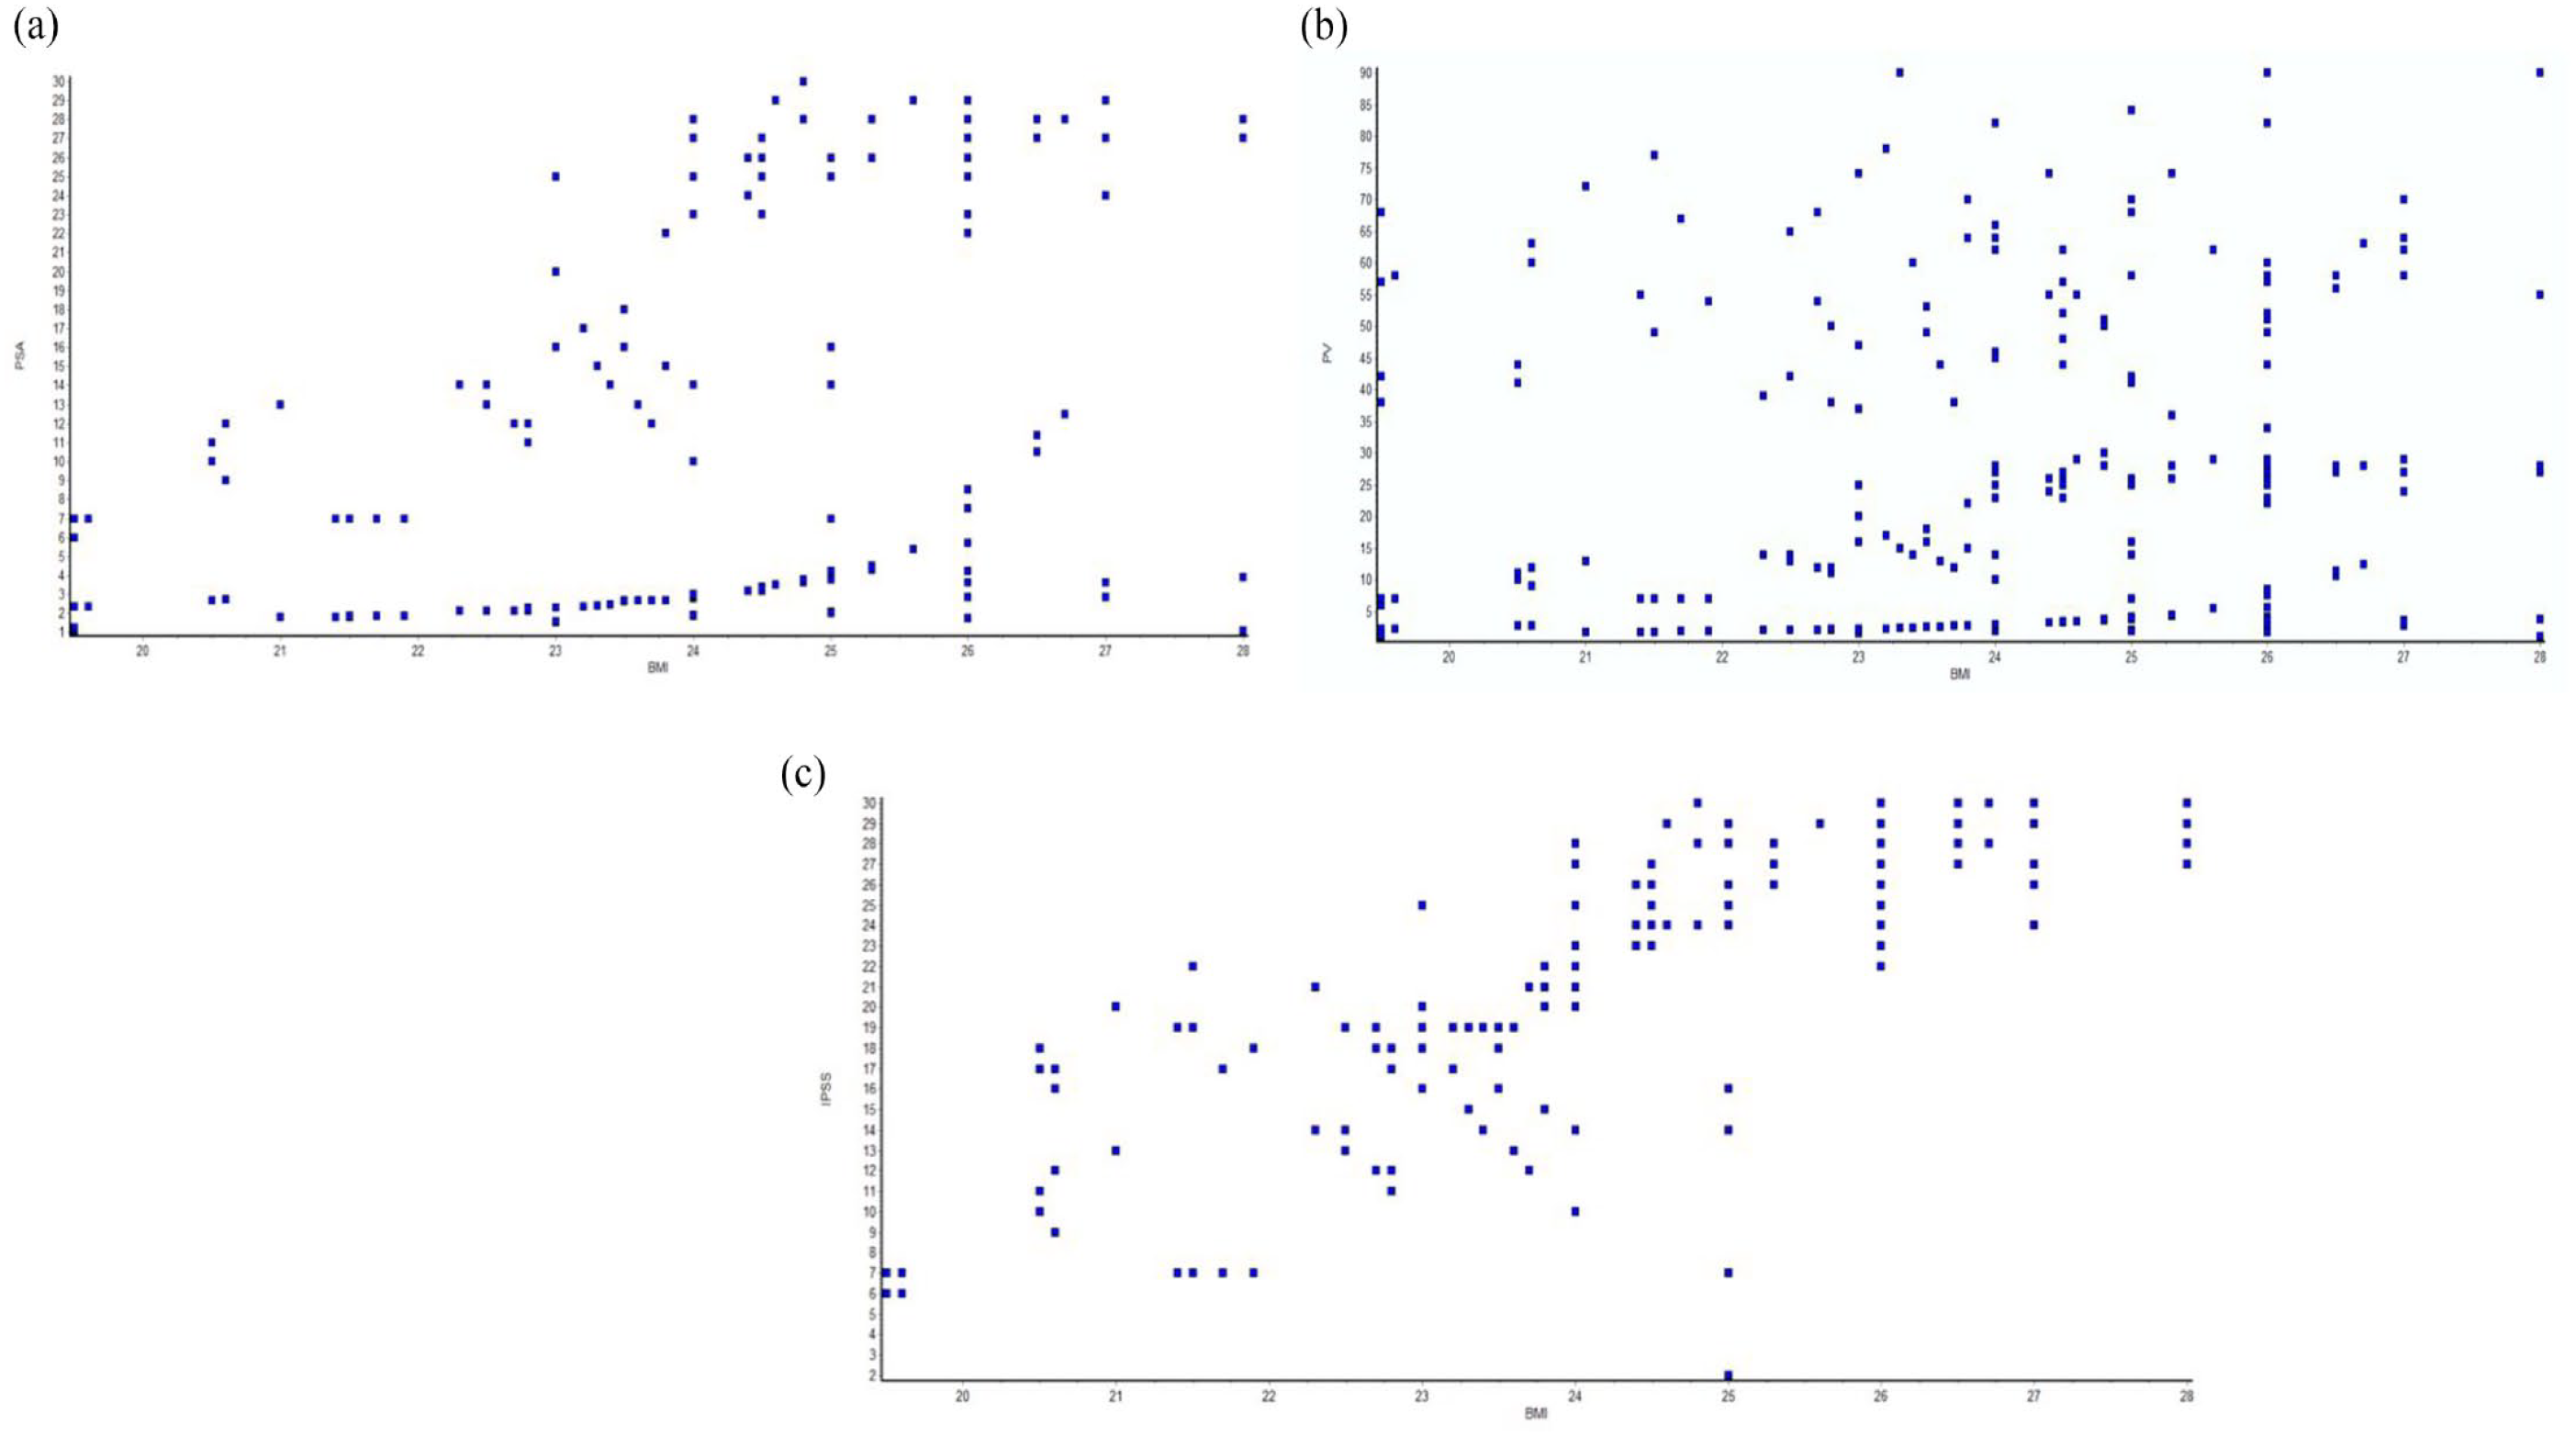
Univariate analysis by Pearson’s correlation coefficient: (a) correlation between BMI and PSA (p = 0.02), (b) correlation between BMI and PV (p = 0.001) and (c) correlation between BMI and IPSS (p = 0.001).
Discussion
In individuals with benign prostate hyperplasia, we examined the connection between obesity, prostate volume, and IPSS. It was discovered that obese patients had greater prostate volumes and IPSS scores than average people. The prostate volumes and IPSS scores of obese individuals and those in other BMI categories differed statistically significantly. According to research by Lee et al. people with central obesity and obesity in general had larger prostate volumes than those with normal BMIs. The researchers looked at 146 males above 40 age and divided them into two groups based on their waist circumference (WC) and three groups based on their BMI. In comparison to the normal group, the obese group’s prostate size was noticeably larger. 17 Similar to this, research by Matsuda et al. 18 and Kim et al. 19 revealed a positive correlation between BMI and prostate size but these investigations also revealed a negative link between BMI & PSA levels, with high BMI patients having low PSA.
Through an increase in sympathetic nervous system activity, obesity may affect prostatic hypertrophy and aggravate urinary obstructive symptoms. 20 In the Prostate Cancer Prevention Trial’s 5600 men who were recruited in the placebo arm and were monitored for 7 years, Kristal et al. 21 looked at a number of modifiable lifestyle variables connected to the emergence of symptomatic BPH. They discovered a correlation between obesity and rise in symptomatic BPH (IPSS > 14). So, they hypothesised that adult obesity was linked to a greater incidence of LUTS. In the National Health and Nutrition Examination Survey (NHANES) III cohort, Rohrmann et al. looked into the relationship between obesity and LUTS. Obesity decreases serum globulin-binding protein, free and total oestradiol, and free and total testosterone levels and raises oestrogen levels which can proliferate cells of prostate. BPH & LUTS severity are known to be influenced by the oestrogen to androgen ratio and sympathetic activity. Abdominal obesity rises both factors lead to risk for severe LUTS. The relationship between the quality of venous drainage to BPH is another mechanism that explains this risk. 22
There have been a number of recent research on the connections between BMI and BPH characteristics described, however these studies used healthy male populations who went to health promotion centres. In the current study, we examined symptomatic BPH patients who went to the urology department for assessment or therapy. Our study’s objective was to identify the associations between BMI and symptomatic BPH patients. We thus believe that informing BPH patients of the findings of this study may be beneficial. Patients who visited the urology department and were diagnosed having BPH were evaluated. The findings of our study demonstrated that high BMI was associated with higher mean values of PV and IPSS. BMI and PV and IPSS showed a positive link in the correlation study (p = 0.001 and 0.001, respectively).
Study strengths and limitations
The study is from single centre and mostly from urban population of single state, like many other earlier ones, but compare to other studies numbers of patient included were almost highest. Still it needs to include rural and other states population. So, larger multicentre trials are needed.
Conclusion
As quit high amount of participants in our study. So, we can conclude that Obese patients are more likely to develop larger prostate size with more severe LUTS compare to normal BMI patients. Therefore reducing weight may lead to a lower prostate volume making LUTS less noticeable and improving quality of life.
Footnotes
Acknowledgements
We would like to express our special thanks of gratitude to our patients and staff in Urology Department SMS medical college.
Author contributions
Dr Saurabh Kumar Negi, Post-Doctoral Trainee -Conception, Design, Materials, Data collection and processing, Analysis and Interpretation, Writing; Dr. Sandip Desai, Post-Doctoral Trainee - Materials, Data collection and processing, Analysis and Interpretation, Writing, Literature Review; Dr Gaurav Faujdar, Post-Doctoral Trainee - Materials, Data collection and processing, Analysis and Interpretation, Writing, Literature Review; Dr Sanjeev Jaiswal, Asssociate professor- Design, Supervision, Analysis and Interpretation, Writing, Critical Review; Dr. Ram Dayal Sahu, Assistant Professor- Design, Supervision, Analysis and Interpretation, Writing, Critical Review; Dr. Nachiket Vyas, Professor - Design, Supervision, Analysis and Interpretation, Writing, Critical Review; Dr Shivam Priyadarshi,Senior Professor and Head of department- Design, Supervision, Analysis and Interpretation, Writing, Critical Review
Declaration of conflicting interests
The author(s) declared no potential conflicts of interest with respect to the research, authorship, and/or publication of this article.
Funding
The author(s) received no financial support for the research, authorship, and/or publication of this article.
Ethics committee approval
Approved by Institutional Ethics Committee.
• Approval number – 116MC/EC/2021
• Dated – 20/1/2022
Patient consent
Obtained.