
Abstract
Background:
Studies suggest that immune abnormalities play a significant role in the pathophysiology of interstitial cystitis/bladder pain syndrome (IC/BPS), yet reliable targets and biomarkers for immune intervention remain unidentified. The aim of this study was to explore the immune key targets and biomarkers that are crucial in IC/BPS.
Methods:
Single-cell RNA sequencing (scRNA-seq) and bulk RNA sequencing (bulk RNA-seq) data were integrated to analyze the immune microenvironment in IC/BPS. scRNA-seq data (GSE164557) were processed with the Seurat package, while bulk RNA-seq data (GSE11783, GSE11839, GSE28242, GSE57560) were batch-corrected using limma. Differential expression analysis was performed with limma, and immune cell infiltration was assessed through CIBERSORT. A binary classification machine learning model was built using 14 algorithms to identify key genes. Functional enrichment and gene regulatory networks were analyzed using GSEA, ORA, and pySCENIC.
Results:
Our findings revealed substantial dysregulation of immune cell homeostasis in IC/BPS patients, characterized by aberrant macrophage polarization and T cell subset dysregulation. MMP9 has been identified as a key gene that is highly expressed in IC/BPS, particularly in macrophages. Functional annotation showed that MMP9 expression is positively correlated with the enrichment of immune pathways such as leukocyte activation and phagocytosis, and single-cell analysis demonstrated enhanced phagocytic activity in MMP9+ macrophages. Additionally, potential MMP9-targeting drugs, including teriflunomide, captopril, minocycline, and ilomastat, were identified through CMap database screening and molecular docking.
Conclusion:
This study highlights MMP9 as a key macrophage biomarker in IC/BPS, where its elevated expression is closely linked to enhanced phagocytic activity and the activation of immune-related signaling pathways.
Keywords
Introduction
Interstitial Cystitis/Bladder Pain Syndrome (IC/BPS) is a complex urological disorder characterized by chronic pelvic and bladder pain, urinary frequency, urgency, and increased nocturia. With an unclear etiology, prolonged clinical course, and absence of specific therapeutic interventions, IC/BPS has been recognized as one of the most challenging conditions in global urology.1–3 Epidemiological data show significant geographical variations in the global prevalence of IC/BPS, with estimates ranging from 0.06% to 2.7% in Western populations, and a slightly lower but increasing prevalence in Asian populations. The disease predominantly affects women, with 80%–90% of patients being female, and typically impacts individuals aged 40–60 years. IC/BPS is often comorbid with somatic syndromes such as fibromyalgia and irritable bowel syndrome, as well as psychiatric disorders like anxiety and depression. These multifaceted symptoms severely impair patients’ social functioning and quality of life.4,5
The prevailing pathological hypotheses suggest that a compromised bladder urothelial glycosaminoglycan (GAG) layer, resulting in increased permeability, is the primary initiating factor in the pathogenesis of IC/BPS. This defective barrier allows the penetration of urinary toxic substances, which then stimulate subepithelial nerve fibers and activate mast cells to release histamine, proteases, and other inflammatory mediators. These events lead to neurogenic inflammation and central sensitization, ultimately triggering a self-perpetuating “pain-inflammation-immune dysregulation” cycle that sustains disease progression.6,7
However, the current diagnostic approach remains largely dependent on exclusion-based criteria outlined by the American Urological Association (AUA). This includes persistent symptoms lasting over 6 weeks, negative urodynamic findings, and cystoscopic identification of Hunner’s lesions, which are present in only 10% of patients. This diagnostic framework, compounded by the lack of validated biomarkers, often leads to diagnostic ambiguity, as the symptoms overlap with those of other lower urinary tract disorders such as bladder cancer, where systemic inflammatory factors like PLR and SIRI have already shown significant prognostic value. 8 Current treatment strategies adopt a stepwise, multimodal approach, with first-line therapies including oral pentosan polysulfate sodium (PPS) for glycosaminoglycan (GAG) layer restoration, amitriptyline for its analgesic and antidepressant effects, and intravesical hyaluronic acid instillations. Second-line interventions consist of intradetrusor onabotulinumtoxinA injections, sacral neuromodulation, or low-energy shock wave therapy. In refractory cases, cystoplasty or urinary diversion may be required, though these surgical options exhibit suboptimal efficacy (<50% success) and long-term recurrence rates exceeding 30%. Despite advancements in therapy, persistent challenges in symptom control and disease modification highlight the critical need for pathophysiology-driven therapeutic innovations.9,10
Recent advances in single-cell RNA sequencing (scRNA-seq), spatial transcriptomics (ST), and multi-omics integration technologies have enabled researchers to explore the dynamic heterogeneity of immune microenvironments in IC/BPS bladder mucosa and stroma at single-cell resolution. scRNA-seq profiling has revealed a significant imbalance in macrophage M1/M2 polarization within IC/BPS bladder tissues. Pro-inflammatory M1 subsets contribute to the exacerbation of localized inflammation through the sustained secretion of cytokines such as TNF-α and IL-6. In contrast, functionally impaired regulatory M2 subsets are unable to restore immune homeostasis. This polarized macrophage landscape, characterized by excessive pro-inflammatory signaling and insufficient immunoregulatory capacity, may be a crucial mechanism underlying chronic inflammation and therapeutic resistance in the pathophysiology of IC/BPS.3,11,12 In addition, the imbalance of CD4+ T lymphocyte subsets, such as the dysregulation of the Th17/Treg ratio, and the abnormal infiltration of cytotoxic CD8+ T cells, suggest that T cell-mediated adaptive immune responses play a crucial role in disease progression. 13 Spatial transcriptomics further elucidated the spatial co-expression patterns of chemokines (such as CXCL10 and CCL5) and their corresponding receptors (CXCR3 and CCR5) in inflammatory hotspots. This finding indicates that the interaction between immune cells and epithelial cells drives the localized spread of chronic inflammation through the chemotactic signaling axis.14–16
Through the identification of differentially expressed genes (DEGs) and protein-protein interaction (PPI) network analysis, the study highlighted the NLRP3 inflammasome, the JAK-STAT signaling pathway, and immune checkpoint molecules (such as PD-L1) as potential therapeutic targets.17,18 However, current research still faces several challenges, including the limited availability of disease-related therapeutic targets and effective drugs, as well as the incomplete elucidation of the mechanisms underlying these targets. The innovation of this study lies in the integration of multi-scale transcriptomic data (bulk RNA-seq/scRNA-seq) with clinical pathological features, aiming to systematically construct a functional map of the IC/BPS immune microenvironment. The goal is to identify hub genes with dual diagnostic and therapeutic value, thereby providing a precise theoretical foundation for the development of immune-modulatory therapies, such as immune cell subset reprograming and chemokine antagonists.
Materials and methods
Resources of single-cell RNA sequencing data and bulk RNA sequencing data
In this study, for bulk RNA-seq, we searched the GEO database for data related to IC/BPS and downloaded four independent public datasets (GSE11783, GSE11839, GSE28242, and GSE57560).19–23 Detailed information about these datasets is provided in Supplemental Table 1. For subsequent analyses, we focused only on the expression data from IC samples. Given the differences in sequencing platforms, methods, and experimental designs across these datasets, we used the removeBatchEffect function from the limma package in R to correct for batch effects. 24 Ultimately, these datasets were integrated into a GEO cohort comprising 37 IC samples for further analysis.
For single-cell RNA-seq, all bioinformatics analyses were conducted using the Seurat toolkit (version 5.1.0; https://satijalab.org/seurat/) based on R software (version 4.4.2). 25 We obtained the GSE164557 dataset from the GEO database, which includes single-cell mRNA profiles of the bladder mucosa from 8-week-old C57BL/6 mice, 8-week-old C57BL/6 mice treated with DPP for 48 h, and 8-week-old C57BL/6 mice treated with 4 rounds of DPP for 11 days, all generated using the 10x Genomics platform. 26 Each group included two samples, resulting in a total of six samples analyzed in this study. Given the limited availability of large-scale human scRNA-seq datasets for IC/BPS, we utilized the GSE164557 dataset, derived from a well-established mouse model of cyclophosphamide-induced cystitis, to explore immune cell heterogeneity. This approach allows for a high-resolution mechanistic exploration of candidate genes identified in our human bulk RNA-seq analysis, leveraging the conservation of inflammatory pathways between species.
Quality control, normalization, batch correction, dimensionality reduction, and clustering
The single-cell metadata includes detailed cell-specific information such as cell origin, tissue origin, disease status, and other relevant annotations. The expression matrix was directly converted into a Seurat object using the Seurat::CreateSeuratObject() function, and the metadata information was systematically integrated into this object. For the GSE164557 dataset, six xls-formatted files were downloaded from GEO, containing gene expression matrices. The Seurat::CreateSeuratObject() function was used to generate Seurat objects, and these six objects were subsequently integrated using Seurat’s merging function to facilitate further analyses.
In terms of quality control, cells with fewer than 200 genes, mitochondrial counts exceeding 5% of the total counts, and genes expressed in fewer than 3 cells were excluded. The data were initially normalized using the Seurat::NormalizeData() and Seurat::ScaleData() functions. The Seurat::FindVariableFeatures() function was then used to select the top 2000 variable genes. Using these 2000 variable genes, principal component analysis (PCA) was performed, and the top 10 principal components (PCs) were selected for sub-clustering analysis, with the resolution parameter set to 0.8. To mitigate batch effects and non-biological technical biases, the Harmony package (https://github.com/immunogenomics/harmony) was integrated into Seurat, and its default parameters were applied for adjustment. 27 The expression of known marker genes was used as a reference for annotating different cell types. Finally, the analysis results were presented using t-SNE visualization techniques to visually display the distribution and clustering characteristics of the cell populations.
Construction of binary classification machine learning model
We used the GSE11783 dataset as the training set and the GSE11839, GSE28242, and GSE57560 datasets as validation sets. Subsequently, we integrated 14 machine learning algorithms, including logistic regression, linear discriminant analysis, quadratic discriminant analysis, K-nearest neighbors (KNN), decision tree classification, random forest classification, XGBoost classification, ridge regression, Lasso regression, support vector machine, gradient boosting, stepwise logistic regression, and naive Bayes. We first applied 10-fold cross-validation to determine the optimal features for Lasso regression. Each model was trained and validated using both all features and the optimal features. For machine learning algorithms that include feature selection capabilities, we output the variable importance. The selection of each parameter followed standard practices, and, due to the combination of multiple parameters, a total of 81 parameter optimization combinations were formed. 28
Differential expression analysis and functional enrichment analysis
We utilized the R package limma to identify differentially expressed genes between the IC and control groups, applying the criteria of p.value < 0.05 and |logFC| > 0.585 for selecting upregulated and downregulated genes. Functional enrichment analysis was performed using Gene Set Enrichment Analysis (GSEA) and Over-Representation Analysis (ORA). The clusterProfiler R package was employed to conduct enrichment analysis on pathways from the GO and KEGG databases, with the input species set as Homo sapiens. 29
Immunoassays were performed using cibersort
CIBERSORT is a method based on linear support vector regression that can deconvolute the expression matrix of 22 human immune cell subtypes. In this study, we employed CIBERSORT to analyze the differences in immune cell compositions between the IC and control groups,30,31 aiming to explore the distinct characteristics of their immune cell profiles. Subsequently, we applied the Wilcoxon rank-sum test to assess the differences in the proportions of these immune cells and the expression levels of signature genes.
Gene regulatory network analysis
To conduct single-cell regulatory network inference and clustering analysis, we utilized the pySCENIC (v0.10.0; https://github.com/aertsbab/pySCENIC) analysis tool, which is based on the mm9-TSS-Centralized-10kb-10 species database. 32 The analysis was performed using the default parameters of pySCENIC, with the raw count matrix of all samples as input data. The process consisted of three main steps: First, co-expression modules were identified to recognize synergistic expression patterns among genes. Next, the association weights between transcription factors (TFs) and their target genes were assessed using GRNBOP, and TFs with direct targets (regulons) were identified using the RcisTarget tool. Finally, the activity levels of each regulon in individual cells were evaluated using the AUCell tool. To better visualize the results, we calculated the average regulon activity (AUC) scores for each cell type and employed the ggplot2 package to create a ranking plot of regulon activities. This approach allowed us to intuitively display the differences in regulon activity across various cell types.
Static analysis
We performed bioinformatics analyses using R (version 5.1.0) and Python (version 3.10). Detailed descriptions of the statistical tests are provided in the results section and figure legends. Single-cell related visualizations were created using the ggplot2 package and the SCP software.
Results
Identification of immune-related genes in IC
We performed differential gene expression analysis on the IC and control groups in the GSE11783 dataset, screening for upregulated and downregulated genes using the criteria of p.value < 0.05 and |logFC| > 0.585. As shown in Figure 1(a) and (b), a total of 1926 upregulated genes and 1446 downregulated genes were identified in the IC group. The heatmap revealed that many immune-related genes, such as HLA-DQA1, CXCL13, and IGHM, were highly expressed in the IC group. We applied the same analysis to the GSE11839 dataset, with results shown in Figure 1(c) and (d). A total of 155 upregulated genes and 407 downregulated genes were identified in the IC group. Interestingly, several immune-related genes, such as HLA-DMA and NLRP2, were also highly expressed in the IC group in this dataset.
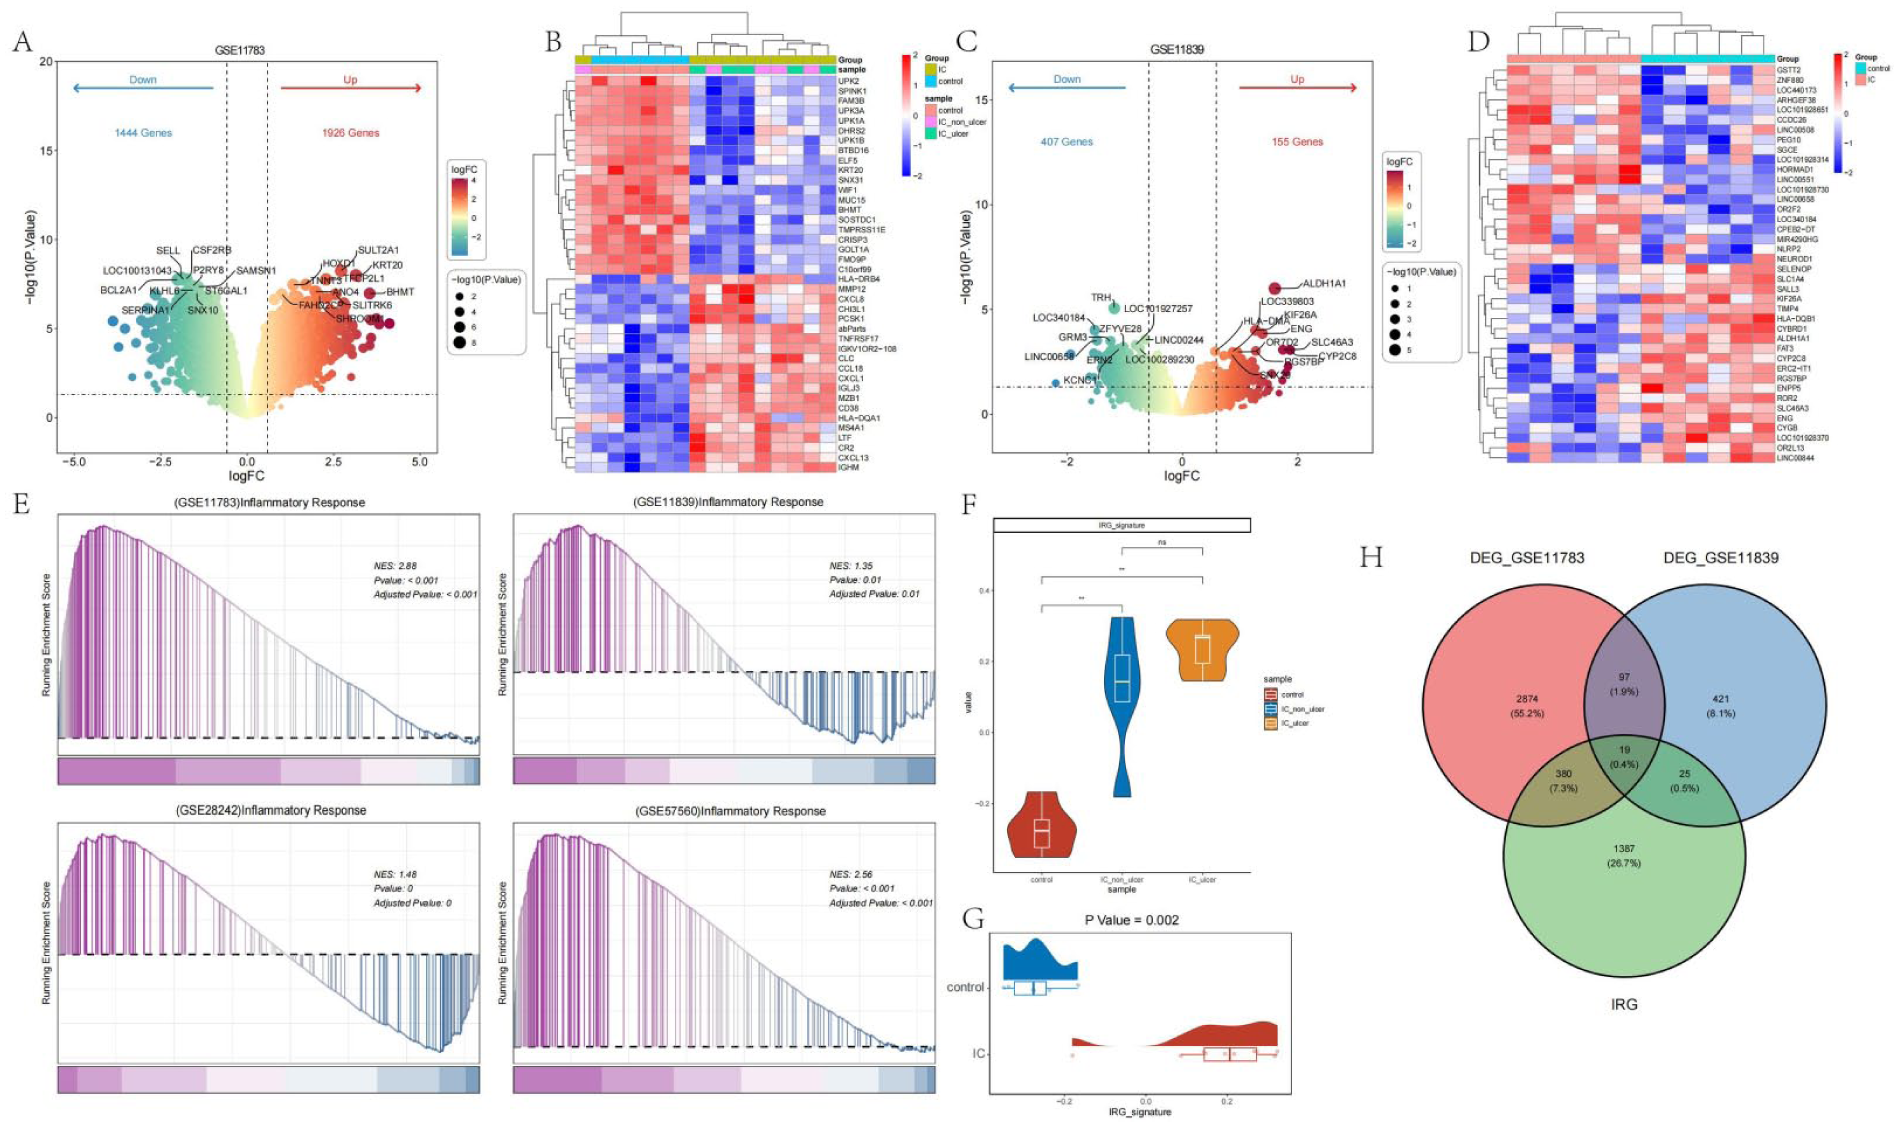
Identification of immune-related genes in IC: (a) volcano plot of differentially expressed genes in the GSE11783 dataset, (b) heatmap showing the expression of the top 20 upregulated and downregulated genes in the GSE11783 dataset, (c) volcano plot of differentially expressed genes in the GSE11839 dataset, (d) heatmap showing the expression of the top 20 upregulated and downregulated genes in the GSE11839 dataset, (e) GSEA enrichment analysis of the immune response pathway in the GSE11783, GSE11839, GSE28242, and GSE57560 datasets, (f) expression differences of immune-related features between control, IC non-ulcer, and IC ulcer samples, (g) expression differences of immune-related features between control and IC samples, and (h) Venn diagram showing the intersection of differentially expressed genes between GSE11783, GSE11839, and immune-related gene sets.
GSEA enrichment analysis was conducted on the immune response pathway in publicly available IC-related datasets (GSE11783, GSE11839, GSE28242, and GSE57560). The results, shown in Figure 1(e), demonstrated that the immune response pathway was upregulated in the IC group compared to the control group in all four datasets (NES > 0, p.adjust < 0.05). A set of immune-related genes was obtained, and GSVA scoring was performed for each sample to examine differences in IRG (immune response gene) scores across different groups. As shown in Figure 1(f) and (g), higher IRG expression was observed in the IC group compared to the control group. Notably, the IC_ulcer group showed a trend of higher IRG expression compared to the IC_non_ulcer group. Subsequently, the differentially expressed genes from the GSE11783 and GSE11839 datasets were intersected with the IRG-related genes, resulting in a total of 19 intersecting genes.
Machine learning identification of key genes in IC
In this study, a binary classification model was developed based on the 19 intersecting genes identified in the previous step. After optimizing the model parameters, we evaluated the C-index values for different models across multiple datasets, as shown in Figure 2(a). Overall, the models constructed using the intersecting genes exhibited strong diagnostic performance, with C-index values averaging around 0.65. The results of evaluating the model using the AUC, F-score and Recall, evaluation metrics are shown in Supplemental Figures 1A–C. These results are complemented by the C-index, together validating the performance of the model constructed with cross genes. Notably, the ENR-CV:10 model (cutoff: 0.25/0.5, alpha: 0.9), following parameter optimization, achieved the highest C-index (0.754) and AUC (0.611).
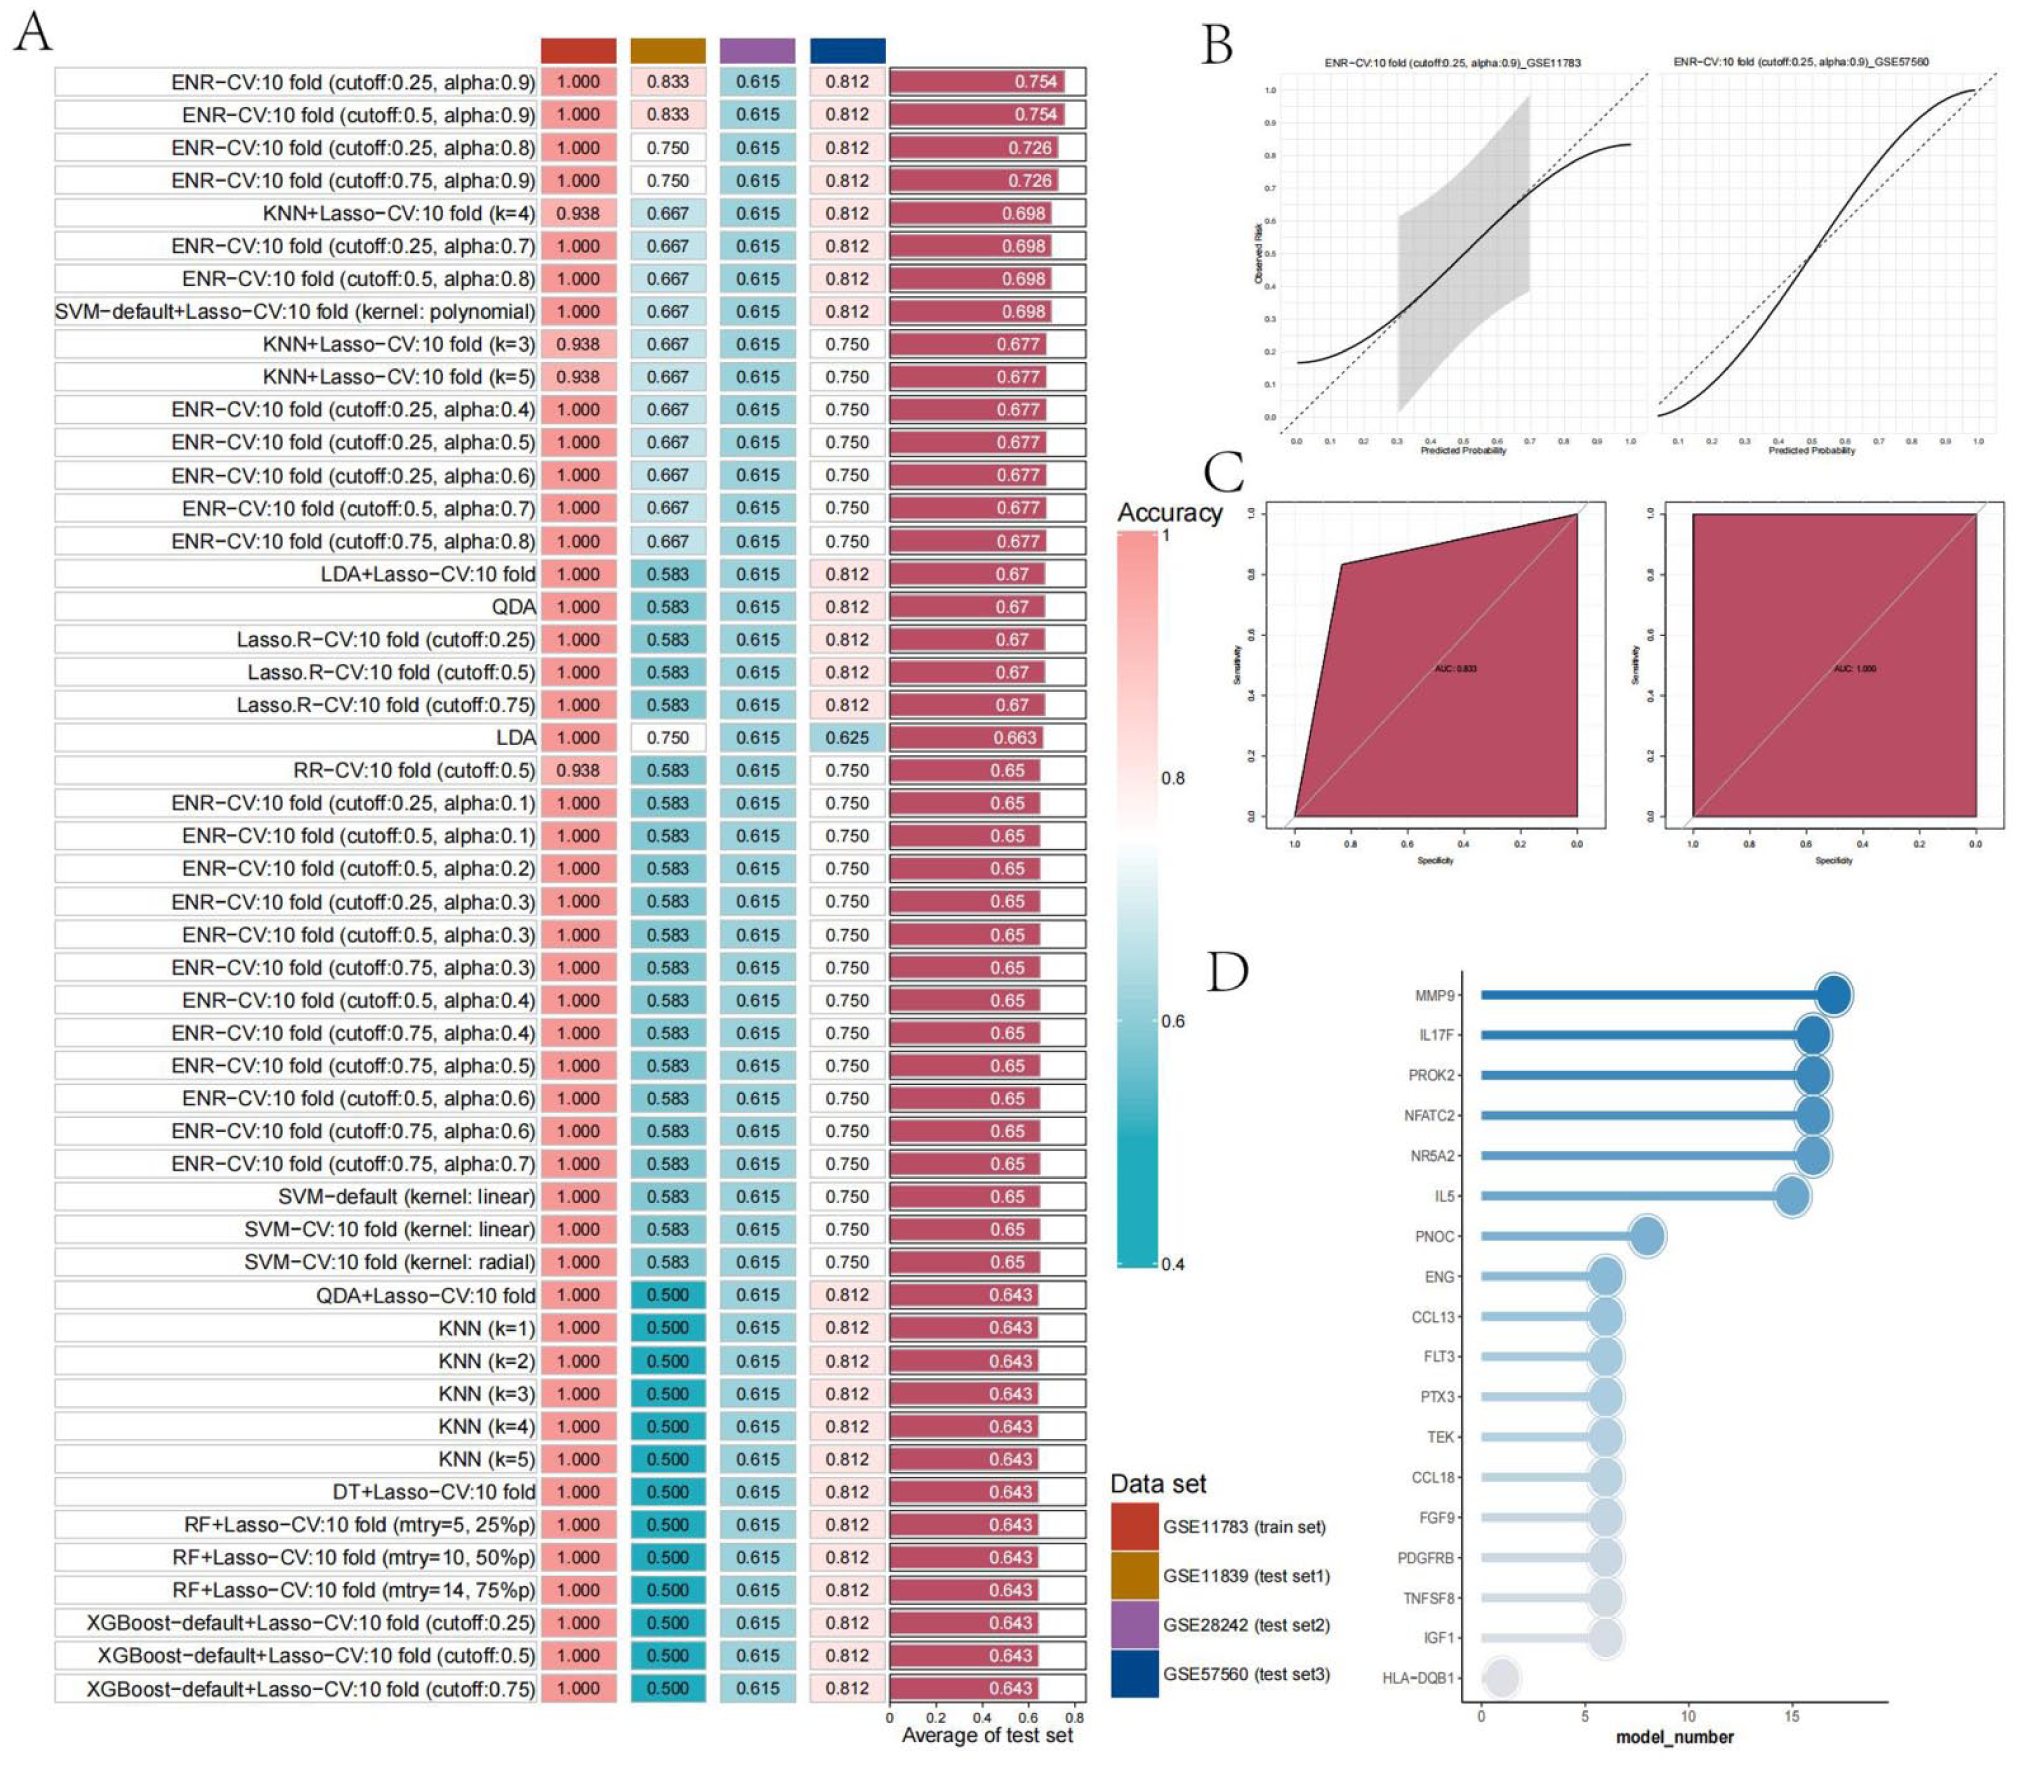
Identification of key genes using multiple machine learning algorithms: (a) heatmap of the C-index values for the top 50 models with the highest average C-index, (b) calibration curves for the model with the highest average C-index in the GSE11783 and GSE57560 datasets, (c) ROC curves for the model with the highest average C-index in the GSE11783 and GSE57560 datasets, and (d) bar chart showing the frequency of intersecting genes included in the models.
To further evaluate the model, we plotted calibration and ROC curves for the GSE11783 and GSE57560 datasets, as shown in Figure 2(b) and (c), which confirmed its excellent performance. Next, we analyzed the frequency of each intersecting gene appearing in different models, with the results presented in Figure 2(d). MMP9 was observed to appear more frequently than any other gene, suggesting its significant role in IC. Based on this finding, we selected MMP9 as the target gene for further investigation in this study.
Immune infiltration analysis
We used the CIBERSORT algorithm to profile immune infiltration in each sample from the GSE11783 and GSE57560 datasets, aiming to observe differences in immune cell infiltration between IC and control samples. As shown in Figure 3(a) and (c), Macrophage_M0, T_cells_CD4_memory_activated, and T_cells_follicular_helper were significantly more infiltrated in the IC group in both datasets. This suggests that these cell types may increase their infiltration to exert pro-inflammatory functions in IC samples.
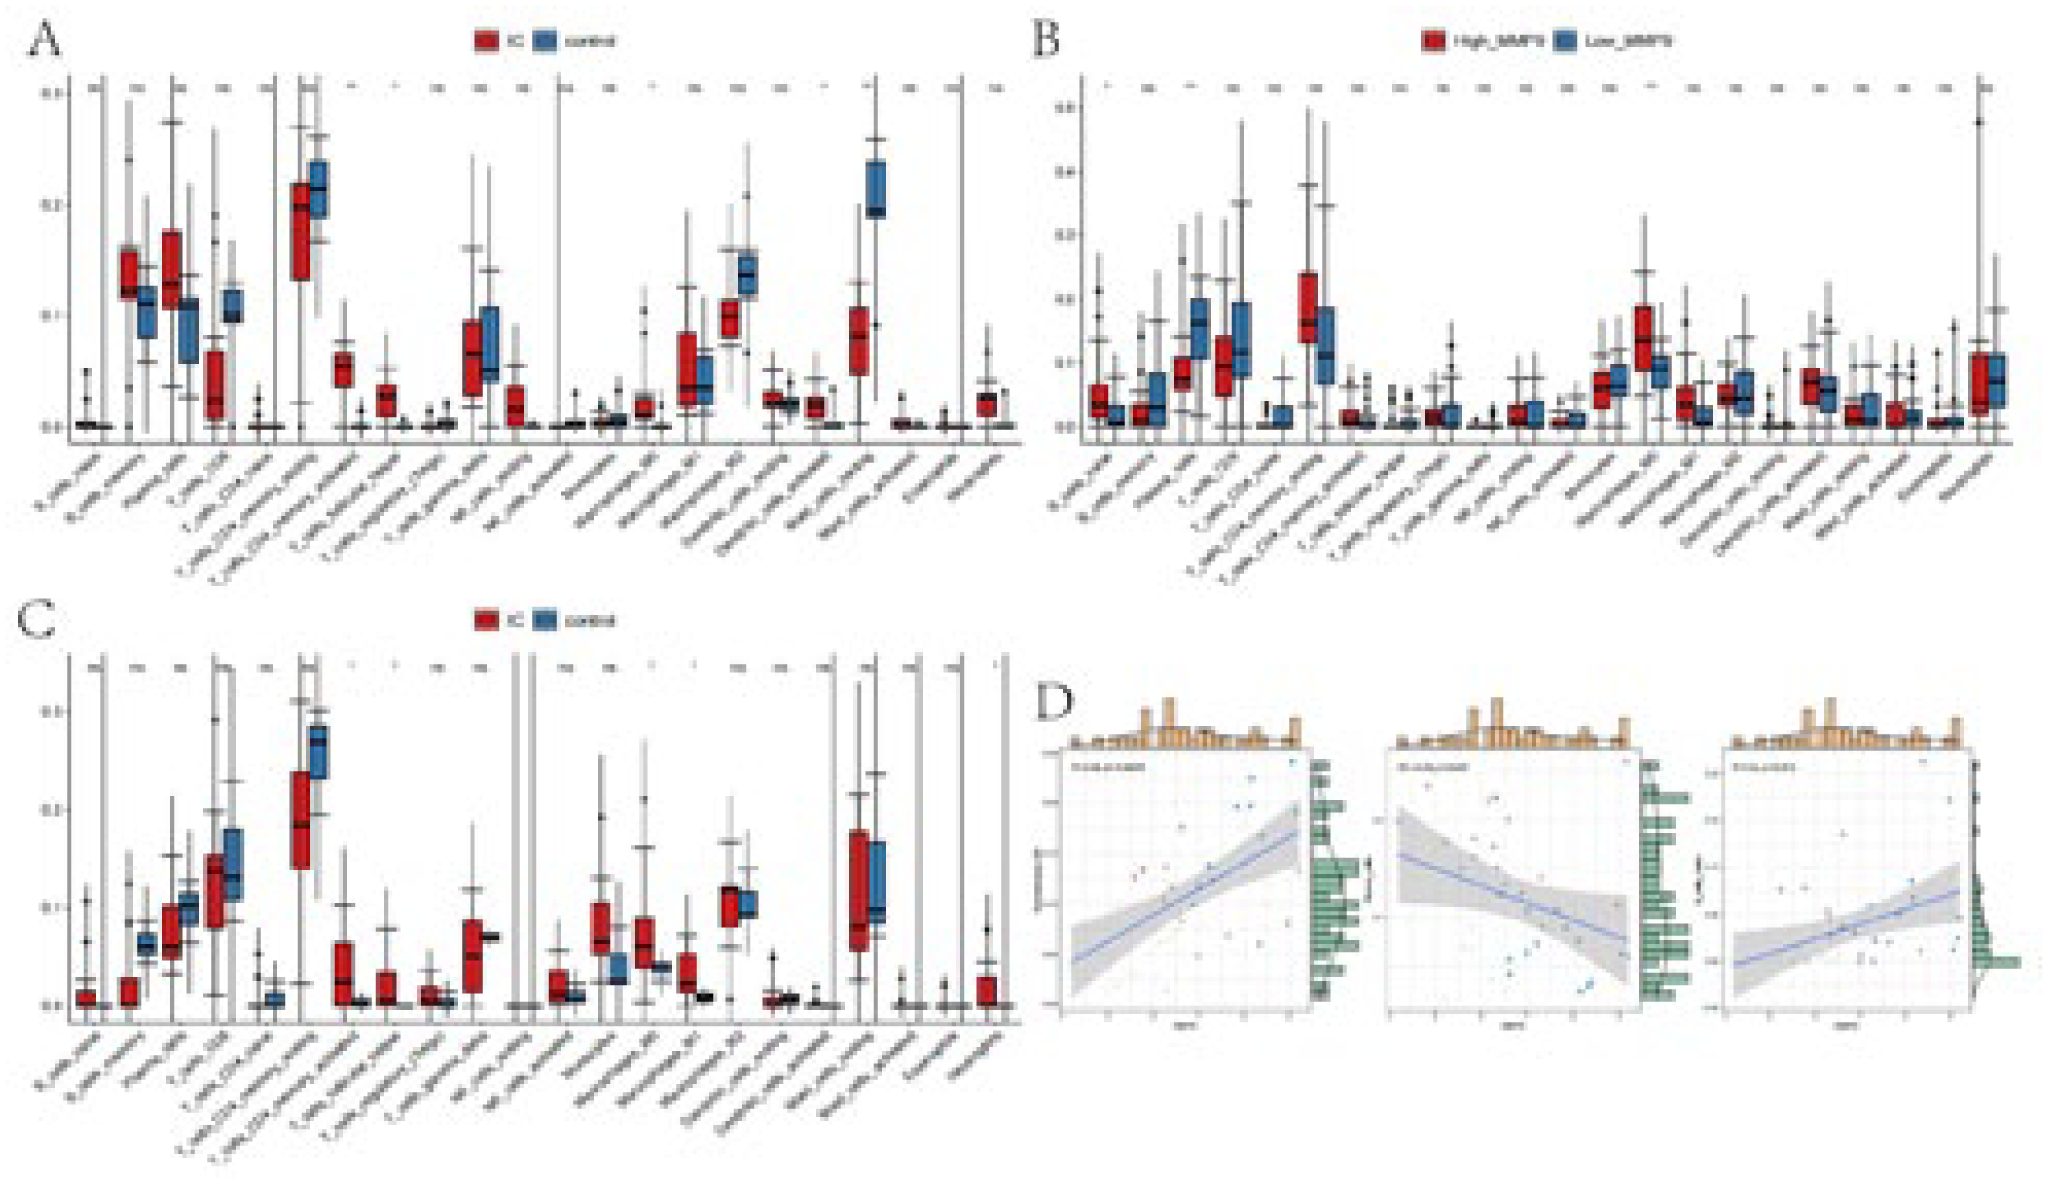
Immune analysis: (a) box plots showing differences in immune cell infiltration between IC and control samples in the GSE11783 dataset, (b) box plots showing differences in immune cell infiltration after batch correction and grouping by MMP9 expression in the GSE11783, GSE11839, GSE28242, and GSE57560 datasets, (c) box plots showing differences in immune cell infiltration between IC and control samples in the GSE57560 dataset, and (d) co-expression scatter plots of MMP9 expression with Macrophage_M0, Plasma_cells, and B_cells_naive infiltration.
Subsequently, we performed batch correction and integration of IC samples from four datasets (GSE11783, GSE11839, GSE28242, and GSE57560), with the PCA results before and after integration shown in Supplemental Figure 2A and B, demonstrating the successful integration of IC samples from different batches. Based on the average expression levels of MMP9, we divided the integrated samples into groups and quantified immune cell infiltration using the CIBERSORT algorithm. As shown in Figure 3(b), Macrophage_M0 and B_cells_naive were highly expressed in the MMP9_high group, while Plasma_cells were more highly expressed in the MMP9_low group, a finding further confirmed by the correlation scatter plot in Figure 3(d).
Functional annotation of MMP9 in bulk transcriptome analysis
The PCA results after grouping the integrated data based on the median expression of MMP9 are shown in Figure 4(a), demonstrating that the two groups of samples can be clearly distinguished. The differential expression heatmap (Figure 4(b)) reveals that MMP9 significantly upregulates many immune-related genes, such as CXCL, CCL18, and CXCL9. The ORA enrichment analysis of upregulated genes (Figure 4(c)) suggests that MMP9 activates immune-related pathways, including the regulation of leukocyte activation, immune response, and positive regulation of immune response. The ORA enrichment analysis of downregulated genes (Figure 4(d)) indicates that MMP9 can downregulate pathways related to epithelial cell differentiation, among others.
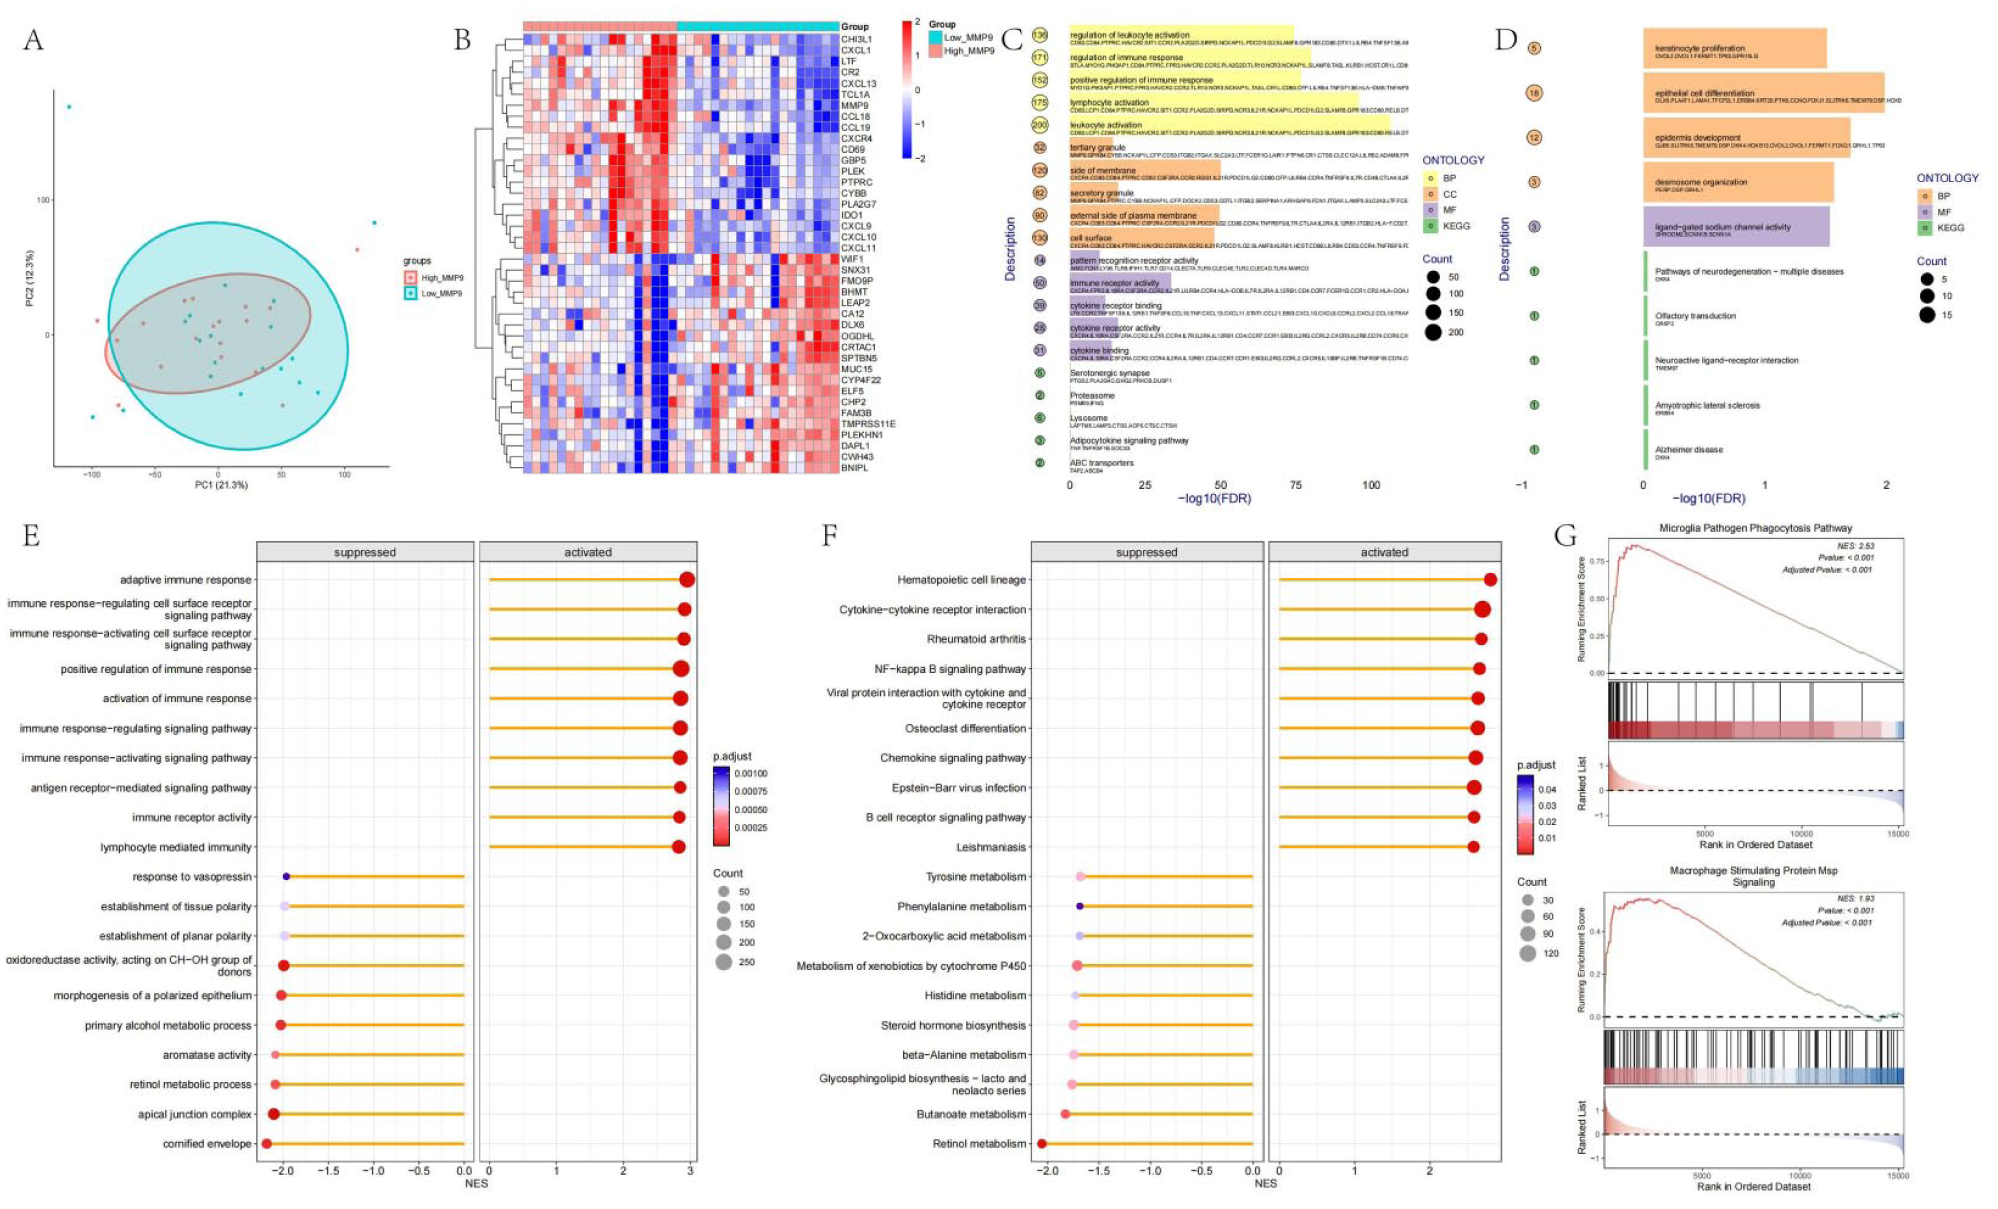
Functional annotation of the MMP9 gene: (a) PCA analysis of 37 IC samples after batch correction, grouped by MMP9 expression, (b) heatmap showing the top 20 upregulated and downregulated genes between the two groups, (c) bar chart showing ORA enrichment analysis of upregulated genes, (d) bar chart showing ORA enrichment analysis of downregulated genes, (e) GSEA enrichment analysis of pathways in the GO database for all differentially expressed genes, showing the top 10 pathways by p.adjust, (f) GSEA enrichment analysis of pathways in the KEGG database for all differentially expressed genes, showing the top 10 pathways by p.adjust, and (g) GSEA enrichment results for macrophage-related pathways.
The GSEA enrichment analysis results for pathways in the GO and KEGG databases are shown in Figure 4(e) and (f). These findings corroborate the ORA results, indicating that MMP9 can upregulate pathways involved in immune response and immune response signaling. Notably, we found that MMP9 upregulates macrophage-related pathways, such as phagocytosis and MSP signaling. This observation is consistent with the earlier finding that MMP9 can increase macrophage infiltration.
Single-cell localization of MMP9
To determine the cellular localization of MMP9 and investigate its specific role within the bladder immune microenvironment at single-cell resolution, we transitioned from human bulk transcriptomics to analyzing a mouse model of bladder injury (GSE164557), where inflammatory cascades closely mimic the human disease state. We performed single-cell annotation on six samples from GSE164557, with results shown in Figure 5(a). A total of six distinct cell clusters were identified: epithelial cells, fibroblasts, macrophages, T cells, smooth muscle cells, and endothelial cells. After batch correction and integration of the samples, the results shown in Figure 5(b) demonstrate that the samples were effectively aggregated, further validating the reliability of our single-cell annotation. We also identified the specific markers highly expressed in each cell cluster: smooth muscle cells expressed Acta2, epithelial cells expressed Krt18, fibroblasts expressed Dcn, T cells expressed CD3d, macrophages expressed Cd68, and endothelial cells expressed Cdh5.
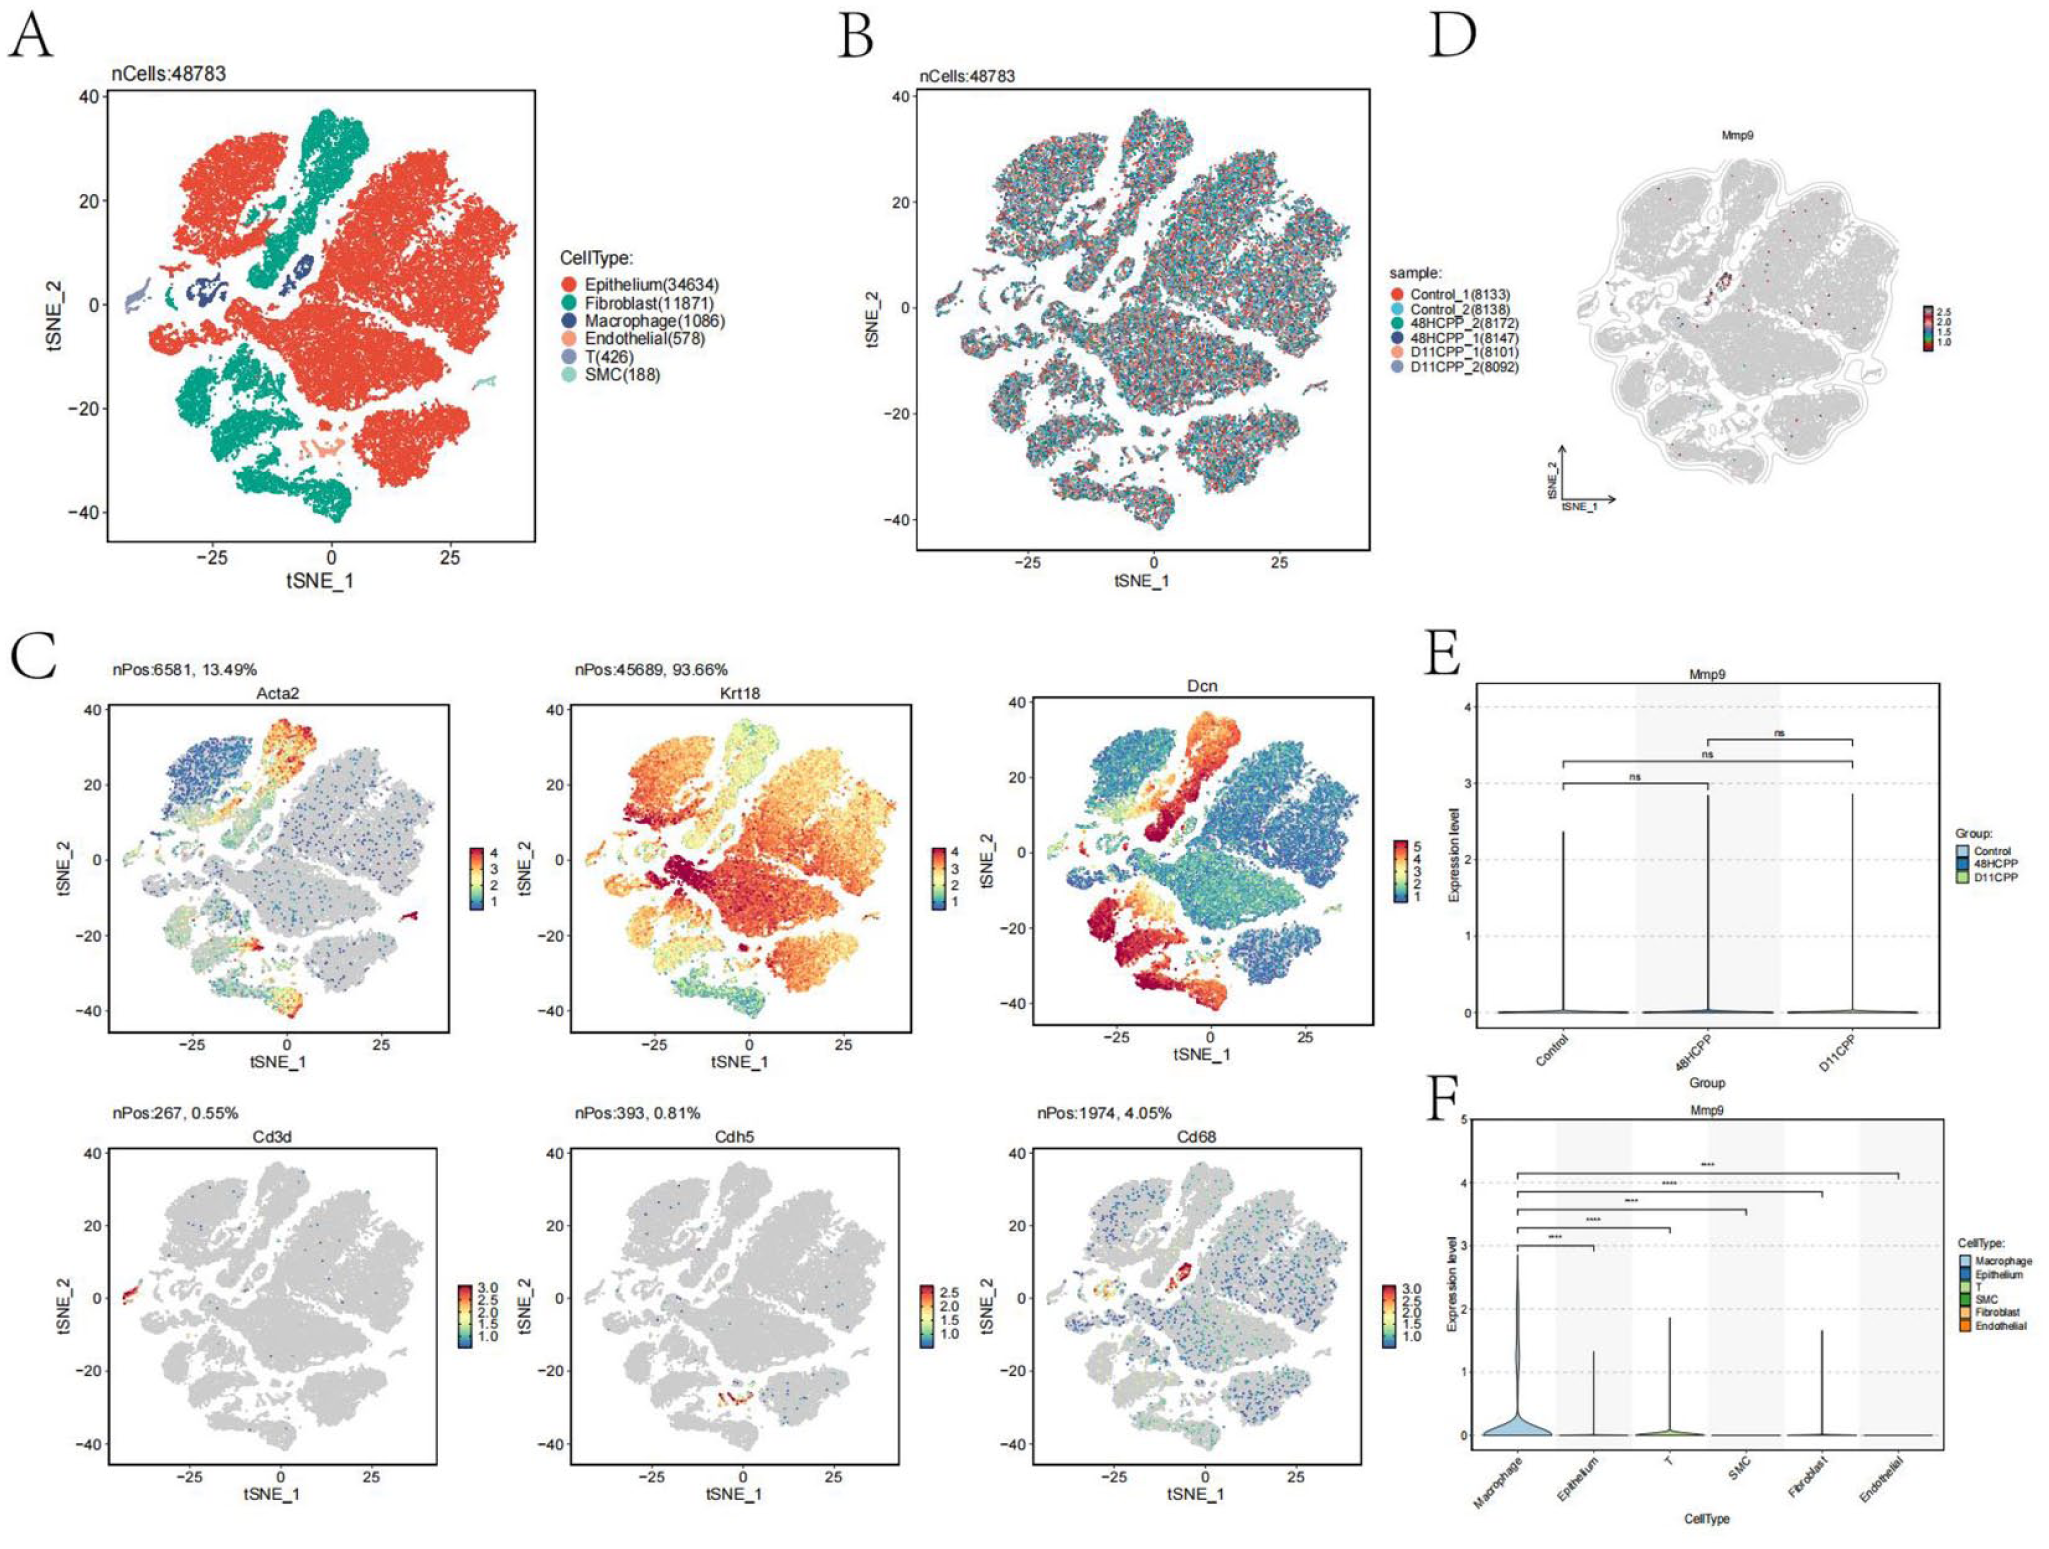
Single-cell sequencing to localize the MMP9 gene: (a) t-SNE plot of all cells grouped by cell cluster, (b) t-SNE plot of all cells grouped by sample name, (c) t-SNE plots showing the expression of marker genes for each cell cluster, (d) box plots showing differences in MMP9 expression between sample groups, (e) box plots showing differences in MMP9 expression between cell clusters and (f) Localization and expression analysis of MMP9 gene in cells.
Subsequently, we localized the expression of the MMP9 gene, with results shown in Figure 5(d) to (f). Notably, MMP9 was predominantly highly expressed in macrophages, with no significant differences between sample groups. This finding is consistent with our previous research.
Functional annotation of MMP9 in single-cell sequencing
Based on the expression levels of the MMP9 gene, all cells were divided into two groups: MMP9+ and MMP9−. Differential enrichment analysis was performed on these two groups, with results shown in Figure 6(a). Consistent with our findings in bulk RNA-seq data, MMP9 upregulates immune-related pathways in single-cell data, including leukocyte-mediated immune response, leukocyte migration, and activation of the immune response. Notably, in KEGG and WikiPathways, MMP9 was found to upregulate pathways related to macrophage phagocytosis, macrophage markers, and response to oxidative damage. The top 20 upregulated pathways in KEGG are shown in Figure 6(b) and (c). Interestingly, genes involved in phagocytosis were significantly associated with many pathways, such as lysosome and lipid and cholesterol-related pathways.
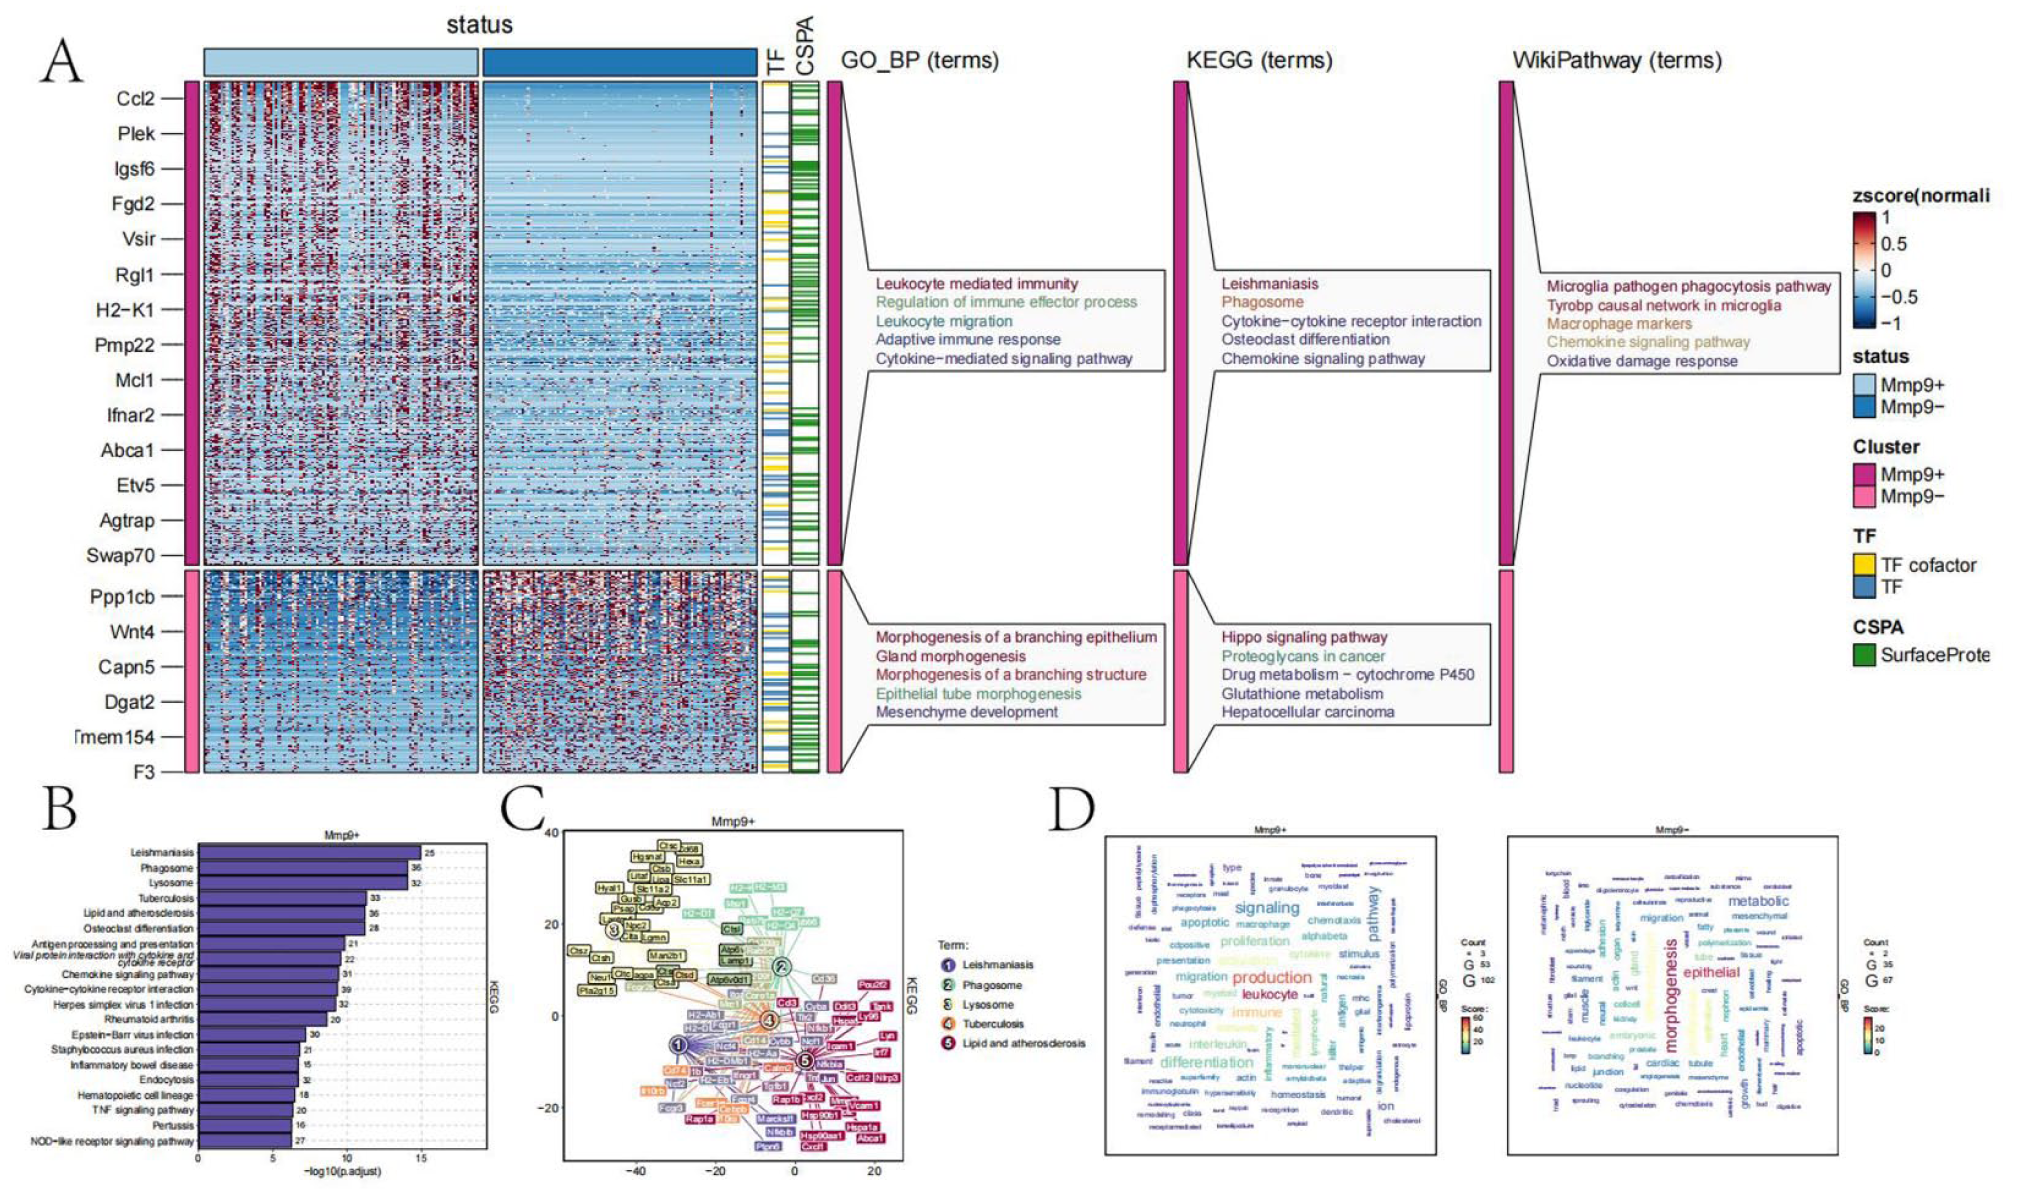
Functional enrichment of the MMP9 gene in single-cell sequencing: (a) heatmap showing differential enrichment analysis between MMP9+ and MMP9−cells, (b) bar chart showing KEGG pathway enrichment for MMP9+ cells, (c) network diagram showing interactions among genes in the top 5 KEGG pathways, and (d) bubble chart showing enriched GO pathways in MMP9+ and MMP9− cells, with bubble size representing the degree of enrichment.
The GO database enrichment results are shown in Figure 6(d), indicating that MMP9+ cells are associated with pathways related to macrophages, phagocytosis, apoptosis, and leukocytes. In contrast, MMP9− cells are associated with functions such as epithelial cells and morphogenesis.
Research on phagocytic functions regulated by MMP9
A set of phagocytosis-related genes (see Supplemental Table 2) was obtained, and differential gene expression analysis was performed based on MMP9 expression levels. The differential expression of phagocytosis-related genes is shown in Figure 7(a). The top 5 phagocytosis-related genes associated with MMP9 expression were identified as CLEC7A, CFP, FCN1, PTX3, and C4BPA. Figure 7(b) shows that MMP9 is significantly upregulated in the IC group.
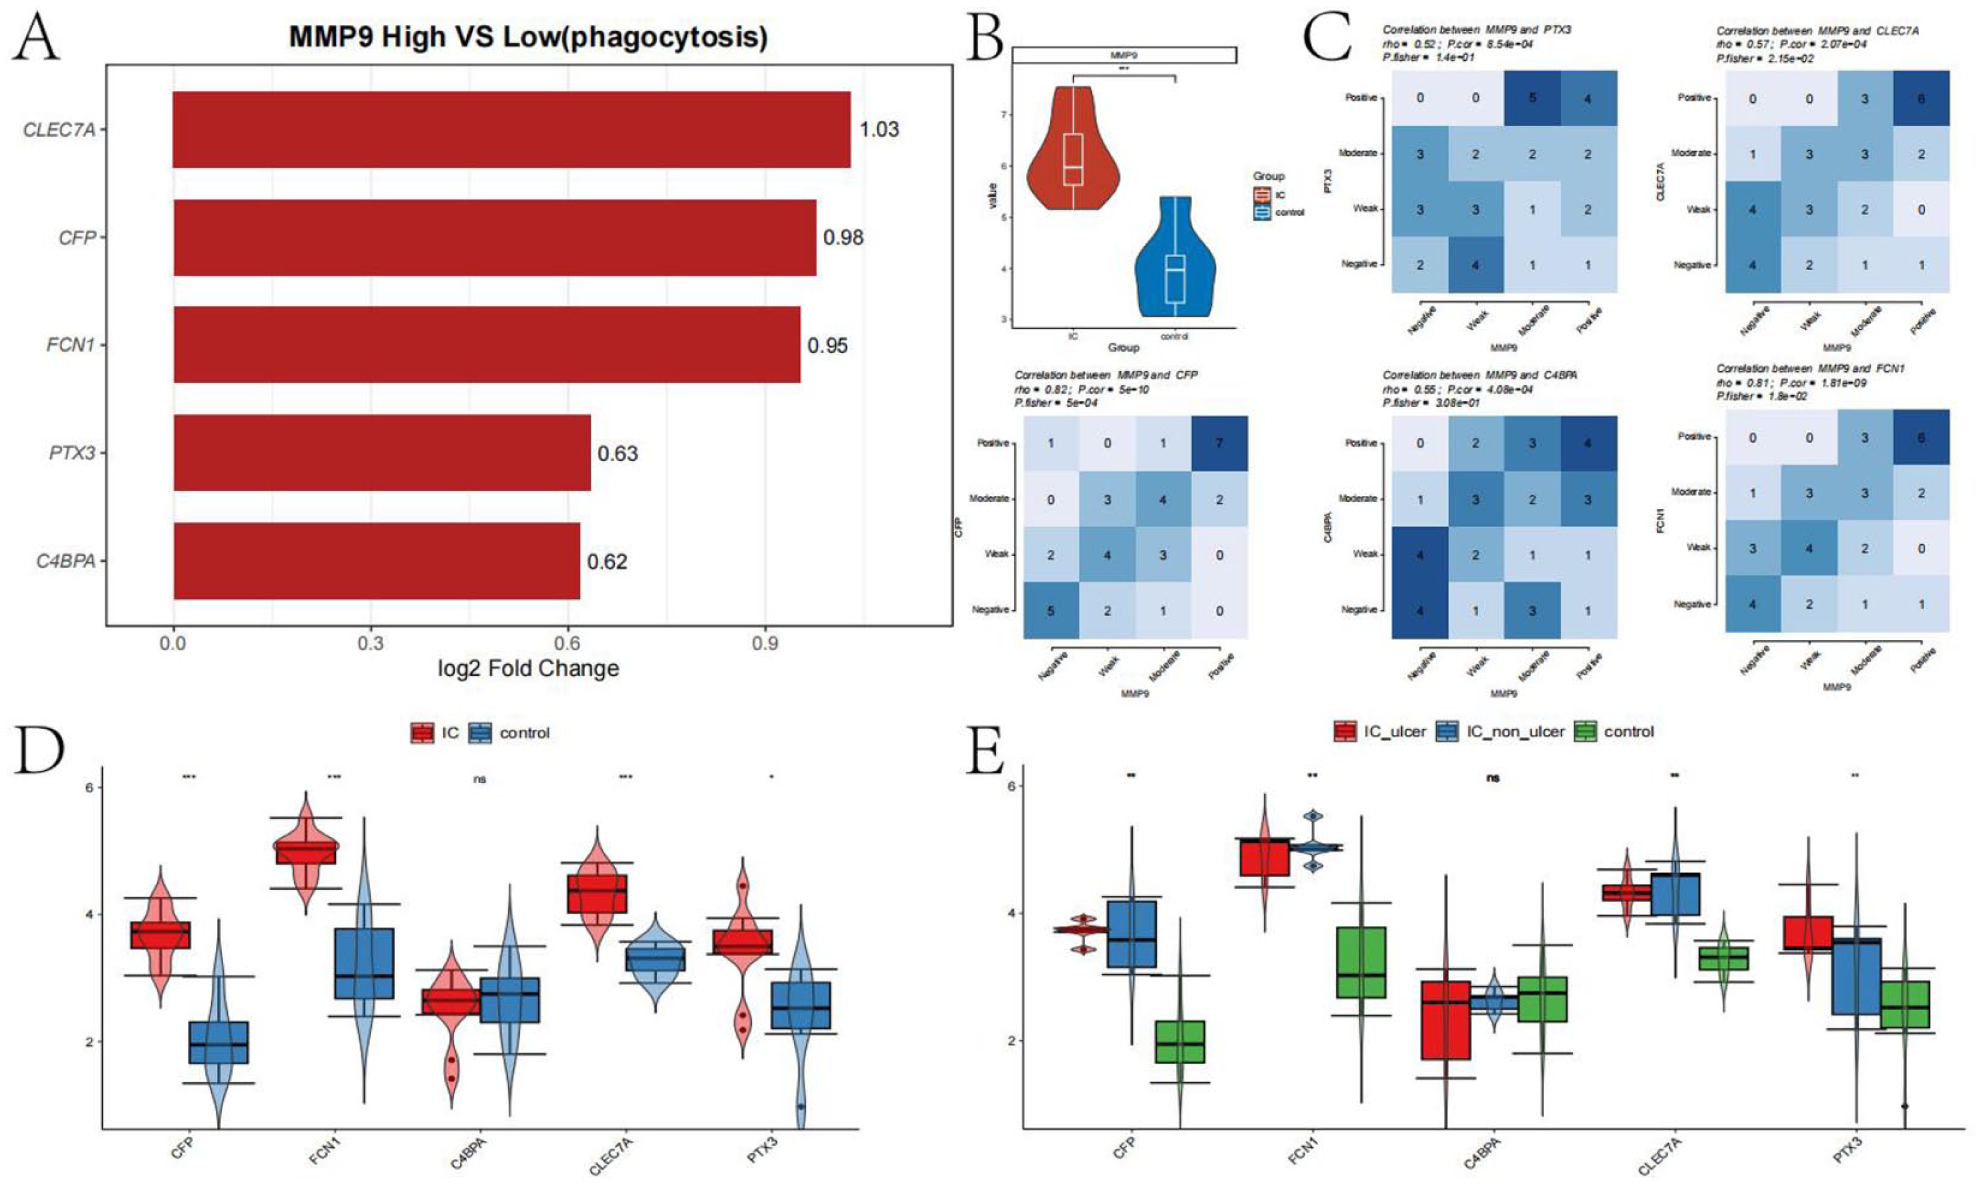
Analysis of phagocytosis-related functions regulated by MMP9: (a) bar chart showing differences in the top 5 phagocytosis-related genes between MMP9+ and MMP9− cells, (b) violin plot showing differences in MMP9 expression between IC and control groups, (c) co-expression analysis of the top 5 phagocytosis-related genes with MMP9 using chi-square tests, (d) box plots showing differences in gene expression between IC and control groups, and (e) box plots showing differences in gene expression between control, IC ulcer, and IC non-ulcer groups.
We assessed the correlation between MMP9 and the expression of these five genes using Fisher’s exact test, with a significance threshold of p.fisher < 0.05. The results indicated that CLEC7A, CFP, and FCN1 have significant co-expression relationships with MMP9. We further analyzed the expression differences of these five phagocytosis-related genes between the control and IC groups. The results shown in Figure 7(d) and (e) suggest that these genes are generally upregulated in the IC group, particularly in the IC_ulcer subgroup, where CLEC7A, CFP, FCN1, and PTX3 are significantly overexpressed. This suggests that MMP9 may enhance phagocytic functions in the IC group through a co-expression network involving these genes.
Screening of MMP9-targeting small-molecule drugs
We obtained the top 100 genes positively and negatively correlated with MMP9 from the CMap database and used them as inputs to identify potential molecular drugs targeting MMP9. The output file is provided in Supplemental Table 3. After screening, we identified four drugs with strong associations with MMP9: teriflunomide, captopril, minocycline, and ilomastat. The connectivity score (cs) indices of these drugs are shown in Figure 8(a).
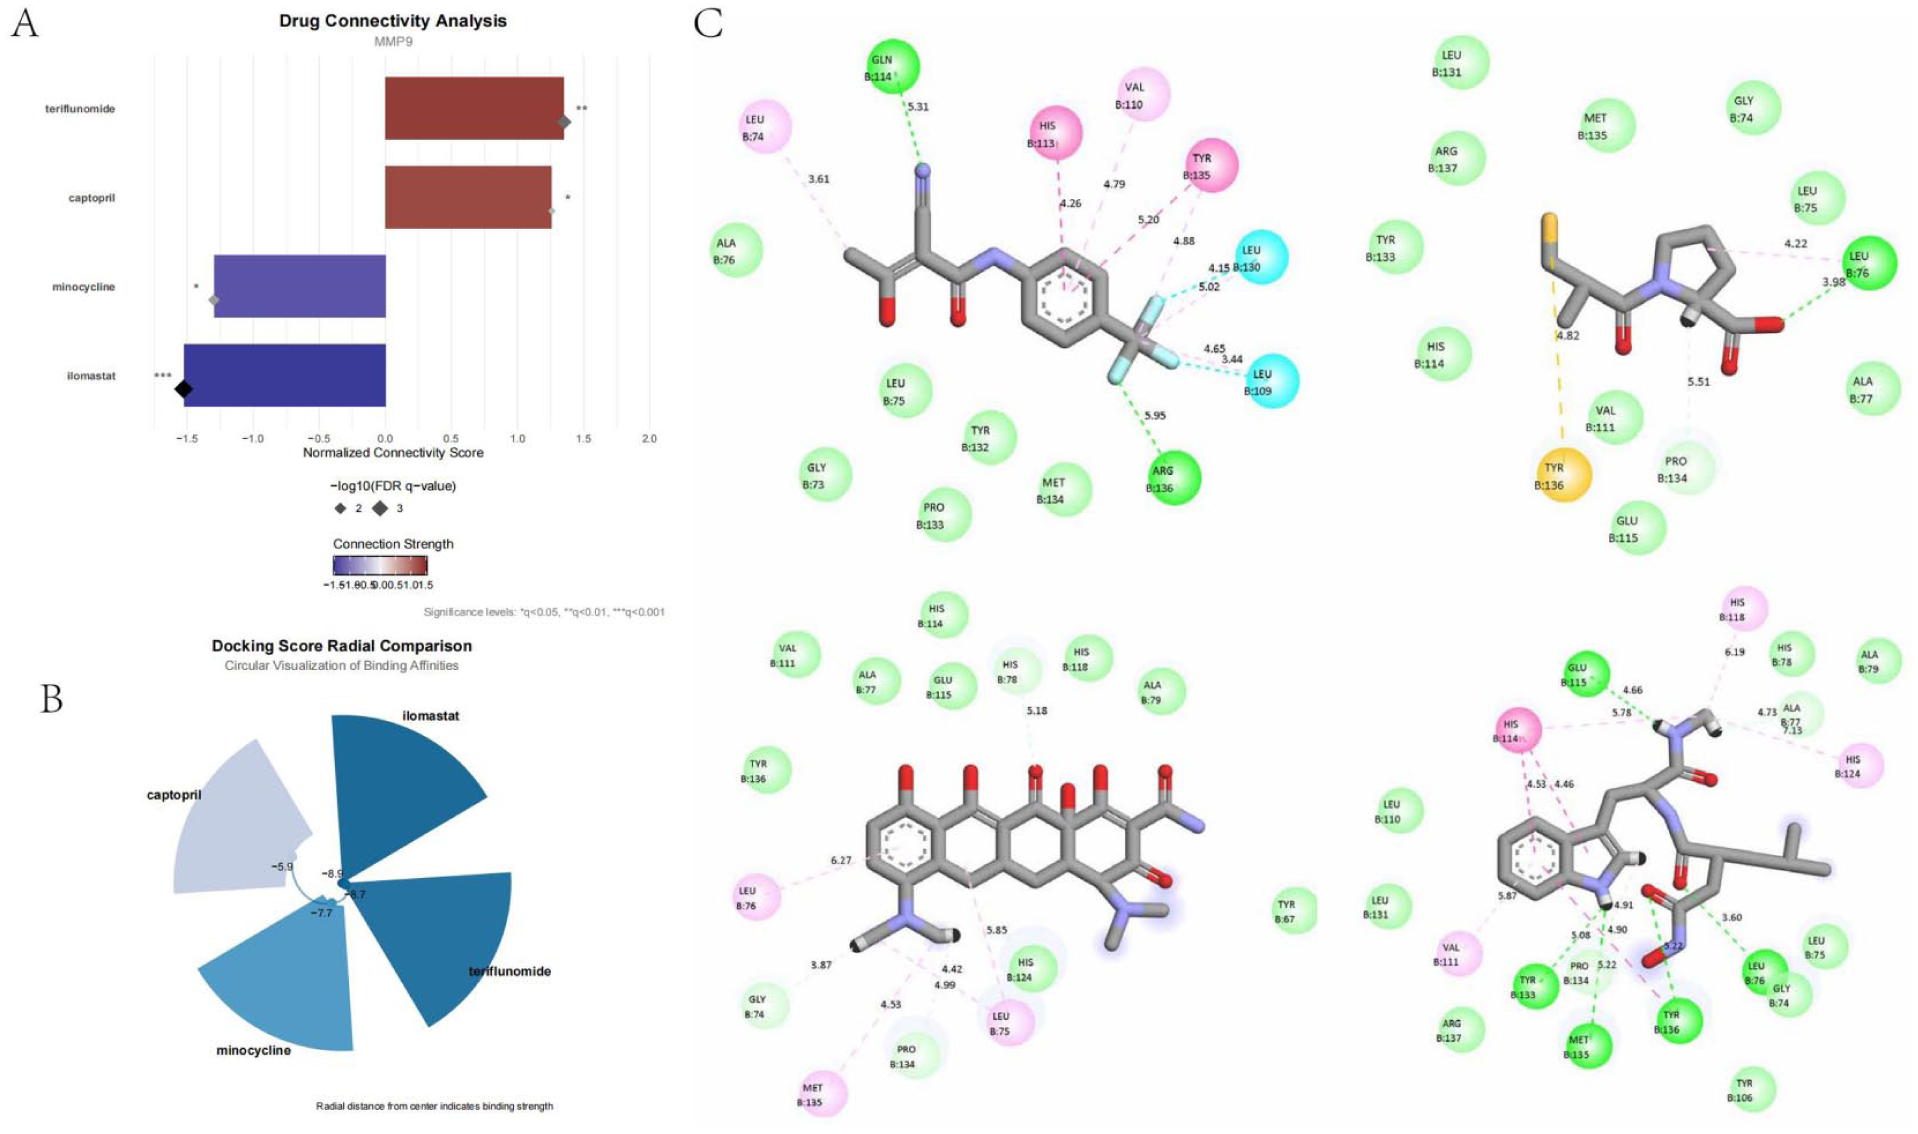
Identification of key drug molecules related to MMP9: (a) bar chart showing normalized cs scores and p.adjust values for four identified drugs targeting MMP9, based on differential gene expression analysis and CMap database screening, (b) radar chart showing binding affinities of the four drugs to MMP9 after molecular docking, and (c) 2D structural diagrams of molecular docking between drug molecules and the MMP9 protein.
The binding energies of these drugs with the MMP9 protein after molecular docking are listed in Supplemental Table 4. As shown in Figure 8(b), ilomastat exhibited the highest binding energy, followed by teriflunomide, minocycline, and captopril. The 2D interaction diagrams of these drugs with the MMP9 molecule are presented in Figure 8(c).
Functional analysis of MMP9-positive macrophages
To conserve computational memory, we selected 200 cells from each cell cluster for subsequent analysis. For cell types with fewer than 200 cells, we included all available cells. The t-SNE plot after dimensionality reduction and clustering of the cells is shown in Figure 9(a). After dividing macrophages into MMP9+ and MMP9− groups, a clear separation between the two groups was observed, suggesting that MMP9 may be an important marker for distinguishing macrophage subpopulations.
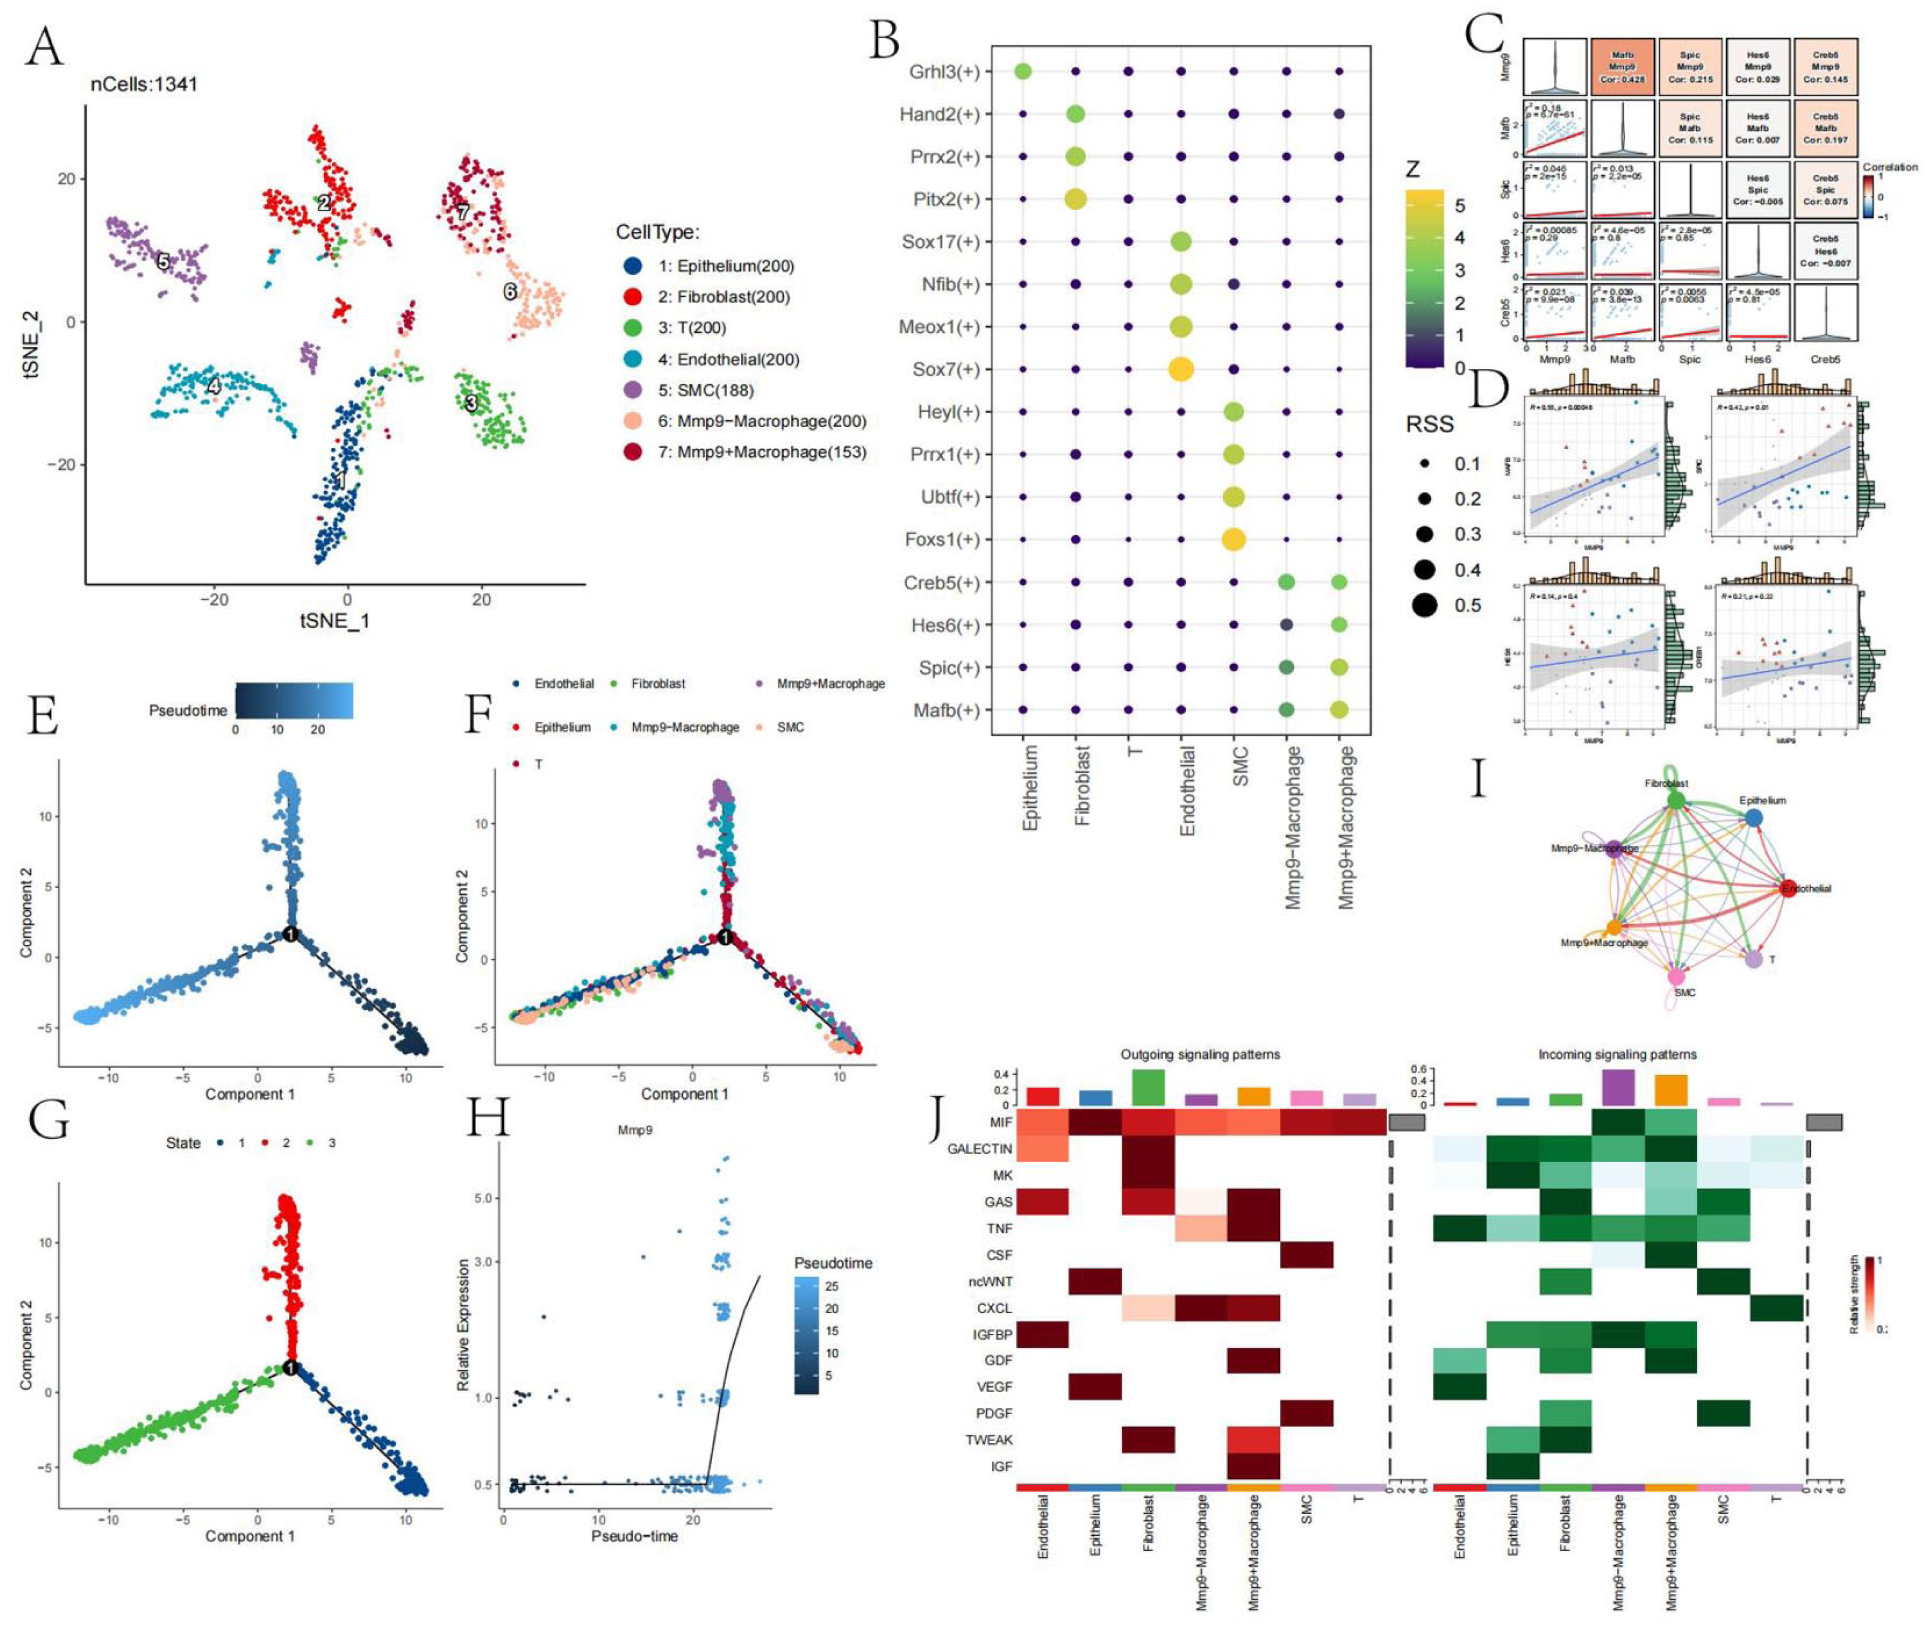
Functional analysis of MMP9+ macrophages: (a) t-SNE plot showing dimensionality reduction and clustering of 200 cells from each cell cluster, (b) bubble chart showing specific transcription factors identified by SCENIC analysis for each cell cluster, based on RSS scores, (c) correlation analysis between specific transcription factors of MMP9+ macrophages and MMP9 at the single-cell level, (d) scatter plots showing correlations between MMP9 and identified transcription factors at the bulk RNA-seq level, (e) trajectory analysis using Monocle software to show differentiation trajectories, (f) positions of different cell types along the trajectory, (g) trajectory node information, (h) changes in MMP9 expression along macrophage differentiation trajectories, (i) cell-cell interaction analysis using CellChat software, and (j) heatmap showing expression of pathways across different cell types.
PySCENIC analysis was performed to identify transcription factors specific to MMP9+ macrophages, with results shown in Figure 9(b). Mafb, Spic, Hes6, and Creb5 were found to have high RSS (Regulon Specificity Score) values. Co-expression analysis of these four transcription factors and MMP9 was conducted at both the single-cell and bulk RNA-seq levels (Figure 9(c) and (d)). Notably, MAFB and MMP9 exhibited a strong positive co-expression relationship, while the co-expression relationships of the other three genes were less significant, suggesting that MAFB may be a potential transcription factor for MMP9.
Monocle trajectory analysis was performed to investigate the differentiation trajectory of this macrophage population (Figure 9(e)–(h)). Notably, compared to MMP9− macrophages, MMP9+ macrophages were more often found at the terminal stage of differentiation. Additionally, MMP9 expression increased significantly with macrophage differentiation.
To examine cell-cell interactions between different cell populations, we used the CellChat software, with results shown in Figure 9(i) and (j). Overall, there were clear differences in cell communication between these two cell populations, particularly in the signaling pathways of IGF, GDF, and GAS for signal sending, and GDF and CSF for signal receiving. MMP9+ macrophages exhibited stronger signal-sending capabilities, while MMP9− macrophages had stronger signal-receiving capabilities, both of which are closely related to the function of the MMP9 gene.
Discussion
Interstitial cystitis/bladder pain syndrome (IC/BPS) is a complex urological disorder with an unknown etiology and a lack of specific therapeutic options, severely affecting patients’ quality of life. 33 This study systematically analyzed the immune microenvironmental characteristics of IC/BPS by integrating single-cell RNA sequencing (scRNA-seq), bulk RNA-seq, and multi-omics approaches. Through this analysis, we identified the key gene MMP9, which holds potential diagnostic and therapeutic value, thereby providing a theoretical foundation for the development of new immune-modulatory therapies.
MMP9 (matrix metalloproteinase 9) is highly expressed in various inflammatory diseases and plays a key role in promoting the infiltration and migration of inflammatory cells by degrading extracellular matrix components, such as collagen and basement membrane proteins. For example, in sepsis, overexpression of MMP9 leads to the degradation of the basement membrane, facilitating the recruitment of inflammatory cells and exacerbating the inflammatory response. Additionally, MMP9 can regulate the activity of inflammatory cytokines by cleaving inflammation-related proteins, further driving the inflammatory process.34,35
MMP9 also impacts the functions of immune cells such as macrophages and dendritic cells. For instance, MMP9-deficient dendritic cells exhibit anti-inflammatory properties, indicating that MMP9 plays a significant role in modulating immune cell functions. 36 In the tumor immune microenvironment, MMP9+ tumor-associated macrophages (TAMs) are associated with poor prognosis, underscoring MMP9′s crucial role in the differentiation and function of immune cell subsets. 37 Furthermore, studies have demonstrated that MMP9 is a key gene for the function of pro-inflammatory macrophages. 38
In IC/BPS, previous research has demonstrated that MMP9 is upregulated in the serum and urine of patients, with its systemic levels reflecting the local pathological conditions within the bladder. 39
In this study, scRNA-seq technology was utilized to investigate the dynamic heterogeneity of the immune microenvironment in the bladder tissues of IC/BPS patients. The findings revealed an imbalance in macrophages, dysregulation of T cell subsets, and spatial co-expression patterns of chemokines and receptors within the bladder tissues. These characteristics suggest that the complex interactions among immune cells play an important role in the progression of the disease.
Through differential gene expression analysis and machine learning models, we identified 19 key genes, with MMP9 emerging as the most promising target gene. It’s high expression in IC/BPS patients, coupled with significant co-expression with multiple immune-related genes, underscores its potential important role in disease progression. Functional annotation of both the transcriptome and single-cell analysis revealed that there is a positive correlation between MMP9 and immune-related pathways, such as leukocyte activation and the positive regulation of immune response, while showing a negative correlation with pathways associated with epithelial cell differentiation. Furthermore, MMP9 is closely linked to macrophage phagocytosis, enhancing the expression of phagocytosis-related genes (e.g. CLEC7A, CFP), further highlighting its potential involvement in immune regulation.
Single-cell analysis revealed that MMP9 is predominantly expressed in macrophages, and there are notable functional differences between MMP9+ and MMP9− macrophages. MMP9+ macrophages demonstrate enhanced phagocytic and signaling capabilities. These findings suggest that MMP9 may contribute to the inflammatory response in IC/BPS by modulating macrophage phagocytosis and facilitating intercellular communication. Based on the high expression of MMP9, we conducted an exploratory screen for potential drug molecules in the CMap database, 40 identifying teriflunomide, captopril, minocycline, and ilomastat as candidate compounds. While molecular docking indicated that ilomastat has the highest predicted binding affinity to MMP9, these computational findings are primarily hypothesis-generating. They highlight ilomastat as a putative targeted therapeutic agent that requires further experimental validation to establish its actual efficacy and safety in the context of IC/BPS.
Despite the significant progress made in elucidating the immune microenvironmental features of IC/BPS and identifying key genes, this study has several limitations. First, the limited sample size means that the generalizability of some of the findings requires further validation. Second, as this study is entirely based on in silico transcriptomic analyses, the identified relationships between MMP9 and immune signaling reflect statistical associations rather than confirmed causality. While our multi-scale integration provides robust evidence of these links, further functional experiments (e.g. gene knockdown or over-expression assays) are required to definitively establish the mechanistic role of MMP9 in IC/BPS. In addition, While the mouse DPP model effectively recapitulates acute and sub-acute bladder inflammation seen in IC/BPS, it may not fully capture the entire spectrum of chronic human pathophysiology.
Future research can further investigate the mechanisms of interaction between MMP9 and other immune cell subsets, as well as the dynamic changes of MMP9 across different disease stages. The purpose of these studies is to use multi-dimensional data mining to identify “highly relevant hub targets.” This provides an accurate theoretical basis and a prioritized candidate list for future in vivo and in vitro functional validation. In this study, we identified targeted drugs related to MMP9, which offer new directions for the treatment of IC/BPS. However, further experiments are required to validate their therapeutic efficacy in the context of IC/BPS.
Conclusion
Our investigation has revealed a significant imbalance between macrophage and T cell subsets in patients with Interstitial Cystitis/Bladder Pain Syndrome (IC/BPS). Additionally, we have identified MMP9 as a key biomarker in macrophages. Our findings demonstrate that elevated expression of MMP9 in macrophages is strongly associated with enhanced phagocytic activity and the activation of immune-related signaling pathways. This discovery offers new insights into the underlying pathophysiology of IC/BPS and may pave the way for the development of targeted therapeutic strategies.
Supplemental Material
sj-jpg-1-urj-10.1177_03915603261440236 – Supplemental material for MMP9 in macrophages: A pivotal biomarker associated with immune dysregulation in interstitial cystitis/bladder pain syndrome
Supplemental material, sj-jpg-1-urj-10.1177_03915603261440236 for MMP9 in macrophages: A pivotal biomarker associated with immune dysregulation in interstitial cystitis/bladder pain syndrome by Xingyou Dong, Zhen Guo, Xiaohui Chen, Shixue Liu, Chao He, Chun Chen and Jiang Zhao in Urologia Journal
Supplemental Material
sj-jpg-2-urj-10.1177_03915603261440236 – Supplemental material for MMP9 in macrophages: A pivotal biomarker associated with immune dysregulation in interstitial cystitis/bladder pain syndrome
Supplemental material, sj-jpg-2-urj-10.1177_03915603261440236 for MMP9 in macrophages: A pivotal biomarker associated with immune dysregulation in interstitial cystitis/bladder pain syndrome by Xingyou Dong, Zhen Guo, Xiaohui Chen, Shixue Liu, Chao He, Chun Chen and Jiang Zhao in Urologia Journal
Supplemental Material
sj-xlsx-1-urj-10.1177_03915603261440236 – Supplemental material for MMP9 in macrophages: A pivotal biomarker associated with immune dysregulation in interstitial cystitis/bladder pain syndrome
Supplemental material, sj-xlsx-1-urj-10.1177_03915603261440236 for MMP9 in macrophages: A pivotal biomarker associated with immune dysregulation in interstitial cystitis/bladder pain syndrome by Xingyou Dong, Zhen Guo, Xiaohui Chen, Shixue Liu, Chao He, Chun Chen and Jiang Zhao in Urologia Journal
Supplemental Material
sj-xlsx-2-urj-10.1177_03915603261440236 – Supplemental material for MMP9 in macrophages: A pivotal biomarker associated with immune dysregulation in interstitial cystitis/bladder pain syndrome
Supplemental material, sj-xlsx-2-urj-10.1177_03915603261440236 for MMP9 in macrophages: A pivotal biomarker associated with immune dysregulation in interstitial cystitis/bladder pain syndrome by Xingyou Dong, Zhen Guo, Xiaohui Chen, Shixue Liu, Chao He, Chun Chen and Jiang Zhao in Urologia Journal
Supplemental Material
sj-xlsx-3-urj-10.1177_03915603261440236 – Supplemental material for MMP9 in macrophages: A pivotal biomarker associated with immune dysregulation in interstitial cystitis/bladder pain syndrome
Supplemental material, sj-xlsx-3-urj-10.1177_03915603261440236 for MMP9 in macrophages: A pivotal biomarker associated with immune dysregulation in interstitial cystitis/bladder pain syndrome by Xingyou Dong, Zhen Guo, Xiaohui Chen, Shixue Liu, Chao He, Chun Chen and Jiang Zhao in Urologia Journal
Supplemental Material
sj-xlsx-4-urj-10.1177_03915603261440236 – Supplemental material for MMP9 in macrophages: A pivotal biomarker associated with immune dysregulation in interstitial cystitis/bladder pain syndrome
Supplemental material, sj-xlsx-4-urj-10.1177_03915603261440236 for MMP9 in macrophages: A pivotal biomarker associated with immune dysregulation in interstitial cystitis/bladder pain syndrome by Xingyou Dong, Zhen Guo, Xiaohui Chen, Shixue Liu, Chao He, Chun Chen and Jiang Zhao in Urologia Journal
Footnotes
Author contributions
JZ and ZG conceived and designed the study. JZ, ZG and XHC performed the analysis procedures. SXL, CH and CC analyzed the results; JZ and ZG contributed analysis tools. JZ, ZG, LLC and XYD contributed to the writing of the manuscript. All authors reviewed and edited the manuscript.
Funding
The authors disclosed receipt of the following financial support for the research, authorship, and/or publication of this article: This study was supported by the Chongqing Municipal Education Commission Science and Technology Research Program Project (KJQN202300134), Chongqing Shapingba District Science and Health Joint Project (2024SQKWLHMS020), the Chongqing Municipal Shapingba District Science and Health Joint Medical Research Key Project (2024SQKWLHZD005), the Chongqing Pharmaceutical Vocational Education Group Teaching and Research Project (C0ZJ202318) and the Chongqing Key Natural Science Foundation (CSTB2023NSCQ-ZDJ0013).
Declaration of conflicting interests
The authors declared no potential conflicts of interest with respect to the research, authorship, and/or publication of this article.
Data availability statement
Analyzes and visualizations of the scRNA-seq, RNA-seq and TCGA datasets from this study are available in the GEO database. Other data from this study are available from the corresponding author.*
Supplemental material
Supplemental material for this article is available online.
References
Supplementary Material
Please find the following supplemental material available below.
For Open Access articles published under a Creative Commons License, all supplemental material carries the same license as the article it is associated with.
For non-Open Access articles published, all supplemental material carries a non-exclusive license, and permission requests for re-use of supplemental material or any part of supplemental material shall be sent directly to the copyright owner as specified in the copyright notice associated with the article.