
Abstract
Government reports in India indicate that big farms are losing land in terms of absolute area as well as percentage of land. To understand the nature of accumulation I estimate the distribution of assets of cultivator households and distribution of land of operational landholdings, and examine how they change over time. It is found that the top fifteen percentiles of holdings have lost land share, the bottom fifty percentiles have gained land share. The share of assets of top fifteen percentiles cultivator households has gone up, the bottom fifty percentiles has also gained assets share. Distribution of land and assets of fifteen major states has been estimated. The paper discusses the possible causes and implications of these observations.
1. Introduction
In the classic Marxist literature as capitalism develops in agriculture it manifests itself in terms of centralization of land. While discussing small-scale peasant ownership farming Marx points out the reasons for the dissolution of small-scale farms in favor of large holdings (Marx 1894 [1976]). The reasons include usurpation of communal property by big landlords which makes the survival of small farms difficult, exhaustion of the fertility of soil, competition with large farms, burden of taxes, usury, and high price of land which discourages investment in farming. In short, an agrarian economy dominated by small holdings is not conducive for development of productive forces of labor, nor can it apply the discoveries of science and technology, and is therefore doomed.
Lenin (1899) and Kautsky (1899) concur on the positive correlation between the growth of capitalist relations of production and concentration of land, although they mention a few caveats. In the recent decades scholars have argued that the relation between capitalist development and landholding size may not be linear. Djurfeldt (1981, 1982) for instance contends that in Western Europe and the United States farms are mostly dependent on family labor, rather than hired labor, which normally happens in a capitalist farm. So, while the economy as a whole may be capitalist, the agricultural sector can still be dominated by family farms. According to him Marx’s analysis was based on the experience of mid-nineteenth century England (Raikes (1982) agrees with this position). By the end of the nineteenth century the industrial bourgeoisie in Western Europe were able to procure cheap food grain from the Americas and the Asian colonies due to extension of farming and improvement in transportation technology. The resultant fall in grain price rendered cultivation unprofitable in Europe, hence capital flowed out of agriculture. European agriculture was reclaimed by small scale family farms. These farms supplied their output to agro-industries where capital was more centralized. Thus capital indirectly controlled agricultural production through control over terms of trade, finance, product specification, etc. Djurfeldt further contends that in Third World countries the landed class may wield enough political power to ensure protection from global competition. This guarantees a high grain price. Wages are also low in these countries. The resulting high profit and rent may ensure a classical pattern of agrarian capitalism.
Djurfeldt’s thesis has not gone uncontested. It has been alleged that his claims are not based on detailed empirical research. Nelson (1983) has pointed out that the U.S. farms in the twentieth century have followed the classical path of increasing scale, higher investment, and rising importance of wage labor. This has been pointed by Raikes (1982) as well, who further mentions that in Europe too a tendency of higher concentration of capital has been noticed. Note in passing that although Djurfeldt’s analytical category of a capitalist farm may seem inadequate, his contention that investment of capital and land centralization are functions of changing objective conditions is unexceptionable.
Has Djurfeldt’s speculation on Third World agriculture come true? By many accounts it has not. Patnaik (2006) has noted the slowing down of growth of capitalist agriculture in India in recent decades. Relevant data published by the National Sample Survey Organization (NSSO) indicate a continuous subdivision of land holdings. The small farms, rather than big farms, are growing in number and are acquiring a larger portion of the cultivated land. From this it may seem prima facie that capitalist accumulation is weak. But, if big farms are not getting bigger through land acquisition it is still possible that an accumulation process is occuring. First, it may happen that big farms are investing more in capital. Second, it is possible that not-so-big but asset-rich farms are acquiring land. Since they are not yet in the top percentiles (in terms of land), such accumulation is not registered in terms of expansion of land of the top percentiles. In both cases it is likely that accumulation would register in distribution of assets (e.g. top percentiles will increase their share), although land share of the top percentiles would not rise. In this paper besides distribution of land, distribution of assets owned by cultivator households is examined in order to confirm the existence of accumulation. By estimating the cumulative percentage distribution of land area operated against the cumulative percentage of number of farms, that is, by estimating the Lorenz curve, we can ask if the top farms are gaining land share. Similarly we can estimate the Lorenz curve of distribution of assets against cultivator households, and ask if the most wealthy households have experienced a rise in assets share. Land and assets share at the lower end of the distribution are also examined.
Notice, the category of “operational landholdings” is used for estimating the distribution of land. “Operational landholdings” are not the same as “cultivator households,” the category which is used in estimating distribution of assets. But this does not pose any analytical difficulty. I examine how the distribution of land of operational holdings has changed over time. I do not claim there is a one-to-one correspondence of this distribution with the distribution of assets of cultivator households. I estimate the latter separately and its shift over time is also examined.
Briefly, my contention is as follows. From 1991-92 to 2002-03 the top 15 percent of operational holdings have lost share of land, but the top 15 percent of cultivator households have gained in terms of share of assets ownership. At the other end of the spectrum, petty holdings (the bottom 50 percent of holdings) have increased land share. The bottom 50 percent of households have marginally gained assets share. There are inter-state variations, which require further research. There are only five states where the top 15 percent in either distribution has gained land and assets shares. These are states with high per capital income: Gujarat, Haryana, Karnataka, Punjab, Tamil Nadu. Out of these Gujarat, Haryana, and Punjab are the only three states where the bottom 50 percent in each distribution has lost land and assets shares.
Loss of land share of the top 15 percent was not unexpected given the previously cited evidence on land subdivision. Does the rising assets share of top cultivators indicate that they are experiencing accumulation through intensive cultivation? The overall low investment in the agricultural sector testifies against such a possibility. Also note that the rise in assets share is by a mere 1.3 percentage point. The above facts portray a slowly growing agricultural sector. Little investment is done by the large farms, which has raised their assets share. The petty farmers are pauperized; but their land share is increasing, and the assets share has marginally improved. A polarization process is absent, although it may be at work in a few states.
In sum, the Djurfeldt conjecture on peripheral agriculture is not strongly supported by the Indian evidence; Indian agriculture is not traversing the classic capitalist development path. The article ends with a discussion on the reasons for the non-dissolution of petty peasants, and its implications.
The rest of the paper is organized as follows. Section II discusses in detail the trends in Indian farming. In section III I introduce the data and method of analysis. Section IV contains results and discussion. The paper concludes with section V, which contains conclusions and caveats.
2. Indian Agriculture and Capitalist Development
Various NSSO reports underscore a steady subdivision of farm landholdings. Petty holdings are claiming increasing share of the total number of holdings. For instance, marginal farms (holdings with less than 1 hectare of land) were nearly 70 percent of all holdings in 2002-03, whereas in 1991-92 they were 63 percent (Government of India 2006a 1 ). Small farms (holdings with 1 to 2 hectares of land) and marginal farms together constituted about 86 percent of all “operational land holdings” in 2002-03. This is a nearly 6 percentage point increase in a decade. At the other end of the spectrum, the big farms are getting less numerous. Large farms (greater than 10 hectares) went down from 1.3 percent to 0.8 percent numerically during the same period.
Petty farms are not only growing in number, they have increased land share. Marginal and small farms together accounted for 34 percent of land in 1991-92 and 43.5 percent in 2002-03. One also discerns a high inequality in land distribution. The combined land share of marginal and small farms was less than 44 percent, whereas they accounted for 86 percent of all holdings. Large farms with less than 1 percent of holdings commanded 12 percent of land.
As mentioned earlier, subdivision of holdings has implication for development of capitalist relations of production. Capitalism, when it develops spontaneously, has a tendency of centralizing land. 2 The reason is outlined below.
Surplus value is produced with the help of human labor. This is converted into productive capital through investment. In the industrial sector, accumulation of capital can progress without necessarily dispossessing others of their capital. As forces of capitalism gather momentum in agriculture, accumulation of capital is accompanied by accumulation of land, which is necessary to complement capital in production. Land, however, cannot be produced by human industry; thus depriving other peasants of their holdings accompanies development of capitalism in agriculture. A process of polarization or peasant differentiation starts which creates a class of landlords (who lease out land to capitalist farmers, or themselves assume the role of capitalist farmers) on one end and the landless agrarian proletariat on the other. 3 Notice however that the process of capitalist development operates if conditions for it are satisfied. Profitability of investment is an important condition in this context.
A few factors may enable the capitalist farmer to grow without taking away land from other farmers, such as improvement of technology, or higher application of inputs on the same piece of land. These factors may delay the land centralization process. But it is difficult to conceive that development of technology, and its use, will keep pace with the urge of the capitalist to accumulate. Diminishing productivity of additional units of inputs would render the second recourse of higher application of inputs unprofitable beyond a point. In sum, beyond a point, growth of capitalist farms is, in general, associated with centralization of land. 4
From the data that big farms are not growing one may infer that development of capitalist relations of production is stifled. But it would be incorrect to identify big farms with capitalist farms. What makes a capitalist farm a capitalist farm is not its size, but how it is organized, how it functions over periods of time. An important feature of capitalist production relations is investment. 5 The data from the last few decades indicate a certain slackening of agricultural investment. The fall was possibly precipitated by a decline of public investment. It is well recognized that public investment “crowds in” private investment in agriculture by raising its profitability. 6 With neoliberal economic policies increasingly occupying the center stage from the 1980s, public investment nosedived. Private investment fell initially, recovering later. But the overall growth of investment has been low in the last couple of decades (refer to Table 1).
Annual rate of growth of capital formation in Indian agriculture (at 1980-81 prices).
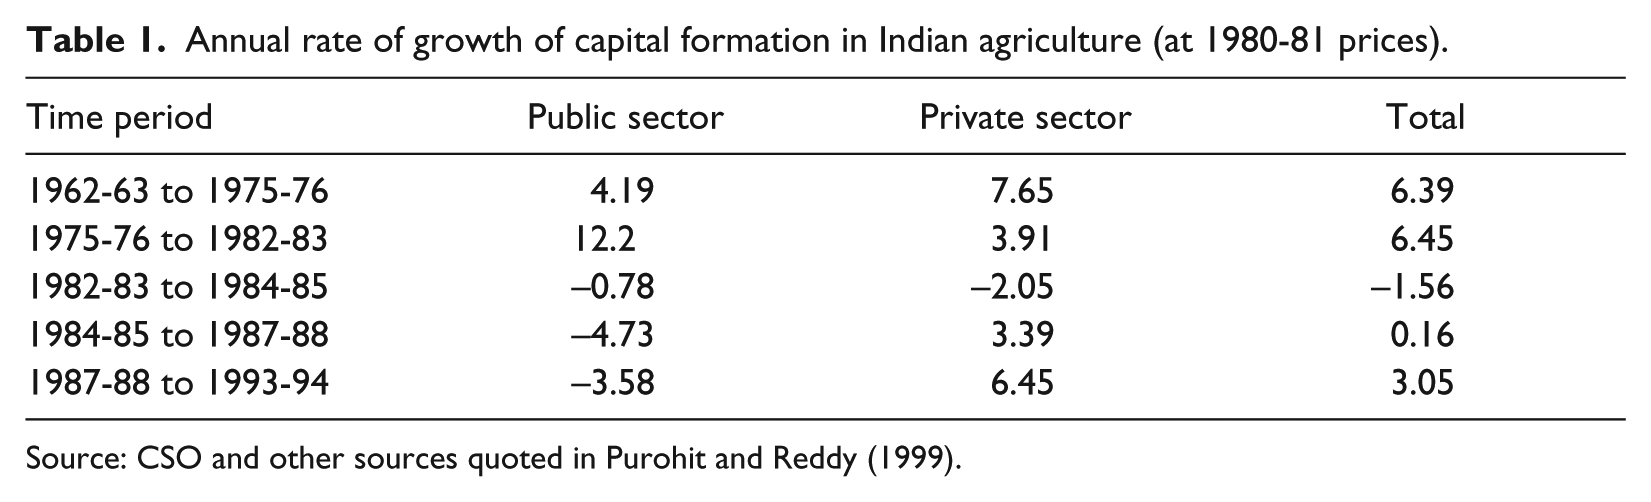
Source: CSO and other sources quoted in Purohit and Reddy (1999).
This had the following manifestations. First, public investment as a percentage of aggregate investment in agriculture declined. Second, capital formation in agriculture as a whole slowed down. As a result agricultural investment as a percentage of aggregate investment in the economy has fallen. The values are plotted in Figure 1 (data range: 1960-61 to 2001-02 at 1993-94 prices, 2004-05 to 2008-09 at 2004-05 prices). The first parameter is represented by the dark line on the top. From close to 50 percent the share of public investment in agricultural investment has come down to less than 20 percent. The line at the bottom represents percentage of GCF in agriculture and allied sector to the total GCF. This also has seen a long-run decline although the steepness is less.
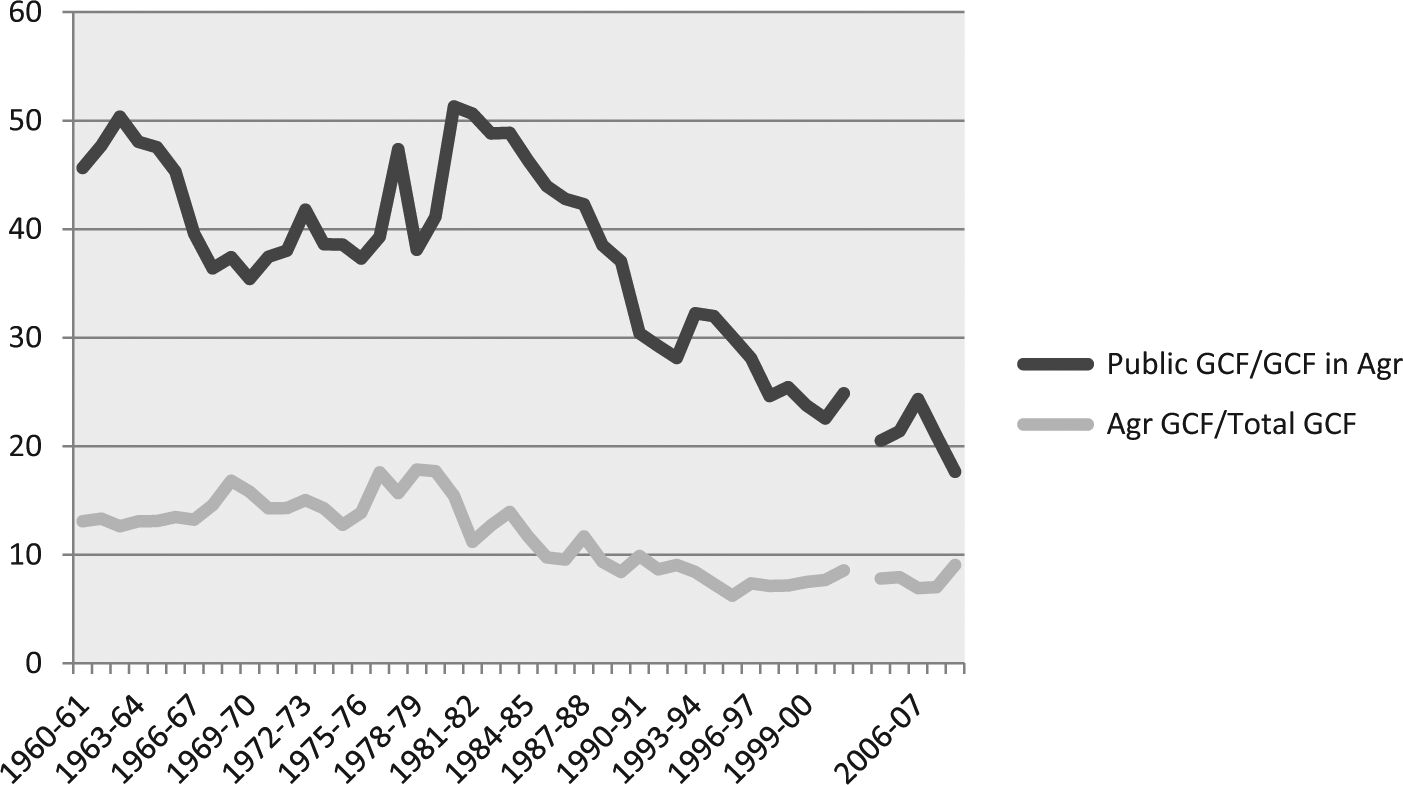
Trends of (i) percent of public sector investment in agricultural sector to total investment in agricultural sector and (ii) percent of total investment in agricultural sector to total investment in the economy (years: 1960-61 to 2008-09). Source: Central Statistics Office reports (the break in the lines is due to change in the base year from 1993-94 to 2004-05).
Therefore low investment and subdivision of landholdings indicate that the pace of capitalist development has been slow in recent times. In fact, these two factors are not unrelated. Small size of the land holding limits the generation of economic surplus. In marginal farm households net investment expenditure as a percentage of consumption expenditure ranged from merely 1.5 percent to 4 percent (Government of India 2005). With high income from land, the big farms are in a position to reinvest. But they are shrinking. A low degree of accumulation, reflected in the decline of big farms, has led to slackening of class differentiation within the peasantry. 7
In this paper I aim to examine the trends in land holding size and assets ownership. The NSSO reports indicate that big farms are losing land. But the NSSO defines big farms in absolute terms: operational landholdings with more than 10 hectares of land, for instance. This makes it difficult to estimate the land owned by the different sections of the distribution. So the first task is to estimate the distribution of land and assets vis-à-vis the number of holdings and households. I construct two Lorenz curves, one for assets ownership, the other for land operated, and then examine how the distributions change over time. A process of polarization would manifest itself in terms of rising land and assets shares of the top percentiles and a decline of the bottom.
3. Data and Method
From the NSSO reports one gets data of land operated by different categories of holdings. These categories are defined according to the size of holding, for instance holdings can belong to the category 0 to 0.2 hectares, 0.2 to 0.5 hectares, etc. From the data of total land operated by each category the percentage of land operated by each category to the aggregate land under cultivation can be calculated. For instance, holdings belonging to the category 0.2 to 0.5 hectares may be cultivating 2.39 percent of the total land. From the percentage distribution of land one can calculate the cumulative percentage distribution (less-than type). The number of holdings in each category is also given. Like the cumulative percentage distribution of land, one can construct the cumulative percentage distribution of number of holdings. Since these two distributions are intertwined the following cumulative distribution function can be estimated.
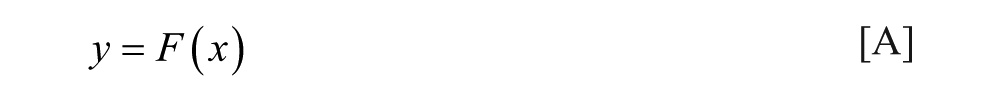
Here x is any arbitrary number between 0 and 100 representing the cumulative percentage of number of holdings. The corresponding value of y read from [A] is the cumulative percentage of land operated by the bottom x percent of operational landholdings.
Data on value of assets owned by cultivator households and the number of households can also be obtained. Assets include value of land, but it also includes value of farm buildings, implements, machines, livestock, poultry, transport equipments, etc. Data on liabilities (cash loans) are also available. I subtract value of loans from assets, calculate the cumulative percentage distribution of (net) assets, and relate it to the cumulative percentage of number of households. Thus we have a function of the following form:
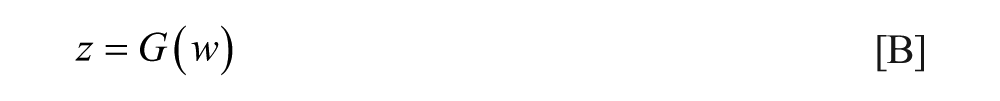
Like in [A], corresponding to any value of w, z = G(w) gives the cumulative percentage of assets owned by the bottom w percent of cultivator households.
In this paper I have taken two arbitrary values of x and w: 50 and 85. The corresponding values of y and z from [A] and [B] respectively give the percentage of land and assets operated by the bottom 50 percent and 85 percent of holdings and households. How these numbers vary across time has been examined.
Two different points of time have been taken for comparison: 1991-92 and 2002-03. This had been a crucial phase in the Indian economy. From 1991 a liberalization-structural adjustment program started finding prominent space in government policies after the Indian National Congress-led central government announced a new set of economic policies. Developments in these eleven years are likely to be symptomatic of the effects such policies had on the agricultural sector.
Data from various rounds of the NSSO have been used in my study. For instance for the year 2002-03 functions [A] and [B] have been estimated by using Table 1R of NSSO Report No. 492, “Some Aspects of Operational Land Holdings in India,” and Table 10, Report No. 500 “Household Assets and Liabilities in India.” 8 For the year 1991-92 the data sources are Table 1R, Report No. 407, “Land and Livestock Holdings Survey, NSS forty-eighth round, January-December 1992, Report 2: Operational Land Holdings in India”; Table 8R Report No. 419, “Debt and Investment Survey, NSS forty-eighth round, Household Assets and Liabilities, as on 30.6.1991.”
4. Results and Discussion
The method described above has been applied to the all-India data. The results are given in Table 2. The bottom 50 percent holdings have increased their share of land from 4.2 percent to 5.6 percent. The bottom 85 percent has raised land share from 42 percent to 43.4 percent. Thus the top 15 percent has registered a decline in land share. The middle holdings, between 50 percent to 85 percent, have maintained a roughly constant share, since the bottom 50 percent and 85 percent land shares have gone up by the same percentage points. Note that during the same period total operated area declined from 125 million hectares to 108 million hectares, by roughly 13.6 percent. Thus all sections have lost land in absolute terms.
Land operated and assets ownership of different percentiles of operational holdings and cultivator households, figures in percentage, author’s estimation.
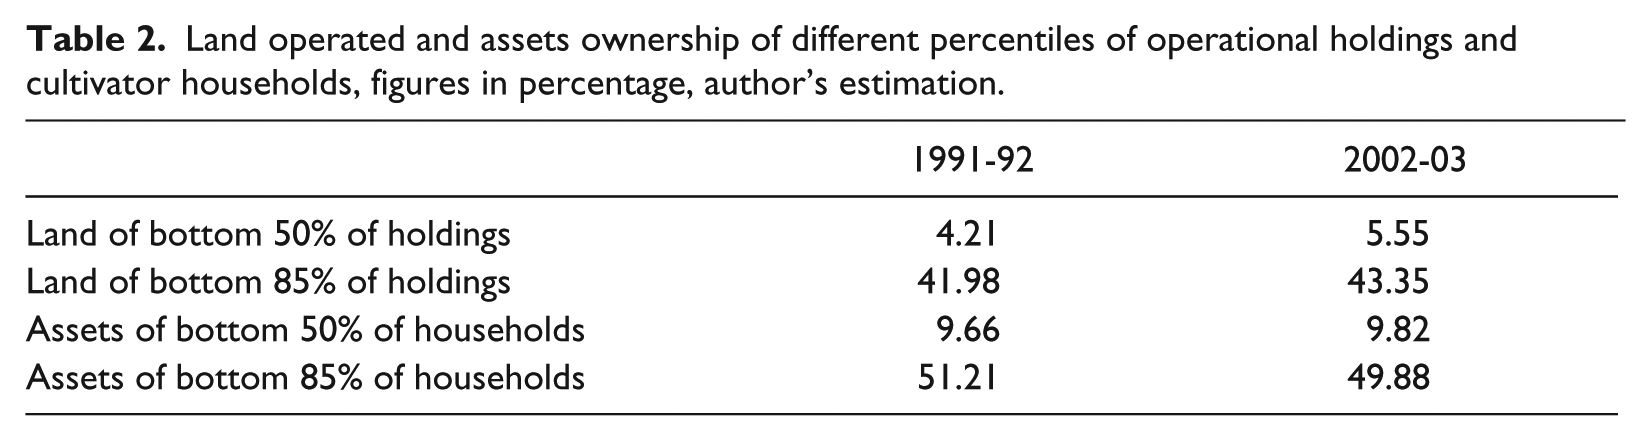
In terms of assets ownership, the bottom 50 percent has marginally raised its share from 9.7 percent to 9.8 percent. But the bottom 85 percent households have lost shares (51.2 percent to 49.9 percent).The top 15 percent has thus raised its assets share. As land is the biggest component of assets (about 70 percent), it is not surprising that the land and assets shares are close.
Table 2 underscores the high degree of inequality of distribution of assets and land. The top 15 percent of households own about 50 percent of assets (the bottom half has 10 percent). The top 15 percent holdings operate 57 percent of land (the bottom half has a little less than 6 percent of land). It not surprising that the distribution of land is more skewed than assets as the market of the former is known to be relatively inactive. The opposite movements of land and assets shares of the top 15 percent in two distributions is worth probing, as also the movement in the same direction of the bottom 50 percent. But first a brief discussion on the individual states is in order. States of India display an enormous variety in terms of land subdivision, growth of output, and investment. How their assets and land shares have changed can be helpful in understanding the numbers of Table 2.
Fifteen major Indian states have been selected for this purpose: Andhra Pradesh, Assam, Bihar-Jharkhand, Gujarat, Haryana, Karnataka, Kerala, Madhya Pradesh-Chhattisgarh, Maharashtra, Orissa, Punjab, Rajasthan, Tamil Nadu, Uttar Pradesh-Uttarakhand, West Bengal. In 2000 Bihar, Madhya Pradesh, and Uttar Pradesh were bifurcated to create new states: Jharkhand, Chhattisgarh, and Uttarakhand, respectively. I have analyzed the data of the erstwhile unified states for the year 1991-92. For the year 2002-03 data of the bifurcated states have been separately processed. 9
The first observation is regarding assets. In 10 (out of 15) states assets share of the bottom 50 percent has increased. In 9 states the top 15 percent has increased its share. The states where the bottom 50 percent have lost share are Gujarat, Haryana, Maharashtra, Orissa, Punjab. Except for Orissa the other four are regarded as states with high and robustly growing per capita income. Punjab and Haryana have been the cradle of the Green Revolution in India. In these two states not only has the assets share of the bottom 50 percent declined, the decline is the highest among all states (about 8 percentage points). In states with low per capita income such as Assam, Bihar, Madhya Pradesh, and Uttar Pradesh the bottom 50 percent have increased assets share.
Let us now turn to land share. In 8 states the big holdings (top 15 percent) have lost land share: Andhra Pradesh, Assam, Bihar, Kerala, Maharashtra, Orissa, Uttar Pradesh, West Bengal. Barring Andhra Pradesh, Kerala, and Maharashtra these states are considered relatively low income states, with a large excess labor pool which seasonally migrates to other states. On the other hand the states where big holdings have gained land share include Gujarat, Haryana, Karnataka, Madhya Pradesh, Punjab, Rajasthan, and Tamil Nadu. Gujarat, Haryana, Karnataka, Punjab, and Tamil Nadu are considered high growth, high income states (economic growth of Punjab has dipped of late, but due to decades of high growth its per capita income remains one of the highest). Among these, in Gujarat the agricultural economy has been performing commendably in recent decades (Bhalla and Singh 2009).
For the bottom 50 percent of holdings, again a high degree of variation is noticed. In general states with a high proportion of tribal population and forested area have a relatively high share of land operated by the bottom 50 percent. Compared to the all-India average of 5.5 percent, Assam, Jharkhand, Chhattisgarh, Orissa, and Uttarakhand have figures ranging from 10 percent to 16 percent. The share has risen in Assam and Orissa (the other three are new states, hence no comparison is made for them). But there are other states also where the share has risen. They include Andhra Pradesh, Maharashtra, Uttar Pradesh; these are some of the largest states of the country in terms of area and population. In most of the high income states such as Punjab, Haryana, Gujarat, Tamil Nadu, Karnataka, and Kerala petty holdings have lost land share.
Taking land and assets together, there are five states where land and assets share of the top 15 percent in each distribution has gone up: Gujarat, Haryana, Karnataka, Punjab, Tamil Nadu. Out of these five in Gujarat, Haryana, and Punjab the bottom 50 percent have lost both assets and land shares. These three states appear to present a case where a polarization in the classic Marxist fashion is strong.
The larger picture is of declining land and increasing assets share of big farms and rich households respectively, and increasing land and assets share of the marginal ones. One way this can be interpreted is, although big farmers are losing land, rich cultivators are adopting more intensive cultivation. 10 Agrarian accumulation may be on, although it is not registered in terms of rise of land share at the top end. Does the evidence support this? A manifestation of intensive cultivation would be a high rate of investment. But agricultural investment has slowed down as has been discussed. Since the early nineties output and yield growth has also slowed down. Both have almost halved compared to the previous decade. Growth rates in the use of farm implements, fertilizers, proportion of area under irrigation, and cropping intensity have fallen (Bhalla and Singh 2009). Also note that the rise in assets share for the top 15 percent is low at a mere 1.3 percentage points.
Therefore the hypothesis that growth of capitalist farming has been robust because of intensive cultivation cannot be sustained. Rise in assets share of rich cultivators does not reflect an overall dynamic agriculture. It shows that farming as a whole is in an asset-poor condition, where richer cultivators are doing relatively better than the rest. The observation that land share of petty farms is rising is important in this connection for the following reason.
One route through which macroeconomic factors influence land subdivision is unemployment. If there is little scope of employment petty farmers desperately cling on to their meager land plots. This makes land centralization difficult and land remains subdivided. In recent decades because of declining profitability in farming, capitalist accumulation has been low (Patnaik 2006). With low investment few jobs are generated in the agricultural sector. The organized sector outside the agricultural sector has experienced tardy growth of employment in the last two decades. Public sector employment has shrunk in absolute terms. This is possibly because growth of public sector investment has fallen after the late 1980s (Purohit and Reddy 1999). The private sector has expanded. But the overall growth of organized employment has been much lower, close to zero, as shown in Table 3. Declining output elasticity of employment has also contributed to the slow generation of employment. Papola and Sahu (2012) have estimated that the overall elasticity has declined from 0.56 to 0.20 from the period (1977-1978 to 1983) to (1999-2000 to 2009-2010).
Annual growth rate of employment in organized sector.
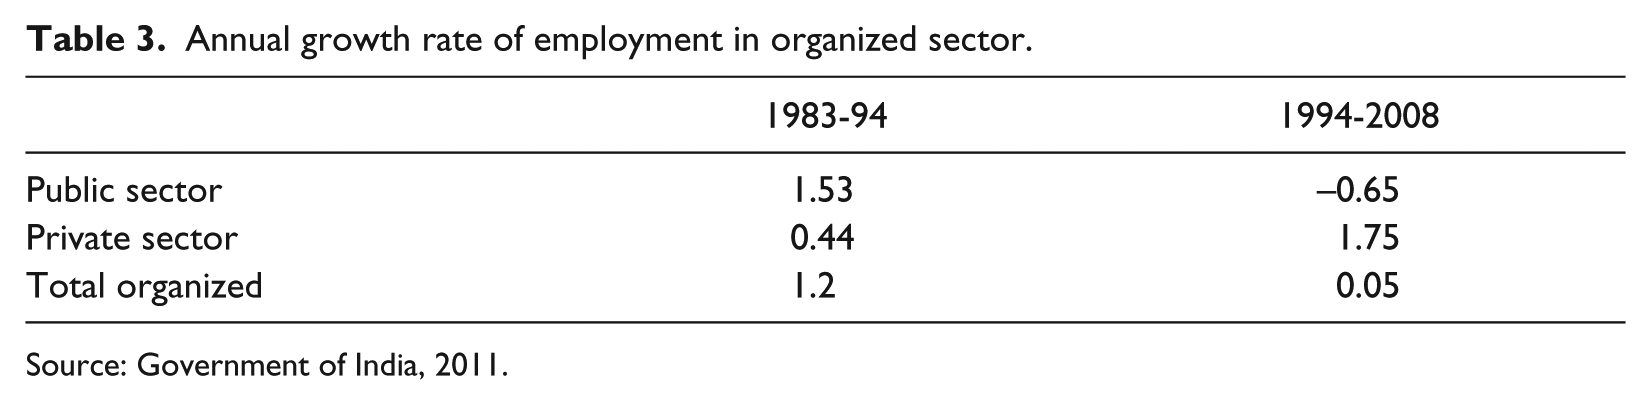
Source: Government of India, 2011.
With jobless growth dominating the organized sector, it is the unorganized/informal part of the economy that the rural population have flocked to, expanding its output and employment. 11 Table 4 compares GVA (gross value added) per worker between formal and informal sectors over 1989-90 to 2000-01. Table 5 provides the data of share of unorganized manufacturing sector employment to the total employment for select states.
Informal and formal sector real gross value added per worker (in rupees).
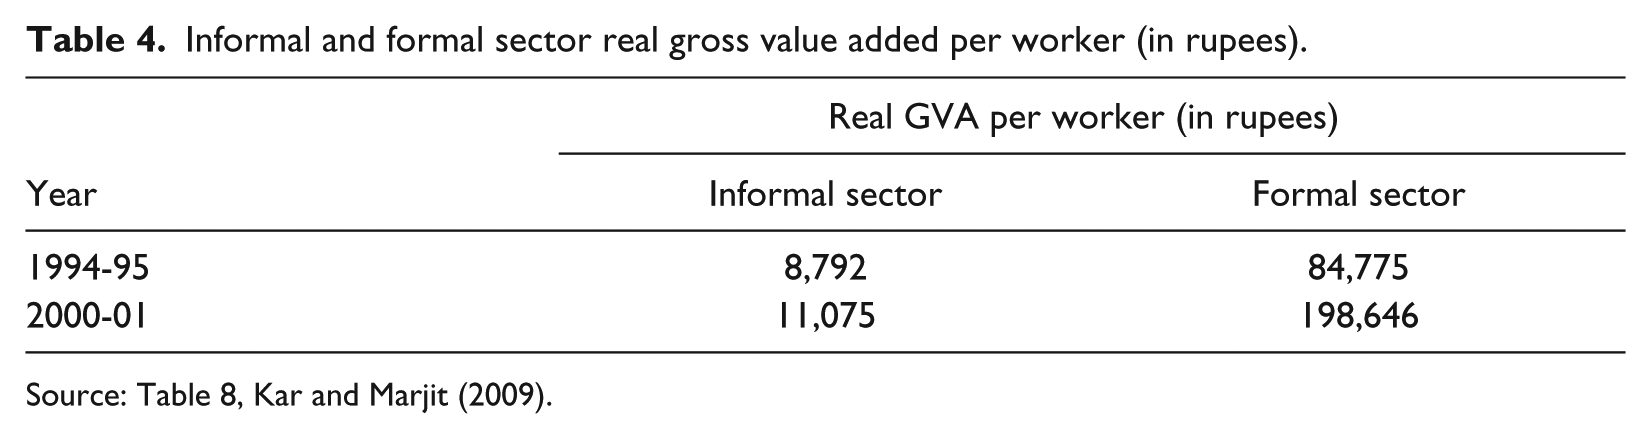
Source: Table 8, Kar and Marjit (2009).
Share of workers in unorganized manufacturing sector to total employment in manufacturing sector in different states, figures in percent.
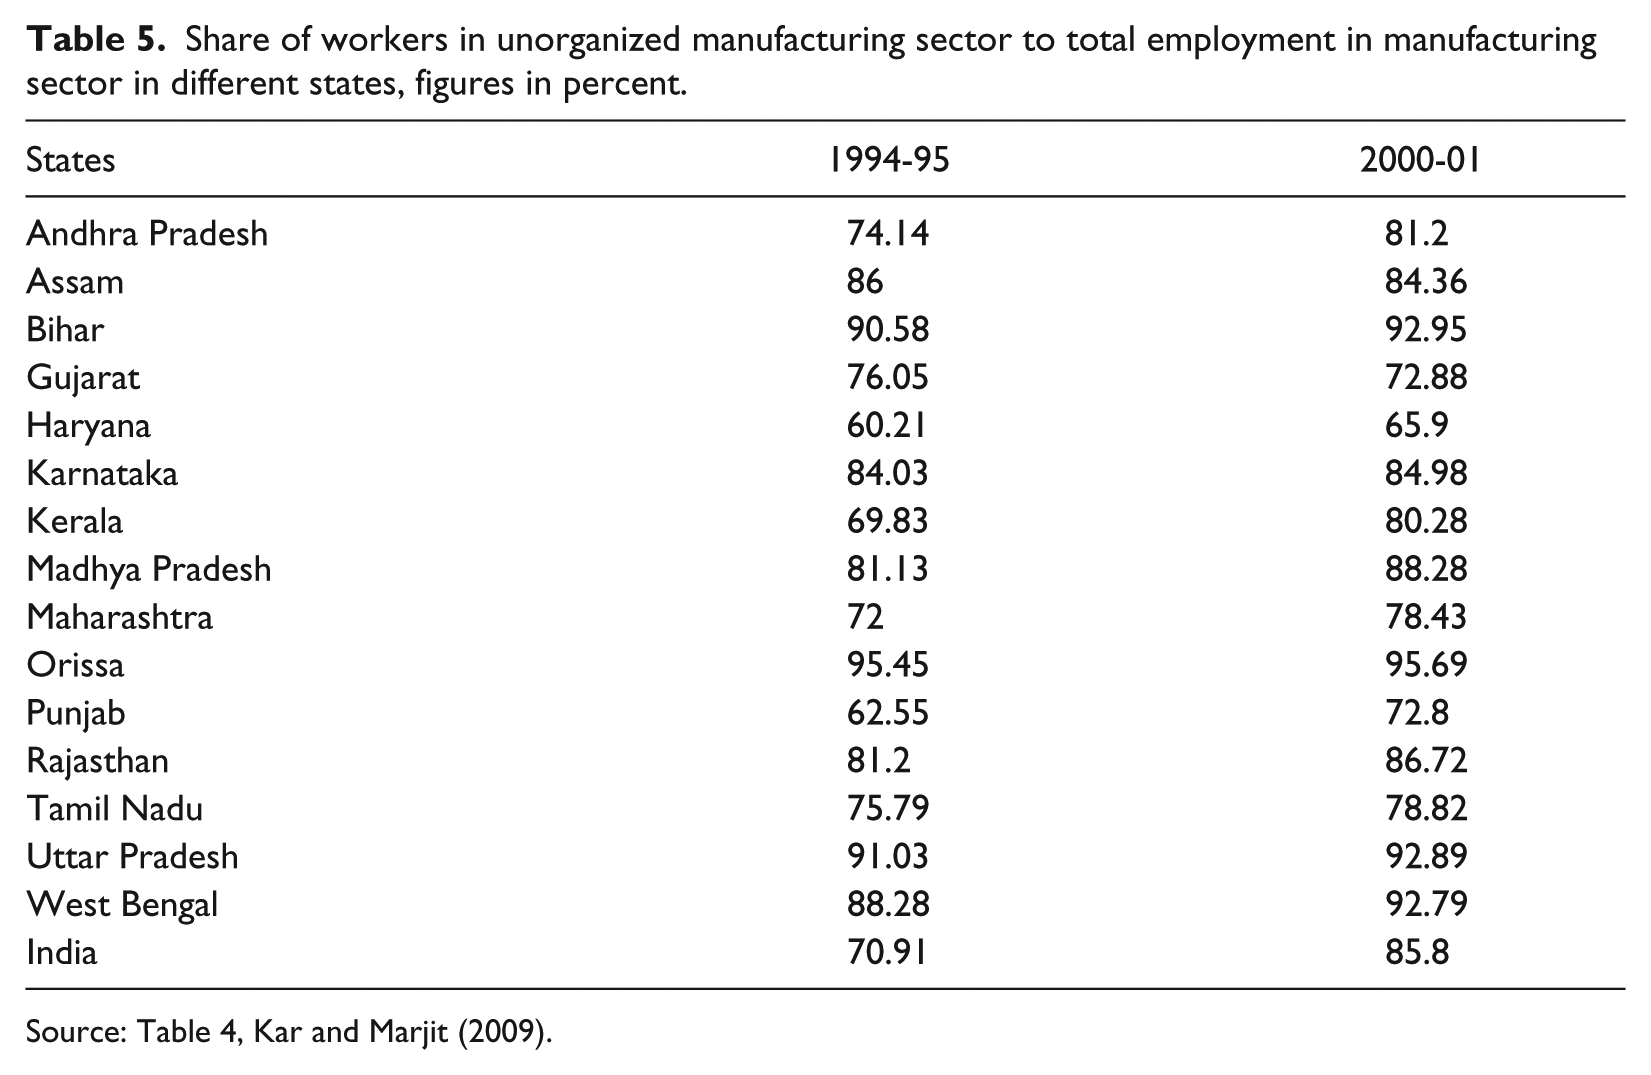
Source: Table 4, Kar and Marjit (2009).
Table 4 and 5 yield two observations. First, a high percentage of workers, 86 percent at the all-India level in 2000-01, are employed in the unorganized manufacturing sector compared to total manufacturing employment. Second, there has been a sharp rise in the share of employment in the unorganized sector in the years following 1994-95. Employment in the unorganized manufacturing sector rose by around 23 percent between 1994-95 to 2001-02 (Kar and Marjit 2009). This has been accompanied by a rise in output per worker. But there remains a huge gap between the GVA of informal and formal workers. The informal sector is characterized by a high degree of labor exploitation and self-exploitation (Basole and Basu 2011b). Neoliberal globalization may not be helping a transition of the agricultural sector to a capitalist mode. But it uses the surplus farm laborers in informal activities. This becomes necessary because the modern state is legally bound to protect the rights of the worker engaged in formal activities. These rights can be conveniently bypassed if they are informally employed.
With lack of gainful, secure employment it is not surprising that petty peasants are reluctant to part with their land (although the fact that the bottom 50 percent of holdings have lost land in absolute terms indicate that they have not been very successful). During village surveys in Eastern India the author has encountered share croppers and petty farmers who spend only a few months in a year in their native village. To make ends meet they resort to multiple seasonal migrations in a year. Yet they do not contemplate migrating permanently.
To summarize, we have examined changing land and assets distribution and have tried to locate it in the broader framework of employment opportunities.
5. Conclusion and Caveats
In the first decade after 1991, the top 15 percent holdings lost land share, but the top 15 percent of cultivator households have gained assets share. Farms belonging to the bottom 50 percent have raised their land share; the bottom 50 percent households have marginally improved assets share. A lack of polarization is thus apparent. This is true at the all-India level. At the state level variations exist. Lack of employment opportunities, both inside agriculture (due to lack of investment) or outside, has forced petty peasants to hang on to their land. This has rendered transition to capitalist agriculture difficult. Yet pronouncements are heard from top functionaries of the union government to shift the majority of population to cities (Tehelka 2008). Such plans are likely to meet with stiff opposition. Indeed anti-land acquisition movements which have erupted in recent years reflect the desperation of petty farmers to protect their land (Bhaduri and Patkar 2009). Unless labor is absorbed at a high rate in non-agricultural sectors in secure and paying occupations, whose odds are not bright in a state of jobless growth, slim chance exists of Indian agriculture making a successful transition to a capitalist mode of production any time soon.
The shortcomings of the paper are as follows. First, changing distribution of land for the years preceding 1991 could be examined to understand the impact of neoliberal reforms. Due to lack of data I could not carry out this exercise. I propose to carry out a similar exercise for the period after 2002-03 when relevant NSSO reports are released. Second, the data points were few. There were 10 to 14 data points for determining entire cumulative distributions. This again was due to the nature of data provided in NSSO reports, but it is undoubtedly a weakness of the paper. Third, other parameters of farmers’ economic prowess, besides assets and land, can be examined to test the robustness of the conclusions. These may include per capita consumption expenditure of cultivator households, proportion of hired labor to family labor, and land productivity. A useful way the research can be carried forward is to investigate the reasons behind changing land share in different states. This would contribute towards understanding the nuances of capitalist development in an agrarian economy in the era of neoliberalism.
Footnotes
Acknowledgements
I thank Utsa Patnaik, Roshan, and other participants at the conference “Accumulation, Immiserisation and Development” held at JNU, New Delhi. The discussion there provided the starting point of the paper. I am grateful to Deepankar Basu and Anirban Kar for comments on an earlier draft of the paper. Last but not least, I thank the three referees who have painstakingly pointed out many errors. Needless to say, the remaining errors are entirely mine.
Declaration of Conflicting Interests
The author declared no potential conflicts of interest with respect to the research, authorship, and/or publication of this article.
Funding
The author received no financial support for the research, authorship, and/or publication of this article.
1
I am using the data of operational holdings, not ownership holding. This does not pose any analytical problem because of the following reason. I seek to examine if big farms are accumulating land and assets. Whether the entire land of the farm is owned by the farmer is not of significance in this context. Many large and accumulating farms in Punjab which can be termed capitalist farms contain leased in land (![]() ).
).
2
I quote ![]() at length: “[I]n industry, capital grows as a result of accumulation, as a result of the conversion of surplus-value into capital; centralization, i.e. the amalgamation of several small units of capital into a large unit, plays a lesser role. In agriculture, the situation is different. The whole of the land is occupied (in civilized countries), and it is possible to enlarge the area of a farm only by centralizing several lots; this must be done in such a way as to form one continuous area” [emphases in the original].
at length: “[I]n industry, capital grows as a result of accumulation, as a result of the conversion of surplus-value into capital; centralization, i.e. the amalgamation of several small units of capital into a large unit, plays a lesser role. In agriculture, the situation is different. The whole of the land is occupied (in civilized countries), and it is possible to enlarge the area of a farm only by centralizing several lots; this must be done in such a way as to form one continuous area” [emphases in the original].
3
“With the polarization of the commodity-market into these two classes, the fundamental conditions of capitalist production are present. The capital-relation presupposes a complete separation between the workers and the ownership of the conditions for the realization of their labour. As soon as capitalist production stands on its own feet, it not only maintains this separation, but reproduces it on a constantly extending scale” (![]() ).
).
4
There are benefits which big land size entails. ![]() refers to the economies of scale which put the smaller farm at a disadvantage compared to the big farm. This adds to the momentum of centralization. Capitalist farms tend to acquire more land through accumulation; bigger land plots help them to acquire even more land. A chain of cumulative causation begins to operate.
refers to the economies of scale which put the smaller farm at a disadvantage compared to the big farm. This adds to the momentum of centralization. Capitalist farms tend to acquire more land through accumulation; bigger land plots help them to acquire even more land. A chain of cumulative causation begins to operate.
5
In India there have been illuminating debates on the characterization of agrarian capitalism (Patnaik 1990; Thorner 1982a, 1982b, 1982c). The debates have underlined the role played by investment. Reinvestment of surplus is a necessary condition of the capitalist mode of production. There can be farms which produce crops for sale in the market, and not for self-consumption. There may be widespread prevalence of wage labor, ensuring that labor power has become a commodity. But these two conditions are insufficient to make a production mode capitalist if accumulation of capital is absent.
7
![]() argue along similar lines. There is however some difference between their position and what is being proposed here. For Basole and Basu production relations in agriculture are getting increasingly capitalist as the institution of wage labor has become predominant, which is the defining feature of capitalism according to them. At the same time class differentiation has slowed down. I am proposing that, due to the retreat of the state and other factors, accumulation (which is a necessary condition of capitalist production relations) is slowing down. Deceleration of class differentiation is a corollary to this.
argue along similar lines. There is however some difference between their position and what is being proposed here. For Basole and Basu production relations in agriculture are getting increasingly capitalist as the institution of wage labor has become predominant, which is the defining feature of capitalism according to them. At the same time class differentiation has slowed down. I am proposing that, due to the retreat of the state and other factors, accumulation (which is a necessary condition of capitalist production relations) is slowing down. Deceleration of class differentiation is a corollary to this.
8
For landholdings I have taken the data of kharif season (monsoon). This data is marginally different from the rabi season data (winter), but has a larger sample size.
9
The detailed findings can be made available on request.
10
I reiterate that land distribution is with respect to operational holdings whereas asset distribution is with respect to cultivator households. However, there is likely to be large overlaps since nearly 70 percent of assets is land.
11
There is a minor difference between how unorganized and informal sectors are defined in India. Unorganized sector and informal workers are defined respectively as “[t]he unorganized sector consists of all incorporated private enterprises owned by individuals or households engaged in sale and production of goods and services operated on a proprietary or partnership basis and with less than ten total workers,” and “[u]norganized/informal workers consist of those working in the unorganized sector or households, excluding regular workers with social security benefits, and the workers in the organized/formal sector without any employment and social security benefits provided by the employers” (![]() ).
).