
Abstract
Risk of disaster exposure is often associated with prior conditions of economic deprivation, and it is held that risk would be less for an asset-rich household than an asset-poor one. Observational data may, however, contradict this expected pattern. The contradiction is resolved when we examine risk distribution through the lens of Weberian class distribution, and associate risk with peoples’ class situations. This paper draws upon the household survey data from Tanzania to illustrate this argument.
1. Introduction
Risk of exposure in the event of a natural disaster is an issue of much concern, especially for a population that is poor and inhabiting a region where such events occur frequently. This paper is on the subject of this risk and the conditions that might drive its distribution among households.
One well-known argument in this regard is that the risk of exposure is relatively less for population members with more assets (Wisner et al. 2004). The argument is intuitive. An asset-rich household is likely to have greater access to goods that can prevent exposure to the elements of nature in normal times (i.e., when disaster conditions are absent), and especially in the times of disasters. This set of goods may include a sturdier homestead that can shelter household members from natural extremes, a vehicle that can facilitate their quick evacuation from a disaster-affected region, and such other things. An asset-poor household is likely to have lesser access to these goods. This is especially true in a market economy, where ownership of final goods (e.g., house, vehicle, and so forth) is typically a matter of households’ purchasing power, which, in itself, is determined by their prior endowments of productive assets and the market values of these assets. Simply put, the argument is then: prior inequality in distribution of assets brings about an inequality in people’s disaster experiences. And, for households in a higher stratum of asset distribution, the probability of disaster exposure is lesser than the households in a lower stratum of asset distribution.
This intuition, however, is not always supported by empirical evidences. Take, for example, the case of disaster-affected households in Tanzania surveyed in a recent round of Tanzanian National Panel Survey (NPS 2013). The data show that the proportion of households that experienced the shock of exposure to disaster events that occurred in the surveyed regions of the country is higher in a higher asset stratum than a lower asset stratum. The result is curious. It suggests that we have a greater probability of finding a disaster-exposed household among the asset-rich section of the population than the asset-poor section. Or, to put somewhat coarsely, the realized risk is greater for the wealthy than the poor.
What can explain this counterintuitive, and somewhat perverse, result? This paper is concerned with this question. One answer can obviously be that the results we are observing are spurious, as exposure shock is random (or a matter of “accident”) and has got nothing to do with asset ownership. Another answer may be that risk is generated by a latent process that we have not yet identified and that cannot be captured solely by households’ asset endowments. It is the second possibility that this paper considers. Specifically, it looks for latent conditions of risk within social relations of property and exchange, and seeks to associate the differences in households’ chances of disaster exposure with the differences in their social class situations.
To motivate the discussions, the paper begins by describing the vexing results it observes in the Tanzanian data on the association between asset and risk (section 2). It proposes that it is possible to have a richer understanding of this risk when we examine it from the vantage point of social class. The paper derives its notion of social class from the writings of Max Weber (section 3), and proposes a way to operationalize the notion in terms of observational data (section 4). It describes the social class distribution of risk in the surveyed population and submits for consideration a conjecture on how households’ class situations and “life conduct” (lebensführung in Weber’s words) might affect their risk behavior and disaster exposure risk (section 5).
2. Asset Ownership and Disaster Exposure Risk
The Tanzania National Panel Survey (TZNPS) was designed to be representative at the national, urban/rural, and major agro-ecological zones of the country, and was originally conducted for 3,265 households. The present analysis is based on a subset of this population (2,714 households) for whom all data are available. Wave 3 of the survey (NPS 2013, conducted in 2012–2013) records the disaster experiences of households, for example, whether they were exposed to a disaster shock in the last five years, the year and month of this shock, and its severity. The survey focused on hydrometeorological extremes (i.e., droughts and floods) that affected the surveyed regions of the country. In this paper, the exposure incidences to these extreme events in surveyed population are examined in terms of a binary variable, which takes a value of 1 for the “exposed” households and 0 for the “non-exposed.” The aim is initially to assess how the “exposed” and “non-exposed” households are distributed along the axis of asset class.
Assets are, of course, susceptible to disaster losses. To ensure that we are exploring a causal relationship that extends from (prior) asset situations to (posterior) disaster encounters, and not from disasters to assets, the paper draws upon wave 2 of the survey (NPS 2011, conducted in 2010–2011) to obtain information on households’ initial endowments of productive assets. These assets may include land, cattle, tools and implements of production, production facilities and infrastructures owned by a household, and so forth. Using this information, households can be grouped into various asset classes. And, to examine their disaster experiences (recorded in wave 3) conditional on asset class (gleaned from wave 2), the paper focuses only on those disaster events that occurred in the country after wave 2 of the survey was completed, and all information on households’ asset endowments were gathered.
A crude but efficacious way to partition the surveyed households in asset classes may be as follows: we may consider three classes, A0, A l , and A h , respectively, consisting of households with “no assets,” those with “low assets” (i.e., with asset value positive but median or less), and those with “high assets” (i.e., with asset value greater than median). 1 Some of these households experienced disaster exposure, others did not. Frequency distributions of the “exposed” and “non-exposed” households in each asset class are presented in Table 1. Based on this information, we can derive a measure of risk realizing in a class as the probability of “exposure” (rather than “non-exposure”) for any randomly chosen member of the class. 2 From a frequentist viewpoint, this probability, or risk, is given by the proportion of class members who are “exposed” (see column 4).
Asset Class and Disaster Exposure Incidences, Tanzania.
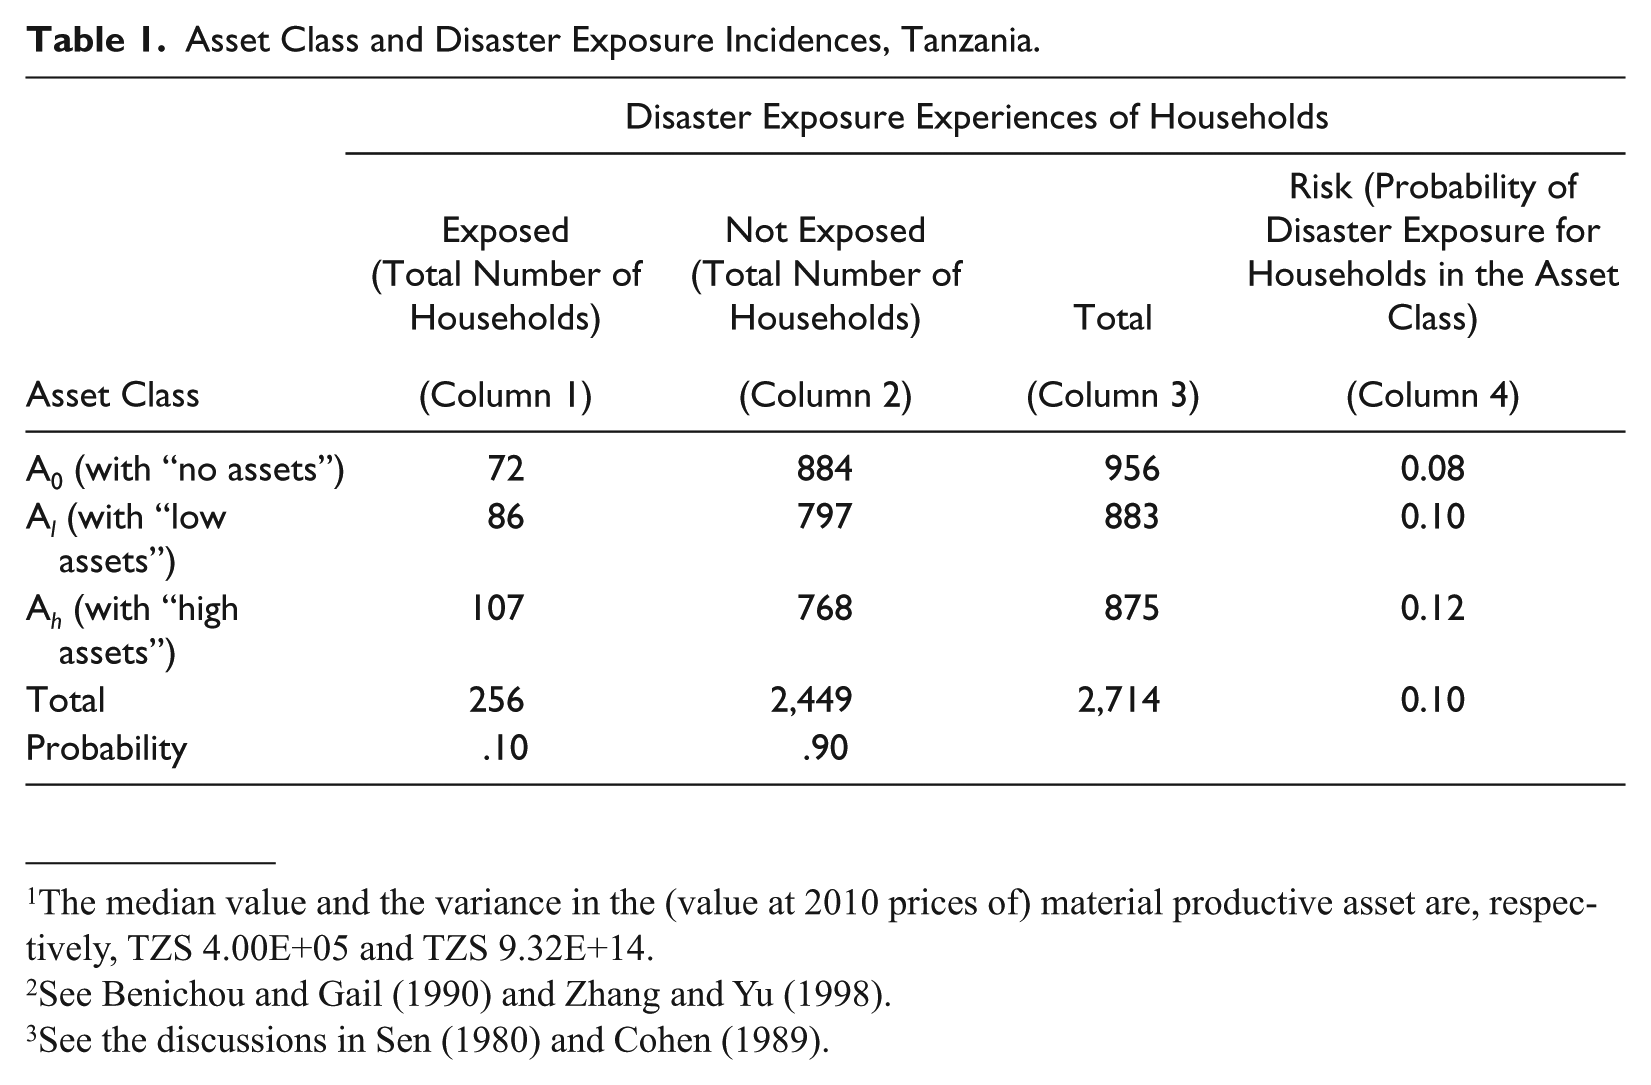
If ownership of assets has a “protective” effect on households at the time of a disaster, we would expect the risk measure to take a lower value for households with assets (i.e., in A l or A h ) than those without (i.e., in A0). This, however, is not observed in data. Indeed, we find that the measure takes a higher value for households in a higher stratum of asset distribution (see column 4). In other words, risk declines with asset deficits. The relative risk for households in one asset class vis-à-vis another can be indicated by a simple ratio of risk in the two classes. Using the results in Table 1, we can, for example, find the relative risk for households in asset class A0 vis-à-vis A h as 0.63, and that for households in asset class A l vis-à-vis A h as 0.82. As the ratios take values less than 1, we can infer that the realized risk is relatively lower if a household belongs to asset class A0 (or A l ) rather than A h . Clearly, this explanation is unsatisfactory. We must, then, seek an explanation for risk elsewhere.
3. Social Classes
A charitable explanation for our findings earlier is that: asset endowments cannot sufficiently explain a household’s ability to avoid an unfavorable disaster outcome. What, then, defines this ability? From a broad structuralist perspective, we might argue that this ability grows upon and is shaped by households’ social circumstances. For households participating in a market economy, these circumstances are described by social relations of property and exchange. Households that are advantaged in some real sense in context of these social relations typically have better chances of achieving favorable outcomes, or analogously, of avoiding the unfavorable ones. 3 Induced by this argument, we might hypothesize: households in a situation of advantage would have better chances of avoiding disaster exposure than households that are not. More concretely, access to advantage can explain risk.
But this gestalt shift from asset to advantage is not of much practical use to us when we are committed to an analysis of risk in terms of observational data. Advantage, in effect, is a latent variable. How can we carry out an empirical analysis in terms of such a variable, which is unobservable and imprecise? An answer to this question may be found in the writings of Max Weber. If cardinal measurement of advantage is tenuous, we can adopt an ordinal approach to capture its effects from a broadly Weberian perspective.
In his famous thesis in Economy and Society, Weber ([1922] 1978) argues forcefully that any differences in people’s ability or power to attain a favorable outcome of an event, and indeed in life, is governed by their location in social structure of production and distribution. This location would determine access to advantage, that is, the real opportunities that people have for realizing their objectives and interests. The households that are advantaged typically have better chances of securing all those things in life that are valued in their society. The chances entail their “class situations” (Weber 1946: 181). Drawing upon this Weberian insight, this paper posits: class situations that indicate households’ access to advantage would also indicate their chances of ensuring “non-exposure” in times of disasters.
A discussion on class situation, however, must start with a discussion on Weberian classes. Weber notes that, based on the means of production (types and quantities) owned, households participating in a market economy can be stratified into several economic classes. There may be as many economic classes in a population as there are (types and quantities of) productive resources of population members. The various economic classes can, however, be aggregated in social classes that are much smaller in number. Yet, this aggregation is not merely a statistical one. The specific variable that intervenes to transform economic relationships into social relationships is social mobility (Weber [1922] 1978: 302). 4 All economic classes within which and between which social mobility is relatively easy and is frequently observed constitute a social class. And, between two social classes, mobility is difficult and rare.
Four major social classes capture Weber’s ([1922] 1978: 928) attention: dominant entrepreneurial and propertied class, petty bourgeoisie, workers with formal credentials (i.e., the so-called “middle class”), and workers without formal credentials (i.e., the so-called “working class”). For notational conveniences, these social classes can be identified as S ent , S brg , S mdl , and S wrk , respectively. Typically, all members of a social class have access to similar sets of opportunities and abilities, but the sets are different for members of different social classes. Consequently, all households in a social class have similar class situations, and the class situations are dissimilar for households in different classes. Access to advantage is, thus, equal for two households if they belong to the same social class and unequal if they do not.
The question for this paper is now: are the chances of exposure, or risk, also unequal for two households in two distinct social classes, and is the risk relatively less for the household in a class situation of relative advantage? To empirically engage with this question, the paper visits the household survey dataset from Tanzania once again.
4. Class Distribution of Disaster Exposure Risk
The feature that distinguishes households in social classes S ent or S brg from those in S mdl or S wrk is that the first-mentioned own material means of production and derive their income from these recourses, while the second-mentioned do not. 5 Between classes S ent and S brg , the distinction is in terms of the volume of material productive resources owned. Households in S ent have significantly larger endowment sets of these resources, and often participate in the labor market as employers. Households in S brg typically have smaller endowment sets and are often self-employed or are employers in the informal sectors of the labor market. 6 There is also a vital difference between the households in social classes S mdl and S wrk . Members of S mdl , though relatively poor in terms of material resources, are rich in terms of their nonmaterial or embodied resources, namely, have higher formal educational accreditations, skill, and information access. A majority of households in this class are employed in formal sectors of the labor market or in the service and public sectors of the economy. They have relatively secured employment conditions and better opportunities for economic advancements in their chosen professions. In contrast, households in social class S wrk are poorer both in terms of their material and nonmaterial resources, and are often subject to authority and control at work. 7 Thus, in the context of social relations of production and exchange, households in S ent are more advantaged than those in S brg ; and households in S mdl are more advantaged than those in S wrk .
Now, if we accept the above broad categorizations as a primitive for our empirical analysis, then using theoretical shorthand, we could say that “property” and “knowledge” are the two key variables that delineate the social classes. But what is the precise demarcation? This paper takes some liberty in answering this question. It identifies as a crude indicator of “knowledge” the number of years of schooling of (adult) head of household, and that of “property” as the (real) value of material means of production owned by households. It identifies the social classes in Tanzanian population in the following manner:
For consistency, the initial classification of three asset classes (in section 2) is first considered: A0, A l , and A h . The households in each asset class are further classified in terms of educational attainments of the household heads. These data are also from wave 2 of TZNPS (2010–2011). Three education strata are considered: E l , E m , and E h , respectively, consisting of households with “less education” (i.e., less than median), “median education,” and those with “high education” (i.e., greater than median). 8 Accordingly, there is now a 3 × 3 stratification of the surveyed population, and nine distinct economic classes identified based on (prior) endowments of productive resources (material and nonmaterial) of population members.
The economic classes are, next, aggregated into social classes defined along the “property-knowledge” axes. Recall, a social class, by definition, is an aggregation of economic classes between which social mobility is neither rare nor difficult. Based on this principle, the paper distinguishes the households with assets into two social classes: S ent is a collection of households with “high assets” and “high education,” and S brg consists of the remaining households with assets but not with “high education.” The households without assets are similarly partitioned into two groups: those with “no assets” and “high education” are classified under S mdl ; and those with neither asset nor “high education” are identified as belonging to S wrk .
These identifications are, admittedly, arbitrary. It is possible to have finer distinctions among social classes. For example, one can distinguish between households with positive but less than median level of education from those that are with no education, if and when this difference in educational attainment brings about a substantive difference in people’s employment opportunities, consumption patterns, access to information, and other components of life chances. Similarly, one can distinguish households with some assets further based on education, if educational differences bring about a substantive difference in people’s prospects and aptitudes.
Postponing these issues for future study, the paper examines the risk inequality, if any, observable across the social classes as defined above. The frequency distributions of “exposed” and “non-exposed” households in the classes are given in Table 2.
Social Class and Disaster Exposure Incidences, Tanzania.
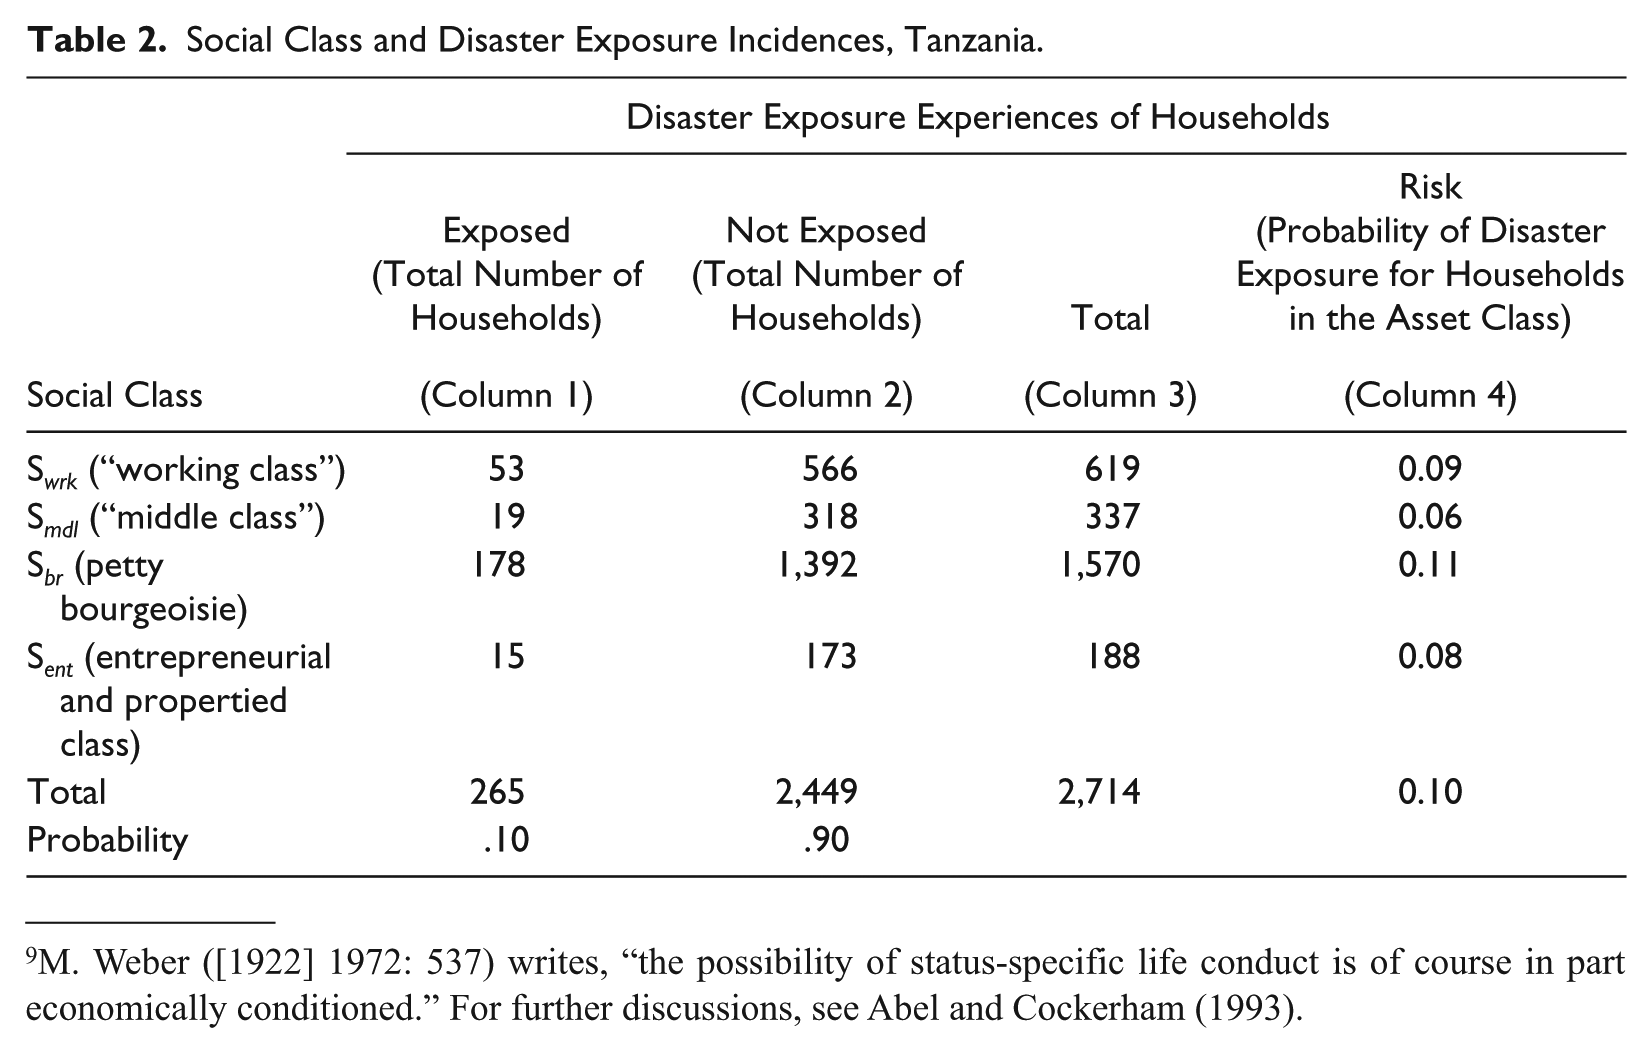
The results in Table 2 (column 4) indicate certain interesting patterns in risk distribution. Consider, for example, the following two results: first, among the “propertied” class, risk is lower for those in S ent than those in S brg , and, among the “non-propertied” class, risk is lower for those in S mdl than those in S wrk . Second, among all social classes, risk is least for households in S mdl . The first result is an expected one. It suggests that the volume (or market value) of households’ resource endowments can bring about a difference in their risk when all other differences between them are controlled for. The second result, however, is more surprising. It suggests that, in certain situations, households without assets may have a greater chance (or ability) of avoiding disaster exposure than an asset-rich household. If this result is meaningful in any way, then it is that the conditions of poverty are not necessarily the conditions for risk. The result lends credence to our initial observation that not always is risk lowered with greater ownership of assets. What might explain the results? The paper submits a conjecture for review.
5. Class Situation and Risk Behavior
If we accept the proposition that a household’s ability to avoid an unfavorable outcome (e.g., disaster exposure) springs, at a deeper level, from class situation, we are also accepting that access to advantage determines its chance of success. But the nature of this advantage is contextual. Even if households are poorer in terms of “property” (i.e., economic capital), they may be richer in terms of “knowledge,” which allows them to access other forms of capital, namely, cultural capital and social capital.
Households in social class S mdl may be uniquely situated in this regard. They have greater endowments of cultural capital (given their “high education”) if not economic capital, and have access to certain specific forms of social capital given the nature of their labor participations. These factors are likely to affect their ability to take decisions, to act, and to attain a desired state of well-being. Using a Weberian terminology, we may say that these abilities are part of people’s “life conduct” or lebensführung (Weber [1922] 1978). 9 As Weberian scholars have argued, life conducts entail deliberate rejection and adoption or modifications of certain behavioral patterns (Abel and Cockerham 1993). Might these behavioral patterns also include risk behaviors of households?
Other researches provide prima facie evidences in this regard. Studies in decision theory suggest that the differences in households’ access to knowledge and resources bring about differences in their risk perceptions and risk behavior. 10 Important still, the risk behaviors of the entrepreneurs and/or property-owners are likely to be quite different from that of the “middle class” or the “working class” households (Stephens et al. 2009; Weber 1998). The differences arise as the different classes operate under different risk-return calculus. We can imagine that this calculus is shaped by, and in turn shapes, their “life conduct.”
For instance, a number of studies have now found that households in what can be identified as Weberian “middle class” (i.e., S mdl ) are less inclined to choose a risky option, and would act in ways that would ensure greater security and stability as conditions of well-being. These households, for example, are more likely to spend a greater proportion of their resources to ensure safer living conditions (e.g., choose to settle in locations that are relatively safer in terms of natural hazard conditions and choose better domestic infrastructural facilities; Mercer 2014). These households are also likely to pay heed to advanced disaster warnings and opt for quick evacuations from potential danger areas (Stephens et al. 2009). These conducts may automatically reduce their chances of exposure.
But access to “knowledge,” in itself, is not sufficient. It is how “knowledge” is bound with “property” that would determine households’ decisions to act in certain ways and do certain things. We may make a conjecture that households in social class S ent or S brg are likely to adopt certain attitudes of embracing risk, either by preference or by compulsion. For example, for reasons of lifestyle or of livelihood, households in S ent or S brg may choose to be in certain locations that are relatively less safe in terms of natural hazard conditions, which may then automatically increase their disaster susceptibility. 11
The arguments above are, however, postulations. They allow us to form a hypothesis on how disaster exposure risks may be associated with class situations of households, and how risk is distributed across Weberian social classes. But to test the hypothesis and to examine the validity of arguments, a deeper analysis is called for.
Footnotes
Acknowledgements
I thank National Bureau of Statistics (NBS), Tanzania, and the World Bank for allowing the use of Tanzania National Panel Survey Data (wave 2, 2010–2011 and wave 3, 2012–2013). I am grateful to Rajat Shrestha for his excellent support at various stages of my research, and to Snehashish Bhattacharya for his suggestions and insights.
Declaration of Conflicting Interests
The author declared no potential conflicts of interest with respect to the research, authorship, and/or publication of this article.
Funding
The author received no financial support for the research, authorship, and/or publication of this article.
1
The median value and the variance in the (value at 2010 prices of) material productive asset are, respectively, TZS 4.00E+05 and TZS 9.32E+14.
2
See Benichou and Gail (1990) and ![]() .
.
3
See the discussions in Sen (1980) and ![]() .
.
8
The median value and the variance in the years of schooling of (adult) head of household are, respectively, 7 years and 6.9 years.
9
M. Weber ([1922] 1972: 537) writes, “the possibility of status-specific life conduct is of course in part economically conditioned.” For further discussions, see ![]() .
.
10
See E. U. Weber, Blais, and Betz (2002) for discussions.
11
Urbanization pattern in Dar es Salaam, for example, indicates that households in social class S
brg
tend to concentrate in regions that are commercially vibrant and yet are more prone to flooding (Kombe 2005). Other studies have indicated that the dominant property-owning households in Tanzania are concentrated in flood-prone areas of the country where land is most productive agriculturally and can support larger cattle herds (![]() ).
).