
Abstract
I examine effects of the privatization process as a whole in Turkey. I show that the privatization process begins before the firm is sold to private agents. I find that privatization causes the firm-level workforce to decline by 65 percent, profit-margin to increase by 18 percent, and no substantial changes in real sales. Based on the evidence presented, I conclude that the direct outcome of privatization is an income transfer from wage earners to profit earners.
1. Introduction
Systematically selling public assets to private agents is an identifying feature of the post-1980s world. Privatization has been supported by international organizations, such as the International Monetary Fund (IMF) and World Bank, and usually opposed by left-wing parties and unions (Brune, Garrett, and Kogut 2004; Shirley 1991). Generally, scholars have argued that empirical evidence at the firm level supports the claim that privatization has raised real sales (output) without substantially reducing employment, hence bringing about important social benefits (Bortolotti and Milella 2008). Governments of developed and developing countries have initiated privatization programs. By the 2000s, privatization was a global phenomenon.
In this paper, using 1993–2015 data top 500 manufacturing firms of Turkey prepared by the Istanbul Chamber of Industry (ICI), I examine the impacts of the privatization process as a whole on privatized Turkish firms, by focusing on the effects on employment, real sales, and profit margin. Exploiting the existence of the Privatization Administration (PA), I determine the exact date when the government decides to sell a firm and start the privatization process. 1 The PA is a centralized, autonomous executive body directly under the Prime Minister. It was founded in 1984, when the executive branch was pro-privatization, yet weak against the (broadly defined) privatization-skeptic old bureaucracy (Ercan and Önіş 2001). Once the government decides to privatize a publicly owned enterprise (POE), the PA obtains its assets, puts distance between the firm and the old bureaucracy, collects and analyzes the data, and prepares it for the sale.
This paper makes two main contributions to the literature: first, thanks to the institutional and legal framework of privatization in Turkey, I empirically assess the presale restructuring by showing changes in employment, real sales, and profit margins of POEs after the government decides to sell them. Second, exploiting the long-term dimension of the data (23 years), I show long run firm-level effects of privatization on the aforementioned variables. I directly test scholars’ main argument for privatization, and document its potential distributional consequences.
Overall, the findings reveal that employment and real sales decline 28 percent and 30 percent respectively with privatization, before the firm is sold to private agents. The firm shrinks when it is included in the privatization program, indicating a change in the objectives of the firm. Armed with this knowledge, I build an empirical model that compares actual privatized firms with counterfactuals that were never included in the privatization program. I show that after the sale of the firm, the real sales recover yet the workforce declines even further. My baseline estimates indicate that the Turkish privatization experience has resulted in a 65 percent decline in firm-level workforce, an 18 percentage-point increase in the profit margin, and statistically no change in real sales, in the long run. Thus, the argued social benefits of privatization are not realized in Turkey. On the contrary, privatization has resulted in an income transfer from wage earners to profit earners.
There is a large body of literature on the firm-level effects of privatization. 2 Arguably, the most popular approach, employed in Ben Naceur, Ghazouani, and Omran (2007); Chen et al. (2017); Dewenter and Maletesta (2001); and La Porta and Lopez-de-Silanes (1999) among others, is comparing presale outcomes with the postsale ones. Although the latter two studies note that significant changes occur before the date of sale, they both pick it for the first year of the privatization process; hence, they implicitly assume that the government makes no alteration before the sale. This paper improves upon these studies by addressing the presale restructuring. As implied by our presale estimates, the empirical identification strategies that overlook changes undertaken by the government to sell the firm would estimate a smaller employment drop and larger increase in real sales than the truth, understate its societal costs, and overestimate the benefits.
The paper is structured as follows: section 2 briefly describes the data, section 3 presents and discusses empirical results, and section 4 concludes.
2. Data
The primary database used in this paper is the 1993–2015 top 500 manufacturing firms (in terms of sales) in Turkey, prepared by the ICI. 3 It annually reports employment, sales, pretax profits, and value-added information of the largest manufacturing firms in Turkey. To determine the exact date for the start of the privatization process, I use the year when the firm’s assets are transferred to the PA. The PA also reports the date of sale and the shares sold.
Unlike sources that rely on stock exchange databases, one of the greatest advantages of the ICI data set is that we observe public firms that are entirely government-owned. Thus, we possess information on the performances of the POEs even when they are not considered for privatization. Furthermore, the surviving firms report over a 23-year period, hence the data allow us to better assess the validity of the comparison sample based on the existence of preexisting trends as well as the long-term effects of privatization.
Nonetheless, I observe only the largest firms in Turkey. Although all privatized firms, as well as large private and public firms, are always among the top 500, the selection causes shrinking (rising) firms to disappear from (appear in) the data. To alleviate the problem, first, I employ the second largest 500 manufacturing firm data set for some of the missing firm years as well as the stock exchange database when available. Second, to decrease measurement error and to obtain the comparison sample of firms similar to the privatized firms, I exclude firms that are observed for fewer than 10 years.
The constructed data set contains 171 firms, where 154 (7) of them are private (public) throughout the period analyzed and 10 are privatized. 4 All the 10 firms were transferred to the PA before they were sold, 4 of them were already owned by the PA in 1993. All firms transferred to the PA are privatized eventually.
Although 10 firms might appear a relatively small “treated” number of firms, this sample is arguably representative of the Turkish privatization experience. According to the PA database, until 2015, block sale revenues from these firms amounted to $10.9 billion where total block sale revenues of the nonfinancial firms were $21.6 billion. In addition, the privatized firms were all controlled by the government before the privatization process, and it lost control with the sale. On average, in the year of the sale, public share of the privatized firms in our sample decreases from 85 percent to 5 percent. Three years after privatization, it is merely 1.25 percent.
3. Empirical Methodology, Findings, and Discussion
3.1. Empirical implementation
To assess the changes during the presale restructuring, preexisting trends as well as the effects of the privatization, we initially employ the following model:
where i indicates firm and t year. Yi,t is the log of the total workforce of the firm, log of real sales, log of real sales per employee, or pretax profit per sales in Turkish Lira. 5 I place all public and private firms in the comparison sample following La Porta and Lopez-de-Silanes (1999). I set the year before the privatized firm’s assets are transferred to the PA as the reference to assess preexisting trends. Therefore, PrePA, PA, and DOS variables are always 0 for all firms, except for the privatized ones. PrePA is 1 when the privatized firm is not considered for privatization, except for the year before the firm’s assets are transferred to the PA, it is 0. PA is a binary variable that is 1 when the firm’s assets are owned by the PA, and 0 otherwise. 6 DOSi,t+k is an indicator variable for k years after the date of sale; k ranges from 0 to K = 8, to estimate annual changes in the first 9 years after the sale; li and mt are firm and year fixed effects.
This specification requires information on at least three exclusive periods of the privatized firms: the pre-PA period when the firm is not included in the privatization program; the PA period when it is owned by the government, and is considered for privatization; and the period when the firm is privatized and owned by private owners. Four of the ten privatized firms in the sample were already owned by the PA in 1993, hence regression equation 1 is estimable only for six of the privatized firms. 7 In other words, equation 1 does not allow use of all privatized firms in the sample, and I use only six of them in this analysis. Finally, to prevent late-privatized firms from having a considerable influence over the estimation of b1 and early privatized firms from being included in the comparison sample, I construct a window that includes only the observations between the first 5 years before the firms’ assets are transferred to the PA and 9 years after the sale.
Figure 1 displays changes in the variables relative to the year before the firms’ assets are transferred to the PA. There are seven important points related to the figure that I wish to emphasize. First, it confirms my claim that the privatization process begins before the firm is sold. Compared with the pre-PA period, employment and real sales of the firms decrease, on average, by 28 percent and 30 percent during the PA years. It implies that the government shrinks the firms for the sale. Second, employment further declines rapidly in the first couple of years of the sale and remains depressed in the long run. Third, the decline in real sales is reversed after the firm is sold to its private owners, and reaches the same level as the counterfactual firm that was never privatized. Fourth, real sales per employee, which remain virtually unchanged during the PA period, increase rapidly after the sale. Fifth, profit margins rise after the sale. Sixth, we do not observe a preexisting trend that would violate the parallel trends assumption of the regression equation 1 for any of the variables, suggesting the validity of our identifying assumption namely, the counterfactuals of privatized firms would follow a path like our comparison sample after controlling for macroeconomic shocks. Seventh, the firm undergoes postsale restructuring that lasts more than a year. In all cases, however, the figure shows that the firms, on average, reach their long run path after the fourth year of the sale. Based on the observation, I divide the postsale period into two: POST1[0,3](POST2[4,8]) is 1 from the first (fifth) until the end of the fourth (ninth) year after the sale.
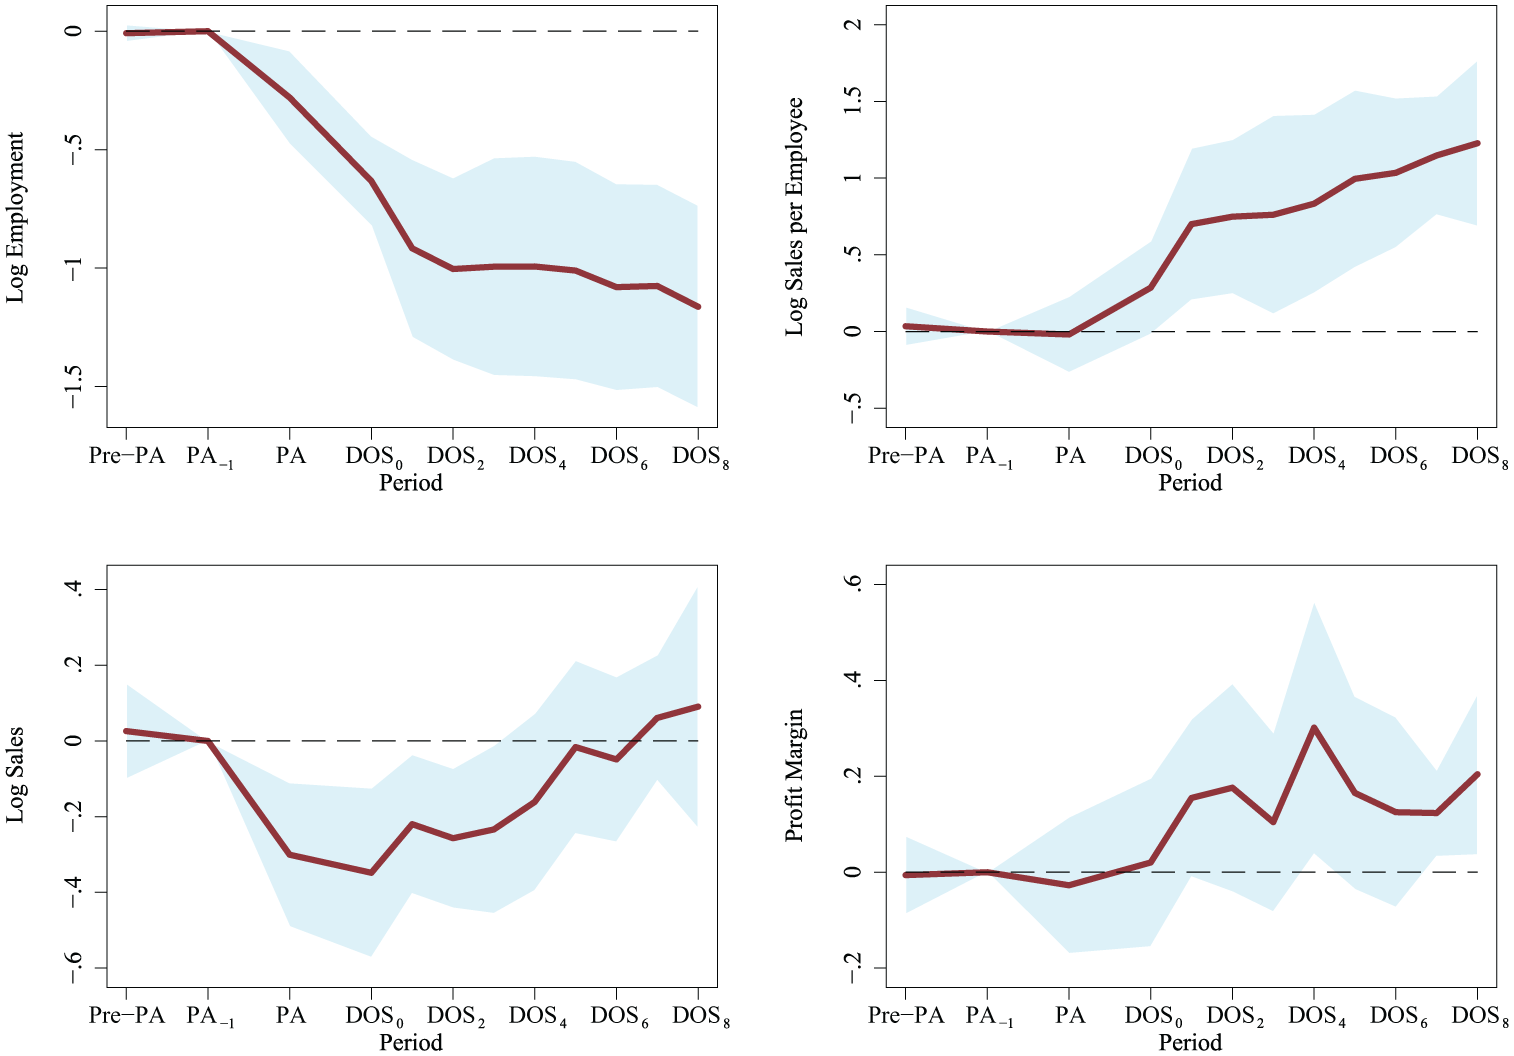
Evolution of Employment, Real Sales, Real Sales per Employee, and Profit Margin
To quantify the total effects of the privatization, I exclude observations when the privatized firm is owned by the PA, and employ the following model:

Equation 2 is intuitively very similar to equation 1. The exclusion of the PA period guarantees that the comparison is between the actual privatized firm after the privatization and the counterfactual firm that never entered the privatization program. The main variable of interest is b2, which captures the effects of privatization after the postsale restructuring, whereas the average effect of the latter is captured by b1. For better precision, equation 2 declares the entire pre-PA period as the reference, and estimates only two variables for the postsale period.
One major downside of regression equations 1 and 2 is that we cannot employ all the privatized firms in the sample to quantify the total effects of the privatization, as noted in footnote 8. Alternative to these models, one can control for the firm-specific PA period trends linearly and estimate the total effects:
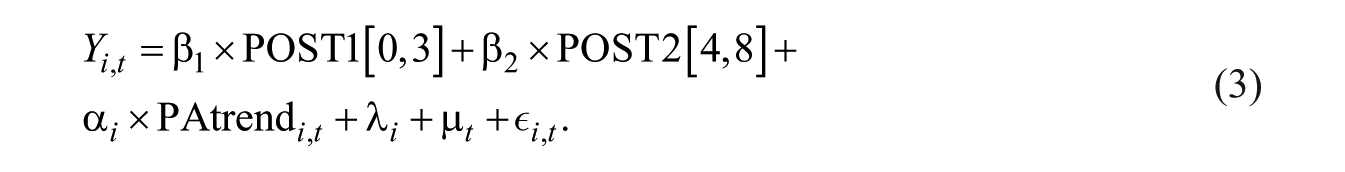
PAtrend i,t is firm-specific PA period trends that take on the value of j in the jth year of the PA and 0 otherwise. 8 Regression equations 2 and 3 are the benchmark and alternative models. For robustness of the estimates, I additionally include the two-digit International Standard Industrial Classification (ISIC) rev.2 industry-specific trends, control for the two-digit ISIC rev.2 industry-specific period effects, and exclude firms in the same industry as the privatized firms. The former two sets of controls allows industries to follow alternative linear trends, and macroeconomic shocks to affect industries differently. If the perceived effects are not due to change in ownership but reflect a general trend in the industry, linear trends or industry-by-year fixed effects eliminate the bias. From an opposite point of view, the sale of the POE may cause a spillover that affects all the firms in the industry. The potential spillover effects render these firms invalid controls because they are also affected by the sale.
Panel A of Table 1 reports employment effects of the privatization. The benchmark specification indicates a sizable decline of 1.06 log points, corresponding to 65 percent fall in the firm-level employment in the long run due to privatization. All specifications largely agree with the benchmark specification on the size and the statistical significance of the decline.
Total Effects of the Privatization.
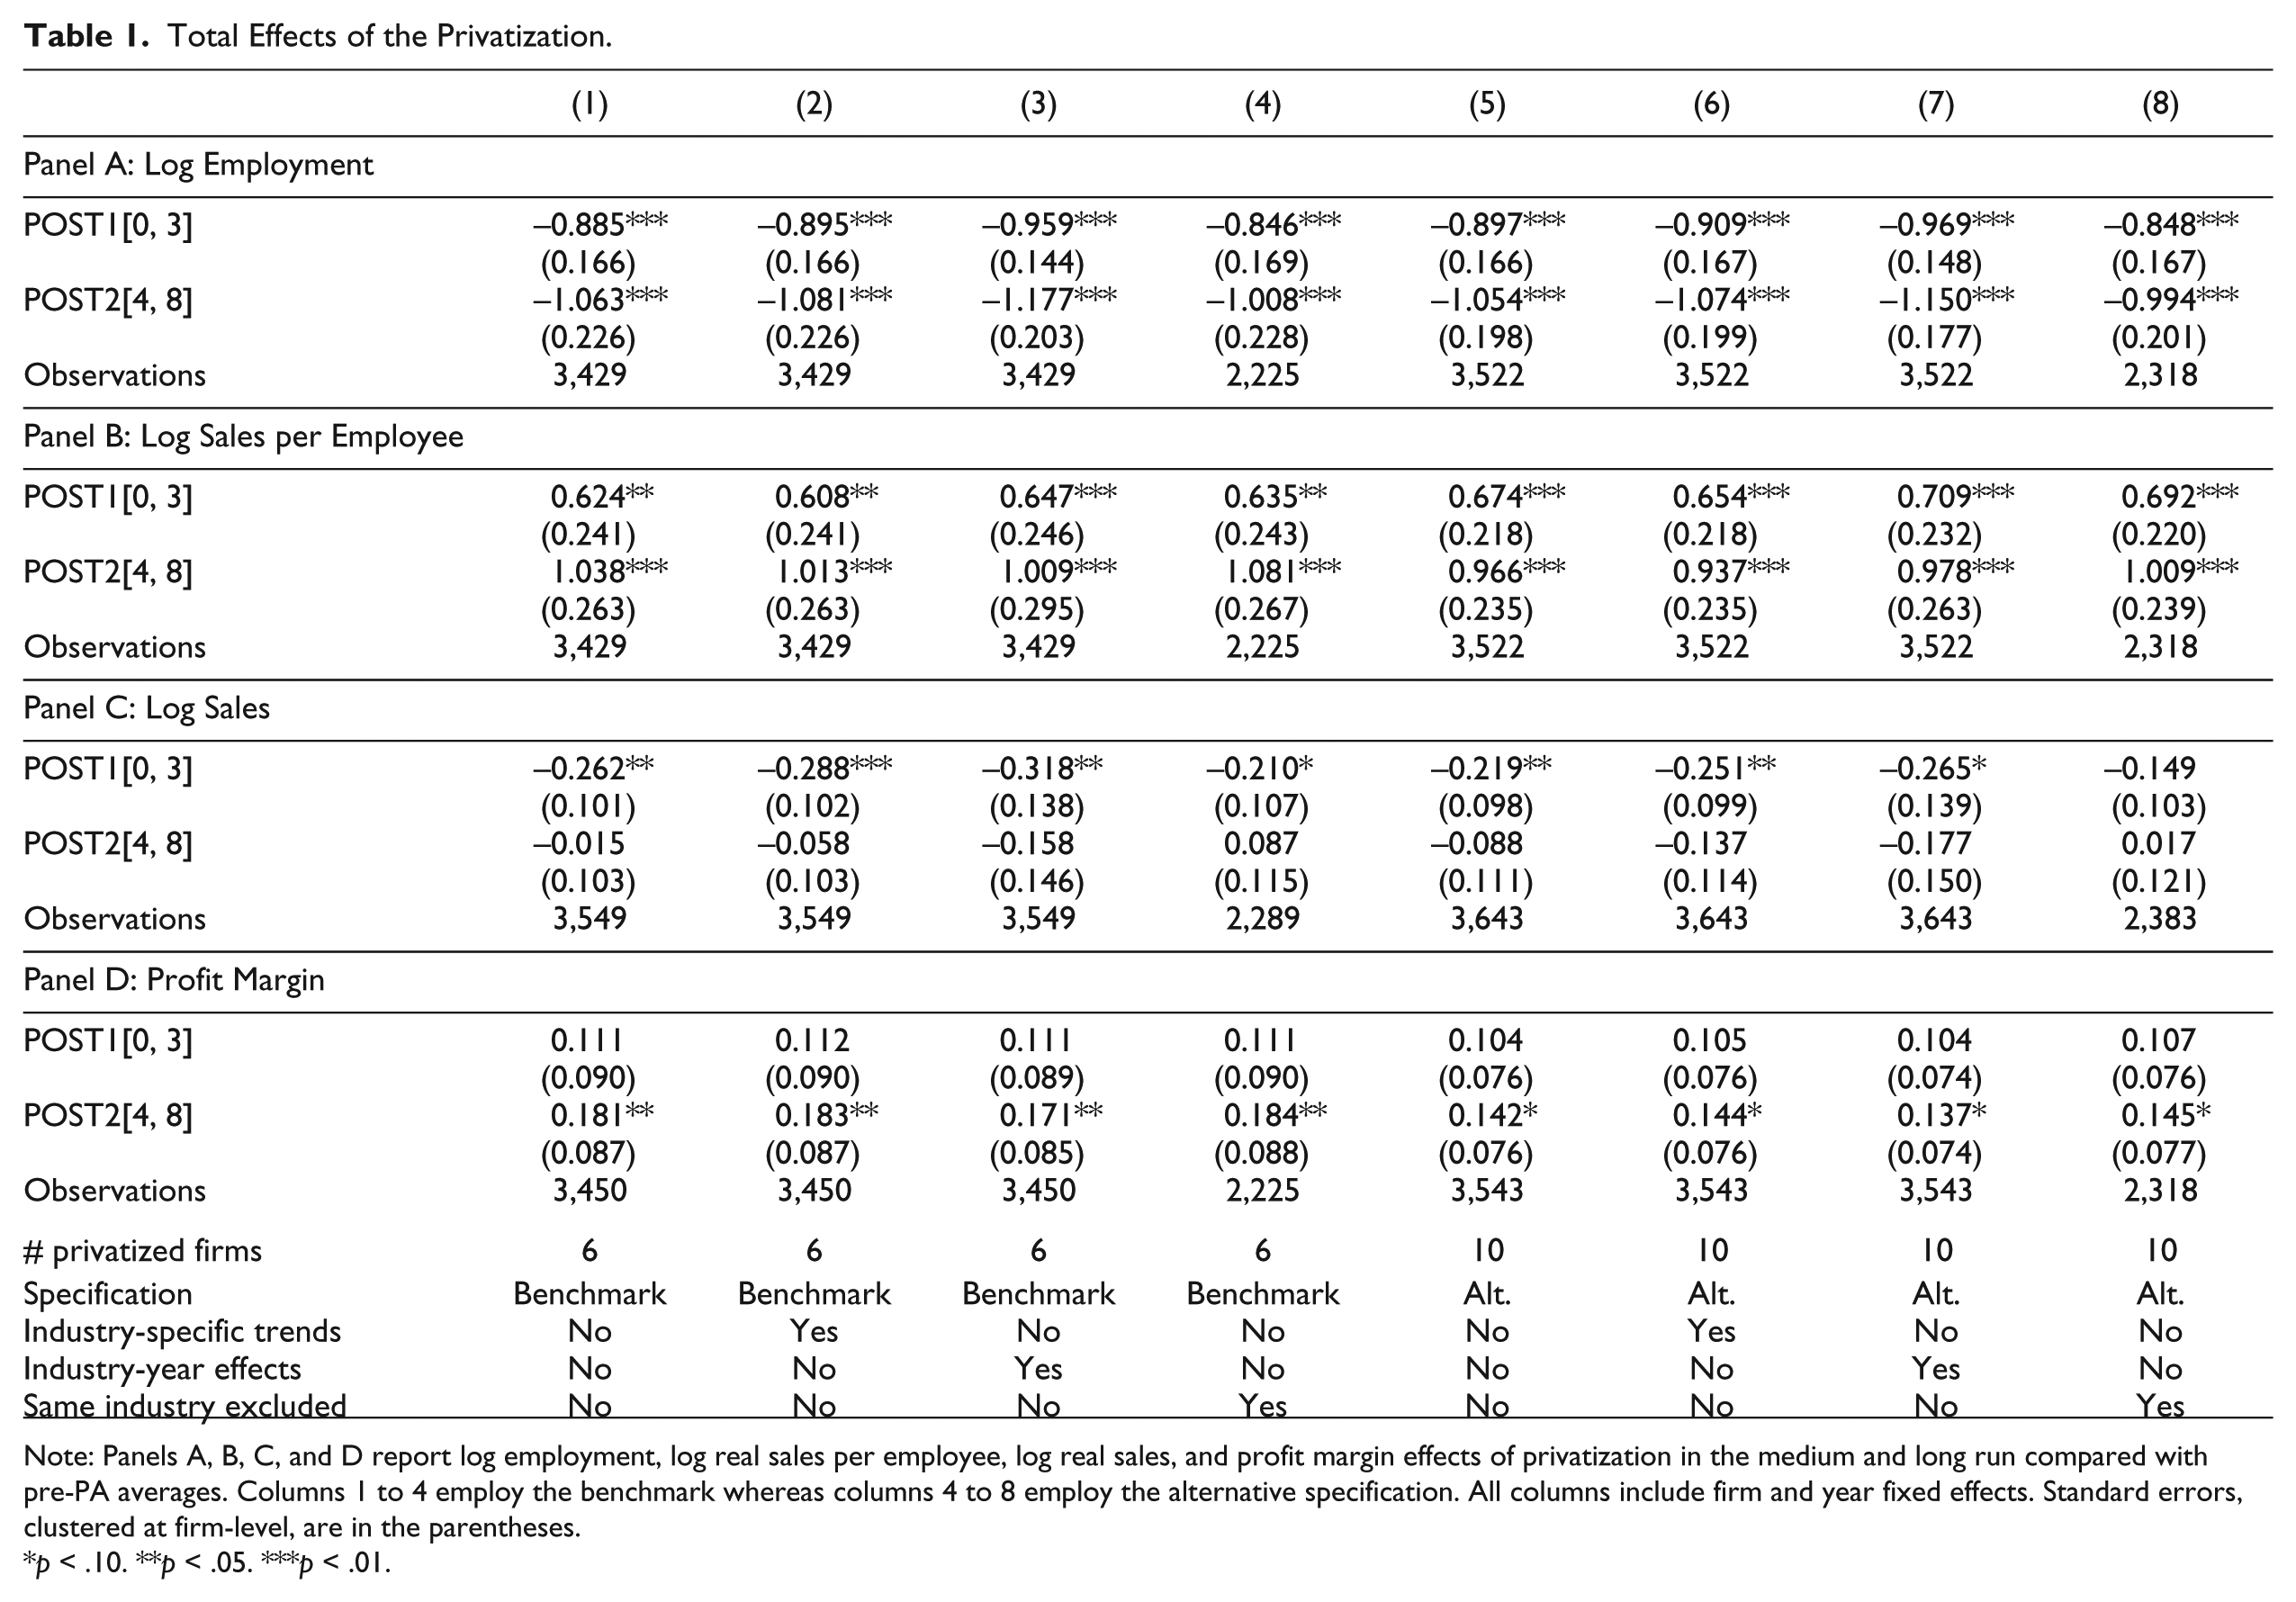
Note: Panels A, B, C, and D report log employment, log real sales per employee, log real sales, and profit margin effects of privatization in the medium and long run compared with pre-PA averages. Columns 1 to 4 employ the benchmark whereas columns 4 to 8 employ the alternative specification. All columns include firm and year fixed effects. Standard errors, clustered at firm-level, are in the parentheses.
p < .10. **p < .05. ***p < .01.
Panel B of Table 1 shows that log sales per employee have quickly increased with privatization. The absolute magnitudes of the estimates are almost the same as that for the Panel A. The similarity suggests that the numerator (sales) has not changed, but the denominator (employment) has declined. This is confirmed in Panel C of Table 1. None of the columns indicate a statistically significant change in real sales. The estimated effects range between −18 percent and 9 percent, depending largely on the importance of the firms in the same industry as controls. When only within-industry variation is employed (the specifications with industry-by-year fixed effects), we obtain negative estimates, suggesting that, on average, firms in the same industry as the privatized firm have been able to increase their sales.
In panel D, I document the rise in the profit margin, calculated as the ratio of the pretax profit to the sales. The benchmark specification indicates an 18 percentage-point increase after the date of sale. The range of the estimates is relatively small, between 0.14 and 0.18, and all of them are statistically significant at the 10 percent level.
3.2. Discussion
There are non-profit-related aims of POEs. One of them is sustaining a level of employment. Governments might reduce unemployment through POEs by employing more workers per unit of production than privately owned firms. For private firms, these concerns are nonexistent or less important. Differences of objectives among private and public firms require restructuring of privatized firms. Governments might bear a portion of the restructuring cost to boost salability of the firm during the PA period. As shown in Figure 1, the firm-level workforce declines during the PA period when the firm is considered for privatization. The decline is continued by private owners; hence, the first effect of privatization is the annulment or substantial decline of the importance of employment-related objectives. The rise in the profit margin only after privatization suggests that the profit-related objectives of the government have not become more important with the asset transfer to the PA; and they are much more important for private firms. Then, the direct outcome of privatization has been an income transfer from wage earners to profit earners.
Second, privatization has substantially increased real sales per worker. Although the ratio as an efficiency measure is not adequate for comparison, as the government puts a much larger weight on employment-related concerns, it is still important to examine factors behind the rise. Four of the most probable ones are workers’ effort levels, rise in product prices, subcontracting, and change in production technology.
La Porta and Lopez-de-Silanes (1999) argue that one reason for workers’ opposition to privatization is that private owners require more effort from them. Although workers’ effort is mostly noncontractible, we can expect that private owners provide incentives for working hard, or disincentives to “shirking” (Bowles 2009). As the local employment rate is a concern for POEs, its public knowledge renders the layoff threat less credible, and the average worker’s effort is relatively low. The local employment rate is not a concern for private firms; therefore, the layoff threat is credible, the effort level is high. Nonetheless, the employment fall in the PA period did not coincide with an increase in real sales per employee. This reveals the novelty brought by private owners for increased worker effort is not limited to making the threat credible. Better monitoring and supervising can lead workers to devote more effort. The real sales records of the public firms in the pre-PA period, on the contrary, demonstrates that the tolerance for “shirking” in the POEs is not limitless.
The second potential reason behind the rise in real sales per employee is an increase in the prices of privatized firms’ outputs. If the government artificially lowers the prices to boost downstream industries, this aim disappears after the firms are sold to their new owners. We do not possess output price information, and leave this as a possibility.
Third, subcontracting some tasks might decrease the total workforce of privatized firms without changing their sales. Nevertheless, this would also lead their value added per sales to decline, as subcontracted workers’ wages are outside purchases and no longer a component of the value added. Cengiz (2018) shows that the change in value added per sales is not negative; on the contrary, it is small, positive, and statistically insignificant, indicating that outsourcing is not the main reason behind the rise in real sales per employee.
Last, the decline in employment-related aims might induce the firms to embrace capital-intensive techniques. The ICI data set does not report firm-level capital stock or investment rate. By constructing investment series for four of the privatized firms (Erdemir, Petkim, Petrol Ofisi, and Tupras) from the balance sheets reported to the Istanbul Stock Exchange, Cengiz (2018) shows no consistent increase in the capital stocks of the firms. The analysis provides incomplete yet suggestive evidence that technological change after privatization is not the main reason behind the rapid rise in real sales per employee.
4. Concluding Remarks
The public sector still plays a considerable role in many developing and developed countries. There are many large POEs that can be the subject of privatization in the future. This paper’s findings should caution decision makers from making hasty conclusions that privatization improves social welfare by increasing firms’ output without changing employment levels substantially. In the case of Turkey, privatization primarily led to job losses and increases in profit margins. Therefore, when distributional consequences are considered, social costs of privatization may surpass its benefits.
Footnotes
Acknowledgements
I thank Arindrajit Dube, Ina Ganguli, Erin Conlon, Krista Gile, and participants at 2016 The New School–UMass Economics Graduate Student Workshop for very helpful comments.
Declaration of Conflicting Interests
The author declared no potential conflicts of interest with respect to the research, authorship, and/or publication of this article.
Funding
The author received no financial support for the research, authorship, and/or publication of this article.
1
The Privatization Administration (PA) has reached its final form in 1994, but there have been councils and administrations with similar tasks since 1984 (see ![]() for a thorough examination on the institutional and legal framework of Turkish privatization experience). For brevity, we call all the councils and administrations as PA, even if it does not exist in the particular year.
for a thorough examination on the institutional and legal framework of Turkish privatization experience). For brevity, we call all the councils and administrations as PA, even if it does not exist in the particular year.
2
Some of the reviews are provided by Megginson and Netter (2001) and ![]() .
.
3
5
Following the literature (e.g., Ben Naceur, Ghazouani, and Omran 2007; Megginson et al. 1994), I define “real sales” as the inflation-adjusted nominal sales.
6
The number of PA period varies for the privatized firms, so I pool them.
7
For the four firms, in addition to the firm fixed effects, either PrePA or PA or DOS variables take the value of 1 in each year, leading to the standard “dummy variable trap” that prevents estimation of all four variables simultaneously.
8
There are ten firms, so there are ten firm-specific PA period trends.