
Abstract
Meta-analysis is a statistical technique used to synthesize findings from multiple studies, providing a comprehensive understanding of a given research question. This paper explores the fundamental principles of meta-analysis, including its methodology, advantages, and challenges. It discusses key steps such as study selection, data extraction, effect size calculation, and statistical modelling. Additionally, issues related to heterogeneity, publication bias, and the reliability of results are examined. By systematically integrating data from various sources, meta-analysis enhances the validity and generalizability of research findings, making it a valuable tool in evidence-based decision-making. However, methodological limitations and biases must be carefully managed to ensure robust conclusions. This paper aims to provide a clear overview of meta-analysis for researchers and practitioners, highlighting its significance and best practices in various scientific disciplines.
Introduction
Meta-analysis is a powerful statistical technique that integrates findings from multiple independent studies on a specific topic, offering a more precise and comprehensive understanding of a given phenomenon (Hedges, 1992). This method is widely applicable across various domains, including academic research, clinical interventions, educational settings, and practical applications in diverse fields (Hedges, 1992; Strube and Hartmann, 1983). Since the 1980s, the use of meta-analysis has grown significantly (Guzzo et al., 1987). In the health sciences, the number of meta-analysis-based publications increased by more than 30% between 1996 and 1997 (Allen and Olkin, 1999). By 2019, an estimated 80 systematic reviews—comprehensive syntheses of empirical evidence based on qualitative or quantitative data—were published daily in epidemiological research (Hoffmann et al., 2021). In clinical psychology, meta-analysis plays a crucial role in assessing the effectiveness of psychotherapeutic interventions, enabling researchers to integrate findings from multiple studies and strengthen evidence-based conclusions. The prevalence of meta-analyses and systematic reviews continues to rise, particularly in healthcare research (Ahn and Kang, 2018). However, despite their similarities, meta-analysis and systematic reviews differ in methodology and scope.
The difference between meta-analysis and systematic review
Meta-analysis is a quantitative synthesis method that estimates the effect size of a particular intervention or phenomenon. By aggregating data from various studies, it increases statistical power and reliability, overcoming limitations of individual studies such as small sample sizes or methodological differences.
Systematic review, instead, is a structured, comprehensive summary of research studies on a specific topic. It follows a predefined methodology to identify, select, evaluate, and synthesize all relevant studies to answer a clearly formulated research question.
Table 1 compares the two kinds of analyses on the basis of different aspects.
Comparison between systematic review and meta-analysis in relation to different aspects as definition, focus, methodological approach, objectives and typical outputs.
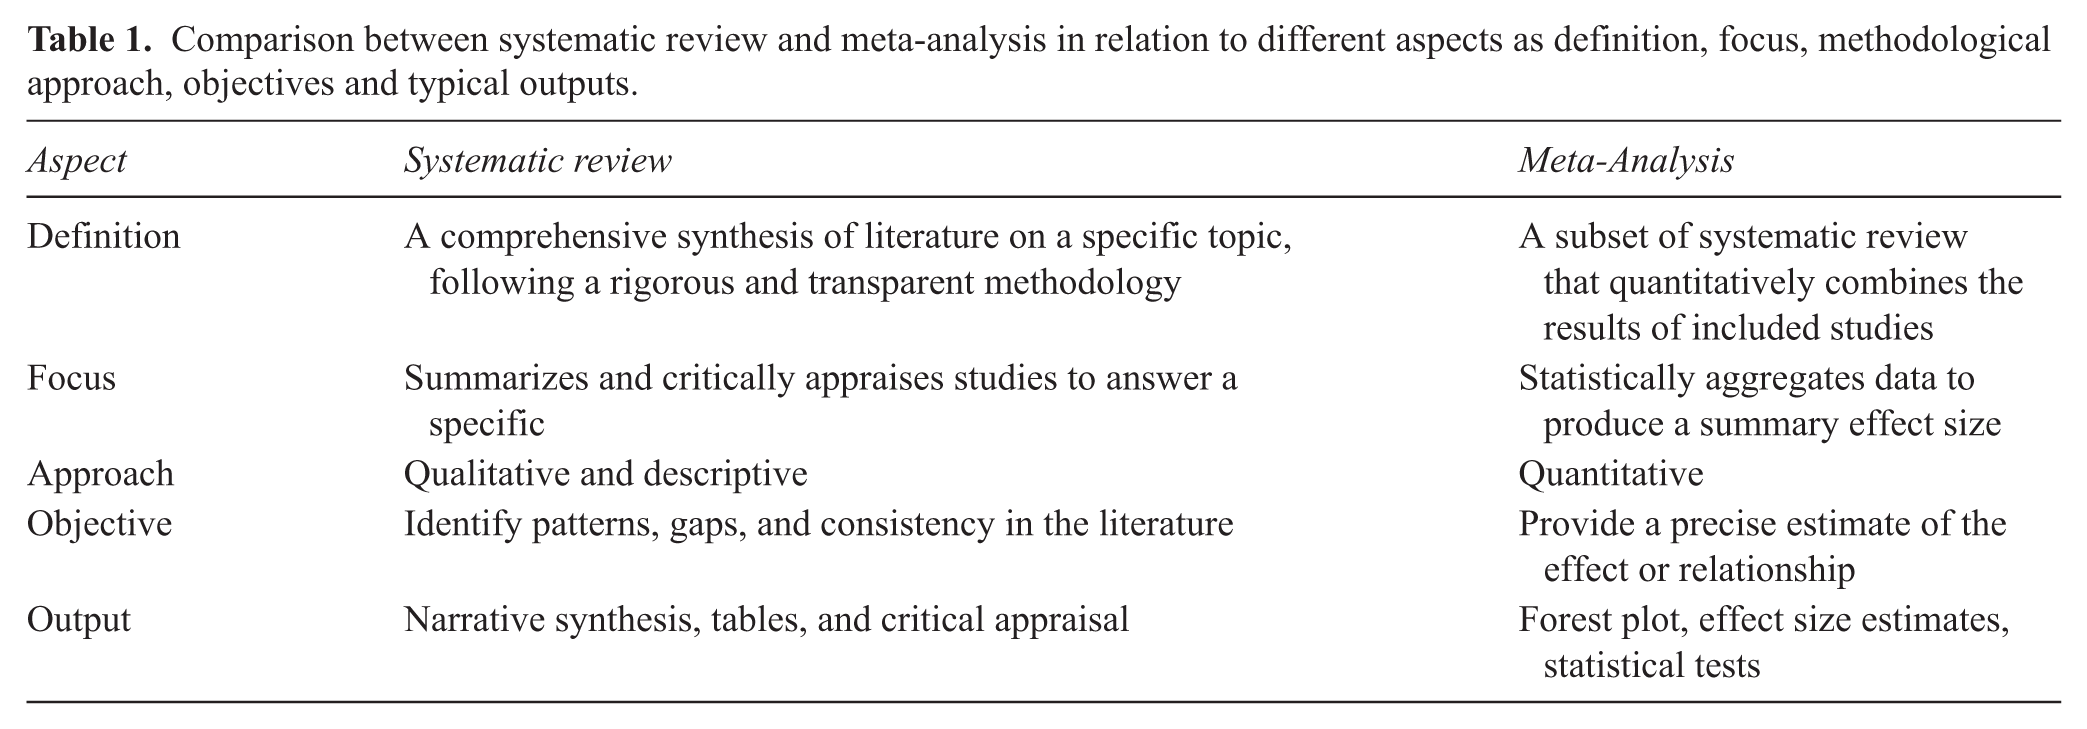
In short, a systematic review provides a broad and detailed overview, while a meta-analysis offers a precise, statistical summary of the evidence.
Key features of meta-analysis
Meta-analysis is a quantitative research method that synthesizes findings from multiple studies to provide a comprehensive statistical summary of a given phenomenon or topic. In clinical psychology, its primary objective is to evaluate the effectiveness of specific therapeutic techniques by assessing their impact on patients and comparing them with alternative treatment approaches. This rigorous approach enhances the reliability of research findings, offering valuable insights into the efficacy of psychological interventions. The principal advantages of using Meta-analysis are:
- Provides a single summary measure for different studies (e.g., mean difference, odds ratio, confidence intervals).
- Examines variability across studies through heterogeneity analysis.
- Detects potential publication bias, ensuring more balanced conclusions.
- Enhances the generalizability of research findings to diverse populations.
The conduction of a meta-analysis
Defining the research question: The PICO framework
A well-structured research question is essential for a meaningful meta-analysis. The PICO framework is commonly used:
- O (Outcome): What results are being measured?
For example, a meta-analysis on the effectiveness of mindfulness-based therapy for depression might define:
Selection of studies: Inclusion and exclusion criteria
Studies must be selected based on clear inclusion and exclusion criteria to ensure reliability. Key criteria include:
Meta-analysis can incorporate various additional characteristics to enhance the depth and specificity of its findings. Notably, it allows for the inclusion of subgroups or distinct populations categorized on demographic variables (e.g., gender), clinical diagnoses (e.g., individuals with major depressive disorder versus those with bipolar disorder), treatment modalities (e.g., cognitive behavioural therapy versus psychodynamic therapy), or other relevant factors. The use of subgroup analysis provides a more detailed and nuanced understanding of the phenomenon by accounting for potential sources of variation. For instance, it can be particularly insightful to examine whether a specific clinical intervention produces consistent effects across different patient groups or whether individual characteristics and contextual factors influence the effectiveness of a therapeutic approach, either enhancing or limiting its impact.
Data extraction and analysis
Researchers extract key data from selected studies, including sample sizes, means, standard deviations, and statistical tests used. Meta-analysis primarily relies on the estimation of Effect Size (ES), a measure that quantifies the magnitude or strength of an effect. For instance, in studies evaluating the efficacy of a clinical intervention involving an experimental and a control group, ES represents the standardized difference between group means. This metric provides insight into the degree of difference between the two groups and allows comparisons across multiple studies. A consistently high ES supports the effectiveness of an intervention, whereas a low ES suggests limited efficacy.
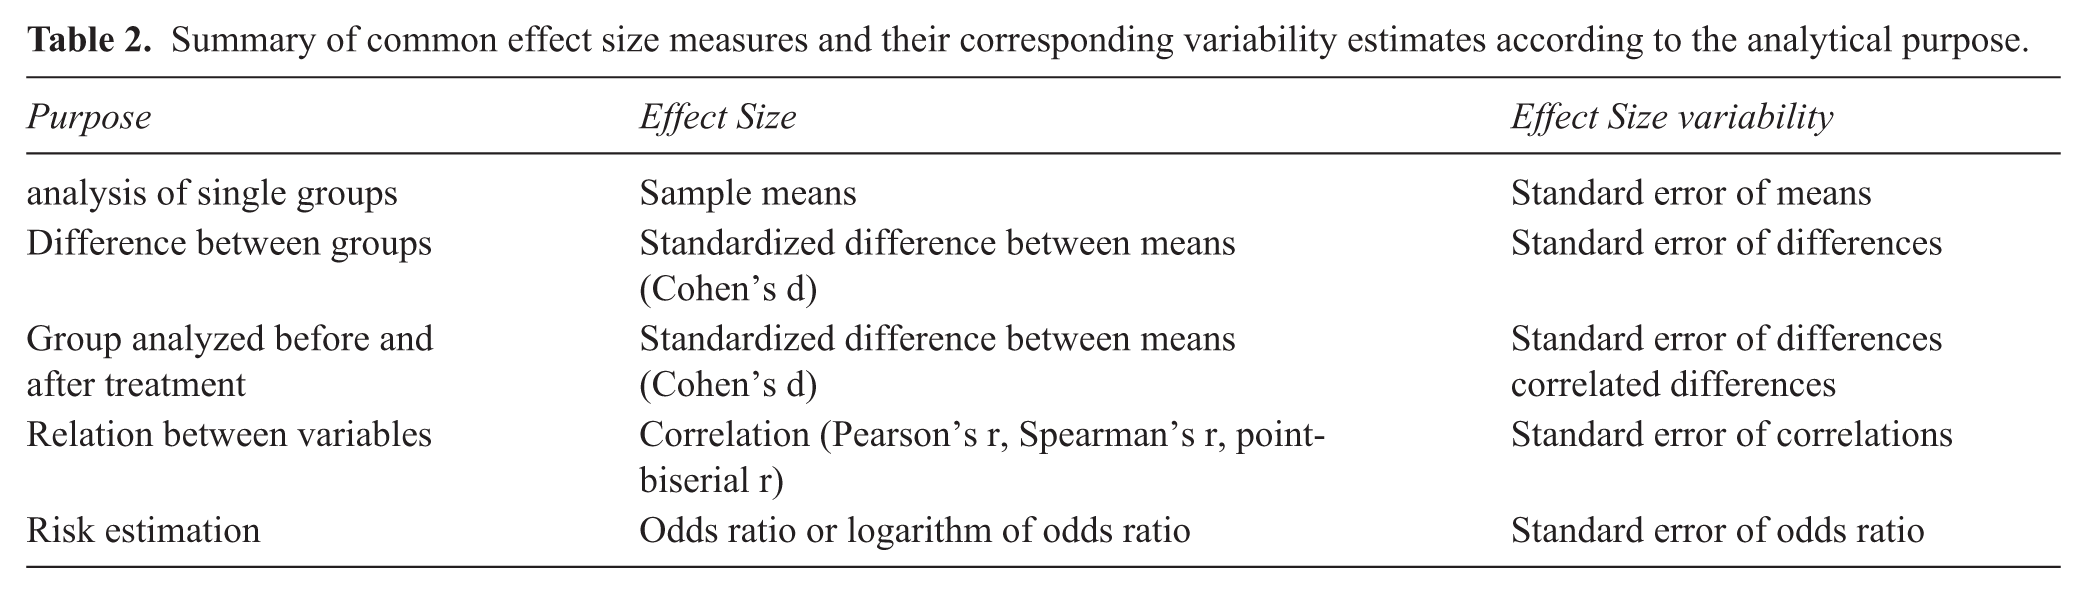
Different types of effect sizes are used depending on the research objective—whether to compare groups, assess pre- and post-treatment differences within the same group, analyse relationships between variables, or estimate risk levels in specific conditions. In addition to reporting ESs, meta-analyses must also account for their variation to ensure the robustness of findings. Table 2 presents the primary types of effect sizes used in meta-analysis along with their corresponding variability indices.
Summary of common effect size measures and their corresponding variability estimates according to the analytical purpose.
In some cases, effect sizes (ESs) are adjusted to minimize biases arising from various factors. These include sampling bias, which is more pronounced in small samples (n < 30), measurement error, which relates to test reliability (e.g., Cronbach’s alpha), and range restriction, which occurs when studies include highly homogeneous samples or participants with specific characteristics (e.g., only women, only elderly individuals, or those with a particular syndrome).
Another critical aspect of meta-analysis is heterogeneity analysis. Effect sizes can vary significantly across studies, sometimes even producing contradictory results. In certain cases, a treatment’s effect may be negative, leading to a wide range of true effects, from strongly negative to strongly positive values. Heterogeneity often arises due to differences in study populations (e.g., individuals with varying diagnoses), methodologies, or treatment techniques. Since greater variability reduces the validity of a meta-analysis and limits the generalizability of its findings, it is crucial to account for and assess heterogeneity. The two main sources of heterogeneity are:
Statistical heterogeneity can be assessed by calculating some specific indexes that are:
Cochran’s Q;
Higgins and Thompson’s I2 statistic;
The H2 statistic;
Heterogeneity variance τ2.
Cochran’s Q statistic is a weighted sum of squared differences between the observed effect sizes (ESs) of individual studies and the overall mean ES. The value of Q increases as the number of studies and sample sizes grow, meaning that a higher Q value is more likely in larger meta-analyses. Due to this dependency, alternative heterogeneity indices are often preferred.
One such index is I², which represents the percentage of variability in ESs that cannot be attributed to sampling error. It quantifies how much the observed Q exceeds the expected Q under the assumption of no heterogeneity. I² is typically reported as a percentage, where 25% indicates low heterogeneity, 50% indicates moderate heterogeneity, and 75% indicates substantial heterogeneity.
Another measure, H², is the ratio of Q to k − 1 (where k is the number of studies), reflecting the expected variance due to sampling error. Additionally, τ² quantifies the variance of the true ESs across studies, while τ represents the standard deviation of heterogeneity. The value of τ² is estimated using statistical functions in meta-analysis software, such as the DerSimonian-Laird estimator and Maximum Likelihood estimator. This index is particularly significant as it helps estimate the confidence interval for ESs, improving the precision of meta-analytic findings.
Finally, a comprehensive meta-analysis must include an assessment of publication bias. This issue arises when certain studies—particularly those with negative or non-significant findings—are missing from the analysis, potentially leading to skewed or overly optimistic conclusions.
A notable example of publication bias is found in research on the effectiveness of antidepressants for treating depression. Initial meta-analyses, based on published studies comparing antidepressants to placebo, indicated that these medications were effective. However, utilizing the Freedom of Information Act, Kirsch and colleagues (Kirsch et al., 2008) obtained previously unpublished clinical trial data submitted by pharmaceutical companies to the U.S. Food and Drug Administration. When this unpublished data was incorporated into the analysis, the perceived benefits of antidepressants over placebo were significantly reduced, revealing that their clinical advantage was minimal at best. This discrepancy occurred because journals tend to prioritize publishing studies with positive results, leading to a systematic bias in the available literature.
In meta-analysis, various techniques and procedures can help mitigate the risk of distortion caused by publication bias. These approaches fall into two main categories: methods applied during the study search process and statistical techniques used to adjust for bias.
One strategy to address missing data involves searching for grey literature, such as dissertations, preprints, government reports, or conference proceedings, as well as reviewing pre-registrations of studies. This approach helps identify studies that may not have been published due to non-significant results, thereby reducing the impact of publication bias.
On the statistical side, several methods are used to estimate the true overall ES while correcting for publication bias. The small-study effect methods are among the most widely used, based on the assumption that studies with small sample sizes are more likely to remain unpublished if they yield non-significant ESs. Conversely, when small-sample studies do report significant findings, they are more likely to be published, leading to an artificial inflation of the mean ES. To assess the likelihood of publication bias, researchers employ statistical techniques.
One of the most commonly used tools is the funnel plot, a visual method for detecting bias. A funnel plot is a scatter plot that displays observed effect sizes on the x-axis against a measure of standard error on the y-axis (typically inverted, so smaller standard errors appear higher on the graph). When no publication bias is present, the data points should form a symmetrical, upside-down funnel shape.
In addition to visual inspection, statistical tests can be used to assess asymmetry in the data. One widely used method is Egger’s t-test, which detects asymmetry in the funnel plot and provides a more quantitative assessment of publication bias.
Interpreting results: Forest plots and subgroup analyses
A forest plot visually represents the effect sizes from individual studies, showing the overall pooled effect. Figure 1 shows the typical structure in a forest plot.
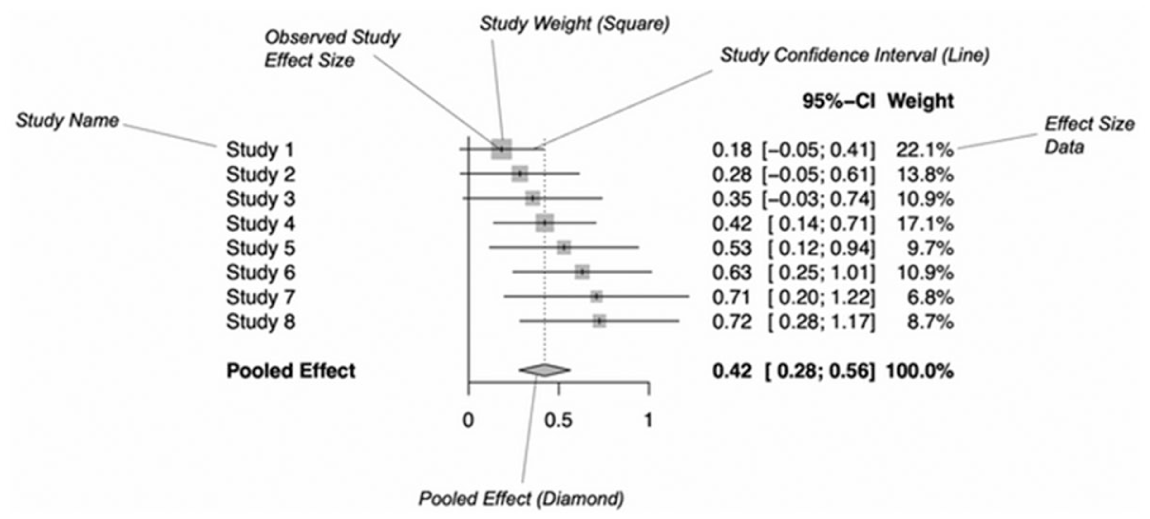
Forest plot diagram structure for meta-analysis (source: Harrer et al. 2021).
In the figure, all collected studies are listed, typically by citing the first author's surname and the publication year. For each study, a diagram visually represents the ES using either a square or a circle, with a horizontal line indicating its corresponding confidence interval. The weight of each study is reflected in the size of the square or circle, providing a visual cue about its influence in the meta-analysis. Additionally, numerical values of ESs (commonly Hedges’ g) along with their confidence intervals and percentage weights are explicitly reported.
The forest plot also displays the pooled effect size (average ES) along with its confidence interval, which helps determine whether the overall effect is significant. A pooled ES close to zero suggests a negligible or absent effect.
If high heterogeneity is detected, subgroup analyses can help identify potential sources of variability (e.g., age groups, treatment settings). Separate meta-analyses can be conducted for each subgroup, calculating distinct ESs and heterogeneity indices. However, if subgroups are small (fewer than five studies), estimating a pooled heterogeneity variance (τ²) instead of subgroup-specific values is recommended, as the latter may be biased.
To assess whether observed differences in ESs between subgroups arise from random error, statistical comparisons are performed. For example, using Cochran’s Q, if three subgroups exist, three Q values (observed Qs) are computed. The expected Q, assuming a χ² distribution with 2 degrees of freedom, is then compared with the observed Q. If the observed Q exceeds the expected Q, a significant difference in true ESs between subgroups is indicated.
The choice between fixed-effect and random-effect models depends on subgroup characteristics. If subgroups are clearly distinct, a fixed-effect model can be used to estimate differences. However, if they represent variations of a broader characteristic, a random-effects model is more appropriate.
The key principle behind subgroup analyses is that meta-analysis is not merely about calculating an average effect size, but also serves as a tool for investigating variability. Heterogeneity should not be viewed solely as an obstacle but as an informative aspect that may offer scientific insights into factors influencing treatment effects.
Why meta-analysis is useful in clinical psychology
Meta-analysis offers several benefits in clinical psychology:
An example of application of meta-analysis
We present a study that exemplifies the application of meta-analysis in clinical psychology (Altieri et al., 2024). The primary objective of this research is to determine whether therapy delivered via telephone provides comparable benefits to in-person therapy. In certain situations, individuals may be unable to attend in-person sessions due to mobility restrictions, lockdowns, natural disasters, physical or psychological impairments, or geographical distance. Despite these limitations, they still require psychological support and professional guidance. Therefore, assessing the effectiveness of telephone-based therapy is crucial to ensuring that patients continue to receive appropriate care even when traditional face-to-face interventions are not feasible. In this study, Cognitive Behavioural Therapy (CBT) is used as an example of the therapeutic approach followed by participants, but the same meta-analytic procedure can be applied to any form of psychological therapy. At the end of this example we can show how these results can be fruitful also for a group analyst approach.
First step: The PICO framework
In the first step, we defined the characteristics of our study according to the PICO framework.
- Populations: people with chronic physical illness or mental illness;
- Intervention: CBT delivered by telephone;
- Control: people receiving the therapy in the usual way (TAU) or face-to-face therapy;
- Outcome: people receive a benefit which has the same level of quality of face-to-face therapy.
Second step: Inclusion and exclusion criteria
The inclusion criteria for our study were:
Paper written in English;
Samples with adult persons;
Patient with chronic physical illness or psychological illness;
Presence of a sample undergoing telephone-based CBT (T-CBT);
Presence of, at least, one of the following control groups: TAU group, waiting list or face-to-face CBT (CBT group);
Presence of data or measures to estimate ESs.
We also formed sub-groups based on variables and characteristics that may influence the outcomes of the collected data. These sub-groups consisted of patients with the following primary psychological conditions or traits: anxiety, coping ability, depression, mental or physical quality of life, sleep disturbances, and excessive worry.
Third step: Data extraction and analysis
The analysis was conducted by extracting standardized differences between means. The studies reported the means for patients who received therapy via telephone and those who received standard treatment (treatment as usual or face-to-face CBT). For each subgroup, the ES was estimated, along with an overall ES. An ES > 0 indicates greater efficacy of T-CBT compared to traditional face-to-face therapy.
Cochran’s Q and I² statistics were used to assess interstudy heterogeneity, while publication bias was also evaluated. The results for each subgroup were as follows:
- For patients with anxiety, the mean ES was 0.57 (moderate effect size), with no significant heterogeneity or publication bias;
- For coping strategies, the mean ES was 0.20 (small effect size), with no significant heterogeneity or publication bias;
- For mental health-related quality of life, the mean ES was 0.33 (small effect size), with no significant heterogeneity or publication bias;
- For physical quality of life, the mean ES was not significant, with significant heterogeneity but no significant publication bias;
- For sleep disturbances, the mean ES was 0.37 (small effect size), with moderate heterogeneity and no significant publication bias;
- For worry, the mean ES was 0.43 (small effect size), with no significant heterogeneity or publication bias;
- For patients with depression, the mean ES was 0.84 (large effect size), with high heterogeneity but no significant publication bias.
When combining all subgroups, the overall ES was significant and moderate (ES = 0.66). Therefore, the study concludes that telephone therapy is as effective as face-to-face therapy, although its efficacy may not be generalized to all cases (for individuals with physical issues, telephone therapy was found to be less effective)
Fourth step: Key outcomes most relevant to group analysis
From a group-analytic perspective, several outcomes of the meta-analysis are particularly meaningful because they resonate with core elements of the matrix and relational processes central to group analysis:
- Depression (ES = 0.84) shows the strongest improvement. This aligns with evidence that depressive states respond well to interventions that strengthen belonging, stimulate participation in the group field, and provide corrective relational experiences within the dynamic matrix (Burlingame et al., 2013).
- Anxiety (ES = 0.57) and worry (ES = 0.43) demonstrate moderate effects, reflecting the group’s role in offering containment, shared regulation, and resonance within the foundation matrix, where anxieties can be expressed, mirrored, and metabolized (Lorentzen and Høglend, 2004).
- Coping (ES = 0.20) and mental health–related quality of life (ES = 0.33) show smaller but clinically relevant effects that correspond to group-analytic mechanisms such as identification, interpersonal learning, and the gradual restructuring of meanings within the group-as-a-whole (Kivlighan and Miles, 2007).
- Physical quality of life, which did not improve significantly, highlights the limits of psychotherapeutic processes when outcomes are primarily determined outside the relational matrix (Cuijpers et al., 2008).
Overall, the outcomes most aligned with group-analytic change processes are those involving emotional regulation, depressive symptoms, and relationally mediated coping—domains where the matrix facilitates transformation through dialogue, resonance, and shared understanding.
Meta-analysis as a driver of advancement in group analysis
Within group analytic practice—grounded in Foulkes’s matrix concept and the group‑as‑a‑whole perspective—therapeutic processes are multi‑layered, emergent, and context‑sensitive; this very complexity makes cumulative, quantitative synthesis especially valuable. Meta-analysis can aggregate outcomes across diverse group settings and populations, estimate pooled effects, and model heterogeneity, thereby clarifying what works for whom in group therapy beyond single‑study constraints. In clinical psychology more broadly, meta-analysis provides standardized effect sizes, formal tests of heterogeneity (e.g., Q, I², τ²), and publication‑bias diagnostics that strengthen evidence claims; these methodological features translate naturally to the group analytic field, where moderators such as diagnosis, group format, and relational variables (e.g., cohesion/alliance) often shape results. Empirically, meta-analytic reviews consistently show that group psychotherapy is efficacious across inpatient and outpatient contexts, with outcomes comparable to individual therapy and superior to minimal treatment, while also revealing diagnostic patterns (e.g., mood disorders showing larger effects) that inform indication and tailoring; such findings provide a robust empirical scaffold for the development of group analytic guidelines and training. Moreover, targeted meta-analyses demonstrate that core relational processes central to group analysis—especially cohesion within the matrix—exhibit reliable, moderate associations with clinical improvement, underscoring the value of research‑informed facilitative interventions to cultivate the group field (e.g., enhancing interaction, structuring sessions) in both inpatient and outpatient groups. From GASi’s vantage point as the international home of group analysis—historically rooted in Foulkes’s London seminars and carried forward through lectures, winter workshops, and symposia—there is explicit institutional emphasis on bridging theory and research. Recent GASi programs (e.g., the 48th Winter Workshop, From Theory to Practice: Applications of Group Analysis in Research Field) spotlight meta-analysis as a methodological tool for evaluating psychotherapeutic effectiveness in group contexts, signaling the Society’s endorsement of rigorous synthesis to inform practice, pedagogy, and future inquiry. In this light, meta-analysis contributes to the development and evolution of group analysis by (a) identifying transdiagnostic and diagnosis‑specific effects relevant to matrix dynamics, (b) quantifying moderators (e.g., group composition, cultural/foundation matrices, dosage, theoretical orientation) to refine indications, (c) integrating relational/process variables (e.g., cohesion) into outcome models, and (d) surfacing research gaps that orient GASi’s training and agenda-setting toward designs capable of capturing the social unconscious and large‑group phenomena that characterize group analytic work (Burlingame et al., 2018; Kösters et al, 2006). Finally, illustrative applications—such as meta‑analytic evaluations of tele‑delivered CBT and mood‑disorder groups—show how synthesis can test format innovations and inform equitable access strategies without compromising group analytic principles, thereby advancing both scientific credibility and clinical reach of the discipline.
Conclusion
Meta-analysis is an essential tool in clinical psychology, enabling a more comprehensive evaluation of therapeutic effectiveness by synthesizing data from multiple studies. Through careful study selection, rigorous statistical analysis, and critical interpretation of results, meta-analysis offers valuable insights that enhance patient care and drive progress in psychological research. As evidence-based practice becomes the gold standard in psychology, meta-analysis remains a cornerstone for informing clinical decisions and shaping the future of mental health treatments.