






Abstract
Using 48,403 observations from the National Survey of College Graduates, this article examines the racial salary disparity between Black and White college graduates. We find that academic major and first higher education institution influence one’s final occupation, which in turn affects the salary disparity between Blacks and Whites. We suggest that public policy builds awareness among high school students aspiring for college of the importance of preparing for specific academic majors that lead to occupations expected to maintain an earnings premium.
Introduction
According to the Center on Education and the Workforce (CEW) at Georgetown University, college graduates, on average, earn 84 percent more than high school graduates over a lifetime (Carnevale, Strohl, Melton, 2011). In addition, since 1980, the income premium accruing to college graduates, in relation to high school graduates, has continued to increase (Gongloff, 2015). Not surprisingly, therefore, the CEW reports that the proportion of workers having completed a bachelor’s degree increased from 28% to 34% of the labor force since 1992. Moreover, since the most recent recession, people without a college degree have incurred the steepest declines in wage growth (Gongloff, 2015). Similar findings motivate well-intentioned advice and policy prescriptions encouraging college enrollment. Most reports, however, ignore highly relevant implications associated with variation in academic major and occupation when reporting the average salary of college graduates. As a result, it is very likely that high school graduates engage in decisions pertaining to higher education opportunities, at best, with incomplete information, or, at worst, with misinformation.
Expectations of the monetary rewards for completing college appear color blind. The U.S. Census Bureau (2013) reported that the proportion of Blacks completing college between 1970 and 2011 increased from 4.4% to 22.5%, whereas the proportion of Whites completing college increased from 11.3% to 32.8% during the same period. More Blacks and Whites are completing college, but the rate of increase among Blacks is substantially more than Whites. If, as generally believed, education, especially a college education, contributes to human capital, then Blacks have accumulated human capital at twice the rate of Whites. The economic benefits should, therefore, be observable four decades into the process. Accordingly, we expect gains in educational attainment to narrow racial salary discrepancies.
This study explores the persistence of observed racial salary disparity despite substantial gains in educational attainment by Blacks. Building on previous research findings revealing that occupation contributes to the salary disparity, we examine how completion of a college major affects the opportunity set of occupations available to college graduates. Although gender differentials are identified and discussed, this study focuses on racial disparities.
In the next section, we review the literature pertaining to racial salary disparity, specifically the role of a college education. We then use data rich in education details of college graduates to examine the relationship between major and occupational choice and, ultimately, salary. Controlling for accumulation of human capital has a limited impact on racial salary disparity. However, we find that the coefficient on race becomes positive and statistically significant after controlling for occupation in an endogenous model. In contrast, gender disparity remains substantial. The empirical results suggest that the racial differential is due to a complexity of issues. Occupational situation has an effect in reducing salary gaps in some occupations, but not others. The gender gap is persistent, regardless of the model used.
Literature Review
An extensive literature confirms the racial wage disparity observed between Whites and Blacks (Barrow & Rouse, 2006; Benedict & McClough, 2010; Blau & Ferber, 1987; Darity & Mason, 1998; Kim, 2009). A common empirical approach calculates the return on additional years of schooling. Using the 1980 Census of Population and Housing data collected by the U.S. Census Bureau, Nord (1986) distinguished years of schooling and years of college to compare wages within gender and across race. He finds that the premium to the variable years of college reduces the wage differential between Black and White males. However, years of college is associated with a 60% larger return to Black females compared with White females, leading to increased wage inequality for females. Mantell (1974) observed increasing educational requirements for engineering occupations and concludes that educational attainment serves as a screening mechanism used to discriminate against uneducated applicants, who may indeed be capable of performing the job.
A separate thread of the literature challenges the specification of education as an input variable and substitutes a measure of ability as an explanatory variable (Blackburn, 2004; Neal & Johnson, 1996; O’Neill, 1990; Urzua, 2008). Neal and Johnson (1996) noted that Black children underperform on standardized exams compared with White children in the same grade, and thus concluded that years of schooling is an unsatisfactory control measure in earnings regressions. The Armed Forces Qualification Test (AFQT) is used to control for skill, which the authors of the article contend to be racially unbiased and positively correlated with job performance. Using the AFQT rather than years of schooling narrows salary disparity. The exclusion of schooling decisions, however, denies an opportunity to examine how differences in educational decisions explain labor market outcomes. Goldsmith, Darity, and Veum (1998) challenged studies that use the AFQT to suggest the absence of race-based discrimination. Empirically, Goldsmith et al. included measures of psychological capital, defined as personality traits that affect worker productivity. The authors find that when using their measure of psychological capital, the coefficient associated with being Black is negative. Rogers and Spriggs (1996) assumed that AFQT scores are endogenous to wages and find that AFQT scores are race-biased measures of job skills. Thus, AFQT scores are not necessarily helpful in explaining wage or salary differences between Black and White groups.
O’Gorman (2010) found that nearly one half of the earnings gap between Blacks and Whites is explained by the disparity in accumulated human capital. O’Gorman models human capital accumulation as a function of public education funding. The results of the analysis may explain the absence of expected gains accruing to Blacks even when the observed gap in the proportion of Blacks and Whites completing high school is reduced. It may be that Black high school graduates earn relatively lower pay because they have accumulated, on average, less human capital than White graduates. The present study examines the racial salary disparity of college graduates; however, O’Gorman’s result suggests that Blacks, on average, may be disadvantaged heading into college. The implication of this possibility is that Black college students, on average, may be less prepared or unprepared for more demanding college majors correlated with higher paying occupations. A second implication may be that Black high school graduates, on average, may be disproportionately underrepresented at more selective and prestigious colleges associated with higher earnings (Brewer, Eide, & Ehrenberg, 1999).
Blacks, on average, enroll in lower tier colleges and universities (Karen, 2002). Dickerson and Jacobs (2006) found that Blacks graduate from characteristically less selective colleges and universities. Long (2010) used three longitudinal data sets to track individuals during the 1970s, 1980s, and 1990s, and found an earnings premium associated with additional education and quality of institution. 1 To assess the impact of quality of institution on earnings, Long developed an index of quality to study respondent outcomes 10 years after high school graduation. 2 For all three age cohorts examined, attending higher quality colleges and universities increases the probability of completing college and is associated with higher earnings. The implication of these findings is important for the racial salary gap. If Whites disproportionately attend characteristically more selective colleges, which, on average, are associated with higher salaries, then the gains in measures of educational attainment achieved by Blacks in recent decades cannot be expected to eliminate the racial salary gap. Indeed, despite steeper gains in educational attainment by Blacks, the racial salary gap is expected to widen.
Weinberger (1998) used the 1985 Survey of Recent College Graduates to examine wage gaps among college graduates 1 to 2 years after graduation. The data offer a unique opportunity to control for educational attainment and labor market experience associated with worker productivity. Limiting the sample to recent graduates may limit the unobserved effects of institutional or systemic discrimination that may occur over time, if Whites secure jobs with greater promotional opportunity upon entry into the labor market (Gyimah-Brempong & Fichtenbaum, 1993; Mason, 1996). Weinberger controlled for 246 narrowly defined academic majors and 388 distinct institutions and finds that White men receive a 9% premium compared with Black men and a 15% to 25% premium compared with Black women.
Studies find that the choice of a college major matters in explaining variation in wages (Benedict, McClough, & Hoag, 2012; Grogger & Eide, 1995; James, Alsalam, Conaty, & To, 1989; Loury & Garman, 1995). Arcidiancono (2004) explored whether differences in ability or academic major explain observed differences in earnings. He finds that ability differences across academic majors correlate with wage variation, but he does not find that sorting across academic major is explained by earnings; thus, he concludes that selection of major is primarily due to individual preferences. Evidence that preferences may influence choice of major may help to explain data presented by Carnevale et al. (2011) who indicated that three of the 10 most popular majors among Blacks are also among the 10 majors with the lowest median income.
In addition to controlling for academic major, studies control for occupation to examine racial wage disparity (Blinder, 1973; Gill, 1994). Bjerk (2007) used the National Longitudinal Survey of Youth 1979 to examine racial wage inequality by occupation. Bjerk found that racial differences are smaller among white-collar compared with blue-collar occupations. Semyonov and Lewin-Epstein (2009) used Integrated Public Use Microdata Series from the U.S. Census data containing the five decennial censuses from 1960 to 2000 to examine how education and occupation affect the racial earnings disparity. Semyonov and Lewin-Epstein find that the private sector exhibits more inequality than the public sector, which they attribute to stricter hiring rules in the public sector that ensure Blacks’ access to higher paying jobs. Accordingly, if the public-private sector distinction matters, it may influence the decision making of qualified Black college graduates seeking employment regardless of occupation.
Empirical studies consistently confirm the positive relationship between a college education and earnings. Studies find that the academic major and quality of institution contribute to racial earnings disparity. This study contributes to the existing literature by examining racial salary disparity among a broad sample of college graduates. By examining a broad sample of workers at various points in their working lives, we expect that the observed initial effect attributable to graduating from prestigious institutions will be mitigated over time as graduates are rewarded based on productivity, occupation, and sector, regardless of academic major.
The National Survey of College Graduates (NSCG) and Subsequent Analysis
The NSCG, sponsored by the National Science Foundation, is a “once in a decade opportunity” to examine the educational and career characteristics of college graduates. The 2003 NSCG surveyed a random sample of individuals living in the United States, under the age of 76, who had received an associate’s degree or higher prior to the new millennium (e.g., NSF, 2003). The public-use sample includes data on 100,042 individuals, of which 65,048 are self-identified as White or Black.
The NSCG includes a rich set of information on individual and job-related characteristics. Our analysis includes full-time employed White and Black individuals who have all data used in the analysis. We eliminate those individuals who work part-time, are employed outside the United States, or are missing data on the variables used in the analysis. 3 Excluding part-time workers affects White women most (see Table A1 of the appendix). Although Black males are slightly more likely to omit undergraduate education information, both Black males and Black females are slightly more likely to work outside of the United States. The final sample contains 48,403 observations, of which 43,789 are White and 4,614 are Black. Table A2 reports the sample means and standard deviations for the variables used in the analysis.
Earlier NSCG data sets have been used to examine income disparity based on occupation, gender, and race (D. Black, Haviland, Sanders, & Taylor, 2006; Morgan 2008). Morgan (2000) was unable to find evidence among engineers of income disparity based on gender. Prokos and Padvic (2005) did not find evidence to support a “glass ceiling” hypothesis limiting opportunities for women in engineering and science occupations. Although the focus of these studies is narrow across a limited number of occupations, these results can also be seen to support other research findings that gender-based income disparity is more likely among workers with lower levels of education. Baker (2002) used the data to examine the influx of women into the legal profession. He concluded that the economic rewards of the legal profession may explain the disproportionate increase in law school enrollment among women in contrast to alternative postbachelor options. This finding is interesting in that it implies a rational calculation by women in particular to pursue occupations based on objective measures of economic outcomes. Robst (2007a, 2007b) examined the pairing of academic major and subsequent employment and found that earnings are higher when the academic major is perceived as closely related to employment. While Robst focused on matching academic majors with a job, D. A. Black, Sanders, and Taylor (2003) found that economics majors earn more, on average, than all but engineering majors. Using nonparametric estimation on the 1993 NSCG, D. A. Black, Haviland, Seth, Sanders, and Taylor (2008) matched data by race and gender on premarket factors, including education, age, and major. The results revealed that the raw wage gap by race or gender becomes very small once controlling for these factors and English-speaking skills.
We first analyze salary with a semilog regression model, adding controls for regions, demographic characteristics, educational characteristics, employer characteristics, and occupation. Previous studies use these controls when investigating salary disparity. Definitions can be found in Table A2. The model is as follows:

where
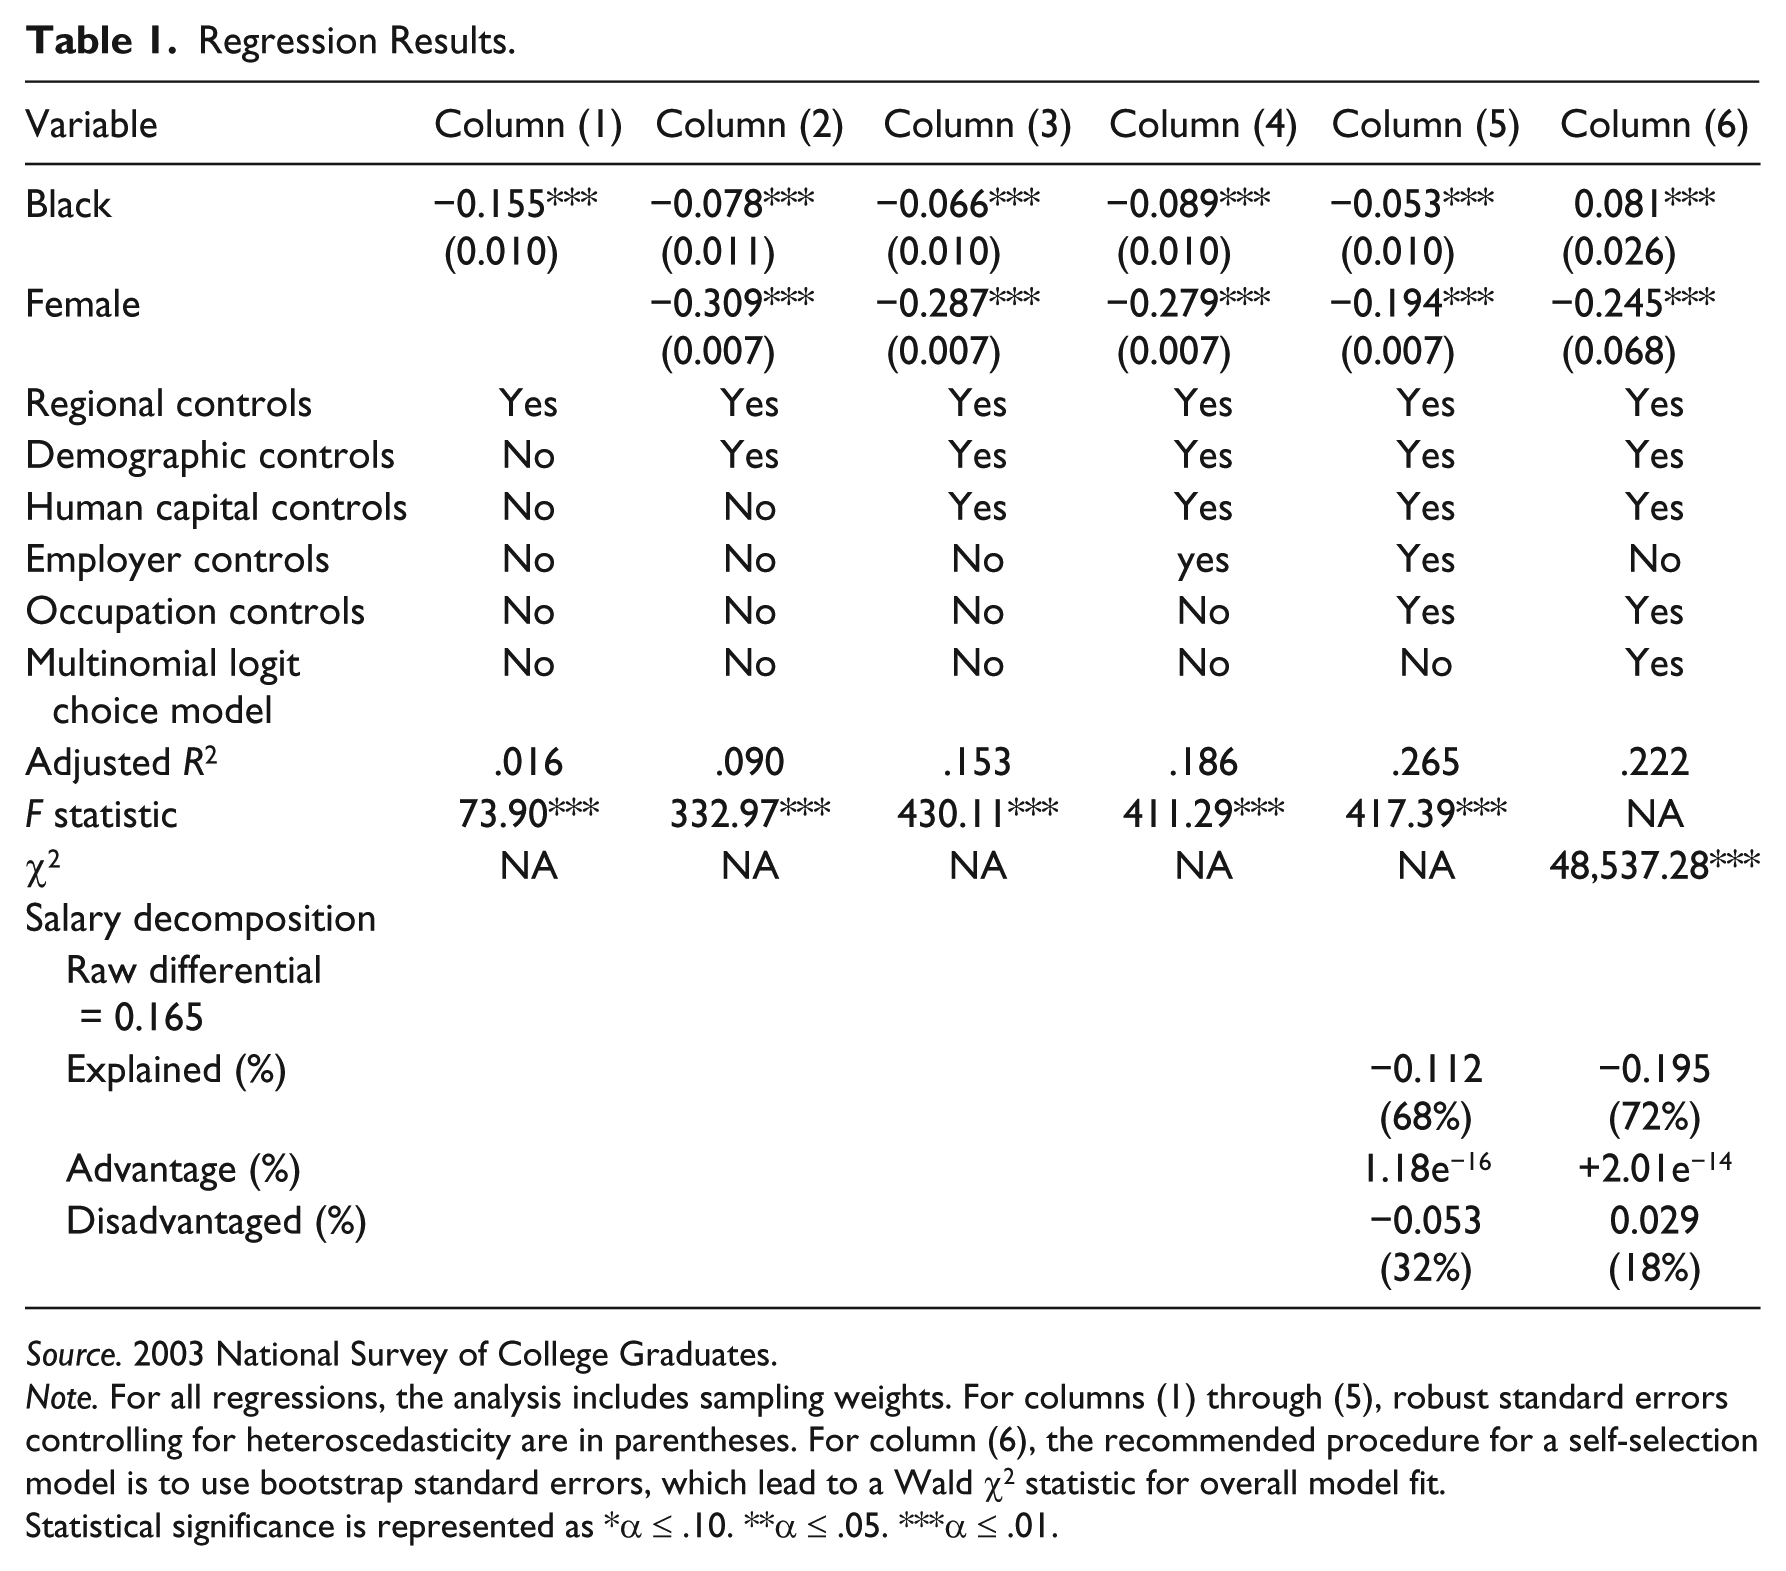
Table 1 presents results from several regressions controlling for race and using the traditional semilog functional form for salary regressions. Note that the raw salary differential between Whites and Blacks for the sample is 0.165, indicating that Blacks earn an average salary that is 16.5% less than Whites when no control variables are included in the regression. Including regional controls reduces the differential to 15.5% (column (1)). Including demographic controls for gender, marital status, and number of children reduces the differential by nearly half, to 7.8% (column (2)). The coefficient on Female indicates a 31% gender disparity. Combined with the coefficient on Black, the estimates indicate that Black females earn 38.7% less than their White male counterparts.
Regression Results.
Source. 2003 National Survey of College Graduates.
Note. For all regressions, the analysis includes sampling weights. For columns (1) through (5), robust standard errors controlling for heteroscedasticity are in parentheses. For column (6), the recommended procedure for a self-selection model is to use bootstrap standard errors, which lead to a Wald χ2 statistic for overall model fit.
Statistical significance is represented as *α ≤ .10. **α ≤ .05. ***α ≤ .01.
Greater accumulation of human capital among Blacks is expected to raise salaries and to reduce the disparity between Black and White college graduates. Additional regressions controlling for degree attainment, work experience, and firm-specific skills are specified to explore the impact of human capital. Degree attainment refers to the highest attained degree such as an MA, PhD, or professional degree (e.g., JD, MD, and MBA). Work experience is measured using years since highest attained degree, whereas firm-specific skills are measured using years at current job. Squared terms for time-related variables are included to capture the nonlinear relationship of experience to salary. Column (3) shows that human capital variables reduce the racial salary differential to 6.6%, which suggests that the impact of human capital is small relative to that of demographic characteristics. Human capital variables reduce the racial salary gap by 1.2 and the gender differential by 2.2 percentage points.
The next set of controls examines how employer characteristics affect the salary differential. Brown and Medoff (1989) found that larger employers, on average, pay higher salaries. Likewise, the public sector, on average, pays less compared with the private sector, especially in those occupations requiring a college degree or a postbaccalaureate degree (Falk, 2012; Keefe, 2012). Adding binary controls for employer size and for federal or state government employment, excluding higher education, the differential rises to 8.9%.
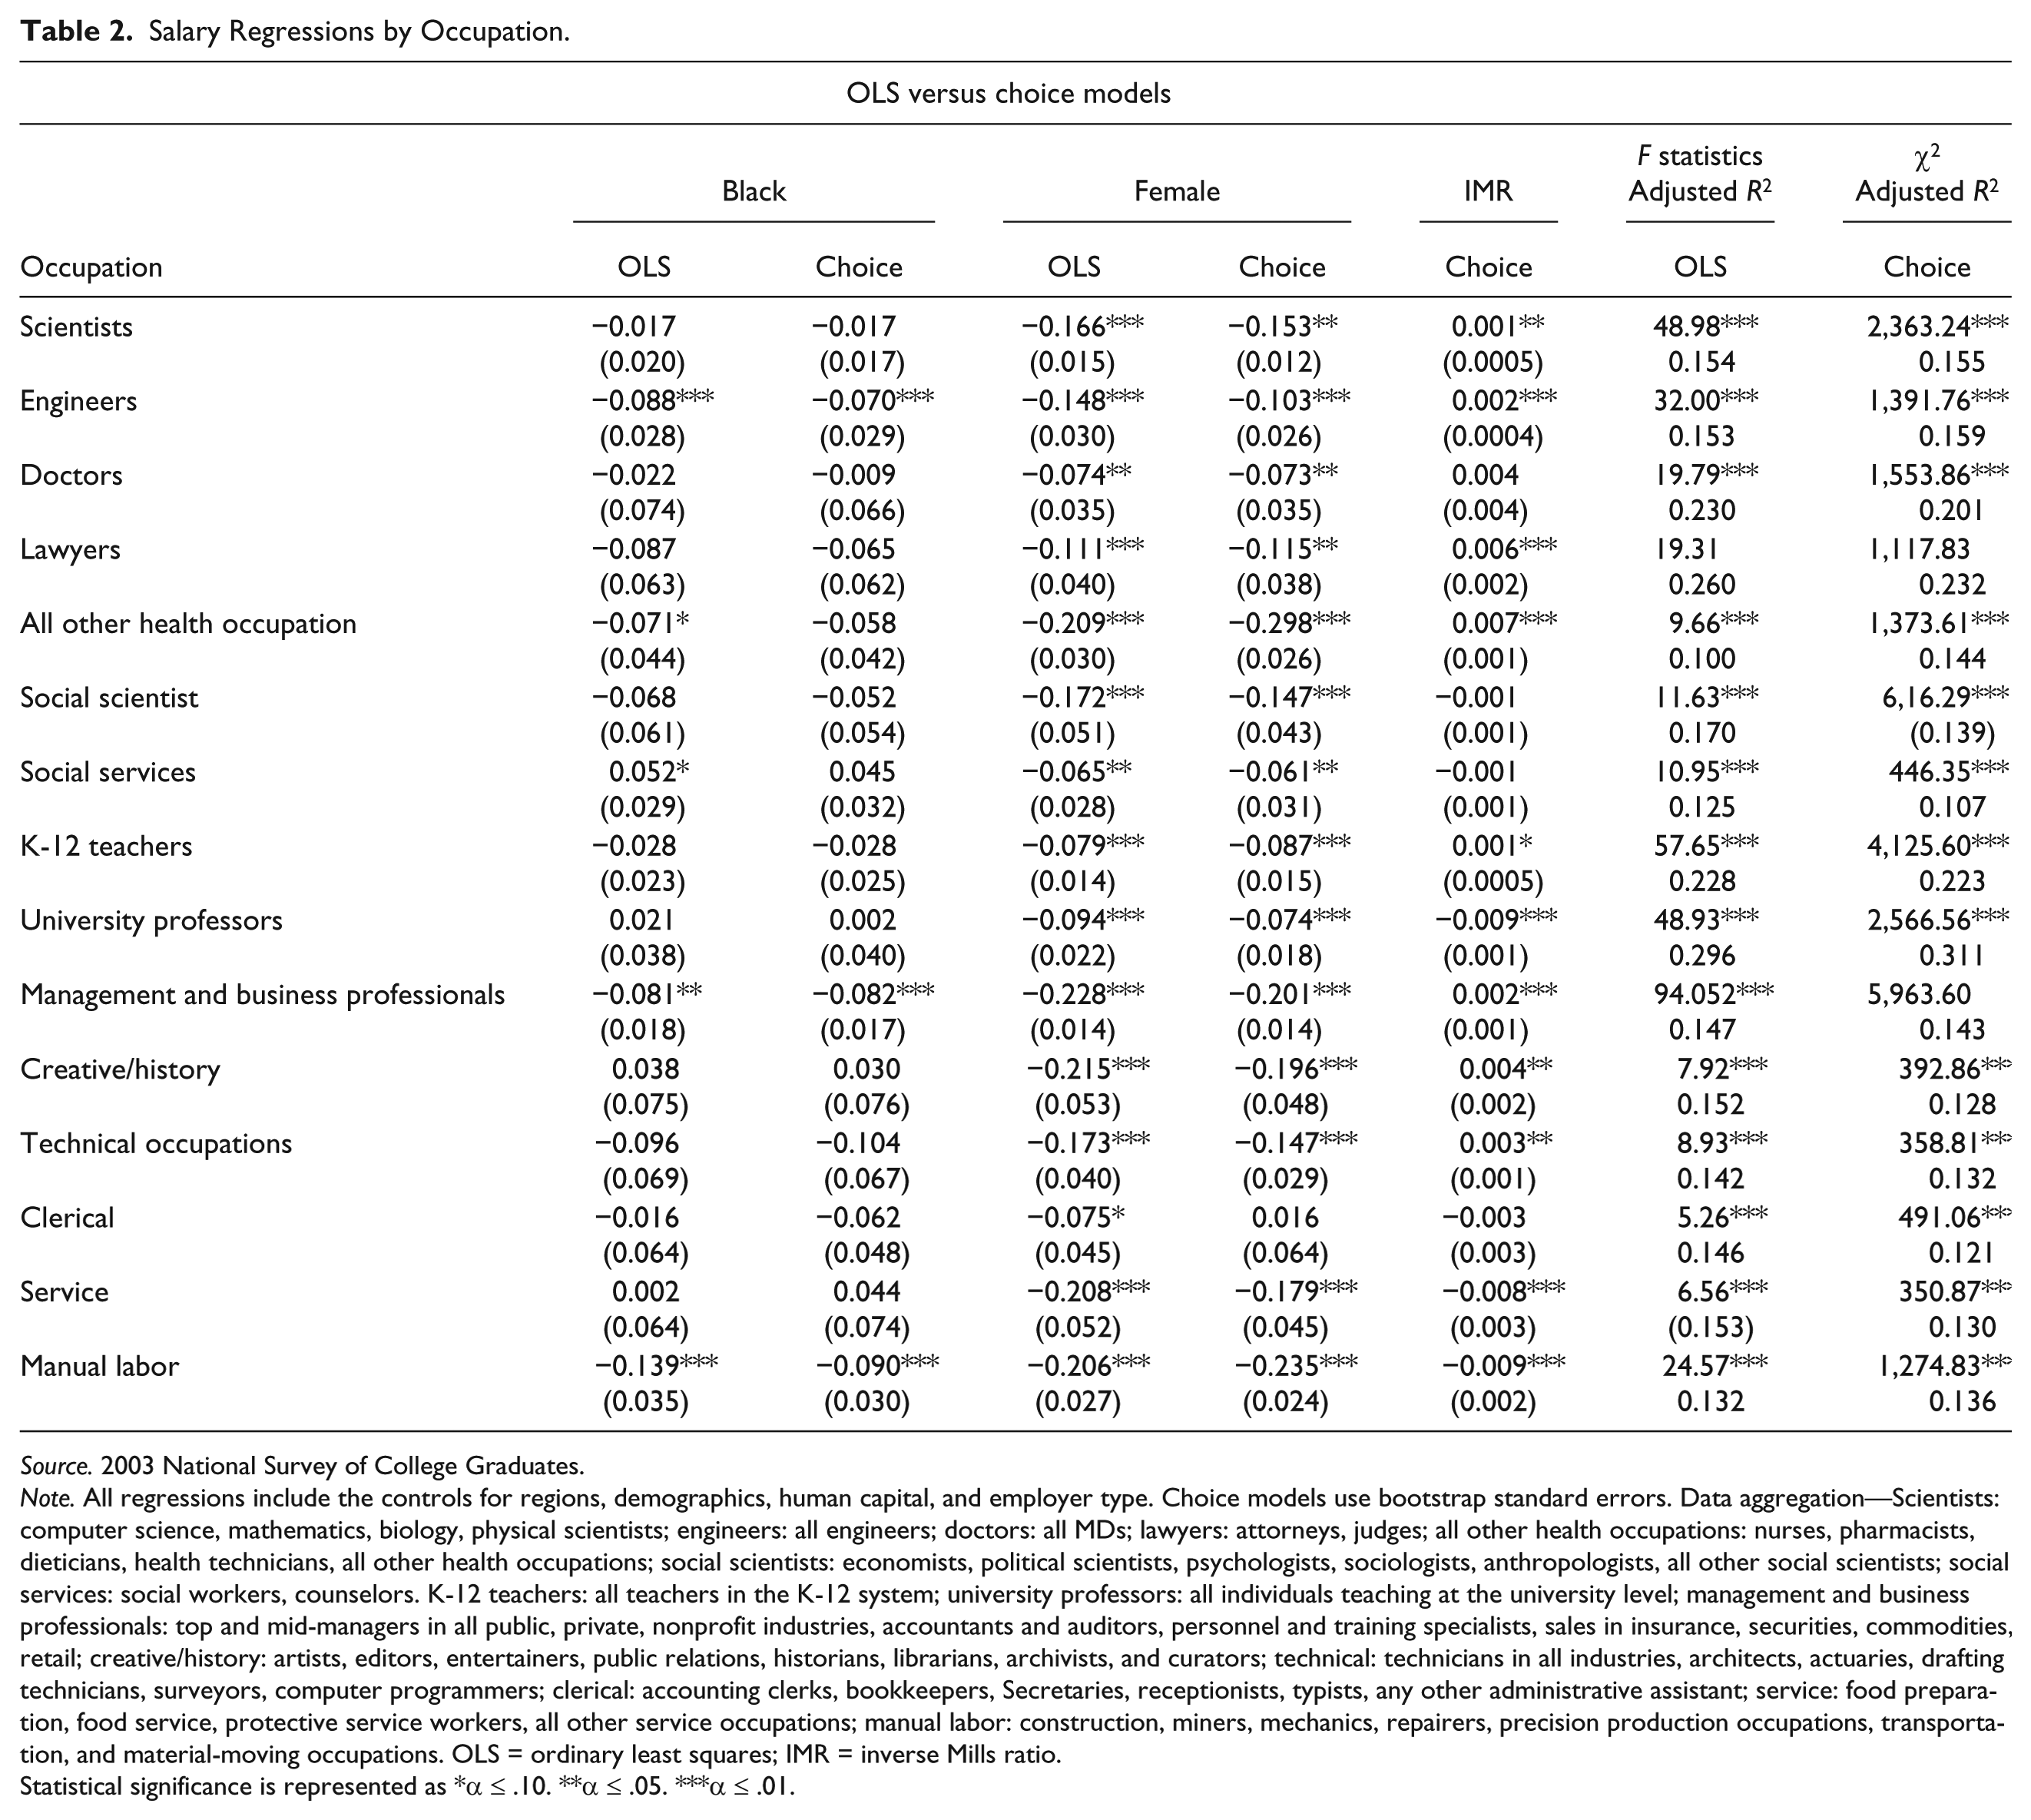
We next turn to how occupational differences may lead to salary differentials. Due to the small numbers of Blacks and women in detailed occupational categories, occupations were aggregated into 15 categories. 4 Details about the groupings are found in the footnote to Table 2.
Salary Regressions by Occupation.
Source. 2003 National Survey of College Graduates.
Note. All regressions include the controls for regions, demographics, human capital, and employer type. Choice models use bootstrap standard errors. Data aggregation—Scientists: computer science, mathematics, biology, physical scientists; engineers: all engineers; doctors: all MDs; lawyers: attorneys, judges; all other health occupations: nurses, pharmacists, dieticians, health technicians, all other health occupations; social scientists: economists, political scientists, psychologists, sociologists, anthropologists, all other social scientists; social services: social workers, counselors. K-12 teachers: all teachers in the K-12 system; university professors: all individuals teaching at the university level; management and business professionals: top and mid-managers in all public, private, nonprofit industries, accountants and auditors, personnel and training specialists, sales in insurance, securities, commodities, retail; creative/history: artists, editors, entertainers, public relations, historians, librarians, archivists, and curators; technical: technicians in all industries, architects, actuaries, drafting technicians, surveyors, computer programmers; clerical: accounting clerks, bookkeepers, Secretaries, receptionists, typists, any other administrative assistant; service: food preparation, food service, protective service workers, all other service occupations; manual labor: construction, miners, mechanics, repairers, precision production occupations, transportation, and material-moving occupations. OLS = ordinary least squares; IMR = inverse Mills ratio.
Statistical significance is represented as *α ≤ .10. **α ≤ .05. ***α ≤ .01.
As shown in Table 1, column (5), adding occupational controls to the ordinary least squares (OLS) regression reduces the salary differential by almost 4 points to 5.3%. It also lowers the differential for women by over 8 points, to 19.4%. This percentage is close to the 21.9% gender gap found by D. A. Black et al. (2008) using the 1993 NSCG. Note that because the combined reduction is 12 percentage points, educated Black women seem to get a higher financial return compared with Black men due to occupational outcomes.
It seems unlikely that occupational outcomes are determined without salary consideration and a number of papers have suggested a selection model to account for the correlation between occupation and the error term in the salary equation (e.g., Huesca & Camberos, 2010; Nasir, 2005). This analysis uses a two-step procedure to estimate the probability that an individual is situated in an occupation; in the second step, the information from this first step corrects for bias in the salary regression due to the unobservable characteristics that connect wages to occupations. The two-step modeling makes intuitive sense because it accounts for the endogeneity in the salary regression.
We follow Bohara and Krieg (1998) who used the Durbin and McFadden method to estimate salary, given several choices associated with migration and salary. Our model begins with two equations:


The first equation represents the salary function; the second represents the occupation function. The s-subscript represents M occupational categories; the x and z are assumed exogenous. We also assume that

In the context of occupation and salary, we only observe the actual salary outcome if we observe a particular occupation. The probability of a particular occupation can be estimated with a multinomial logit:

Following Bohara and Kreig (1998), the selectivity equation is

where Φ is the normal probability function and F is the cumulative density function. Think of this last term similar to the inverse Mills ratio (IMR) as first noted by Heckman (1979) and
We estimate the probabilities of an individual obtaining employment from the same set of 15 occupational categories used earlier by controlling for a set of academic majors and type of school for the first bachelor’s degree, using the Carnegie classification of schools. We also include controls for race, gender, and highest degree attainment.
How different are academic disciplines by race and gender for our sample? Table A2 includes the percentages of Blacks and Whites for the variables in question. Black and White educated individuals tend to have different rates of employment in the hard sciences and engineering, where Whites have higher rates, and social services, K-12 teaching, and manual labor, where Blacks have higher rates.
The school-type controls identify whether the bachelor’s degree was awarded by a school designated as a research institution, a doctoral degree–granting institution, a professional school (a stand-alone medical, health, law, or engineering institution), or a specialty school (e.g., music, art or design school, or a divinity institution). The omitted category includes all other types of schools (comprehensive and liberal arts). The descriptive statistics for school type listed in Table A2 demonstrate that Blacks are more likely to attend comprehensive (42%) or liberal arts (18%) institutions compared with Whites and less likely to be in Research I and II schools (24%). While we cannot state firmly that Blacks enroll in lower quality institutions, we do observe that Black students tend to enroll in institutions requiring less faculty research. While faculty research requirements are not the sole determinant of institutional quality, we suspect that quality and reputation are positively correlated with faculty research requirements.
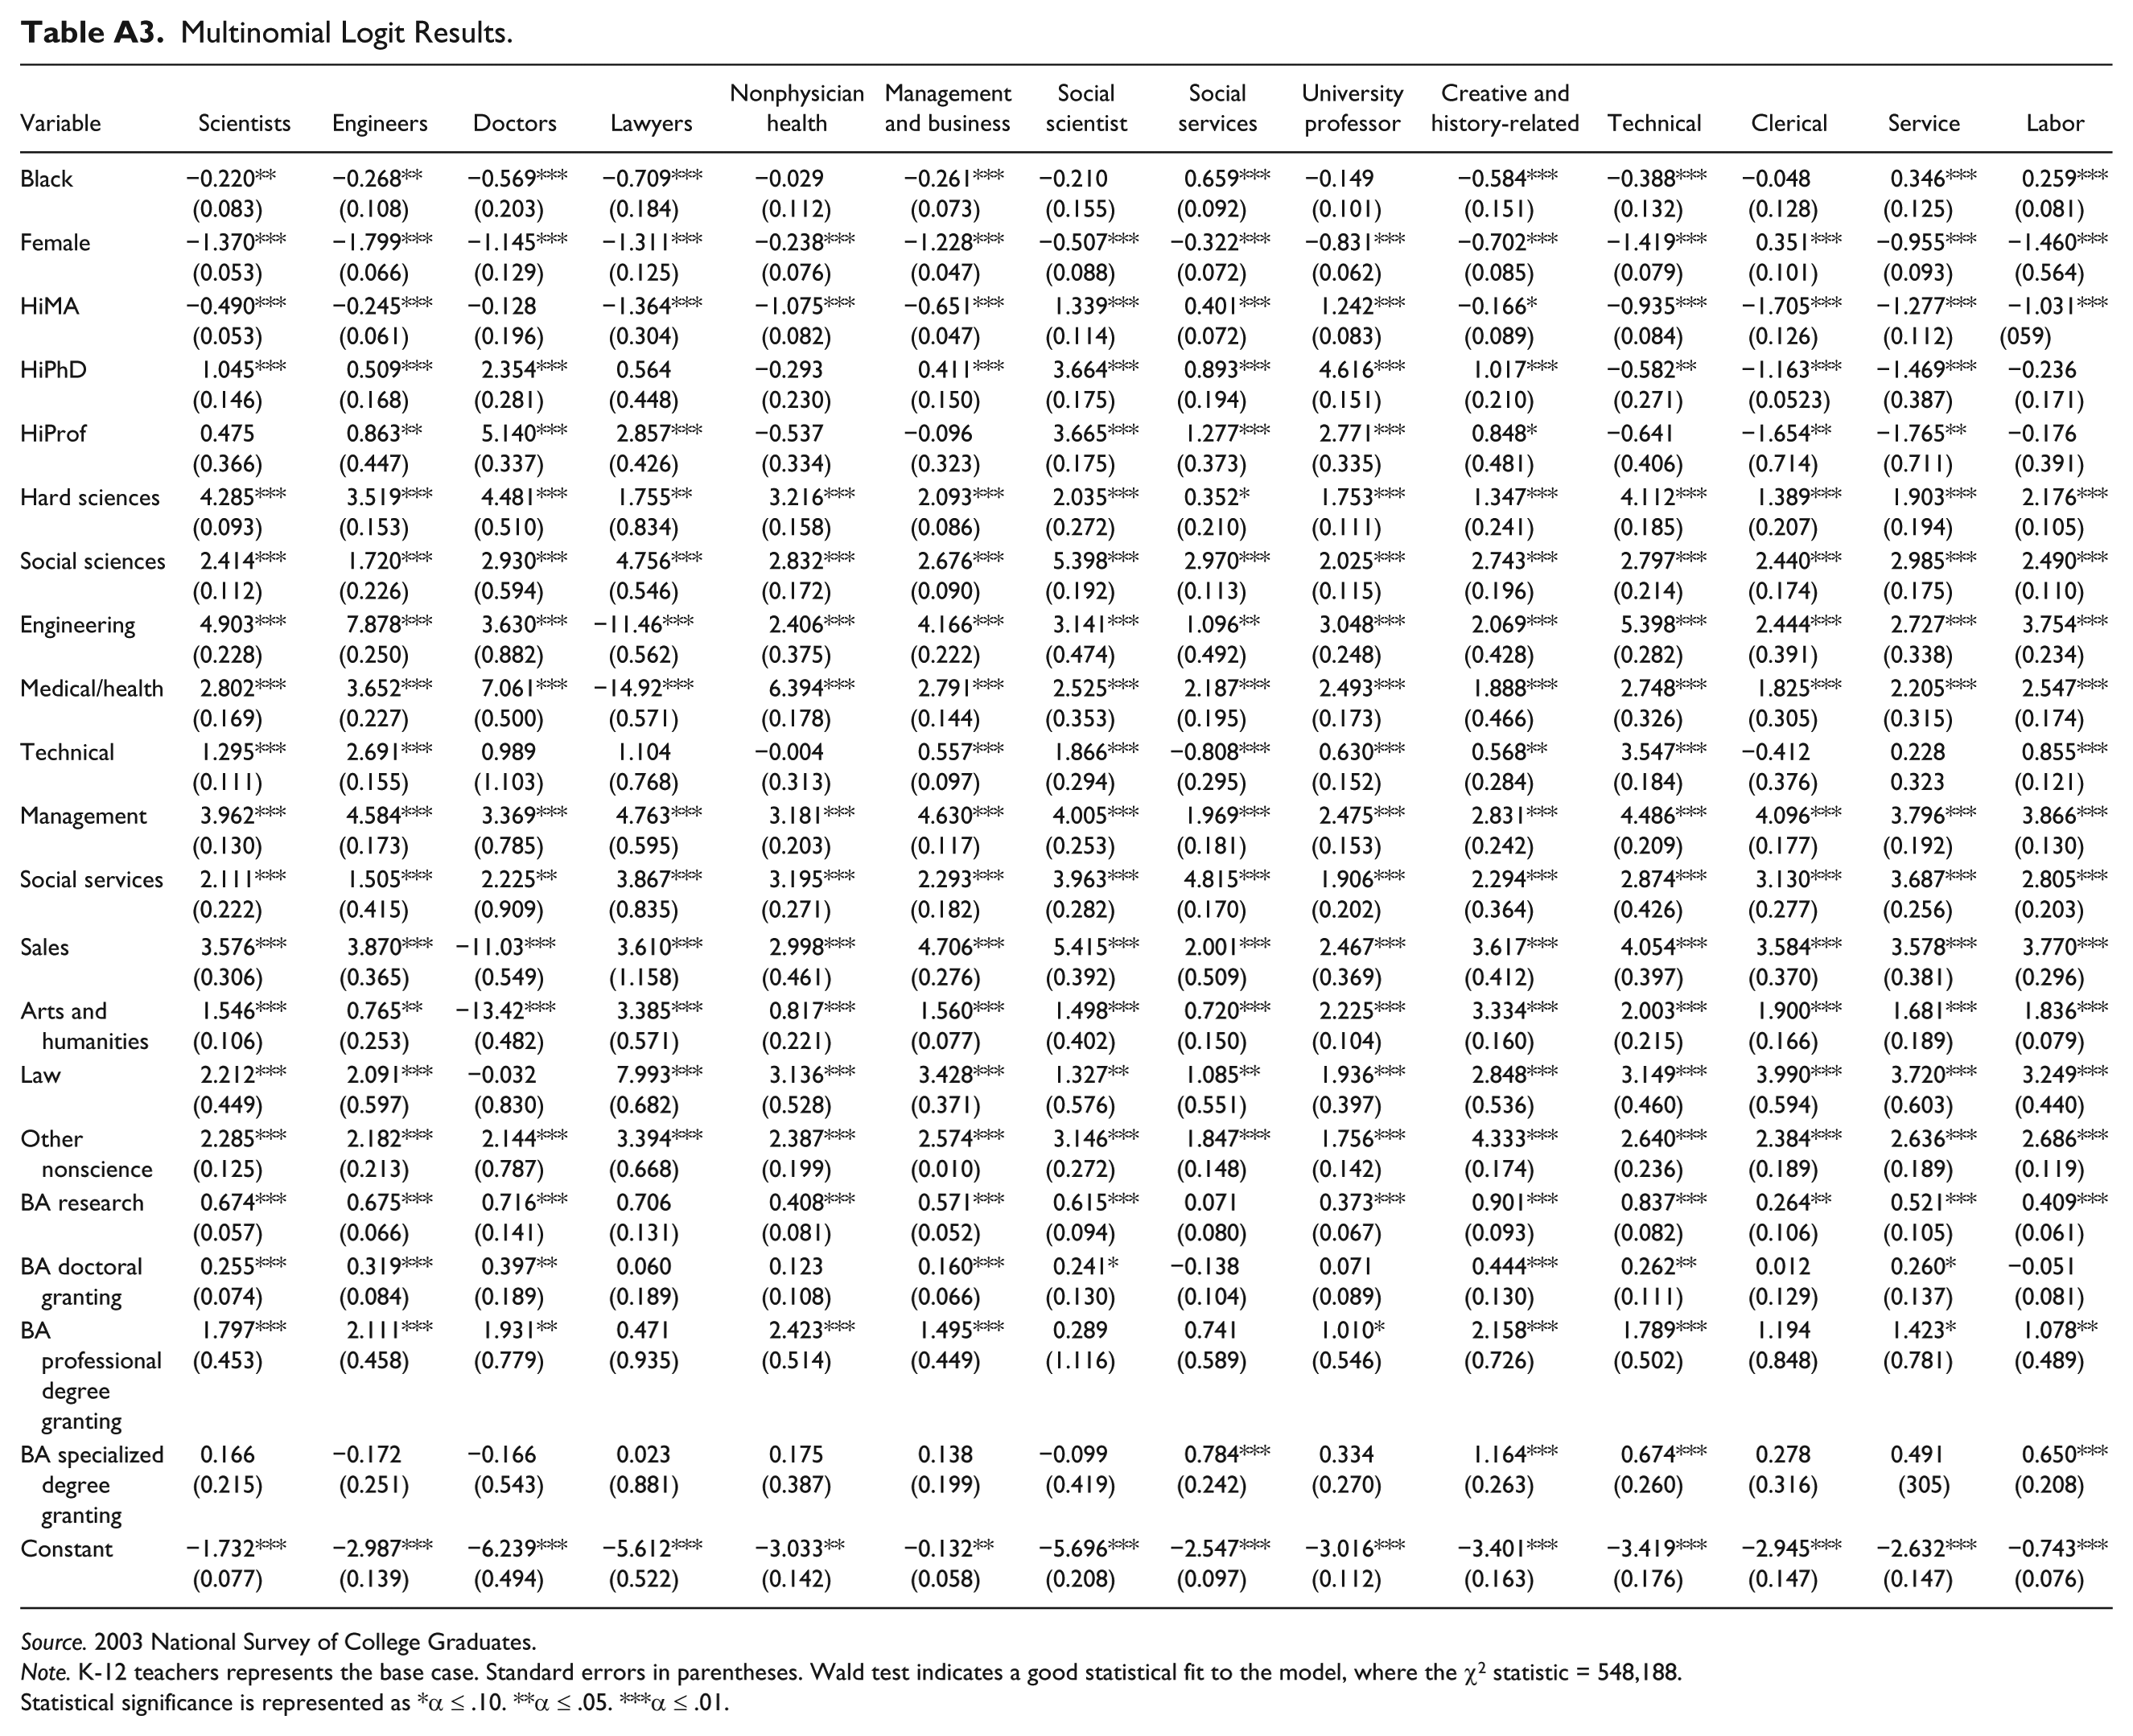
Table A3 contains the results from the multinomial logit estimation. The base case of K-12 teachers is used for comparison. 6 A negative sign on the variable Black indicates that on average, Blacks are less likely to be in an occupation compared with a K-12 teacher. The results indicate that certain academic majors are highly associated with certain occupations. For example, those with a health-related degree are much more likely to report employment in a health field rather than as a K-12 teacher. Blacks are much less likely to be in most of the listed occupations relative to K-12 teacher, with the exception of social services, low-level service, and manual labor occupations. Females are less likely to be in any other occupation compared with K-12 teacher. In reviewing the estimated coefficients related to the institutions of one’s first degree, we find that those who attended research institutions were least likely to be K-12 teachers. Many of the coefficients are statistically significant, and a Wald test of overall fit indicates that the model performs well. Thus, we obtain evidence that academic major and the type of institution of higher education lead to particular occupations.
Table 2 presents salary regressions for the 15 occupational categories. Estimates of the IMR coefficients indicate whether occupation has an endogenous impact on salary. All regressions include controls for regions, demographic information, human capital, and employer type. OLS regressions are included for comparison purposes.
Controlling for endogeneity is necessary for 11 of the 15 salary regressions; however, only the race coefficients in the engineer, manager, and manual labor models are statistically significant. For engineers, the differential falls by about 1.8 percentage points. Employment in a management occupation increases the race-related salary differential by 0.2 percentage points. This latter outcome may be due to the type of management and business-related jobs of Blacks graduates, if Blacks are more frequent in middle rather than upper management. Also note that the coefficient on the IMR in the engineering and management regressions is positive. Because Blacks are less likely in these occupations (compared with K-12 teacher), the positive sign related to the IMR suggests that Blacks also receive a lower salary than the occupational average. The negative sign of the IMR coefficient for manual labor suggests the opposite effect. Here, the probability of being in manual labor is relatively high for Blacks compared with Whites, and the related coefficient on Black is smaller in the manual labor regression model once a control for endogeneity is included.
When controlling for endogeneity, the impact on women is more dramatic. This model reduces the coefficient on Females for most occupations but increases the differential for lawyers, health occupations, and K-12 teachers. The coefficients for engineering, lawyers, K-12 teachers, and manual labor are −0.103, −0.298, −0.115, and −0.235, respectively. It is important to note that even with a relatively smaller coefficient on Female in the endogenous model compared with the OLS model, the coefficient estimates remain relatively large in all but the Clerical model. For example, for management and business professionals, women earn 20.1% less than men. Furthermore, Black women earn 28.3% less than White men in this occupational category, suggesting that there is still substantial gender disparity.
To further examine the impact of occupation on salary, we include 14 of the 15 IMRs in the pooled regression (Table 1, column (6)) in place of the occupation dummy variables. The coefficient on Black indicates that the salary differential is now positive and statistically significant, whereas the coefficient on Female increased to 24.5%. The indirect impact of race and gender via occupation affects salary as the coefficient estimates for gender and race are statistically significant in the multinomial logit. Furthermore, academic discipline and school type also feed into the first-stage multinomial logit and suggest that the early decisions on where to attend school and what the major is will lead to an occupational path that ultimately affects one’s salary.
As a final test of the relationships between salary, occupation, academic major, and race, we examine the salary decomposition using the Cotton (1988) method of decomposition. The decomposition is denoted by

The difference in log salaries is a function of the independent variables (X), the returns to Whites and Blacks for each variable (β
W
, β
B
), and the returns that occur in the labor market if no discrimination exists
Table 1 contains the results of the decomposition, using the OLS regression in column (5) and the endogeneity model in column (6). Recall that the unadjusted differential is 16.5%. In both models, only the differences in the means and the disadvantage to Blacks explain the differential. In the OLS model, 68% of the differential is explained by differences in the means; the remaining 32% is due to the disadvantage Blacks have in the returns to the independent variables. The endogeneity model increases the explained portion to a large negative value; however, the decomposition component related to Blacks is now positive, suggesting an advantage in returns. A review of the decomposition related to the IMRs suggests that some occupations, particularly the professor, managerial, and clerical occupations, have positive values that outweigh negative values for other variables in the regression equation. 8 The end result suggests that even though Blacks earn less on average than do Whites, at the least Black males seem to be make some positive salary adjustment. This outcome is not to say that salary discrimination has disappeared, only that Blacks have some advantage in a few occupations. In fact, Blacks still do not attain high levels of employment in those occupations that tend to pay higher salaries, particularly science and engineering occupations.
Discussion
This study finds that controlling for regional, demographic, human capital, and employer characteristics explains approximately one half of the salary discrepancy between college-educated Blacks and Whites. A model controlling for occupational endogeneity changes the coefficient on the variable Black from a statistically significant negative to positive outcome. For females, the results indicate a substantially large negative coefficient, even when controlling for occupational endogeneity.
Despite the remaining unexplained differences, the model controlling for occupation endogeneity appears to add explanatory power to the salary models, as evidenced by the changes in the salary decomposition between the OLS and two-step models. Simple percentages by race also indicate some occupational differences between Blacks and Whites. Why might these occupational patterns exist? We consider four possible explanations, including (a) differences in level of preparation, (b) occupational preferences, (c) social tracking, and (d) discrimination.
Level of Preparation
If Black students are systematically less prepared than White students, then a disproportionate number of Black students are expected, on average, to be situated in less rigorous majors. Incoming freshman are unlikely to be aware of their deficiencies until they attend classes, so it may be informative to examine the relationship between race and changing majors. Less prepared students may change majors upon discovery that the initial major is too difficult or too time-consuming. Because the NSCG only includes final choices of majors, we cannot test whether our sample follows such patterns. However, two other studies indicate that the preponderance of switching majors varies by race and gender.
Dickson (2010) used a multinomial logit to estimate probabilities for major choice at six public Texas universities. After controlling for college admission test scores and high school class rank, she found that women and minorities are inclined to be in majors associated with lower pay. Although she did not find that Black students are more likely to switch out of science and engineering majors, her data revealed that at institutions where freshman do not have the option of undeclared, Black students switched out of science and engineering majors in favor of less mathematical majors, most notably business. At institutions with the undeclared option, 28% of the sample did so. By graduation, the final major choice for sciences increased from 16% to 18% but engineering and computer science declined from 16% to 10% among Black graduates. The largest gains among Black graduates were observed in social sciences, rising from 15% to 37%, and the humanities and other majors, rising from 9% to 18%.
Compared with White males, Dickson (2010) found that Black females are less likely to choose, maintain, and graduate with majors in the natural or physical sciences (11.3% less likely), business (13.8% less likely), and engineering and computer science (14.4% less likely). Dickson concluded that her findings suggest that society fails to generate sufficient female and minority interest in those majors that the present study links to employment opportunities correlated with higher salaries. Having controlled for class rank and test scores, Dickson dismissed variation in academic preparation as an explanation for the findings. She posited that women and minorities may be dissuaded from certain career paths prior to and during college.
Arcidiacono, Aucejo, and Spenner (2012) found that an observed narrowing of grade point averages from freshman year to graduation among Black and White students at Duke University is explained in part by Black students disproportionately abandoning more rigorous majors. Their study reported that in comparison with 8% of White men, 54% of Black men, who initially express preference for majors in economics, engineering, or science, switch to other social sciences or humanities majors. A smaller disparity is reported among women as 33% of White women compared with 51% of Black women switch from economics, engineering, and science to other social sciences and humanities majors.
Our study does not seem to corroborate a lack of preparation explanation for the observed racial segregation in occupation. As Table A2 indicates, Blacks and Whites had distributional differences in majors. Furthermore, Blacks were more likely to attend institutions requiring less research from faculty, which is associated with diminished institutional reputation. However, the occupational segregation we observe is primarily between males and females, and the racial differences within genders are relatively small. 9 The level of preparation explanation does not explain why White females have substantially different majors and occupational opportunities compared with White males (ditto for Black males/females)—There is no assumption that gender segregation occurs in college preparation courses in predominately White high schools. Thus, we question how much the occupational segregation we observe is due to racial differences in precollege preparation and, therefore, how level of preparation is associated with salary differentials, which also tends to be greater between genders than compared with races.
Occupational preferences
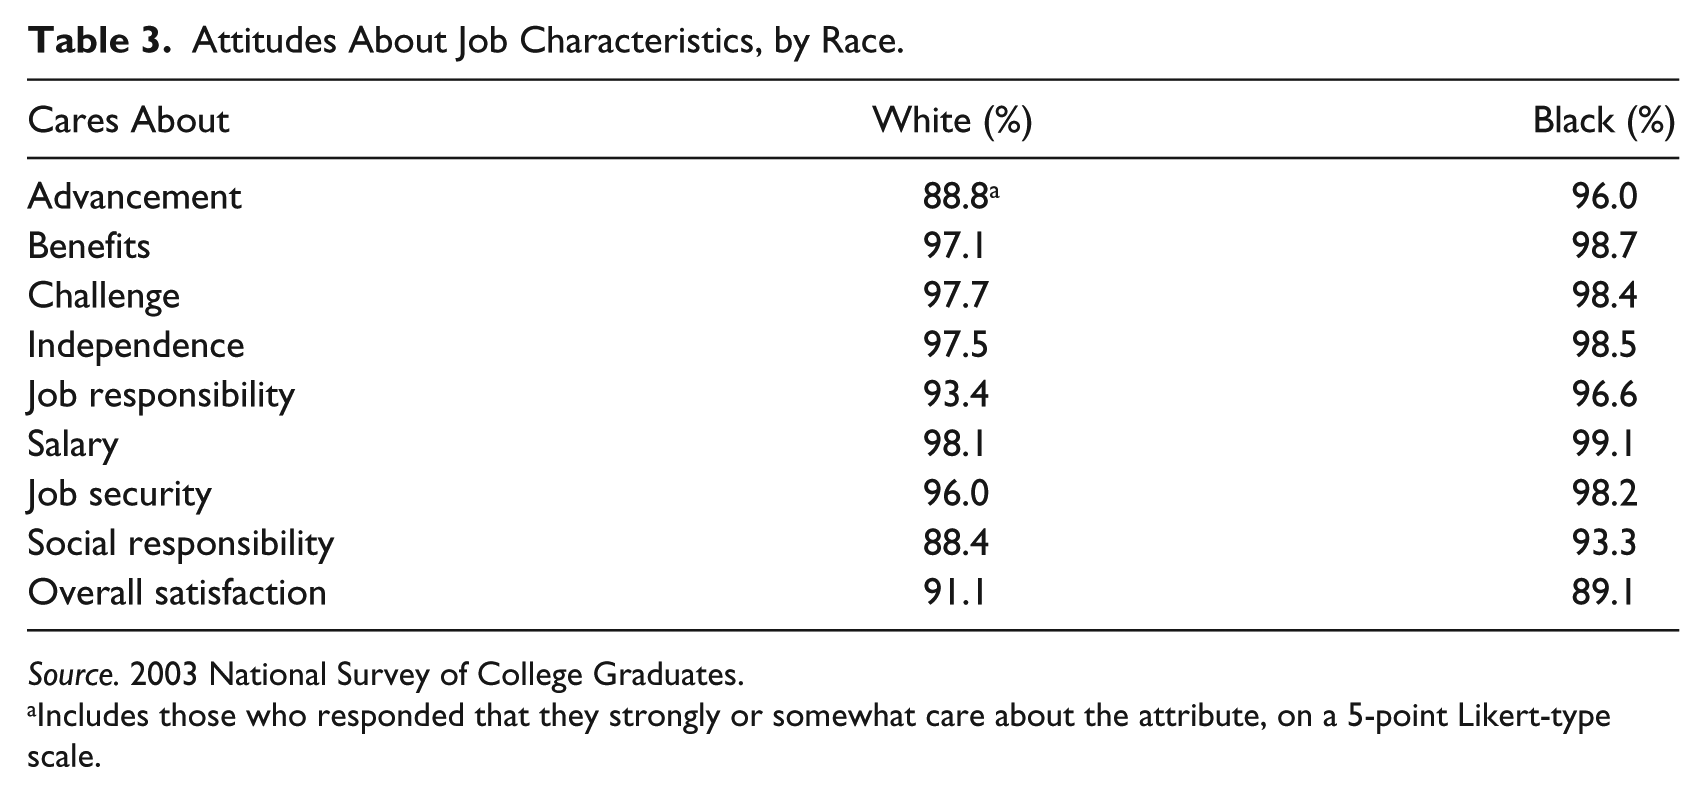
An alternative hypothesis is that Black and female students exhibit less strict preference for economics, engineering, and science majors compared with White male students. Completion of an academic major associated with lower pay may reflect preference for the major and expected occupation independent of the expected labor market rewards. Although the preference may be influenced by cultural and societal factors rather than traditional economic criteria, the selection of major may not violate the expectation that rational individuals seek to maximize individual utility. McClough, Hoag, and Benedict (2014) found evidence suggesting that college-educated workers exchange objective outcomes for procedural outcomes. Benz (2005) defined procedural utility in terms of processes and conditions leading to outcomes such that the individual assigns value to not only what is done but how it is done. Procedural utility therefore challenges the dominant utilitarian orientation of mainstream economics by placing importance on the means (process) rather than only the ends. It may be that Blacks comprising the NSCG sample are systematically inclined to pursue employment in government, social services, or nonprofit organizations due of the compensatory value assigned to procedural utility. We examine this possibility using the NSCG data, which includes answers to questions about what one cares about on the job, using a 5-point Likert-type scale. When we combine those who strongly or somewhat care about a particular job attribute by race, we find that Blacks are more likely to care about advancement and social responsibility than Whites in the sample; other differences are small (Table 3). Thus, it may be that Blacks may receive a compensating differential when selecting jobs that provide more advancement and/or are associated with empathy for social issues. It is also likely that such attributes are associated with the higher percentage of Blacks in the public sector (Benedict, Bajic, & McClough, 2012) and with jobs that are associated with education, social work, or the health care–related occupations.
Attitudes About Job Characteristics, by Race.
Source. 2003 National Survey of College Graduates.
Includes those who responded that they strongly or somewhat care about the attribute, on a 5-point Likert-type scale.
Social Tracking
The standard neoclassical model of utility maximization relies heavily on preferences and an income constraint to explain individual choice. A reductionist application of the model has individuals making choices in isolation devoid of external influences. A more realistic understanding of individual choice considers the environment surrounding the economic actor. So, for example, choice of an academic major, as well as decisions to pursue particular occupations, may reflect the influence of parents, relatives, friends, clergy, and neighbors. Historically, the socioeconomic environment in which an individual is raised all but determined preferences and educational decisions. In recent decades, introduction of new communication devices and the proliferation of media outlets extend the potential sources of influence. Although influences are truly global, the impact may vary by individual.
How social tracking informs this study is not clear. On one hand, never before has more information been available to more people at essentially no cost, which suggests that any systematic ignorance or prejudice is expected to be fully mitigated. For example, just as smokers know that smoking is harmful to one’s health, it is no secret that engineers earn an above-average income, seldom experience extended unemployment, and enjoy pleasant working conditions, yet students avoid math and science courses needed for a career in engineering. On the other hand, the abundance of information may actually be misinformation. Selective attention may lead to a confirmation bias inspired by individual preferences or may be evidence of a satisficing strategy rather than a maximization strategy assumed by economic theory. Simon (1957) argued that individuals do not maximize utility, but rather perform the necessary calculations that result in outcomes that are satisfactory. Accordingly, the selection of a major may have more to do with the social-psychological benefits of attending and completing college than the economic benefits so often imposed on the decision.
Discrimination
Darity and Mason (1998) identified persistent discrimination in labor markets. Women and minorities are more likely to switch from majors or complete majors that are perceived as hostile. Qualitative and quantitative research supports a hostile school environment for women and minorities in the sciences (Burke & Mattis, 2007), and a number of policy initiatives are now in place to improve the classroom environment for women in science, technology, engineering, and mathematics (STEM)–related fields. 10 Bar and Zusmann (2012) found that minority students received lower grades from what the authors described as “conservative” professors, who tended to predominate in the hard sciences. The result is that premarket discrimination leads to limited occupational opportunities and the associated lower salaries.
The NSCG data can only be suggestive in relation to this explanation for occupational segregation. Analysis of the NSCG data, not presented here, indicates large segregation indices in majors between males and females, and to lesser degree, across race. Further examination of the segregation in the hard sciences for the bachelor’s degree explains 15%, 38%, and 22% of the estimated segregation indices between White males and White females, Black males, and Black females, respectively (see Note 10). The hard sciences have no impact on the segregation indices between Black males and females, regardless of race, or between Black and White females. The first set of differences may be the result of preferences or a lack of preparation, but neither of these justifications can easily explain why there is no hard science effect on the segregation indices between Black males and both female groups. 11
The preceding discussion reveals that there are numerous potential explanations for the observed racial disparity in major choice. Although we cannot examine all these potential explanations using the NSCG data, we encourage rigorous investigation of these hypotheses to improve our collective understanding of this socioeconomic puzzle.
Conclusion
This study examines the relationship between academic major and the racial salary disparity observed among a sample of college graduates. Our findings are consistent with previous research revealing that the benefits of a college education are not distributed equally across society. The study finds that completion of an academic major influences labor market outcomes. Specifically, the academic major is associated with occupation, which is shown to explain variation in salary. After controlling for human capital and demographic variables, we find that Black college graduates, on average, complete majors associated with lower paying occupations. The result is much more dramatic across gender, and females, regardless of race, have even greater occupational segregation and lower average salary compared with men. To improve our understanding of racial and gender income discrepancies, a more comprehensive theory incorporating the confirmed influences on income discrepancies is needed. In the meantime, if society sincerely aims to reduce salary inequality across race and gender, it is essential that students entering college have the potential to complete rigorous majors associated with higher pay. Herein lies the challenge; it is unreasonable to expect that all incoming students can successfully navigate the more rigorous majors. It is also unreasonable to presume that all incoming students want to pursue the most rigorous majors. However, it is entirely reasonable to hope that for those who have both the ability and the preference, a comprehensive opportunity set exists for college graduates regardless of race or gender.
Footnotes
Appendix
Multinomial Logit Results.
| Variable | Scientists | Engineers | Doctors | Lawyers | Nonphysician health | Management and business | Social scientist | Social services | University professor | Creative and history-related | Technical | Clerical | Service | Labor |
|---|---|---|---|---|---|---|---|---|---|---|---|---|---|---|
| Black | −0.220**
(0.083) |
−0.268**
(0.108) |
−0.569***
(0.203) |
−0.709***
(0.184) |
−0.029 (0.112) |
−0.261***
(0.073) |
−0.210 (0.155) |
0.659***
(0.092) |
−0.149 (0.101) |
−0.584***
(0.151) |
−0.388***
(0.132) |
−0.048 (0.128) |
0.346***
(0.125) |
0.259***
(0.081) |
| Female | −1.370***
(0.053) |
−1.799***
(0.066) |
−1.145***
(0.129) |
−1.311***
(0.125) |
−0.238***
(0.076) |
−1.228***
(0.047) |
−0.507***
(0.088) |
−0.322***
(0.072) |
−0.831***
(0.062) |
−0.702***
(0.085) |
−1.419***
(0.079) |
0.351***
(0.101) |
−0.955***
(0.093) |
−1.460***
(0.564) |
| HiMA | −0.490***
(0.053) |
−0.245***
(0.061) |
−0.128 (0.196) |
−1.364***
(0.304) |
−1.075***
(0.082) |
−0.651***
(0.047) |
1.339***
(0.114) |
0.401***
(0.072) |
1.242***
(0.083) |
−0.166*
(0.089) |
−0.935***
(0.084) |
−1.705***
(0.126) |
−1.277***
(0.112) |
−1.031***
(059) |
| HiPhD | 1.045***
(0.146) |
0.509***
(0.168) |
2.354***
(0.281) |
0.564 (0.448) |
−0.293 (0.230) |
0.411***
(0.150) |
3.664***
(0.175) |
0.893***
(0.194) |
4.616***
(0.151) |
1.017***
(0.210) |
−0.582**
(0.271) |
−1.163***
(0.0523) |
−1.469***
(0.387) |
−0.236 (0.171) |
| HiProf | 0.475 (0.366) |
0.863**
(0.447) |
5.140***
(0.337) |
2.857***
(0.426) |
−0.537 (0.334) |
−0.096 (0.323) |
3.665***
(0.175) |
1.277***
(0.373) |
2.771***
(0.335) |
0.848*
(0.481) |
−0.641 (0.406) |
−1.654**
(0.714) |
−1.765**
(0.711) |
−0.176 (0.391) |
| Hard sciences | 4.285***
(0.093) |
3.519***
(0.153) |
4.481***
(0.510) |
1.755**
(0.834) |
3.216***
(0.158) |
2.093***
(0.086) |
2.035***
(0.272) |
0.352*
(0.210) |
1.753***
(0.111) |
1.347***
(0.241) |
4.112***
(0.185) |
1.389***
(0.207) |
1.903***
(0.194) |
2.176***
(0.105) |
| Social sciences | 2.414***
(0.112) |
1.720***
(0.226) |
2.930***
(0.594) |
4.756***
(0.546) |
2.832***
(0.172) |
2.676***
(0.090) |
5.398***
(0.192) |
2.970***
(0.113) |
2.025***
(0.115) |
2.743***
(0.196) |
2.797***
(0.214) |
2.440***
(0.174) |
2.985***
(0.175) |
2.490***
(0.110) |
| Engineering | 4.903***
(0.228) |
7.878***
(0.250) |
3.630***
(0.882) |
−11.46***
(0.562) |
2.406***
(0.375) |
4.166***
(0.222) |
3.141***
(0.474) |
1.096**
(0.492) |
3.048***
(0.248) |
2.069***
(0.428) |
5.398***
(0.282) |
2.444***
(0.391) |
2.727***
(0.338) |
3.754***
(0.234) |
| Medical/health | 2.802***
(0.169) |
3.652***
(0.227) |
7.061***
(0.500) |
−14.92***
(0.571) |
6.394***
(0.178) |
2.791***
(0.144) |
2.525***
(0.353) |
2.187***
(0.195) |
2.493***
(0.173) |
1.888***
(0.466) |
2.748***
(0.326) |
1.825***
(0.305) |
2.205***
(0.315) |
2.547***
(0.174) |
| Technical | 1.295***
(0.111) |
2.691***
(0.155) |
0.989 (1.103) |
1.104 (0.768) |
−0.004 (0.313) |
0.557***
(0.097) |
1.866***
(0.294) |
−0.808***
(0.295) |
0.630***
(0.152) |
0.568**
(0.284) |
3.547***
(0.184) |
−0.412 (0.376) |
0.228 0.323 |
0.855***
(0.121) |
| Management | 3.962***
(0.130) |
4.584***
(0.173) |
3.369***
(0.785) |
4.763***
(0.595) |
3.181***
(0.203) |
4.630***
(0.117) |
4.005***
(0.253) |
1.969***
(0.181) |
2.475***
(0.153) |
2.831***
(0.242) |
4.486***
(0.209) |
4.096***
(0.177) |
3.796***
(0.192) |
3.866***
(0.130) |
| Social services | 2.111***
(0.222) |
1.505***
(0.415) |
2.225**
(0.909) |
3.867***
(0.835) |
3.195***
(0.271) |
2.293***
(0.182) |
3.963***
(0.282) |
4.815***
(0.170) |
1.906***
(0.202) |
2.294***
(0.364) |
2.874***
(0.426) |
3.130***
(0.277) |
3.687***
(0.256) |
2.805***
(0.203) |
| Sales | 3.576***
(0.306) |
3.870***
(0.365) |
−11.03***
(0.549) |
3.610***
(1.158) |
2.998***
(0.461) |
4.706***
(0.276) |
5.415***
(0.392) |
2.001***
(0.509) |
2.467***
(0.369) |
3.617***
(0.412) |
4.054***
(0.397) |
3.584***
(0.370) |
3.578***
(0.381) |
3.770***
(0.296) |
| Arts and humanities | 1.546***
(0.106) |
0.765**
(0.253) |
−13.42***
(0.482) |
3.385***
(0.571) |
0.817***
(0.221) |
1.560***
(0.077) |
1.498***
(0.402) |
0.720***
(0.150) |
2.225***
(0.104) |
3.334***
(0.160) |
2.003***
(0.215) |
1.900***
(0.166) |
1.681***
(0.189) |
1.836***
(0.079) |
| Law | 2.212***
(0.449) |
2.091***
(0.597) |
−0.032 (0.830) |
7.993***
(0.682) |
3.136***
(0.528) |
3.428***
(0.371) |
1.327**
(0.576) |
1.085**
(0.551) |
1.936***
(0.397) |
2.848***
(0.536) |
3.149***
(0.460) |
3.990***
(0.594) |
3.720***
(0.603) |
3.249***
(0.440) |
| Other nonscience | 2.285***
(0.125) |
2.182***
(0.213) |
2.144***
(0.787) |
3.394***
(0.668) |
2.387***
(0.199) |
2.574***
(0.010) |
3.146***
(0.272) |
1.847***
(0.148) |
1.756***
(0.142) |
4.333***
(0.174) |
2.640***
(0.236) |
2.384***
(0.189) |
2.636***
(0.189) |
2.686***
(0.119) |
| BA research | 0.674***
(0.057) |
0.675***
(0.066) |
0.716***
(0.141) |
0.706 (0.131) |
0.408***
(0.081) |
0.571***
(0.052) |
0.615***
(0.094) |
0.071 (0.080) |
0.373***
(0.067) |
0.901***
(0.093) |
0.837***
(0.082) |
0.264**
(0.106) |
0.521***
(0.105) |
0.409***
(0.061) |
| BA doctoral granting | 0.255***
(0.074) |
0.319***
(0.084) |
0.397**
(0.189) |
0.060 (0.189) |
0.123 (0.108) |
0.160***
(0.066) |
0.241*
(0.130) |
−0.138 (0.104) |
0.071 (0.089) |
0.444***
(0.130) |
0.262**
(0.111) |
0.012 (0.129) |
0.260*
(0.137) |
−0.051 (0.081) |
| BA professional degree granting | 1.797***
(0.453) |
2.111***
(0.458) |
1.931**
(0.779) |
0.471 (0.935) |
2.423***
(0.514) |
1.495***
(0.449) |
0.289 (1.116) |
0.741 (0.589) |
1.010*
(0.546) |
2.158***
(0.726) |
1.789***
(0.502) |
1.194 (0.848) |
1.423*
(0.781) |
1.078**
(0.489) |
| BA specialized degree granting | 0.166 (0.215) |
−0.172 (0.251) |
−0.166 (0.543) |
0.023 (0.881) |
0.175 (0.387) |
0.138 (0.199) |
−0.099 (0.419) |
0.784***
(0.242) |
0.334 (0.270) |
1.164***
(0.263) |
0.674***
(0.260) |
0.278 (0.316) |
0.491 (305) |
0.650***
(0.208) |
| Constant | −1.732***
(0.077) |
−2.987***
(0.139) |
−6.239***
(0.494) |
−5.612***
(0.522) |
−3.033**
(0.142) |
−0.132**
(0.058) |
−5.696***
(0.208) |
−2.547***
(0.097) |
−3.016***
(0.112) |
−3.401***
(0.163) |
−3.419***
(0.176) |
−2.945***
(0.147) |
−2.632***
(0.147) |
−0.743***
(0.076) |
Source. 2003 National Survey of College Graduates.
Note. K-12 teachers represents the base case. Standard errors in parentheses. Wald test indicates a good statistical fit to the model, where the χ2 statistic = 548,188.
Statistical significance is represented as *α ≤ .10. **α ≤ .05. ***α ≤ .01.
Acknowledgements
The authors wish to thank two anonymous referees for the constructive suggestions that improved the final manuscript.
Declaration of Conflicting Interests
The author(s) declared no potential conflicts of interest with respect to the research, authorship, and/or publication of this article.
Funding
The author(s) disclosed receipt of the following financial support for the research, authorship, and/or publication of this article: David McClough acknowledges funding support from the James F. Dicke College of Business Administration.