
Abstract
Institutions of higher education are under pressure to keep costs under control. This paper tests determinants of gross tuition and net cost of attendance using a panel data set of 1,864 institutions from 2009 to 2022. Results show a strong positive relationship between institutions’ administrative overhead and tuition. Instructional expenditures have a much weaker relationship with tuition, suggesting that tuition increases are not being fueled by spending on faculty salaries. Interestedly, public, but not private, institutions’ spending on research is strongly related to higher tuition, which suggests varying returns to research expenditures. There are mixed results for grants and loans. In terms of institutional decisions, the results encourage college administrations to be careful about adding more non-teaching employees to the ranks of administration. This is found to be particularly relevant for increased costs in the areas of Academic Affairs and Student Affairs.
Introduction
Institutions of higher education in the United States are approaching a time of crisis. The “demographic cliff” of a shrinking domestic college age population has begun to hit along with potential falls in international student recruitment. These trends are occurring as the cost of college has become progressively more out of reach for many families with increases in tuition being well above the rate of inflation (Hanson, 2024a). While there was some relief in real tuition increases during the pandemic, this was largely the result of higher inflation rates. As seen in Figure S1, contained in the supplementary online files, inflation-adjusted tuition rates are once again trending upwards.
These cost increases have fed into the current student loan crisis and political demands for student loan debt relief. Research has shown a direct relationship between tuition and student debt (Best & Keppo, 2014; Dowdy & Dacass, 2024). For those who borrow money to attend college, the average student loan debt is over $40,000 and rising each year (Hanson, 2025a). Total student loan debt in the United States reached a staggering $1.65 trillion in the third quarter of 2025, an amount equivalent to auto loan debt ($1.66 trillion) and larger than the $1.23 trillion stock of credit card debt (FRBNY, 2025). Figure S2, contained in the supplementary online files, shows the substantial increase in the stock of student loan debt in the United States since 2000. One concern about this rising stock of student loan debt is the increase of student loan delinquencies from less than 1% in 2023 to 7.7% in 2024 (FRBNY, 2025). The subject of student loan debt relief has become heavily political, with differing views based on partisanship (SoRelle & Laws, 2023).
The increase in student loans has fueled a debate as to whether college is still a sound investment. Some researchers have found that the return to a college degree is still positive for the average student (Bengali & Daly, 2014; Lobo & Burke-Smalley, 2018). Bengali and Daly (2014) estimated the lifetime net return of a college degree to be over $800,000. But others have found the college wealth premium to be approaching zero for some groups of students (Emmons et al., 2019). Emmons et al. (2019) estimated the wealth premium for non-White cohorts of students born in the 1980s to be indistinguishable from zero.
There is evidence that these higher tuition costs are harming enrollments (Hsing & Chang, 1996; Millea & Orozco-Aleman, 2017). Using data from public universities, Millea and Orozco-Aleman (2017) found that a 1% increase in resident tuition rates decreased enrollments by 0.3%. This effect is more recent as previous studies found that enrollment was not sensitive to tuition changes (Gallet, 2007). These new findings are consistent with the increase in student loan balances since 2008 shown in Figure S2; previous tuition increases did not cause such a dramatic rise in student loan balances. While enrollment is important, some students may not even get to the enrollment decision, as higher gross prices for tuition may lower the number of applications at public universities (Levine et al., 2023) or among undocumented immigrants (Grosz & Hines, 2022). Higher tuition can have other negative effects such as more loans and lower graduation rates (Chakrabarti et al., 2023). The United States has experienced dramatic increases in college attainment over the last several decades, but those gains have now stalled out, and college attainment rates fell in 2023 (Castro & Coen-Pirani, 2016; U.S. Census Bureau, 2023).
At the root of this crisis is the increasing cost of college. There are different definitions of costs. This paper tests gross tuition and the net cost of attendance. Gross tuition includes only tuition and fees while the net cost of attendance measure also includes room and board but subtracts out financial assistance. To the best of our knowledge, this is the first study to test both the gross tuition and net costs of attendance on the same data set. There is also a shortage of papers using large samples with different types of universities over a long timeframe. This paper tests different factors impacting tuition costs (gross tuition, net cost of attendance) using a large, panel data set. This comprehensive examination is designed to help yield policy recommendations for colleges and governments trying to contain tuition costs. Results support the hypothesis that increased availability of government sponsored student loans is positively related to tuition costs. Another key finding is that administrative overhead is significantly related to increasing tuition. Results show significant nuances based on ownership type and degree level of institution.
The paper will continue with a discussion of relevant background literature in this area. This will be followed by a description of the data set and methodology and then a discussion of the results and the conclusion. For the purpose of clarifying terminology, we will use the term college and university interchangeably as is commonly done in the United States.
Background
The previous studies in this area represent a number of different theories and data samples. The purpose of this brief review is to explain how the work of this current paper fits into and complements the existing literature. This section will conclude with a listing of the hypotheses to be tested in the paper. The primary focus of the paper is on the role of different types of expenditures on tuition. However, there are some other variables of interest which come from the literature as well.
Impact of Different Types of Expenditures
A relevant question from the literature is how different types of institutions’ expenditures impact tuition. The main source of expenditure data used in the literature comes from the Integrated Postsecondary Education Data System (IPEDS). IPEDS separates institutions’ expenditure data into different categories. Instructional expenditures are wages paid to teaching faculty and expenses directly related to providing instruction. Research expenditures include expenses related to producing research, whether that is done by an individual faculty member or by an institute/center run by the institution. Academic Affairs expenditures are wages paid to employees supporting the institution’s mission of teaching and research, but not the wages of faculty engaged in teaching. Examples of expenditures from Academic Affairs would be academic leadership positions (e.g., Deans) and other academic support staff. Student Affairs expenditures are the costs of operating departments such as admissions, registrar’s offices, student organizations, tutoring centers, career centers, counseling, and other departments which directly serve student life. Institutional support contains the expenses related to the “business” of running an institution including costs such as budget operations, purchasing, public relations, human resources, legal and logistical services. Auxiliary expenses are anything which is self-supporting on campuses such as food services, student stores, and student health services (but not counseling services). This auxiliary category can also include faculty housing and athletics (if the athletic programs are self-funded).
There have been a few studies relating to different types of expenditures and tuition. Instructional costs have been a primary focus of this work. In a study of PhD granting schools in the late 1980s, researchers found higher instructional costs were positively related to higher tuition (Koshal et al., 1994). However, Griffith and Rask (2016) found that instructional spending also had the largest positive impact on student labor market outcomes, especially for students from disadvantaged backgrounds. Another study of universities’ expenditures found that a significant portion of tuition increases were coming from university spending on research, especially in the sciences (Ehrenberg et al., 2007).
In addition to instructional costs, administrative expenditures have also been studied. Hedrick et al. (2009) examine the growth of administrative and instructional spending for 247 master’s level public universities in the United States from 1984 to 2000. Through pooled Ordinary Least Squares and Fixed Effects models, they find administrative costs are not growing significantly faster than instructional costs. The authors combine academic affairs, student affairs and institutional support as “administrative costs” and compare this to instruction expenditures, measured on a per employee basis. They find that administrative costs grew at the same rate as instructional costs in the 1980s, but slightly faster than instructional costs in the 1990s (Hedrick et al., 2009). While their paper does not directly test the impact of administrative costs on tuition, it is relevant as it studies the growth of different types of expenditures. Labor costs considered more generally, regardless of expenditure category, have also been found to increase tuition (Bundick & Pollard, 2019).
Student Aid and Loans
William Bennett, Secretary of Education under the Reagan administration, argued that universities were increasing tuition in order to get more money from the government (Bennett, 1987). The idea that increased student aid and loans from the government could increase tuition became known as the Bennett Hypothesis. Government-provided financial assistance can take many forms. Grants are financial assistance which is not paid back by students. These grants can be provided by the federal, state or local governments. The most widely used government grant program is federal Pell Grants, with over 1.5 million recipients in 2025 (Hanson, 2024b). Eligibility for Pell Grants is based on students’ household income.
Students applying to college are eligible to take out loans through the U.S. Department of Education. Direct Unsubsidized loans require the repayment of the loan’s principal and interest and are available to students of any income level. The Direct Subsidized loan program requires repayment of the loan’s principal amount but not the repayment of interest which accrues during schooling and within 6 months of graduation. However, the Direct Subsidized loan program does have income requirements. There are concerns that government guaranteed loans could lead to more short-sighted borrowing by students; resulting in tuition increases and students graduating with larger debts (Newman, 2021). The primary focus of the Bennet hypothesis research has been on the impact of government financial assistance on the gross price of tuition, also referred to as the gross price, rather than on the net cost of attendance. The empirical results testing the Bennett Hypothesis have been mixed.
There has been evidence supporting the Bennett Hypothesis from the federal Pell Grant program (McPherson & Schapiro, 1991; Singell & Stone, 2007). A study of for-profit colleges across five states also supported the Bennett hypotheses regarding the positive relationship between government grant aid and tuition (Cellini & Goldin, 2014). A study from the state of Georgia also found that more government grant aid was positively related to gross tuition (Long, 2004). Results from Baird et al. (2002) found a similar relationship using data on government financial aid programs for military veterans enrolling in college. A study using IPEDS data for 790 institutions over 2001–2012 found that more student loans and government grant aid were both positively related to tuition (Lucca et al., 2019).
Despite these studies confirming the Bennett Hypothesis, the literature is not uniform in its results. A few papers have found a negative relationship between government funding and tuition. A study of 479 public universities from 1987 to 2014 found a negative relationship between state funding and tuition (Webber, 2017). In that case, increased state funding reduced the tuition charged by universities. A similarly negative relationship between state funding and tuition was found for data from 47 states in the 1990s (Koshal & Koshal, 2000). These results both run contrary to the Bennett Hypothesis.
Several studies have yielded insignificant results with regards to the Bennett Hypothesis. A study of government grants to college students from Washington, DC did not find a significant impact on tuition (Lan & Winters, 2011). Similarly, Amuedo-Dorantes and Sparber’s (2014) study of government tuition subsidies to undocumented immigrants did not find a significant effect on tuition at public colleges (except at some flagship institutions). Amuedo-Dorantes and Sparber’s (2014) result is consistent with Kramer et al. (2018) finding that the impact of increased merit aid on tuition can depend on the tuition setting ability of the public institution, as flagship institutions would likely have more ability to increase tuition rates. Bundick and Pollard (2019) tested the Bennett Hypothesis with loans, rather than grants, and did not find a significant relationship. Only limited support of the Bennett Hypothesis was found in Kelchen’s (2019) study of law schools.
The literature on the Bennett Hypothesis tends to rely on a source of exogenous variation from a change in lending program or in individual circumstances to test this hypothesis. This is usually taken from individual, student level data or from a small sample of institutions. That type of analysis is not possible with the large panel data set utilized in this paper. Therefore, given the data constraints, this paper’s analysis will be considered a weak form of testing of the Bennett Hypothesis.
Control Variables
There are several variables which have been found to impact tuition costs in previous studies. The Higher Education Price Index (HEPI) measures the costs faced by institutions of higher education in the United States. Similar to how the Producer Price Index seeks to predict the effect on consumers of higher education by using the cost to suppliers, the HEPI is used to help predict tuition costs. Best and Keppo (2014) use the HEPI as a proxy for the operational costs faced by colleges. They find HEPI to be a significant factor in institutions’ supply decisions. Studies have found that students are willing to pay more in tuition to attend higher ranked/more selective schools (Kench & Wallace, 2010; Koshal et al., 1994). An institution’s geographical location and/or religious affiliation can also impact its tuition (Kench & Wallace, 2010). In a study of 133 four-year, private colleges, evidence was found that tuition increases may be the result of institutions increasing their own financial aid to students (Griffith, 2011).
Hypotheses to Be Tested
H1: The first hypothesis proposes that the number of employees per student will be positively related to gross tuition and net cost of attendance per student. The reasoning is that employees are a cost to the institution and this will be reflected in the revenues needed to pay for this expenditure. H2: The second hypothesis proposes that all the expenditure types, except for research, will be positively related to gross tuition and net cost of attendance per student. As the expenditure categories are measured on a per student basis, tuition and net cost of attendance per student should be positively related to these expenditures. H3: The third hypothesis is the relationship between research expenditures and tuition. Research expenditures by a university can potentially yield grants which offset the expenditure. The impact of research expenditures is expected to be less positively related to gross tuition and net cost of attendance, the higher the degree level of the university. This is because the largest recipients of federal funding grants are PhD granting institutions (Cohn, 2025). A decreasing coefficient on research expenditures would reflect a higher return to research spending. H4: The fourth hypothesis tested is the Bennett Hypothesis. This hypothesis proposes that there will be a positive relationship between government sponsored financial assistance and both gross tuition and net costs of attendance. This will be tested with variables comprising federal level grants to students, state level grants to students, and federally provided student loans. All of these sources of assistance come from outside institutions and are put towards paying the costs of student tuition and fees. As noted in the literature review, this will be considered a weak test of the Bennett Hypothesis.
Data and Variables
The paper’s hypotheses are tested using an unbalanced panel data set of 1,864 colleges over the 2009–2022 time period. This yields an initial sample of 21,903 observations. After following a trimming procedure (Chen & Dixon, 1972) for outliers the final sample is 18,230 observations. 1 Descriptive statistics for the sample are in Table S1, contained in the supplementary online files. There are two data sources used to create the data set. The Higher Education Price Index (HEPI) is from Commonfund (Commonfund, 2025). All other variables are taken from the Integrated Postsecondary Education Data System (IPEDS) data compiled by the National Center for Education Statistics (National Center for Education Statistics, 2025).
There are two dependent variables in the analysis: gross tuition per student and net cost of attendance (COA). The focus of this analysis is exclusively on undergraduate tuition; graduate tuition is not considered. Tuition and costs per student vary by institution and by year. Gross tuition includes only tuition and fees and is denoted by
Abel and Deitz (2014) make the point that net cost of attendance is a better representation of what students actually pay to attend college than is gross tuition. After a financial aid offer is made, students make the decision to attend based on their net cost of attendance. This suggests that gross and net measures should both be tested as they can affect students differently through the decisions to apply to and the decision to attend college. Using both of these measures on the same data set is not typically done in the literature and can yield additional insights. The tuition and cost of attendance measures are both from IPEDS.
There are three independent variables being used to test the Bennett Hypothesis. These variables are the percentage of students at the institution who receive federal grant aid, the percentage of students receiving state grant aid and the percentage of students on federal government provided student loans. There is a fourth aid measure included for the percentage of students receiving institutional aid. However, this fourth variable does not test the Bennett Hypothesis as those aid funds come from the institution and not from the government. This vector of four variables is denoted as
The data set has seven variables related to hiring and expenditures. A one-period lag is used for employment and expenditure variables. This is done to help mitigate possible endogeneity from using contemporaneous expenditure and tuition variables. The first of these variables is the number of employees per student. This is tested as an alternative to expenditures (as multicollinearity makes including both employees and expenditures problematic). When employees per student is not included, a vector of six expenditure variables is used in its place. The six expenditure variables are: instruction, research, academic affairs, student affairs, institutional operations and auxiliary operations with all being measured as expenditures per student. This is denoted as
As seen in Table S1, the averages for gross tuition per student are lower than combined expenditure per student. The gross tuition number does not include room and board and represents only one of an institution’s revenue streams. For public institutions and/or those with large endowments, tuition may not be their largest source of revenue. For some state universities, tuition represents less than 20% of their total revenue (Hanson, 2025b). Also, while instructional expenditures are directly related to students, some other types of expenditure could go to operations which generate revenue such as student stores, dining halls, centers, and athletics.
The expenditure variables in Table S1 have consistently lower median than mean values. The median size of institution is also smaller than its mean value. Institutions with large student populations and/or endowments are driving up some of the averages in the data. In order to control for the possibility that skewed distributions of the expenditure variables are impacting results, robustness checks using logs are discussed in the Appendix with Tables S9-S11 contained in the online supplementary files. 2
The expenditure variables represent a wide range of university spending. Employees hired by institutions can fall into many categories. For example, the hiring of faculty and instructional design staff would fall under the instructional expenditure category. As seen in Figure S3, contained in the supplementary online files, instruction is the largest expenditure category for institutions. Research expenditures would include research staff, grants, conference travel and other research expenses paid by institutions. This can be a significant expenditure for large, PhD granting institutions. Varied positions such as Associate Deans, Deans, Provosts and administrative coordinators would fall under the Academic Affairs category of spending. However, if an Associate Dean, for example, was in charge of a counseling center then their salary would be considered Student Affairs spending. Generally, with the IPEDS expenditure data, employees in non-teaching, student-facing positions are considered Student Affairs. Positions on the operational side of running the institution as a business such as human resources employees, communications staff and purchasing are considered Institutional Support. The Auxiliary expenditure category differs by institution. For institutions with Division I sports, athletics programs can sometimes be in this category. For most institutions, room and board services such as food services and dormitory cleaners fall under the auxiliary category of expenditures. 3
There are four control variables for the degree level of the institution. These are dummy variables based on the classification of the college as an Associate, Bachelors, Masters or PhD degree level institution. This vector is denoted as
There are several other control variables included in the analyses, denoted as the vector
There are opportunities to contribute to this literature. As discussed in the literature review section, many studies rely on relatively small samples from only a few hundred institutions (or less). Often these studies focus on only one type of institution, such as public universities, or on a specific degree level of institution (e.g., master’s or PhD). This can lead to conflicting results and can make comparisons difficult. The analyses in this paper utilize data on 1,864 colleges over 14 years. The data set covers all types and degree levels of institutions. This paper also fills a gap in terms of the impact of different types of university expenditures on tuition. To the best of our knowledge, this will be the first study to examine these six types of expenditures on tuition costs, as previous studies either aggregated categories or utilized only one or two of the categories.
Methodology
This paper uses pooled Ordinary Least Squares (OLS) and Generalized Least Squares (GLS) with institution level fixed effects. For the OLS regressions, standard errors were clustered by institution. Regressions were run with Huber–White corrected standard errors. These methodologies have been used on this type of data by others in the literature (Hedrick et al., 2009). A Hausman test rejected the null hypothesis of no significant differences between random and fixed effects. Therefore, a fixed effects estimator is used to avoid the potentially biased random effects estimator. Multicollinearity is not a significant problem as all Variance Inflation Factor values were below 4.
As discussed in the previous section, there are two dependent variables in the regressions representing gross tuition and net cost of attendance. The OLS regressions for gross tuition and net cost of attendance are represented in equations (1) and (2), with the variables denoted as discussed in the previous section and


The fixed effects regressions for gross tuition and net cost of attendance are shown in equations (3) and (4) below with the addition of the institution level fixed effects (


Full Sample using Employees on Gross Tuition and Net COA
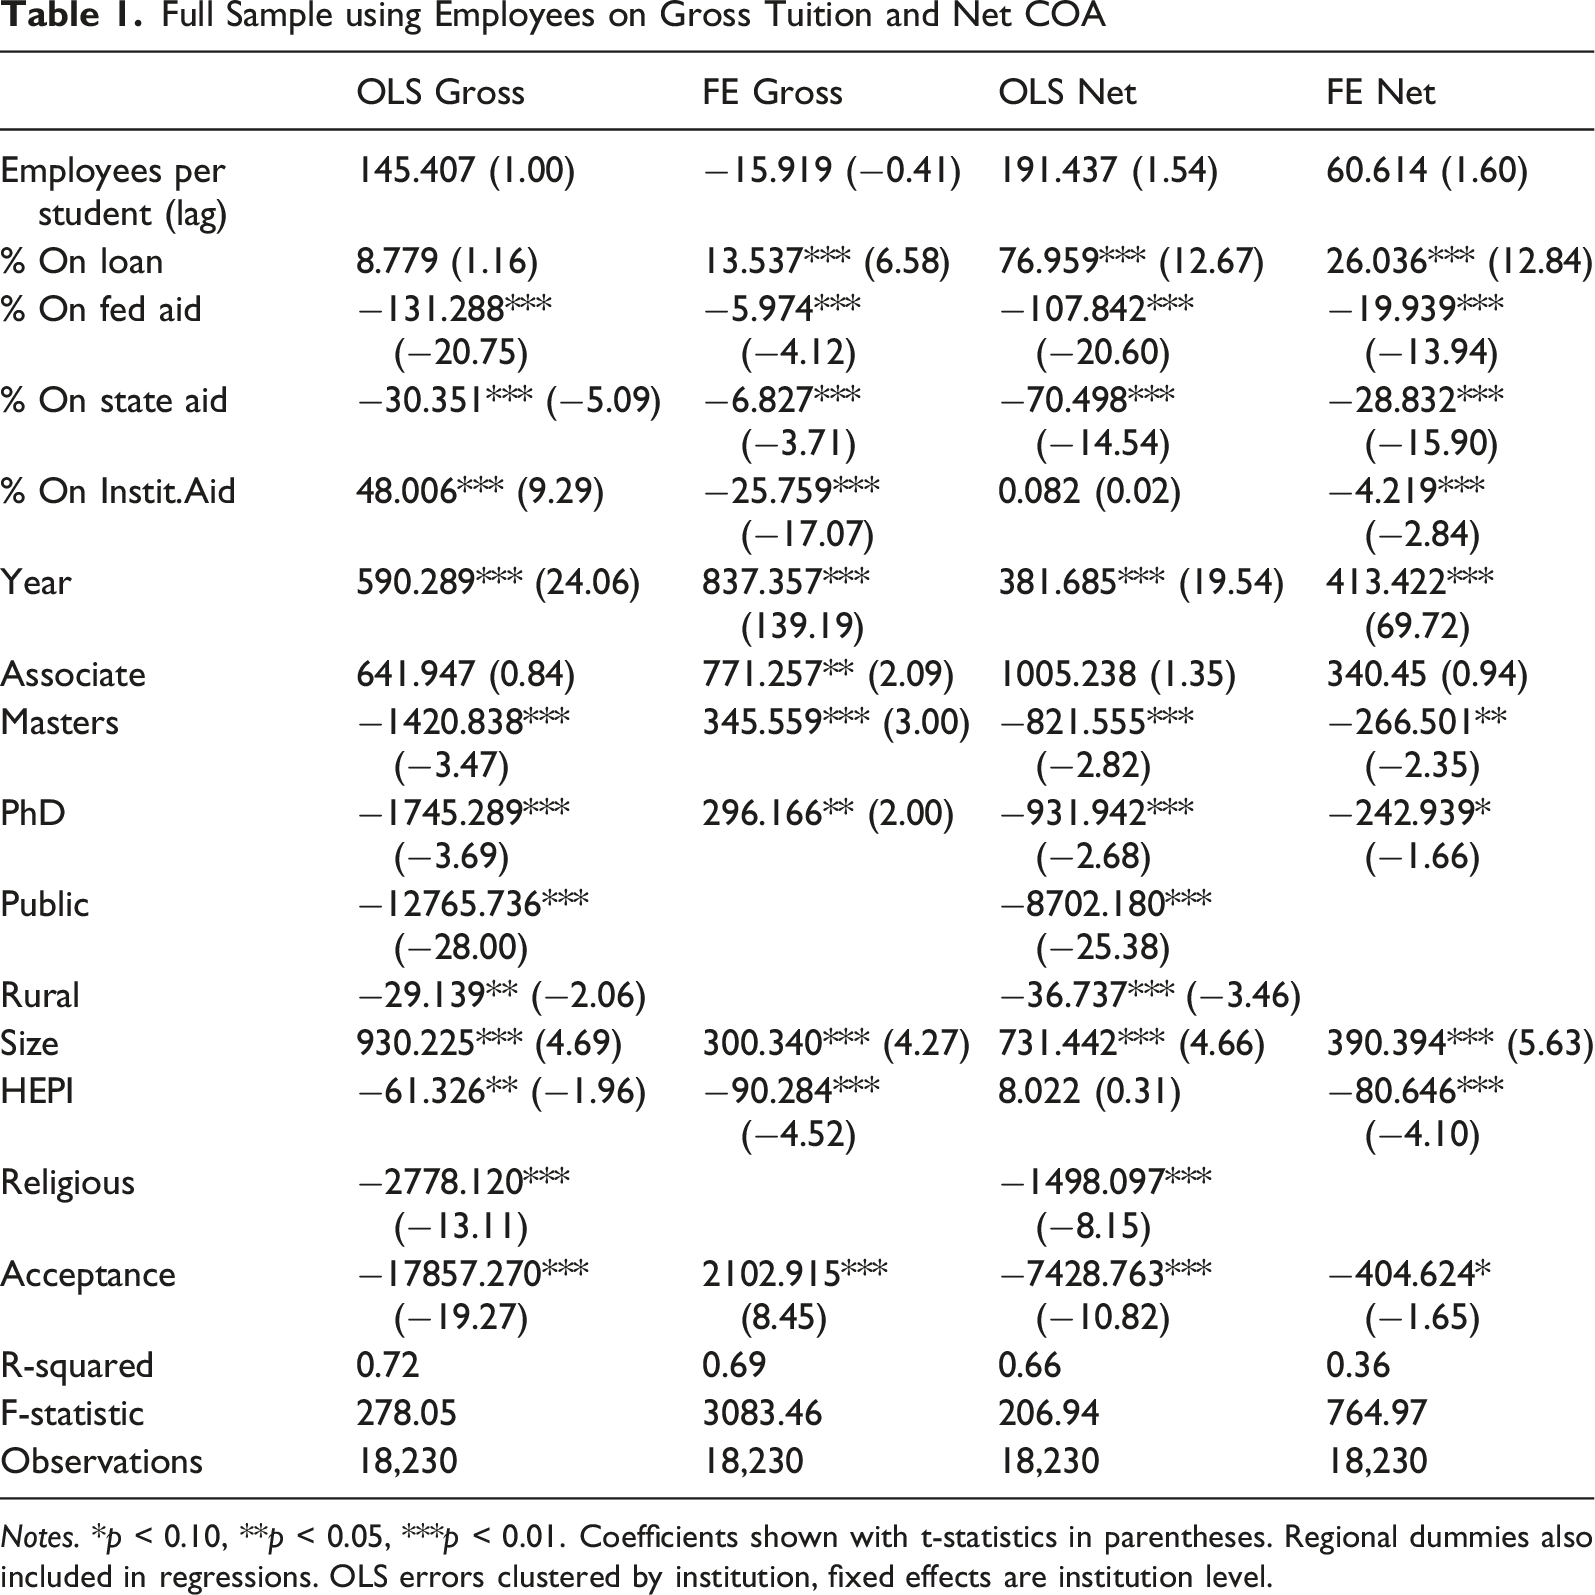
Notes. *p < 0.10, **p < 0.05, ***p < 0.01. Coefficients shown with t-statistics in parentheses. Regional dummies also included in regressions. OLS errors clustered by institution, fixed effects are institution level.
Full Sample using Expenditures on Gross Tuition and Net COA
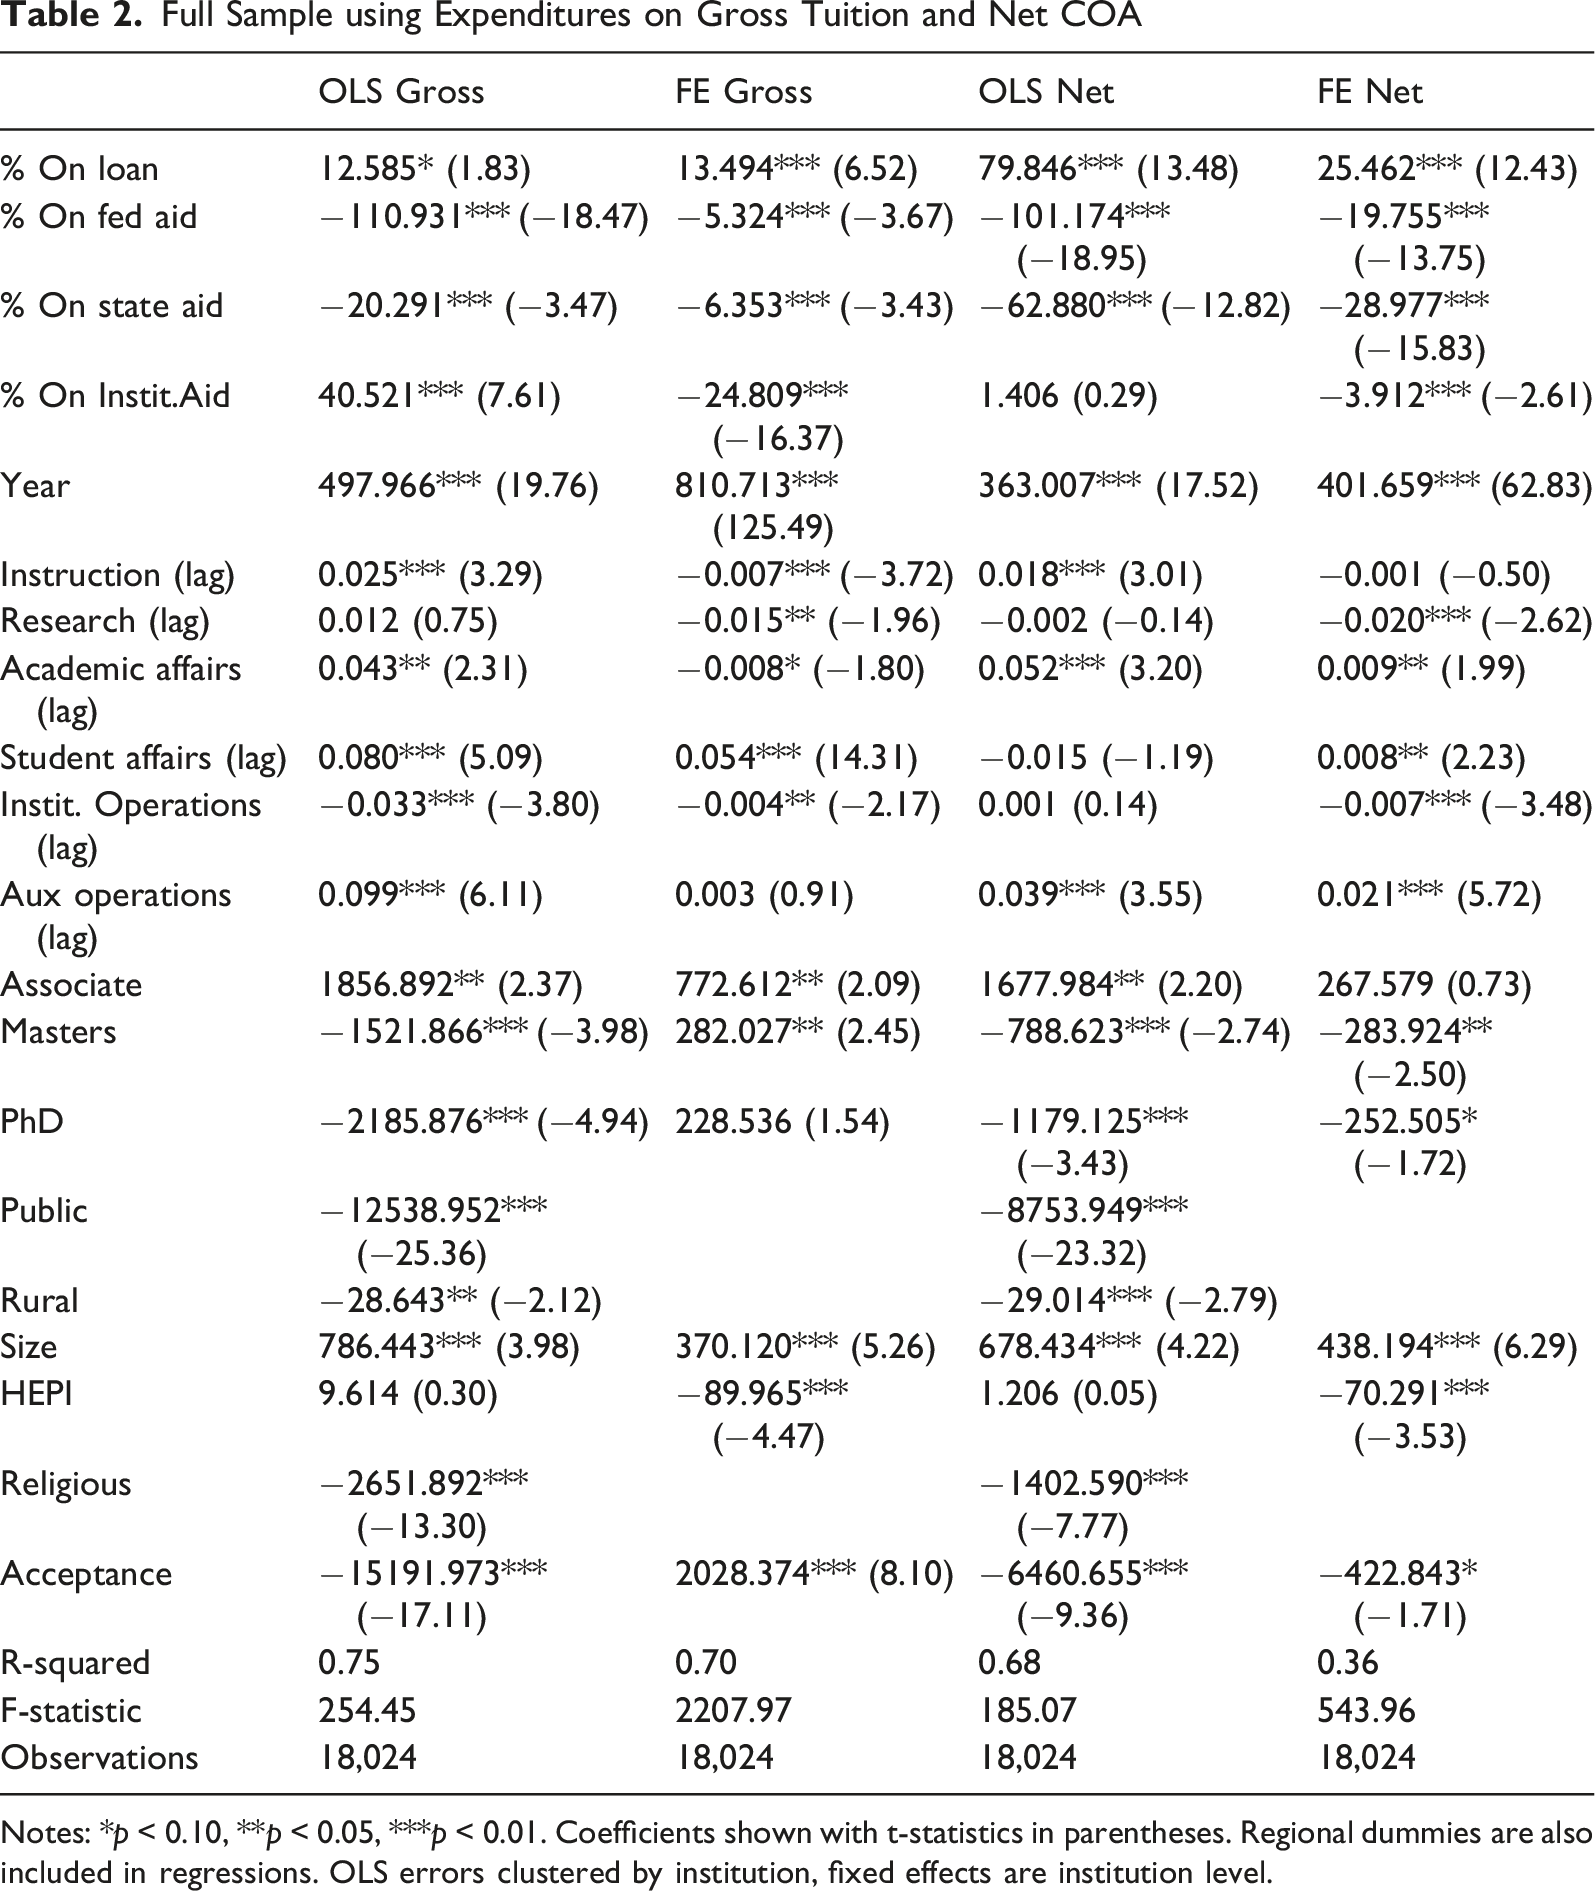
Notes: *p < 0.10, **p < 0.05, ***p < 0.01. Coefficients shown with t-statistics in parentheses. Regional dummies are also included in regressions. OLS errors clustered by institution, fixed effects are institution level.
Equations (1)–(4) are then run on stratified samples, using the expenditure per student variables. Employees per student is only used on the full sample. Equations (5)–(8) show the regression models for the sample stratified based on ownership type of the university (public, private non-profits, for-profit) with results contained in Tables S2–S4, contained in the online supplementary files. Equations (5) and (6) are OLS and equations (7) and (8) are GLS fixed effects. The variable 


These same four equations are then run on samples stratified based on the degree level of the institution (Associate, Bachelors, Masters, PhD) instead of being stratified based on ownership type. These are shown in equations (9)–(12) with results in Tables S5–S8, contained in the online supplementary files. Equations (9) and (10) are for OLS and equations (11) and (12) are for the GLS fixed effects. In this formulation, the ownership type variable (


Results
There are a number of significant results related to the paper’s hypotheses. The first hypothesis regarding employees per student being positively related to tuition was not supported by the analyses in Table 1. While coefficients were generally positive, they failed to reach standards of significance. However, the employee variable did not measure the roles of the employees at the institution (faculty, administrator, support staff). This may explain the insignificant result as institutions can have the same number of employees per student, but the distribution of those employees’ roles may vary by institution. This suggests the need for using more function specific data such as the expenditure variables.
The second hypothesis is that all expenditure categories, except for research, will be positively related to gross tuition and net cost of attendance. The results for the full sample are in Table 2. The regressions find academic affairs and student affairs to have the largest positive relationships with tuition across most of the results. This differs from Koshal et al. (1994) who found instructional costs to be a highly significant factor, although they did not include other types of expenditures in their analysis. The auxiliary operations variable has a consistently positive and significant coefficient. However, auxiliary operations are such a broad (and somewhat vague) category of expenditures that few conclusions can be made regarding that result. Coefficients on instruction are positive and significant in some regressions but not others and with relatively low magnitudes. In the OLS regressions in Table 2, the estimates on instruction are .025 and .018 for gross and net, respectively. This contrasts to much larger coefficients on academic and student affairs for the gross (.043, .080) and net (.052, insignificant) regressions. The coefficient for institutional expenditures is often negative and significant, making it related to lower tuition. This suggests that spending on staff roles such as budgeting, purchasing and logistics may produce some efficiency gains for institutions. The differences across expenditure categories are significant, justifying the disaggregated approach to spending taken in the analysis.
The third hypothesis predicts that the impact of research expenditures will vary based on the degree level of institution, with PhD level schools getting the highest return from research spending. This is not found to be the case. Research is negatively related to tuition and net costs in the full sample regression (Table 2) for the fixed effects model with relatively small coefficient sizes (−.015, −.02) and insignificant in the OLS regressions. However, the results in the subsamples are mixed. One notable result for the research expenditure variable is that it is positively related to tuition and COA in three of the four regressions for public institutions in Table S2. These results suggest varying returns to research spending across institutions. This result builds on the work of Ehrenberg et al. (2007) who found a positive relationship between research expenditures and tuition at 228 research universities.
The fourth hypothesis is that the availability of government grants and student loans will be positively related to gross tuition and net costs of attendance, the Bennett Hypothesis. The results are mixed for this hypothesis. More students on federal and state grants are found to be negatively related to gross tuition and net COA in the full sample results (Table 2). This is consistent with the work of Webber (2017) and Koshal and Koshal (2000) but not that of Lucca et al. (2019). This is found in most of the results stratified by ownership type of institution, Tables S2–S4 contained in the online supplementary files, with the exception of the fixed effects regressions on gross tuition. In that one model, government grants are found to be positively related to tuition. More students on government loans are positively related to gross tuition and net COA, consistent with the fourth hypothesis and with the work of Lucca et al. (2019). These results are consistent across degree level of the institution, Tables S5–S8 contained in the online supplementary files. This relationship is found in the full sample (Table 2) and across ownership type stratifications, except in the case of for-profit institutions (Table S4). This is logical as the IPEDS data only measures government sponsored student loans, which would be less prevalent at for-profit institutions. This suggests a nuanced view of the Bennett Hypothesis, with differing effects of loans versus grants.
There are some significant results among the control variables. The time trend variable exhibits a consistently significant, positive coefficient. This time trend effect is considerably higher in magnitude with regard to gross tuition than for the net cost of attendance. This suggests that gross tuition is going up faster than the net cost of attendance, likely because of increased institutional aid. As seen in Table 2, the OLS and FE results for the time trend variable on gross tuition are much larger (497, 810) than for the net cost regressions (363, 401). For the fixed effects regressions in Table 2, the magnitude of the time trend effect on net costs is approximately half the size of the effect on gross tuition, 810 versus 401. The control variables of religious affiliation and more rural location are negatively related to tuition, which is consistent with previous research (Kench & Wallace, 2010). Size is found to be positively related to tuition, both across institutions (OLS) and within institutions’ growth (fixed effects), with the strongest effects being for private non-profits. 5 Schools having higher acceptance rates is negatively related to the net cost of attendance, especially for private non-profits. As regression analyses measure correlations, this could be the result of either less selectivity resulting in lower tuition or in higher tuition resulting in fewer students applying. As expected, being a public university is negatively related to tuition, with a much larger impact on gross tuition (−12,538) than on net costs (−8,753), as shown in Table 2. This is consistent with private universities having higher gross tuition than public universities but also having more institutional financial aid to reduce net prices. 6 The coefficient sizes on institutional aid are much larger for private non-profits (Table S3) than for public institutions (Table S2). Stratifying the sample finds that as the degree level of the institution increases (Tables S5–S8), being a public university has a generally larger impact in decreasing the net cost of attendance. This is seen by the coefficient on the public institution variable in Tables S5–S8, ordered from Associate through PhD, consistently increasing in magnitude (−6752, −7554, −9468, −10073).
Conclusion
This paper has implications for institutions and for policy makers. The results concerning academic affairs might give pause to colleges which continue to grow the size of their non-teaching administrator payrolls. Not all expenditures are equal in terms of their impact on tuition. Investments in employees who are teaching may not increase tuition as much as some other forms of spending on employees. Institutions face challenges outside of their control such as the “demographic cliff,” but administrative overhead spending is within their decision-making powers. For policy makers, the results suggest that increased government grants may not be positively related to rising tuition costs. Government aid programs such as Pell grants might be expanded without concerns regarding increased tuition. This is an area which can benefit from additional panel studies across large numbers of institutions to more fully answer the question of government grants/loans and tuition.
One of the contributions to the literature is evidence for the utility of stratifying samples and using all types of institutions in these analyses. For example, the significant positive relationship between academic affairs expenditures and tuition is found for all stratifications except for at the Associate level or at for-profit institutions. Private non-profits appear to be experiencing a growing inequality between institutions with regards to size and selectivity not observed in public or for-profit institutions. The magnitude of these effects is much larger across non-profit institutions (OLS) than within institutions over time (Fixed Effects). Private non-profits which are expanding and/or becoming more selective can charge higher tuition rates while other private non-profits are not so fortunate. These are some of the significant differences in what drives tuition costs based on degree level and ownership type of institutions. The research in the literature needs to bear these differences in mind when choosing samples.
This paper has some additional limitations. The results do not provide guidance on institutions’ information technology (IT) decisions. This is a result of an inconsistency within IPEDS on how they account for IT investments. Also, we are not considering the market structures in which the colleges operate, including mergers, which could impact tuition (Hoxby, 1997; Russell, 2021). In terms of future research, this paper’s results suggest that work focusing on the returns to research spending across differing types and sizes of institutions could be a fruitful topic for further study. The paper’s results suggest that further study into the impact of different type of university expenditures on tuition is warranted.
Supplemental Material
Supplemental Material—Gross Tuition and Net Cost of Attendance in Higher Education: Does the Type of University Expenditure Matter?
Supplemental Material for Gross Tuition and Net Cost of Attendance in Higher Education: Does the Type of University Expenditure Matter? by Michael A. Quinn, Joseph Twomey in The American Economist
Footnotes
Funding
The authors received no financial support for the research, authorship, and/or publication of this article.
Declaration of Conflicting Interests
The authors declared no potential conflicts of interest with respect to the research, authorship, and/or publication of this article.
Supplemental Material
Notes
Author Biographies
Appendix
References
Supplementary Material
Please find the following supplemental material available below.
For Open Access articles published under a Creative Commons License, all supplemental material carries the same license as the article it is associated with.
For non-Open Access articles published, all supplemental material carries a non-exclusive license, and permission requests for re-use of supplemental material or any part of supplemental material shall be sent directly to the copyright owner as specified in the copyright notice associated with the article.