
Abstract
Introduction
Drug metabolism is primarily carried out by the cytochrome P450 (CYP) family of enzymes in the liver. Based on an individual's diplotype, they can be classified into poor (PM), intermediate (IM), normal (NM), rapid (RM) or ultrarapid (UM) metabolizers. Here, we show the distribution of allele frequency and metabolizer status across ancestries for CYP2D6, CYP2C19, CYP2C9, CYP2B6, CYP3A4 and CYP1A2 in a cohort from Ontario, Canada.
Methods
Patients currently taking or starting a psychotropic drug (N = 8,280) were enrolled. Patients self-reported their ancestry, and DNA was analysed for the CYP2D6, CYP2C19, CYP2C9, CYP2B6, CYP3A4 and CYP1A2 genes using a commercial pharmacogenetic test and metabolizer status was assigned using ClinPGx as a reference.
Results
The cohort was primarily of European ancestry (70%), followed by individuals with mixed ancestry (9.3%). The combined frequency of PMs and UMs, representing the extremes of enzyme activity, was highest for CYP2C19 and CYP2D6, with this frequency being approximately 8% for each enzyme. The frequency varied considerably by ancestry, with up to 24% of individuals of Caribbean descent being CYP2C19 PMs or UMs, for example, compared to only 7% among those of Latin, Central and South American ancestry. Of the entire sample, only 5.1% were NMs across all enzymes, meaning 94.9% of individuals had a non-NM status and would benefit from pharmacogenetic testing.
Conclusion
Overall, this study provides a useful reference for variations in the CYP family of genes in the population of Ontario, Canada.
Introduction
The cytochrome P450 (CYP) family of enzymes plays a key role in drug metabolism, mainly in the liver, where they catalyse the oxidation of drugs. 1 Key CYP pharmacogenes that are known to metabolize psychiatric medications include CYP2D6, CYP2C19, CYP2C9, CYP1A2, CYP2B6 and CYP3A4.2,3 Notably, CYP2D6, CYP3A4 and CYP2C19 together metabolize over 50% of all current psychotropic drugs. 4 Genetic variants such as single-nucleotide polymorphisms (SNPs) and copy number variants (insertions, deletions, hybrid genes) in CYP genes affect enzyme function.5–7 Strings of these genetic variants are designated as haplotypes or star alleles of these genes. The wild-type allele with “normal” function is usually assigned as *1, and other alleles may have increased/decreased or no function. 8 An individual's combination of haplotypes (their diplotype) for a CYP gene dictates their rate of drug metabolism by the corresponding CYP enzyme, categorizing them as a poor (PM), intermediate (IM), extensive/normal (NM), rapid (RM) or ultrarapid (UM) metabolizer. 9
The metabolizer status (MS) of these genes can be used to optimize treatment. Organizations such as the Clinical Pharmacogenetics Implementation Consortium and the Dutch Pharmacogenetics Working Group (DPWG) provide drug-specific guidance to adjust dose or choose alternative medication. 10 Similarly, regulatory bodies such as Health Canada, the European Medicines Agency, and the US Food and Drug Administration also provide specific therapeutic management recommendations for medications based on CYP genotypes.11,12
A growing body of research suggests that pharmacogenetics/pharmacogenomics (PGx)-guided treatment reduces the need to switch medications, decreases side effects, improves medication adherence, increases remission/response and decreases total health-care expenditure.2,9,13 The Individualized Medicine: Pharmacogenetics Assessment and Clinical Treatment (IMPACT) study, a naturalistic study of patients using psychotropic drugs, was conducted in Ontario, Canada, to assess the implementation and benefits of PGx testing. 14 Preliminary analysis of a subset of IMPACT participants (n = 1,871) showed that individuals who received medications matching their genetic profile had improved antidepressant response compared to participants who did not. 15
Given the considerable diversity among IMPACT participants with regards to age, ethnicity and diagnoses, and differences in the frequencies of CYP genetic variants across ancestries, characterizing the distribution of allele frequencies for important PGx genes is a crucial first step in understanding factors contributing to variable treatment outcomes.14,16 This paper examines CYP genetic diversity in the IMPACT study and provides insight into genetic and MS variation across the population of Ontario, Canada.
Methods
Inclusion/Exclusion Criteria
Patients included in the IMPACT study were residents of Ontario, aged ≥7 years, who were using psychotropic drugs or anticipated to be using them in the immediate future in relation to study enrolment. There was no restriction on the patient's diagnosis, and the patients represent a wide range of mental illnesses, with over 50% of the participants having comorbidities. The inclusion criteria were intentionally broad to facilitate generalizability of results from this study to the urban Ontario population. Patient recruitment for the IMPACT study was carried out via referral from doctors, nurse practitioners, nurses, social workers, pharmacists, case managers or occupational therapists. 14 This study was approved by the Centre for Addiction and Mental Health (CAMH) Research Ethics Board, and informed consent was obtained from participants prior to enrolment in the study.
Genetic Analyses
Buccal swab samples were used for DNA extraction and PGx assay (GeneSight report, Assurex Canada, Toronto, Canada). At the time the study was conducted, the PGx test panel included a total of 58 variants in 8 genes, as well as detection of CYP2D6 duplication (without specifying which allele is duplicated) (Table 1). Genotyping was done by first amplifying relevant gene regions using polymerase chain reaction, then determining the haplotypes using gel electrophoresis (CYP2B6), custom xTAG® assays (Luminex Molecular Diagnostics, CYP1A2, CYP2C19, CYP2C9, CYP3A4) or the xTAG® CYP2D6 Kit (Luminex Molecular Diagnostics). 15
List of Genes and Allelic Variants Assayed by the PGx Test.
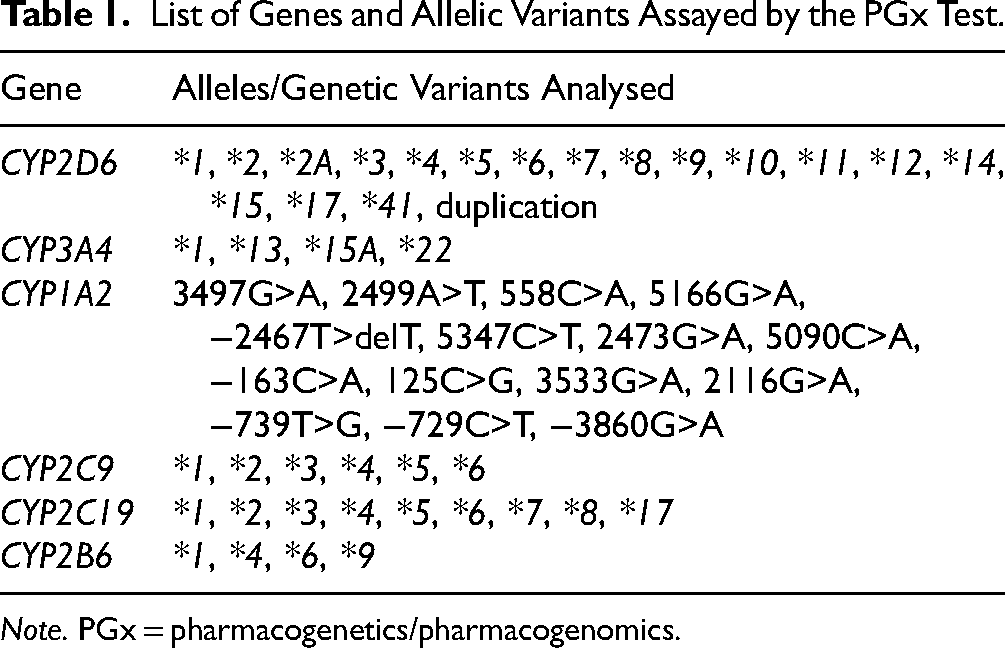
Note. PGx = pharmacogenetics/pharmacogenomics.
Statistical Analysis
A total of 8,280 participants had complete data from the PGx panel. Participants self-reported ancestry along with estimated ancestral proportions in free-text format, and the responses were mapped to specific population groups (Supplemental Table 1). The population groups identified in the sample were African, Asian (Other), Caribbean, East Asian, European, Indigenous Peoples, Jewish, Latin, Central or South American, Oceanian, South Asian or Mixed (if several ancestries were reported), with some participants having unknown ancestry. Psychiatric diagnoses were extracted from referral forms that were entered by the referring physicians. R 4.4.0 was used for all statistical analyses, with UpSetR being used to summarize the distributions of diagnoses (see Figure 2) and circlize being used to visualize the distribution of MSs across the CYP2D6 and CYP2C19 genes (Supplemental Figure 1). We first summarized the frequencies of different haplotypes and MSs for CYP2D6, CYP2C9, CYP2C19, CYP2B6, CYP3A4 and CYP1A2 for each population, and combined haplotypes with frequencies <5% within a separate group. For CYP1A2, GenoStar was used to obtain diplotypes from unphased genotypes (Supplemental Table 2).17,18 MS frequencies were determined using diplotype–phenotype tables from ClinPGx for CYP2D6, CYP2C9, CYP2C19 and CYP2B6.19–22
For individuals with a CYP2D6 duplication, an MS was assigned for individuals who were homozygous for a particular haplotype, had two haplotypes with the same allele function, had two potential activity scores (ASs) that would fit within the same MS definition or had only one haplotype that had previously been documented to have a duplication (Supplemental Table 3). In concordance with the ClinPGx guidelines for CYP2D6, an individual was designated as a PM if the AS was 0, IM if the AS was >0 and ≤1, NM if the AS was >1 and ≤2.25 and UM if the AS was >2.25. Individuals for whom it was not possible to determine which of the haplotypes was duplicated (and therefore, what would be the total AS and consequent MS) were excluded from this (n = 94).
As ClinPGx does not have diplotype–phenotype tables for CYP3A4, we created this table using allele information from ClinPGx and DPWG recommendations (Supplemental Table 4). 23 CYP1A2 was excluded from MS analyses as the phenotype can differ based on smoking/caffeine consumption, the data of which were not captured in our study. 24
Results
Descriptive statistics for the dataset are presented in Table 2. Our dataset had 64% female participants, and the age range was from 7 to 93 years, with a mean age of 37 (Figure 1). The majority of participants were of European ancestry (70%), followed by 9.3% participants who had mixed ancestry.
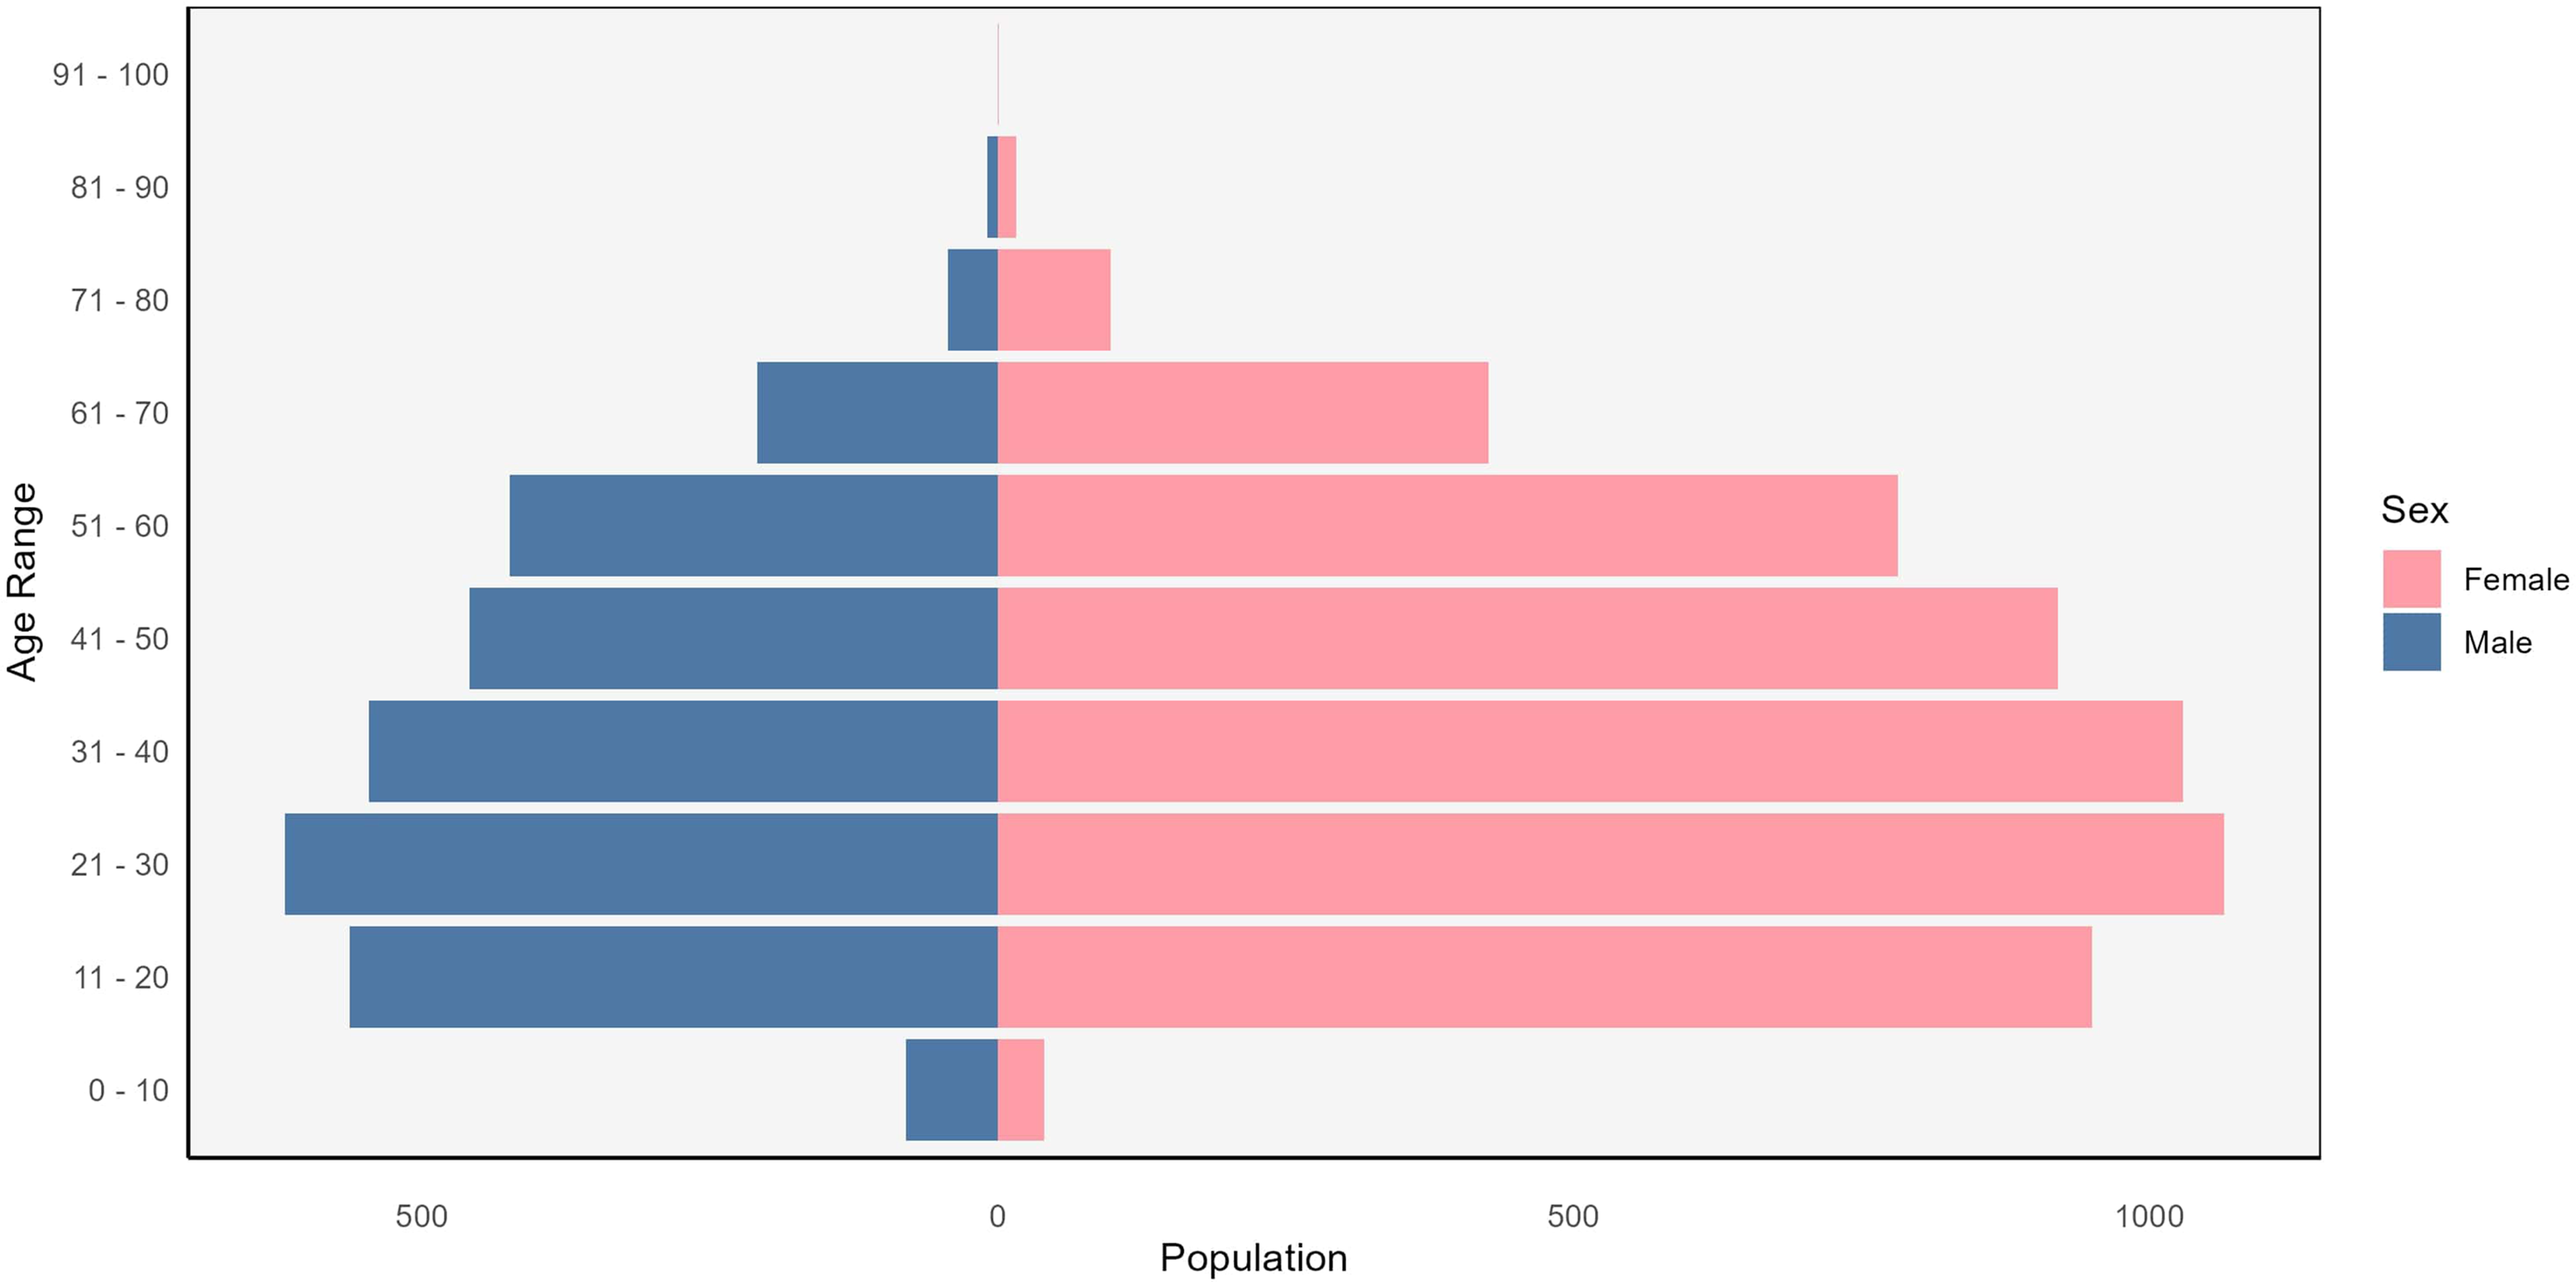
Distribution of sex by age in the study population.
Descriptive Statistics of Participant Demographics.
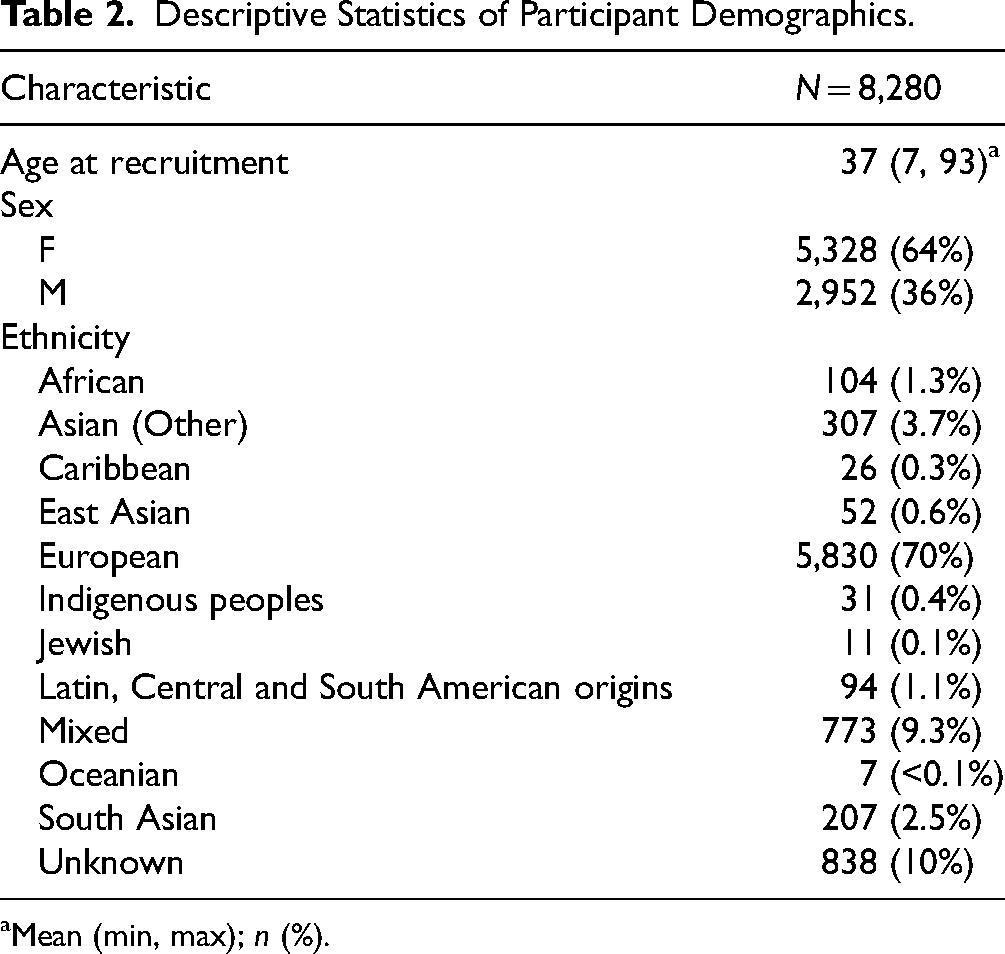
Mean (min, max); n (%).
Figure 2 shows the distribution of different psychiatric diagnoses in the participants. The majority of individuals had both anxiety and major depressive disorder (MDD) diagnoses (35.5%), followed by individuals with only a diagnosis of MDD (19%), or only anxiety (13%). There were also relatively high numbers of individuals with bipolar disorder and psychosis (3.95% and 3.6%, respectively).
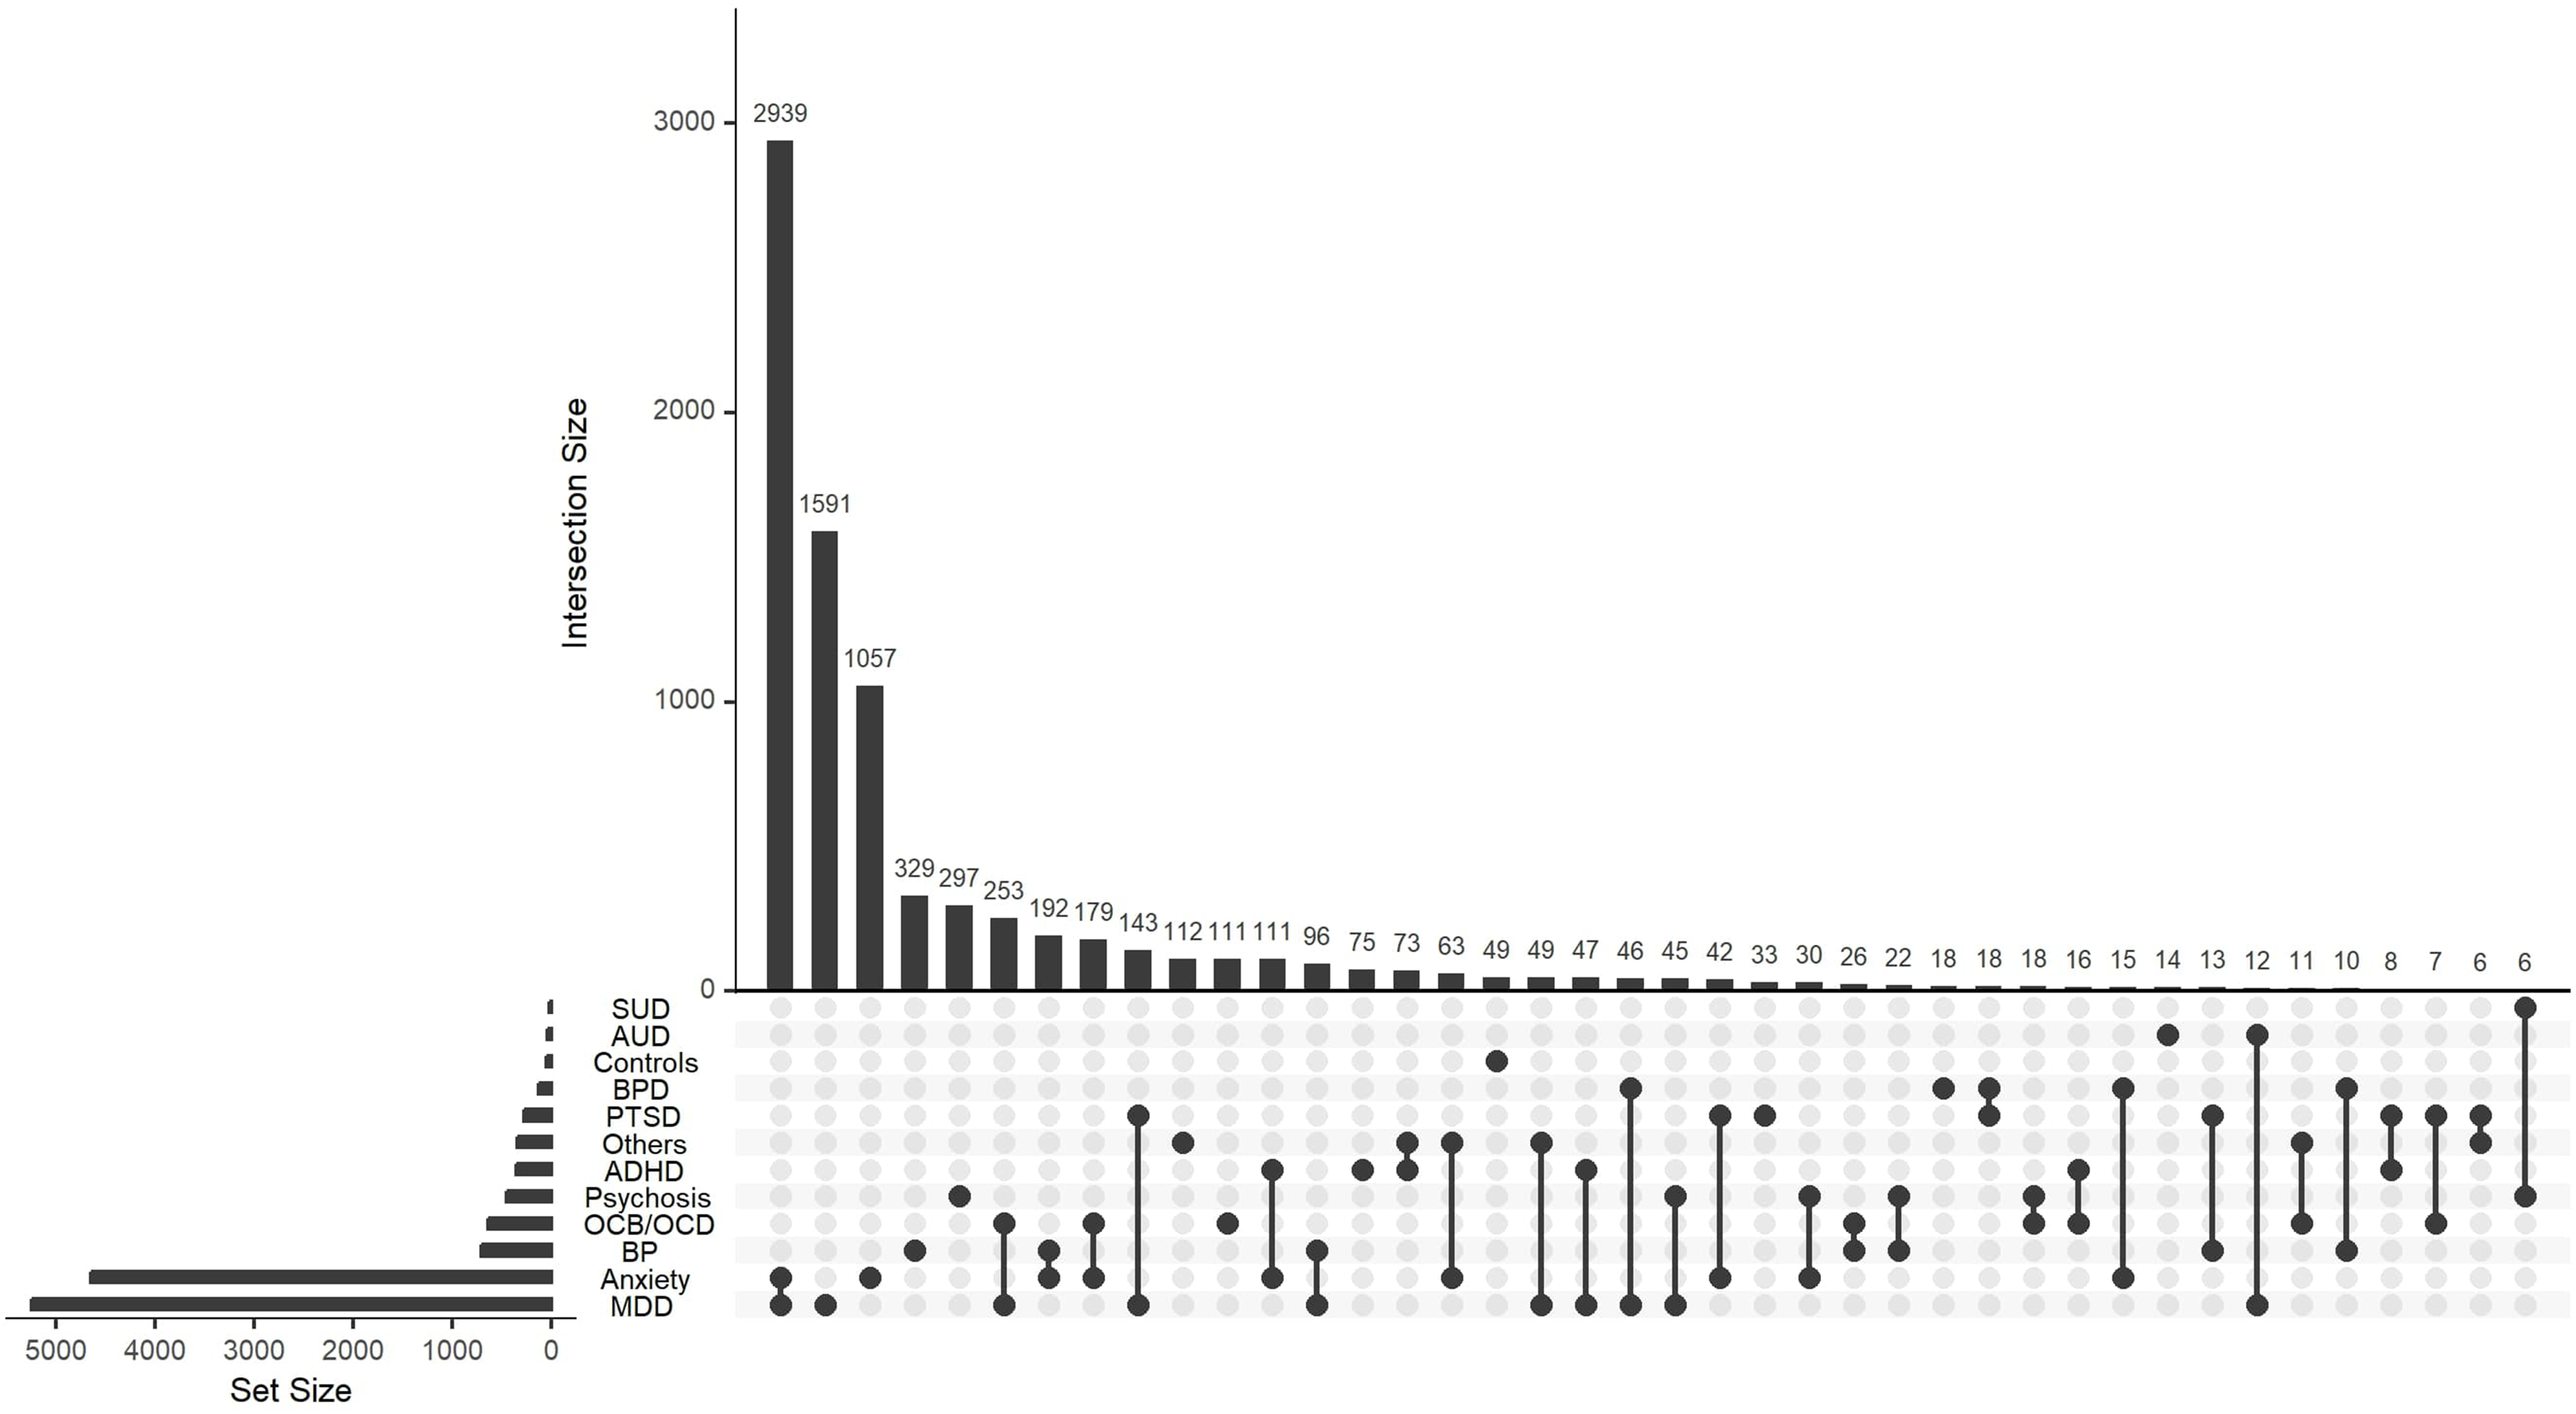
Frequencies of different diagnoses in the study, including individuals with comorbidities and healthy controls. Psychiatric disorders in the population are listed on the left. ADHD = attention deficit hyperactivity disorder; AUD = alcohol use disorder; BP = bipolar disorder; BPD = borderline personality disorder; MDD = major depressive disorder; OCB/OCD = obsessive compulsive behaviour/disorder; PTSD = posttraumatic stress disorder; SUD = substance use disorder.
The allele frequencies for each CYP gene according to ancestry are shown in Figure 3, and are tabulated in Supplemental Table 5. For all genes except for CYP2D6, a majority of individuals of all ancestries possess the *1 haplotype (wild-type allele). CYP2D6 exhibits a high level of genetic variation, with 177 haplotypes identified to date. 5 This diversity is reflected in our dataset, where we observed 15 distinct haplotypes. In addition to CYP2D6*1, CYP2D6*2A, CYP2D6*4 and CYP2D6*41 are seen in relatively high proportions across most ancestries (overall frequency 21%, 17% and 10%, respectively). CYP2D6*5 was observed at the highest frequency in individuals of African ancestry (5%), and the lowest in European ancestry (2%). We also observed relatively high frequencies of CYP2D6*10 specifically in individuals of Asian, East Asian and Oceanian ancestry (approximately 40–50%).
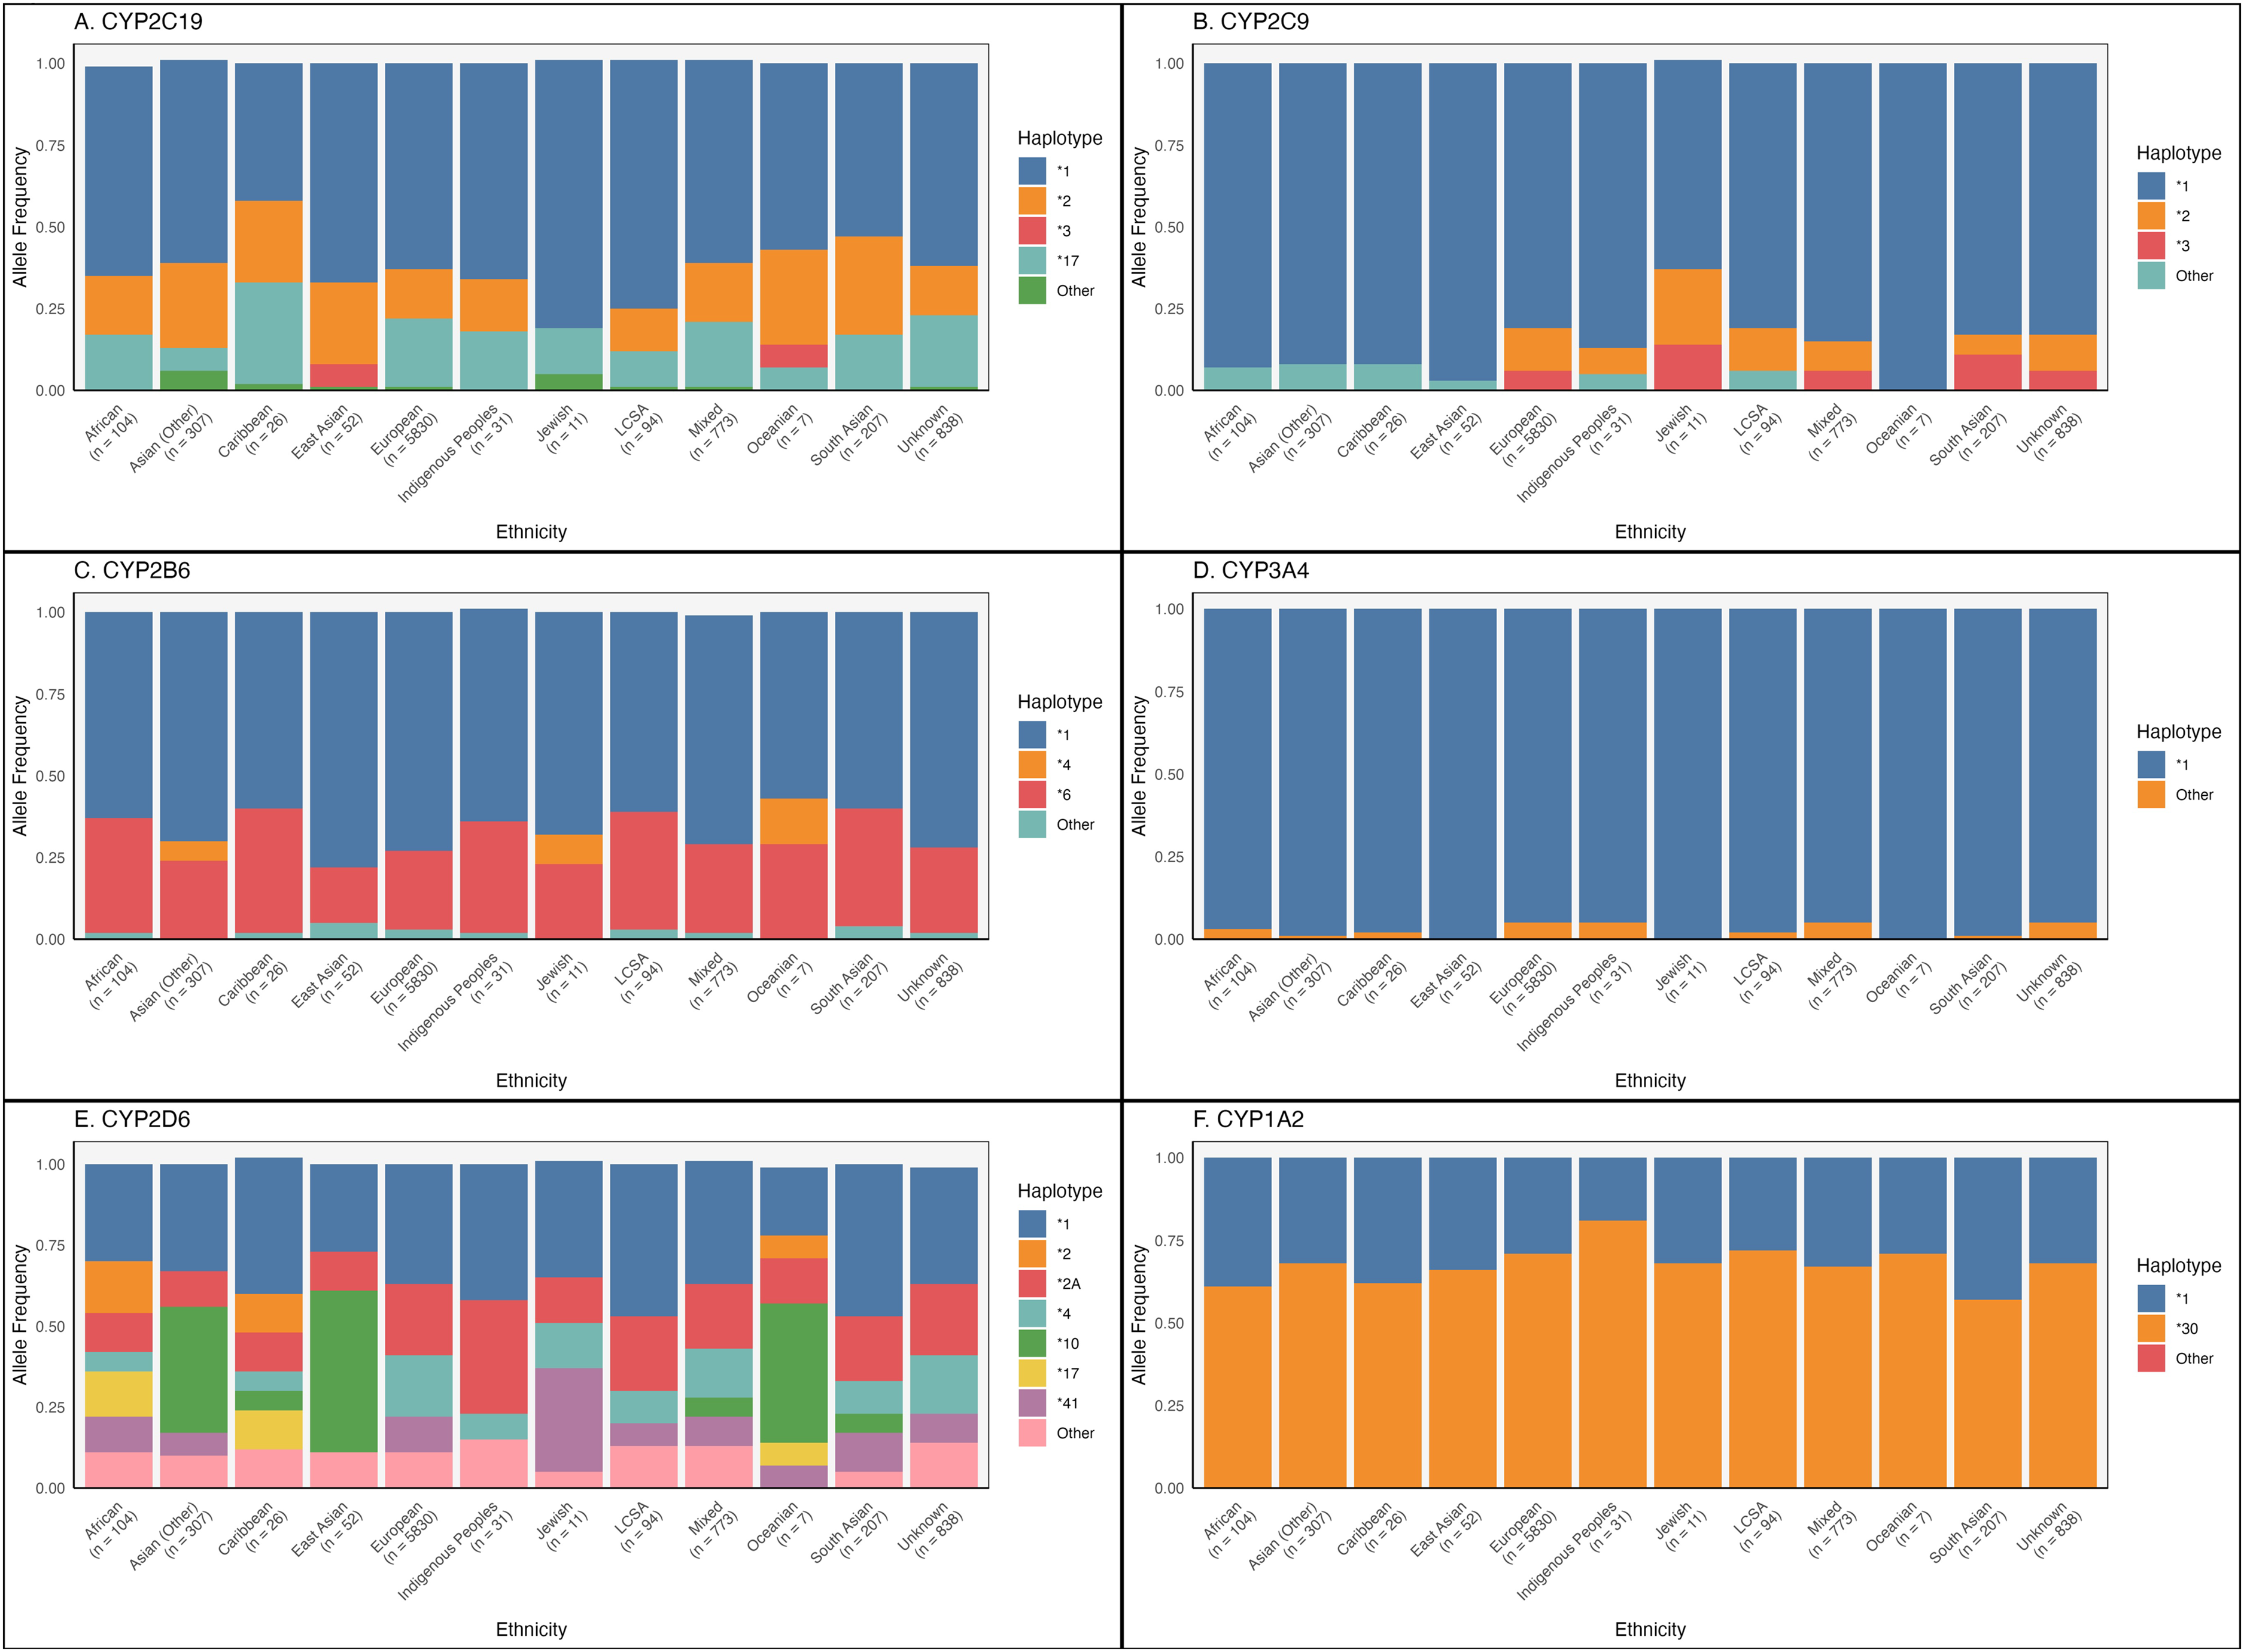
Frequencies of alleles by ethnicity. The number of participants in each ancestral group are shown below the corresponding group names. (A) CYP2C19, (B) CYP2C9, (C) CYP2B6, (D) CYP3A4, (E) CYP2D6, (F) CYP1A2. LCSA = Latin, Central and South American origins.
For CYP1A2, the majority of participants across ancestries possessed the *30 allele (which is characterized by the −163C>A variant). This allele is inducible by smoking or high caffeine consumption, and ranges in frequency from 57% in South Asian ancestry to 81% in Indigenous ancestry in our sample. 24
A majority of participants from all ancestries were NMs when considering each CYP gene individually (Figure 4; Supplemental Table 6). This follows from the high frequency of *1 alleles across ancestries for most CYP genes. There is a high proportion of CYP2D6 NMs despite the relatively lower frequency of CYP2D6*1 alleles. This is due to the high frequencies of CYP2D6*2A, which also has a similar function to CYP2D6*1. However, only 5.1% of our cohort were NMs across all CYP enzymes with known MS. This ranged from 14% in the Oceanian and Latin, Central and South American population, to 0% in the Caribbean population (Figure 5; Supplemental Table 7).
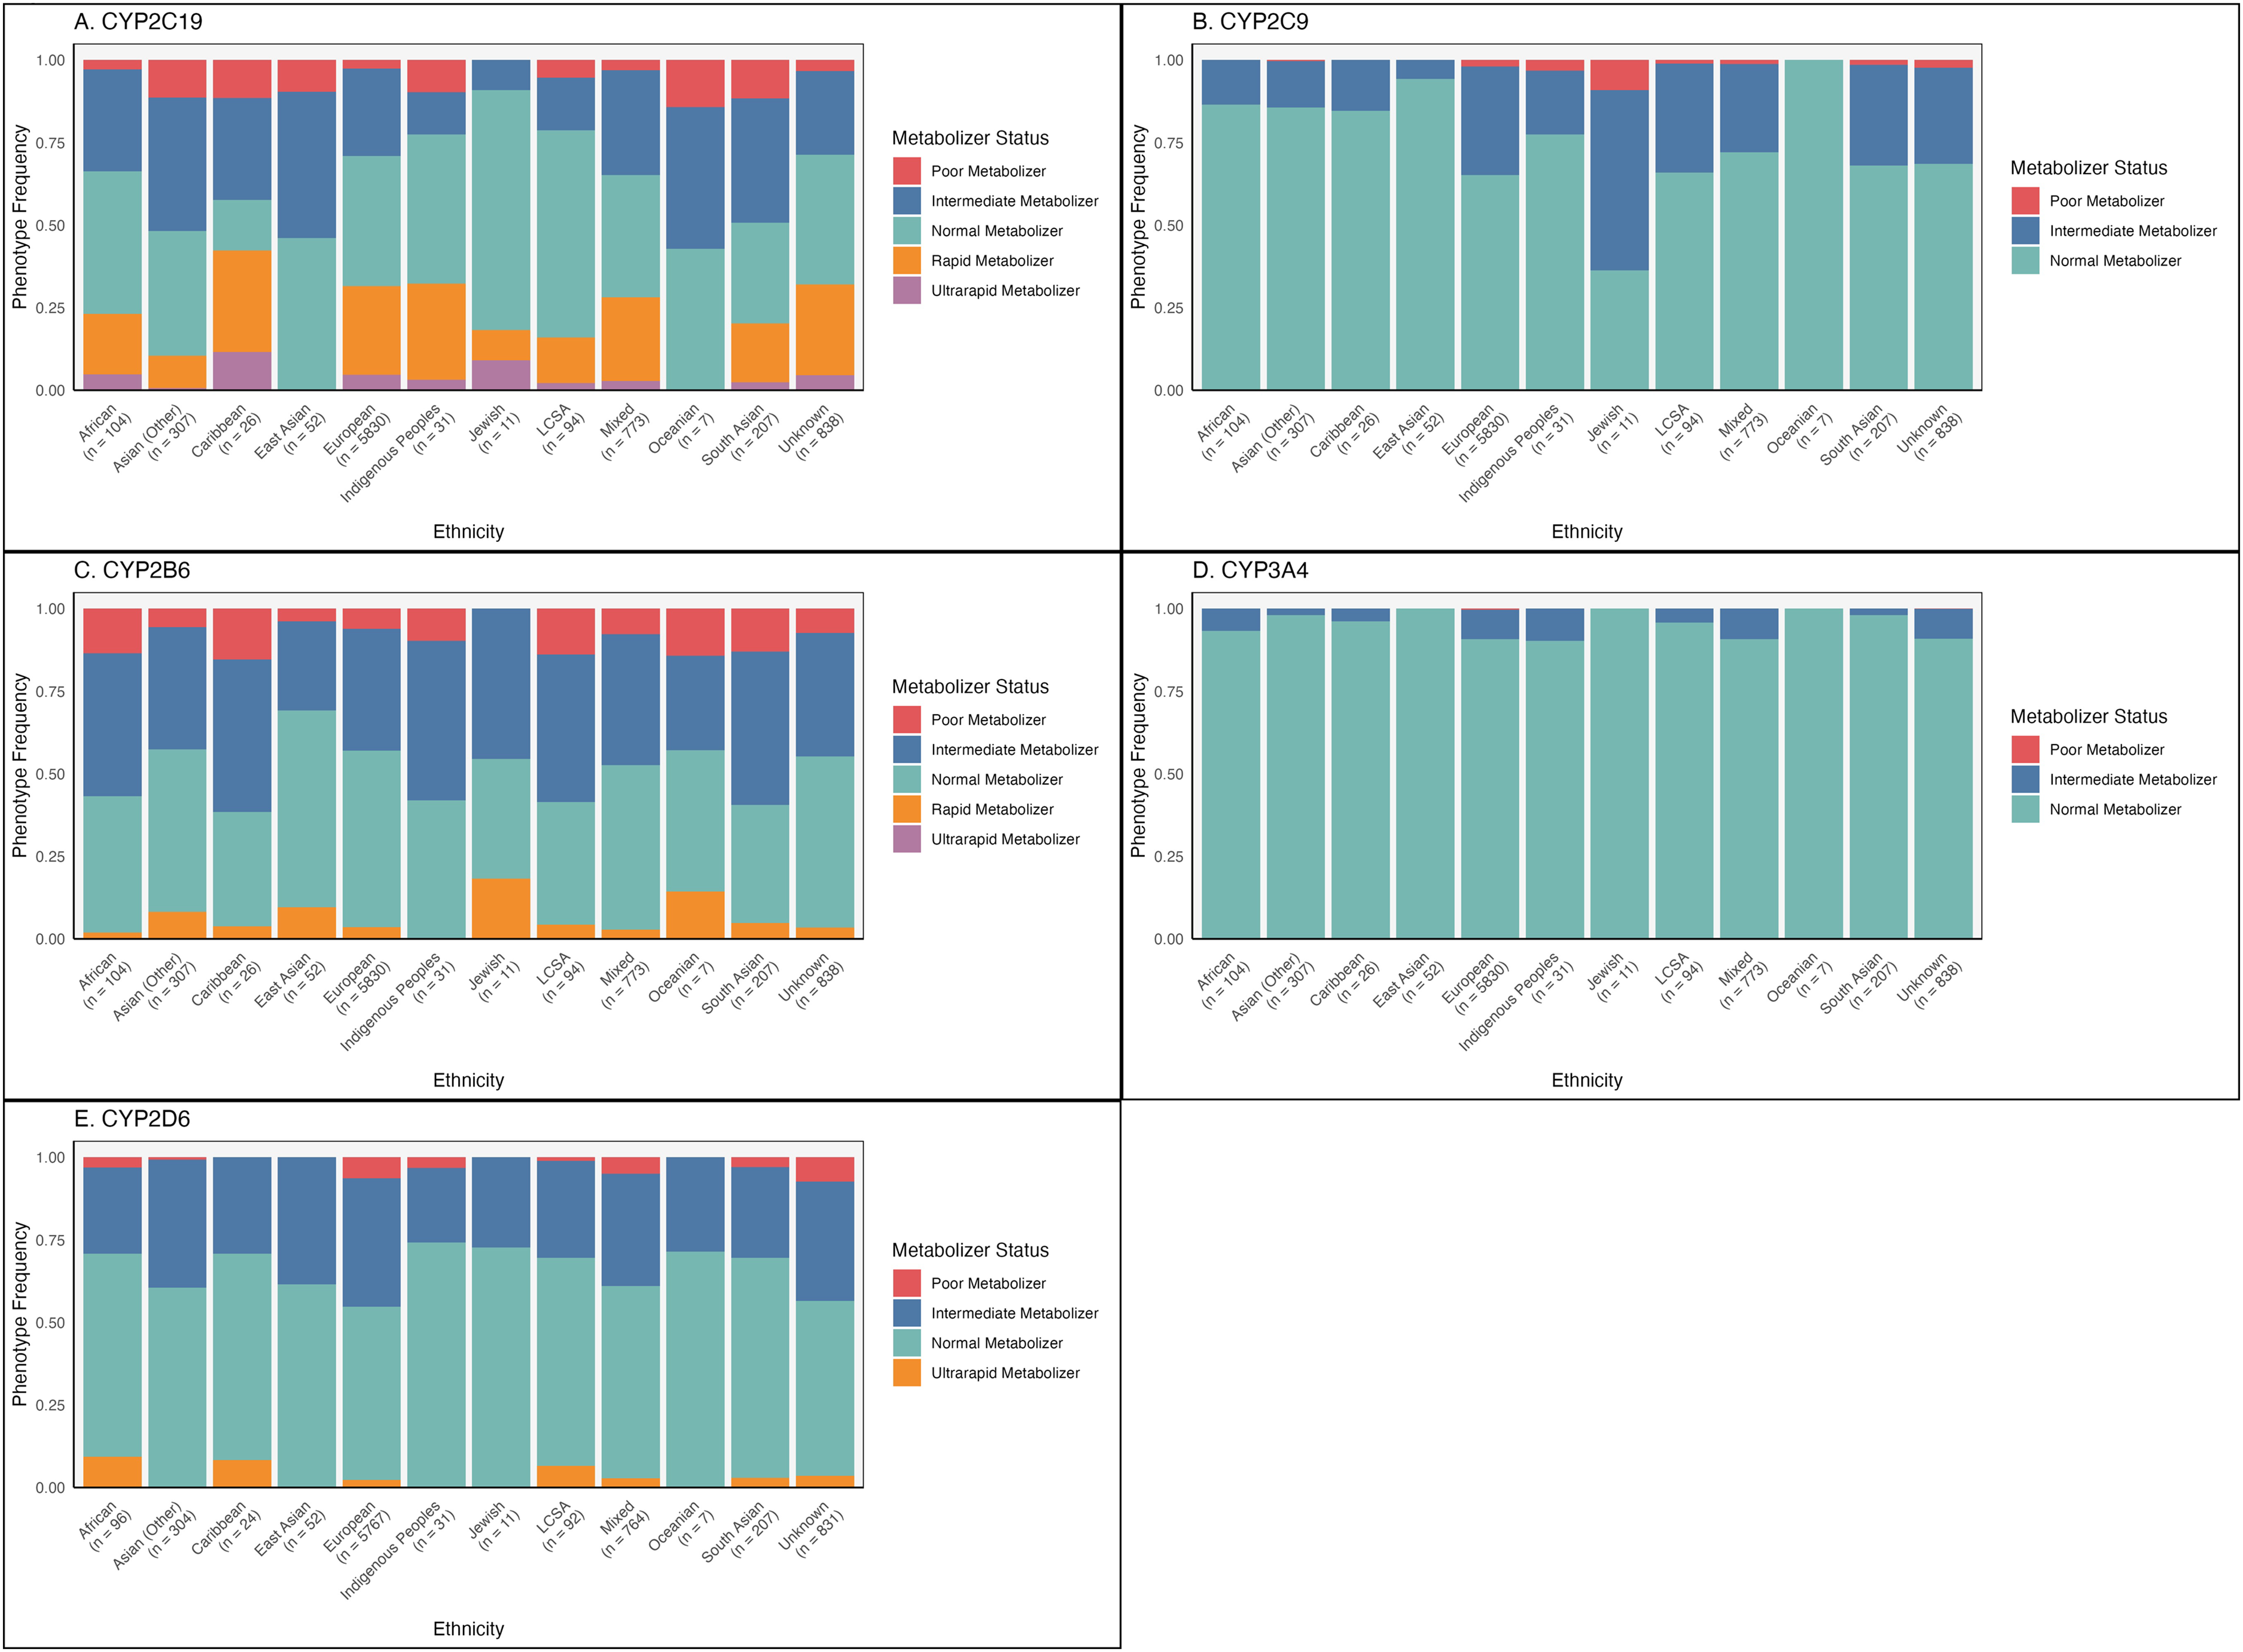
Frequencies of metabolizer status by ethnicity. The number of participants in each ancestral group are shown below the corresponding group names. (A) CYP2C19, (B) CYP2C9, (C) CYP2B6, (D) CYP3A4, (E) CYP2D6. LCSA = Latin, Central and South American origins.
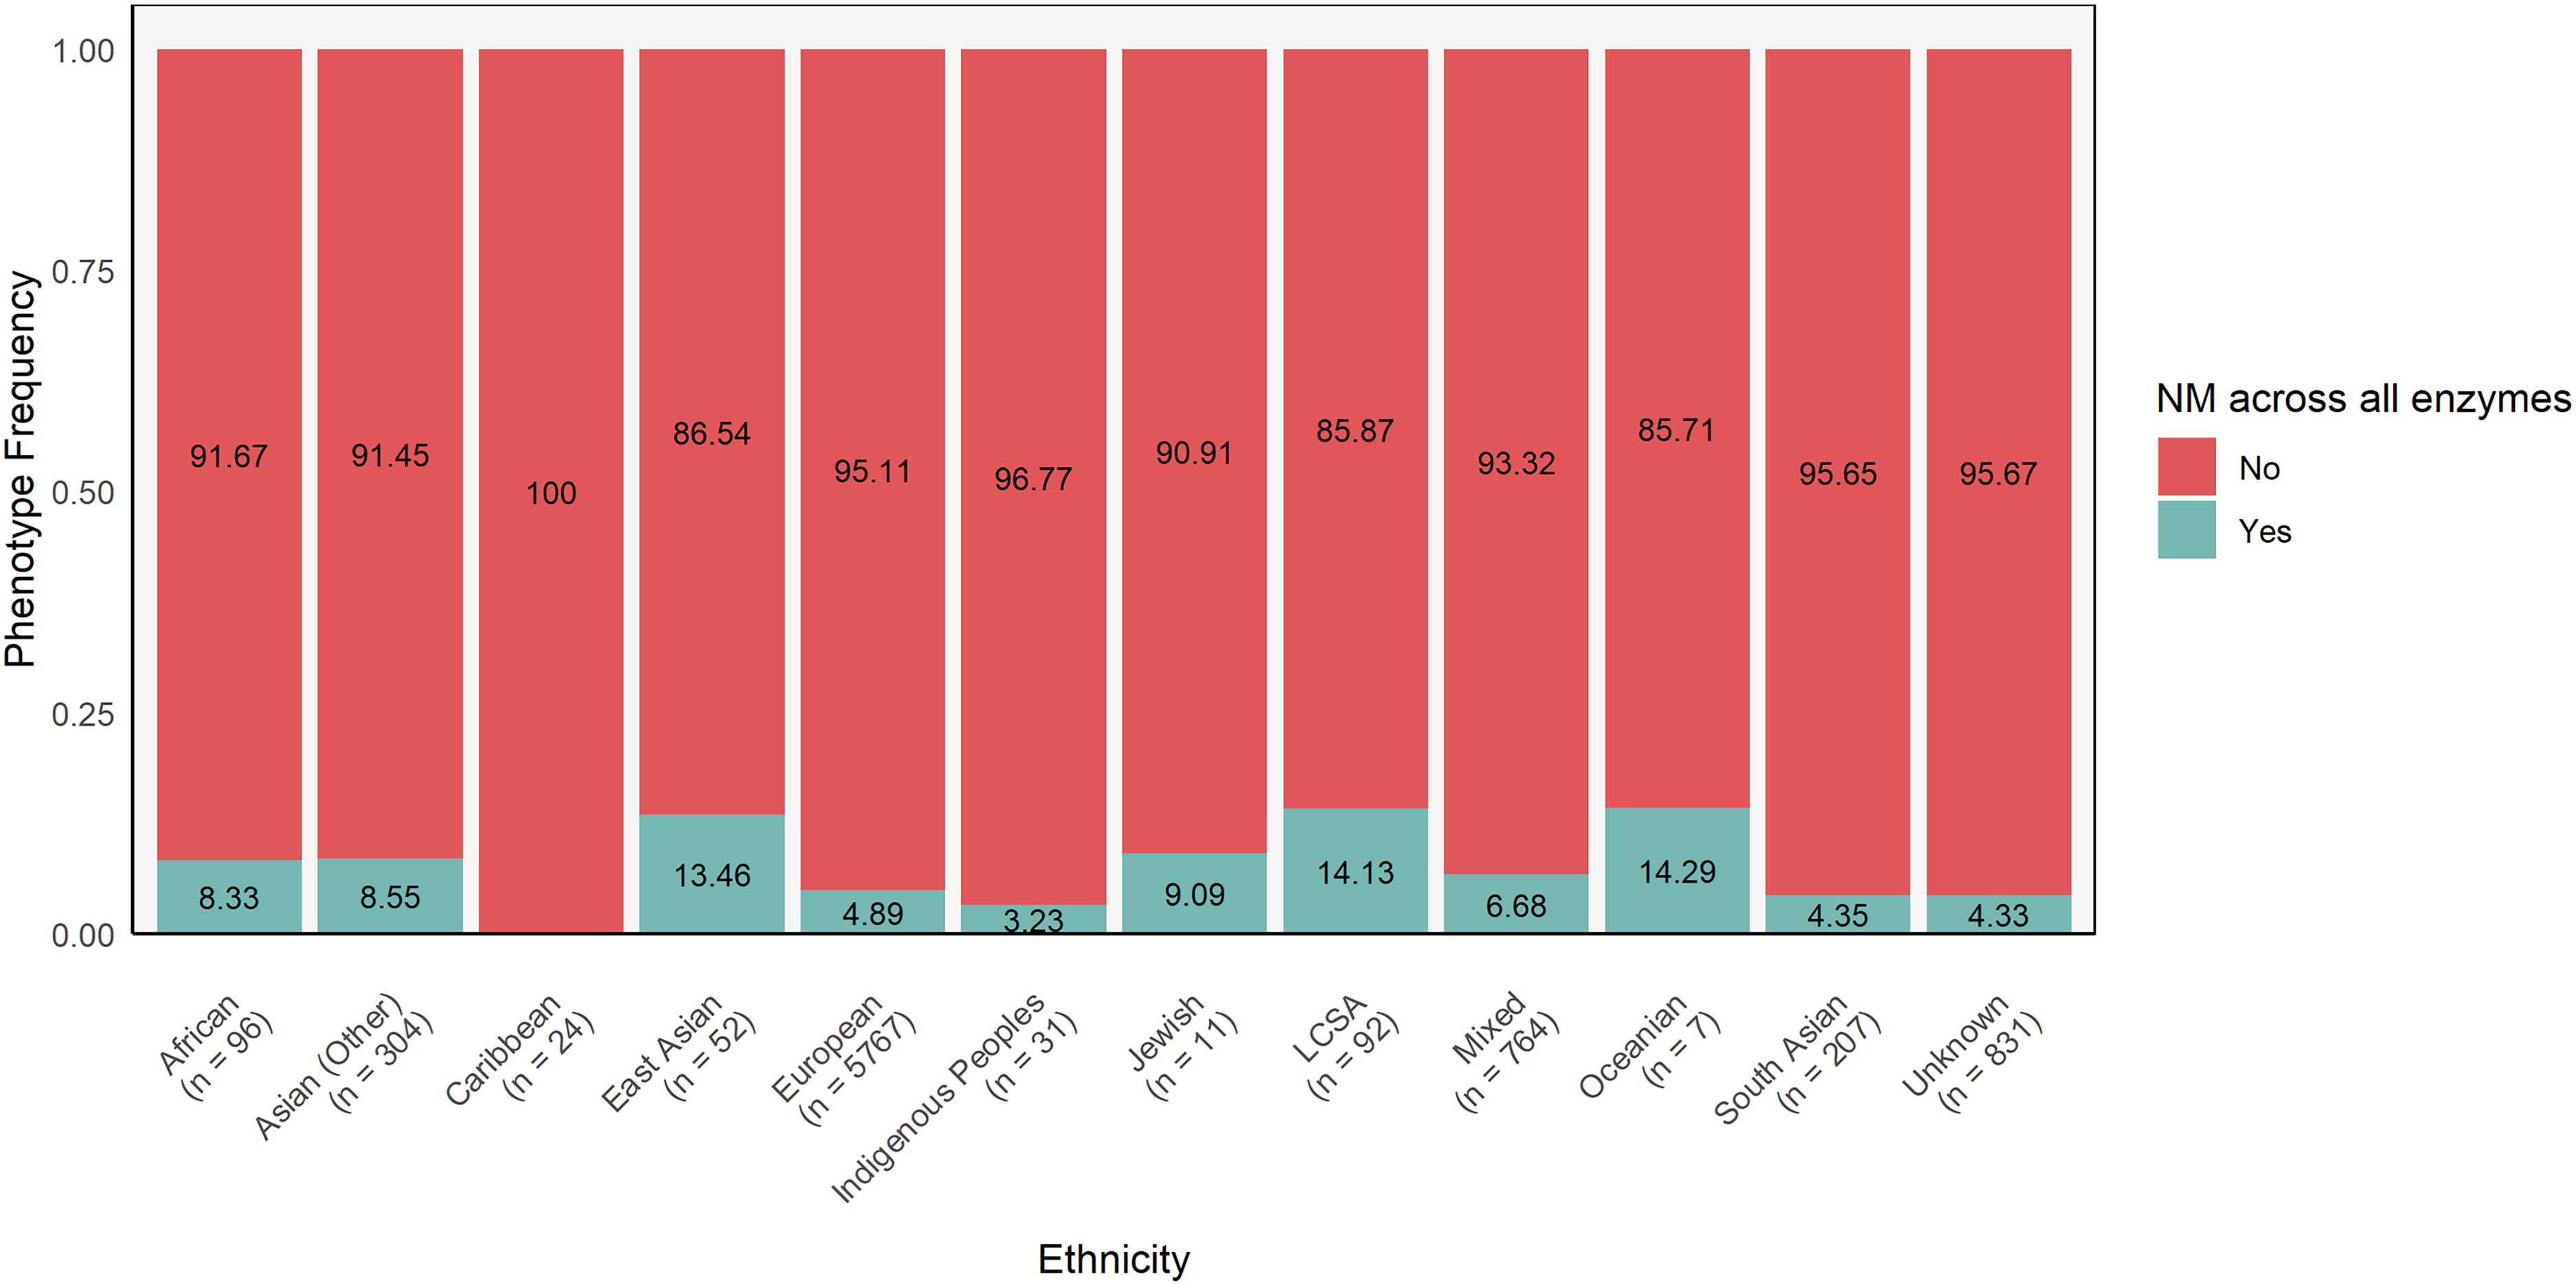
Frequencies of individuals who are normal metabolizers across all enzymes (excluding CYP1A2) by ethnicity. The number of participants in each ancestral group are shown below the corresponding group names. LCSA = Latin, Central and South American origins.
Discussion
In summary, these results provide an overview of the diversity of genetic variants of CYP genes in individuals taking psychotropic medications in Ontario, Canada. In the 2011 census, Statistics Canada reported that 19.1% of the population belonged to a visible minority (defined as individuals other than Aboriginal peoples, who are of non-European ancestry or nonwhite in colour), and 5.6% were of North American Aboriginal origins.25,26 The white, European ancestry individuals, therefore, made up 75.3% of the population. Our sample is approximately 70% European ancestry, indicating that it is generally representative of the larger Canadian population. People of South Asian origin made up 4.1% of Canada's population, 2.5% Black (including both African and Caribbean ancestry), 4.7% East Asian, 3.4% other Asian origins, 1.0% Latin American and 0.7% other visible minorities. 27 Our sample seems underrepresented for all of these categories except for those of other Asian origins. However, Statistics Canada does not provide separate data for individuals with mixed ancestry, and an individual who reports multiple ancestries is counted under each ancestry reported. 28 As a result, self-reported ancestries are duplicated in the census data. This likely explains why our dataset has marginally lower proportions than that reported by the census, and has a notably high percentage of individuals with mixed ancestry.
For CYP2D6, the distribution of allele frequencies in our sample is somewhat reflective of that in the global population, but is limited by the small sample sizes of individuals of non-European ancestry. For example, CYP2D6*10 is expected to have a frequency of approximately 40% in East Asians, but only 1–5% in other ancestries. 29 In our sample, we observed this allele at a frequency of 40% in each of the Asian (Other) and Oceanian groups as well. The increased frequency in the Asian (Other) group may be due to grouping individuals with self-reported “Asian” ancestry here, rather than specifically with East Asians, even though the term “Asian” is colloquially used to refer to individuals of East Asian ancestry. With respect to the Oceanian group, this is likely because our sample had only six individuals in this group, which does not adequately represent the wider population of Oceanian ancestry.
When comparing the diversity of haplotypes, the results are similar across all genes investigated in both our study and the UK Biobank (UKBB). 30 However, for CYP2B6, the frequency of the CYP2B6*9 allele is higher in the UKBB (approximately 5–10% depending on ancestry), whereas a negligible proportion of participants in this study possess this haplotype. This allele has been found at relatively low frequencies, ranging from 1.5% in populations of European ancestry to 10% in populations of Near Eastern ancestry. 22 In the UKBB population, the information on the SNP rs2279343 that distinguishes CYP2B6*6 from CYP2B6*9 is missing, leading to the overestimation of CYP2B6*9 frequency. 30 UKBB participants also carried CYP2B6*5 (6–10%) and CYP2B6*18 (7–8%), alleles which were not tested in this cohort. 30
For CYP2D6 MS, we observed a slightly smaller proportion of NMs and a slightly larger proportion of IMs than in the UKBB. 30 CYP2D6 structural variants (including duplications, deletions and hybrid genes) were not included in the analysis of the UKBB, precluding the identification of UMs. 30 While we do have information on the presence of a CYP2D6 duplication, it is not indicated which of the two CYP2D6 alleles were duplicated. Therefore, the proportion of UMs is an underestimate as we excluded individuals with unresolved heterozygous CYP2D6 duplications.
The CYP2C19 MS distribution was largely concordant with the UKBB results, and the frequency of alleles with increased/normal/decreased function observed here is largely similar to the frequencies found when analysing the global population.16,30 The same also applies to the frequencies of CYP2C9 alleles. However, CYP2C9*9, an allele that was not genotyped in this sample, was detected at a frequency of 7–9% in individuals of African ancestry. 30 We observed that individuals of Jewish ancestry had a relatively higher proportion of CYP2C9 PMs (6%) compared to those of other ancestries, which is consistent with previous findings. 31 The next highest proportion of CYP2C9 PMs was in Indigenous peoples (3%). However, Fohner et al. observed that the CYP2C9 allele and MS frequencies of individuals of Native American ancestries were similar to those of European ancestry. 32 Further, in those of North and South American Indigenous origins, CYP2C9 PMs are observed at a frequency of only 0.1% overall. 33 The discrepancy with our results may be explained by the fact that the current sample has only 30 individuals of Indigenous ancestry. Therefore, the small sample size precludes us from drawing any conclusions about the broader population of Indigenous peoples.
For CYP2B6, there are more PMs of African ancestry and more IMs of East Asian ancestry in the UKBB than in our sample. 30 We also observed a larger proportion of CYP2B6 NMs in the IMPACT sample for all ancestries. On the other hand, compared to Zhou et al. 16 we observed a lower frequency of alleles with normal function. The frequencies of MSs are largely concordant between our sample and Zhou et al. for CYP3A4.
CYP1A2*30 was the most frequent CYP1A2 haplotype across all ancestries. This allele corresponds to the merged designation of *1F, *1L, *1M and *1Q under the previous allele nomenclature. 17 To our knowledge, no publications have reported the frequency of CYP1A2*30 in specific ancestries, as this is a new, combined allele definition. CYP1A2 enzyme activity is affected by genetic variation, but it can also be induced by various environmental factors, including cigarette smoke.34,35 As there is no data available on smoking habits or environmental exposure to CYP1A2 inducers, using just genotypic data to determine CYP1A2 MS would not have provided an accurate picture. Therefore, we excluded this from the MS frequency analysis.
Nearly 95% of our sample are non-NMs for at least one enzyme, highlighting the importance of PGx testing in guiding medication prescription. This percentage varied between populations, with 100% of Caribbean ancestry individuals being non-NMs for at least one enzyme, but 85% for Oceanian and Latin, Central and South American populations. However, it is important to note that these groups had small sample sizes. In the future, we plan to conduct additional analyses, including drug–gene concordance, to determine how many individuals were prescribed psychotropic medications that did not match their CYP MS, and examine their treatment response. In addition, our sample may be biased towards including those who are non-NMs, as it includes patients who were nonresponders or experienced adverse drug reactions. 14 These findings are limited by our inability to definitively characterize the frequency of CYP2D6 structural variants in this population, so some individuals with an increased enzyme activity could have been missed.
In conclusion, this study documents the genetic diversity of CYP genes and provides valuable insights for the development of PGx tests for use in the Canadian population, thereby facilitating equitable access to personalized health care in the future.
Supplemental Material
sj-xlsx-1-cpa-10.1177_07067437261451952 - Supplemental material for Distribution of Cytochrome P450 Metabolizer Status and Allelic Variants in Individuals with Mental Health Disorders in Ontario, Canada: Répartition du statut métabolique du cytochrome P450 et des variantes alléliques chez les personnes atteintes de problèmes de santé mentale en Ontario, au Canada
Supplemental material, sj-xlsx-1-cpa-10.1177_07067437261451952 for Distribution of Cytochrome P450 Metabolizer Status and Allelic Variants in Individuals with Mental Health Disorders in Ontario, Canada: Répartition du statut métabolique du cytochrome P450 et des variantes alléliques chez les personnes atteintes de problèmes de santé mentale en Ontario, au Canada by Megana Thamilselvan, Alex J. Coulter, Deanna Herbert, Anashe Shahmirian, Nicole King, Daniel J. Müller, Arun Kumar Tiwari, Clement C. Zai and James L. Kennedy in The Canadian Journal of Psychiatry
Footnotes
Acknowledgements
We would like to thank Ms. Natalie Freeman and Dr. Nina King for laboratory management and quality assurance for the IMPACT study. We would also like to appreciate Assurex Health Inc. for providing genotyping support for the IMPACT study.
ORCID iDs
Author Contributions
Funding
The authors disclosed receipt of the following financial support for the research, authorship and/or publication of this article: This work was supported by a grant from the Canadian Institutes of Health Research (CIHR) (grant no. PJT190232), the Larry & Judy Tannenbaum Family Foundation, the Brain and Behavior Research Foundation, the Ontario Research Fund (RE-012-027), the CAMH Foundation and a McLaughlin Foundation Grant. Daniel Müller received funding from the Canadian Institutes of Health Research (FRN: 520164 and 428404).
Declaration of Conflicting Interests
The authors declared the following potential conflicts of interest with respect to the research, authorship and/or publication of this article: JLK is a member of the Scientific Advisory Board of Myriad Neuroscience. JLK, AKT, and CCZ are authors on several patents relating to pharmacogenetic tests for psychiatric medications. JLK and CCZ are authors on a patent on genetic biomarkers of suicide risk. The remaining authors have no conflicts of interest to declare.
Supplemental Material
Supplemental material for this article is available online.
References
Supplementary Material
Please find the following supplemental material available below.
For Open Access articles published under a Creative Commons License, all supplemental material carries the same license as the article it is associated with.
For non-Open Access articles published, all supplemental material carries a non-exclusive license, and permission requests for re-use of supplemental material or any part of supplemental material shall be sent directly to the copyright owner as specified in the copyright notice associated with the article.