
Abstract
A new approach to predict the service life of critical components via study of damage precursors is emerging and is the topic of this article. To date, most service life predictions are based on measurements of damage indicators and their growth toward criticality or failure, for example, fatigue crack length and material loss due to corrosion or wear. This makes lifetime estimates based on measurements of damage, for example, around half-life, or even at 80% life, difficult and inaccurate. To improve the accuracy and reliability of lifetime prediction, efforts are now underway to determine the state awareness of a critical component during service, based on property characterizations, in addition to the measurements of the direct damage indicators, such as crack length, acoustic emission, ultrasound signals, and eddy current measurements. These characterizations will include indirect damage indicators, that is, precursors and allied or affiliated damage indicators. For affiliated damage indicators, residual stress relaxation or development, phase changes, electrical property (resistivity, dielectric constant, permeability), and microstructural characterization must be considered. The selection of the optimal combination of direct and indirect damage indicators will be application specific. It is proposed to assess the efficacy of damage indicators on the basis of their Di/Df versus Ni/Nf, that is, damage ratio versus life fraction curves (referred to as damage indicator ratio curves), searching for indicators with damage indicator ratio curves that best meet the needs of the application.
Keywords
Introduction
This article proposes a new approach to service life prediction, introducing the use of damage precursors and indirect service life indicators. One rationale for this suggestion can be found in the actuarial statistics. Figure 1 shows the survival functions of the US population during the 20th century. The remarkable increase in life expectancy during the 20th century, without a significant change of the maximum life (∼100 years), is undoubtedly due to the dramatic progress in medical care, prognostics, diagnostics, and treatment, in many cases not only of the final causes of death but also of the precursors of these causes. This is the new paradigm we want to propose for dealing with material state awareness and service life prognostics.
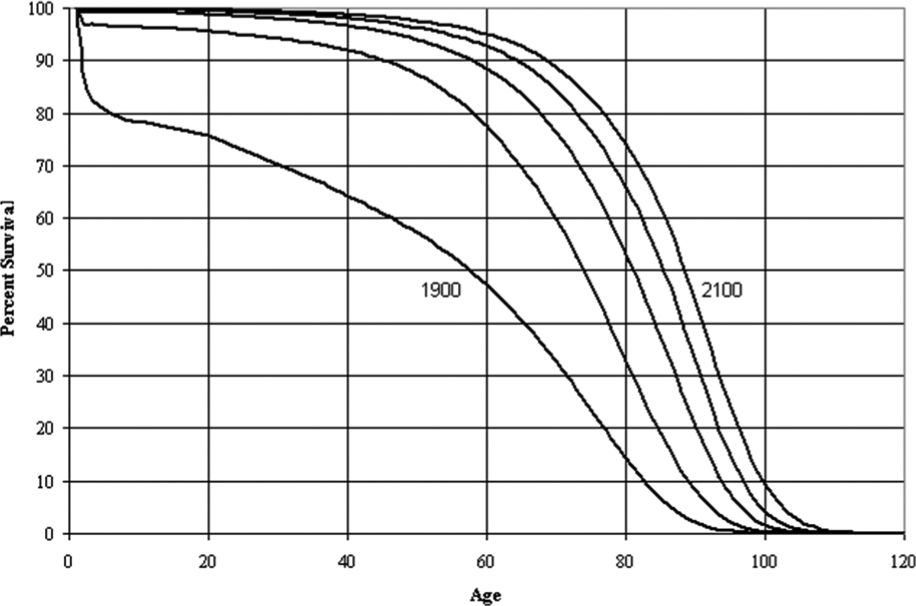
Survival functions for SSA populations for selected calendar year. 1
Material State Awareness is defined as reliable nondestructive quantitative material/damage characterization regardless of scale. 2 Damage is defined as a process or an inclusion that compromises the structural integrity of the structure. Examples of structural damage are delamination, cracks, accumulated dislocations, porosity, and surface galling. The structural integrity is the ability of the structure to perform the designed task, for example, structural load carrying capacity, thermal barrier, and lift. A damage precursor is defined as the progression of structural material property degradation or morphology that can evolve into damage. Some of the known damage precursors are dislocation density, adiabatic shear bands, crazing, slip bands, residual stresses, and structural inclusions. Precursors, for example, to fatigue crack formation, include electrical resistivity changes, dislocation distribution changes, and crazing. Precursor indicator is the measure of the precursor, direct or indirect, for example, measurement of microcrack evolution in composites. Figure 2 shows the Weiss curve which denotes the current state of the art. This is the modified Larsen–John–Lindgren curve 3 as applicable to the composite structural life prediction and goal of the proposed research program by the development of self-responsive engineered composites. Over 80%–90% of the life of a component is expended by the time any damage is detected by existing nondestructive evaluation (NDE) or in situ health monitoring techniques. 4 There is a significant risk that any such embedded damage might remain undetected especially in composite components. Thus, the critical need is to identify the precursors. This naturally leads to use the precursor indicators for an accurate measurement of the current state of the composite material. Under the program, it is also envisioned to investigate and develop self-responsive engineered composite materials that will give an accurate health indicator in the initial phase of the life of the composite material. It would lead to development of more accurate remaining life prediction models.
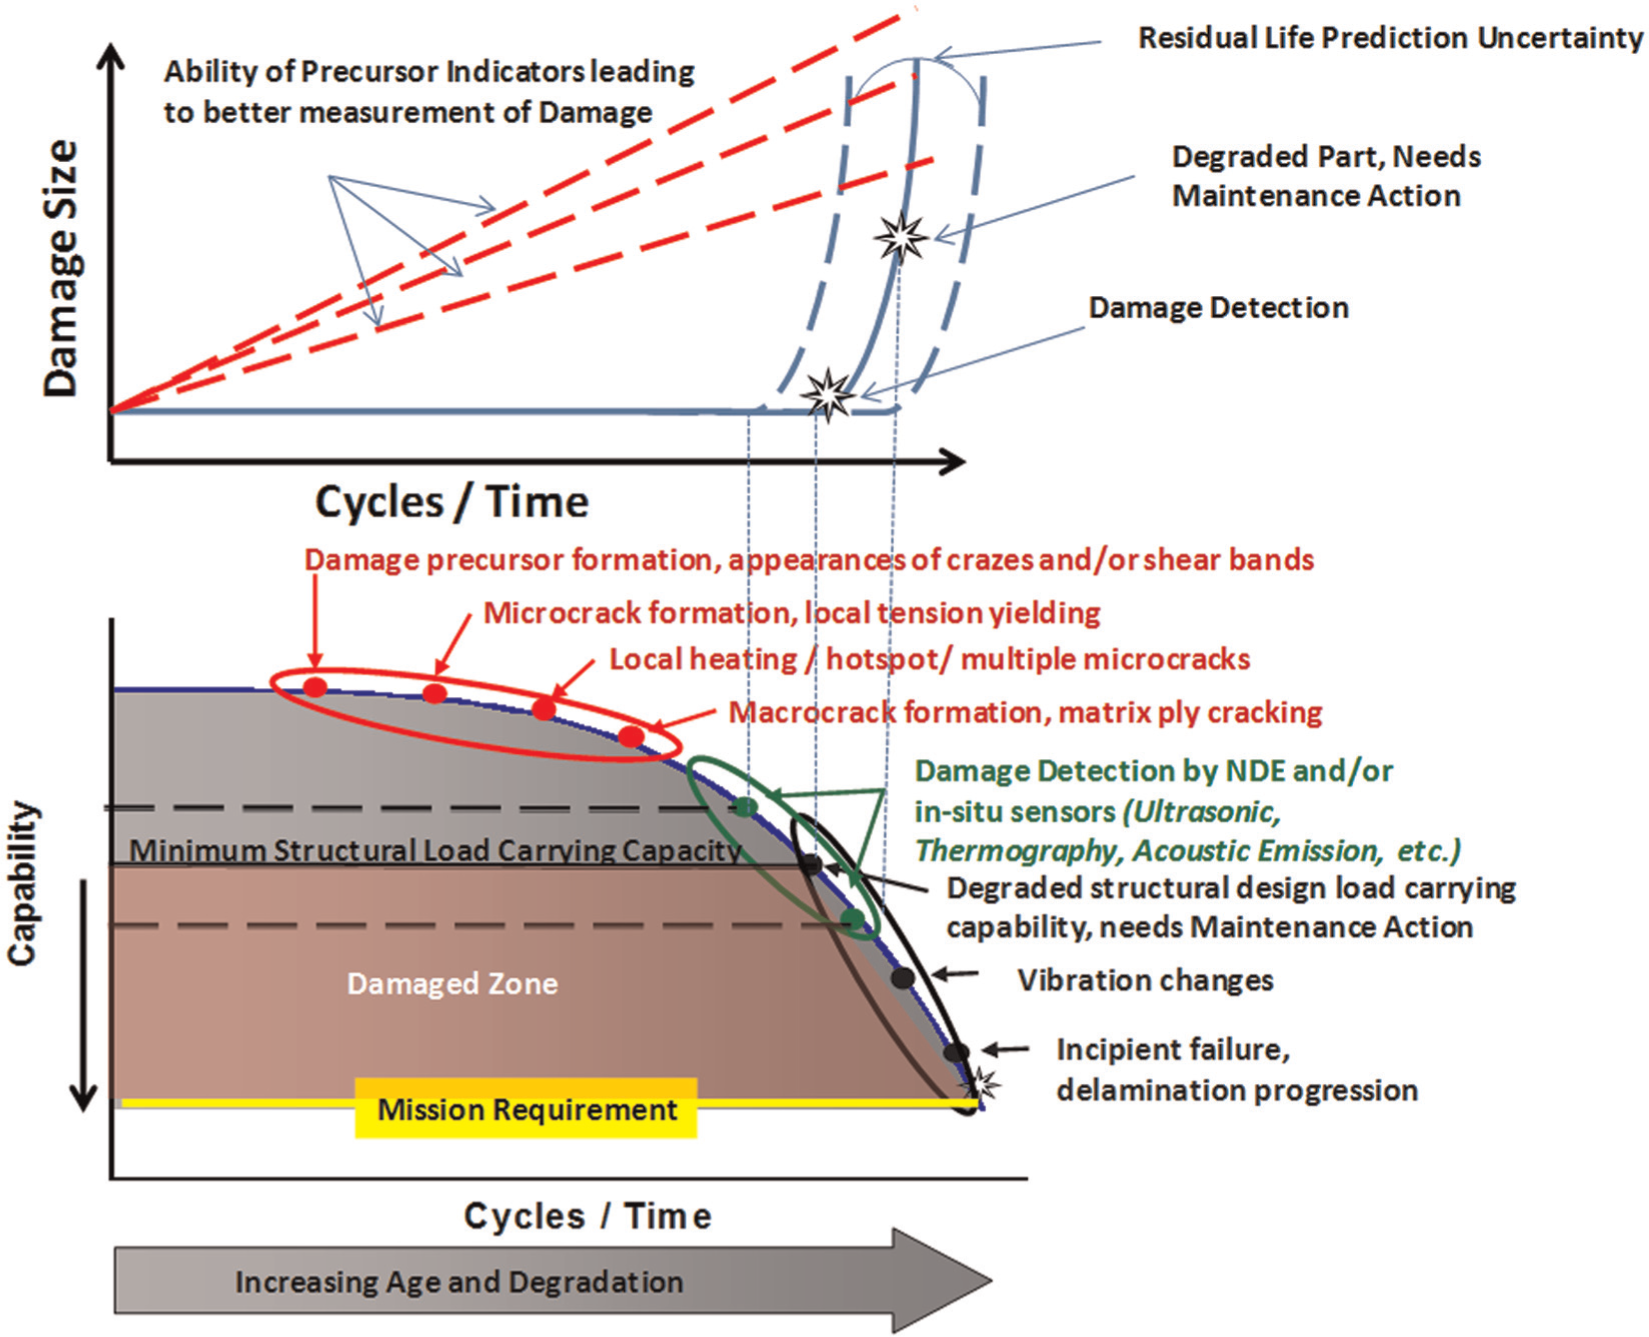
Weiss curve for current composite life prediction methods and using proposed methodology.
Both current and proposed approaches are illustrated schematically in Figure 3 together with the now well-accepted definition of Materials Science and Engineering 5 as dealing with the interrelationships between structure, properties, and processing (and/or performance, i.e., service) (top of Figure 3). Once the effects of service (processing, performance, and service) on structure and properties are known and understood, it should be possible to extend the inspection cycle, from the range based on final failure indicators (e.g. cracks, red arrow range) to that based on other property changes occurring earlier (green arrow range). The difficulties for reliable life prediction based on measurements of primary damage indicators are best illustrated for fatigue. For many cases of concern, especially fatigue, the critical, direct damage indicator, Di, that is, crack length, increases exponentially toward criticality, roughly
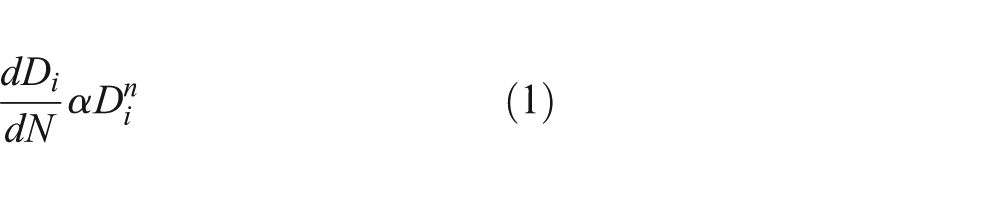
where n can exceed 4.
Figure 4 shows the calculated crack growth curves for a real material for five stress ranges, according to the well-accepted Forman–Newman–deKoning 6 (FNK) model for fatigue crack growth. It is obvious that life predictions, for example, from crack length measurements at N = 400 and 500, will have considerable scatter. Moreover, such life predictions depend on reliable data for the material in question.

The Materials Science and Engineering Triad, the current and proposed inspection processes.
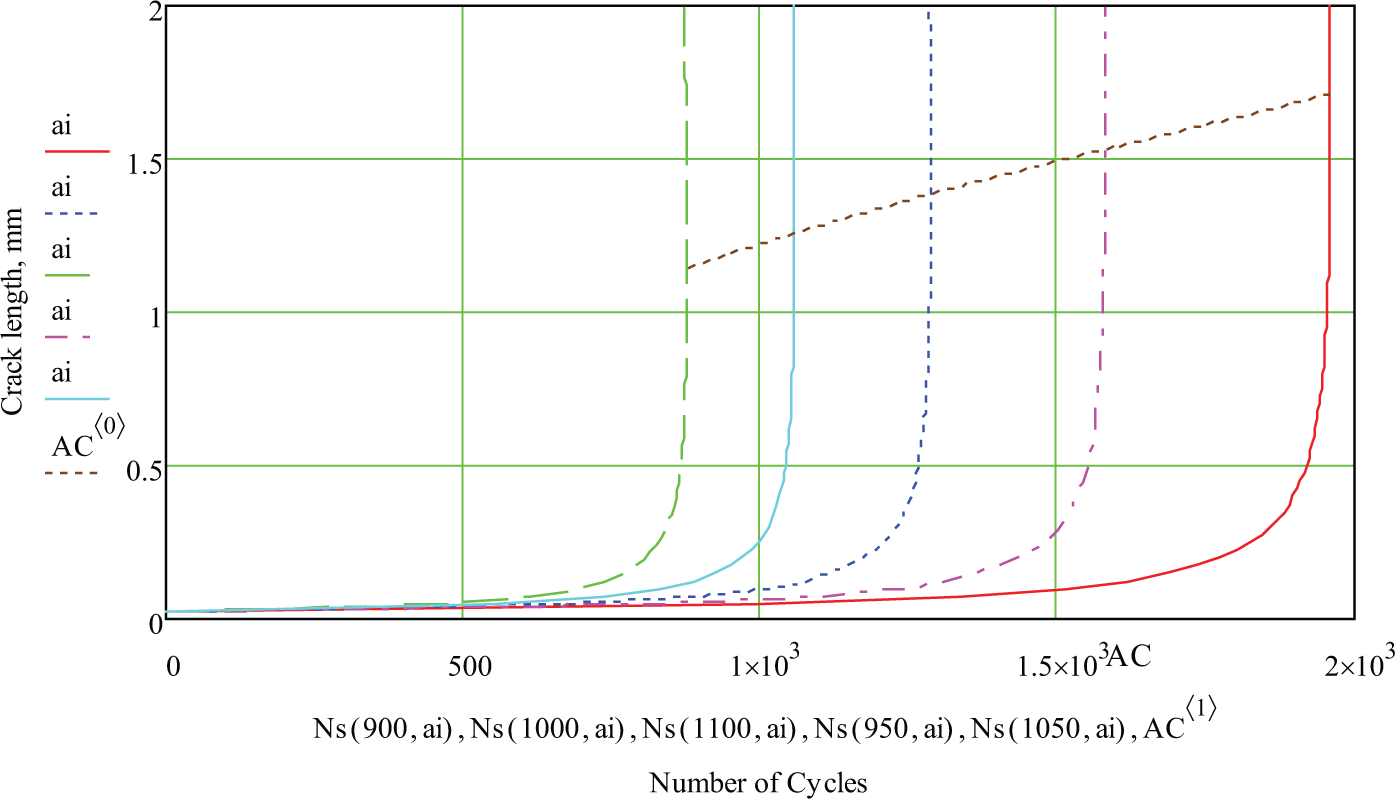
Crack length versus cycles for FNK analysis; model-calculated crack growth curves for a structural aluminum alloy.
Perhaps, most critical is the accuracy of the n value, as illustrated in Figure 5. The two crack propagation curves were calculated for the same assumed stress range, but two slightly different n values, 3.7 and 3.9. Such a variation in n would cause an error in life prediction by more than a factor of 2. Clearly, it is the exponential nature of rack growth that makes service life prediction difficult and inaccurate except for perhaps the last approximately 10%–20% of the fatigue life. To improve service life prediction, it is proposed to examine the characteristics of physical property changes caused by service and develop the most promising ones for NDE remaining life prediction. That such changes exist is well documented. As early as the late 1860s, Wöhler, 7 the “discoverer” of metal (steel) fatigue, was able to predict the endurance limit from thermal measurements during early stages of the fatigue test. The special issue of Acta Metallurgica 8 of 1963, entitled “Mechanisms of Fatigue in Crystalline Solids,” is an excellent state-of-the-art summary of damage processes and structural changes. With significant improvement and expansion of experimental capabilities, miniaturization, digitization, and modeling, prospects for developing improved service life prediction methods are very promising.
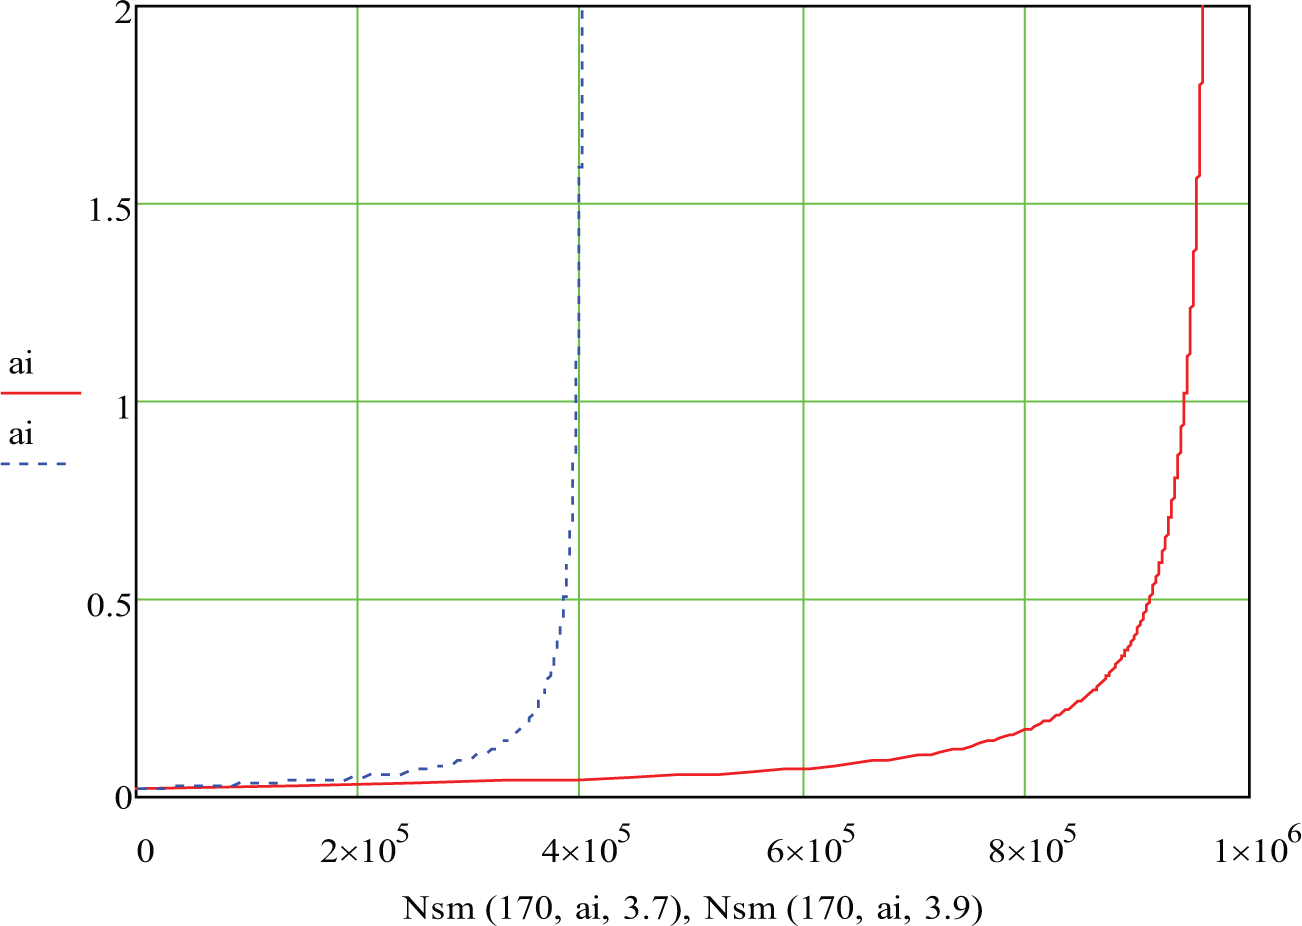
FNK model-calculated crack growth curves showing the effect of the “n.”
Direct and indirect service and damage indicators
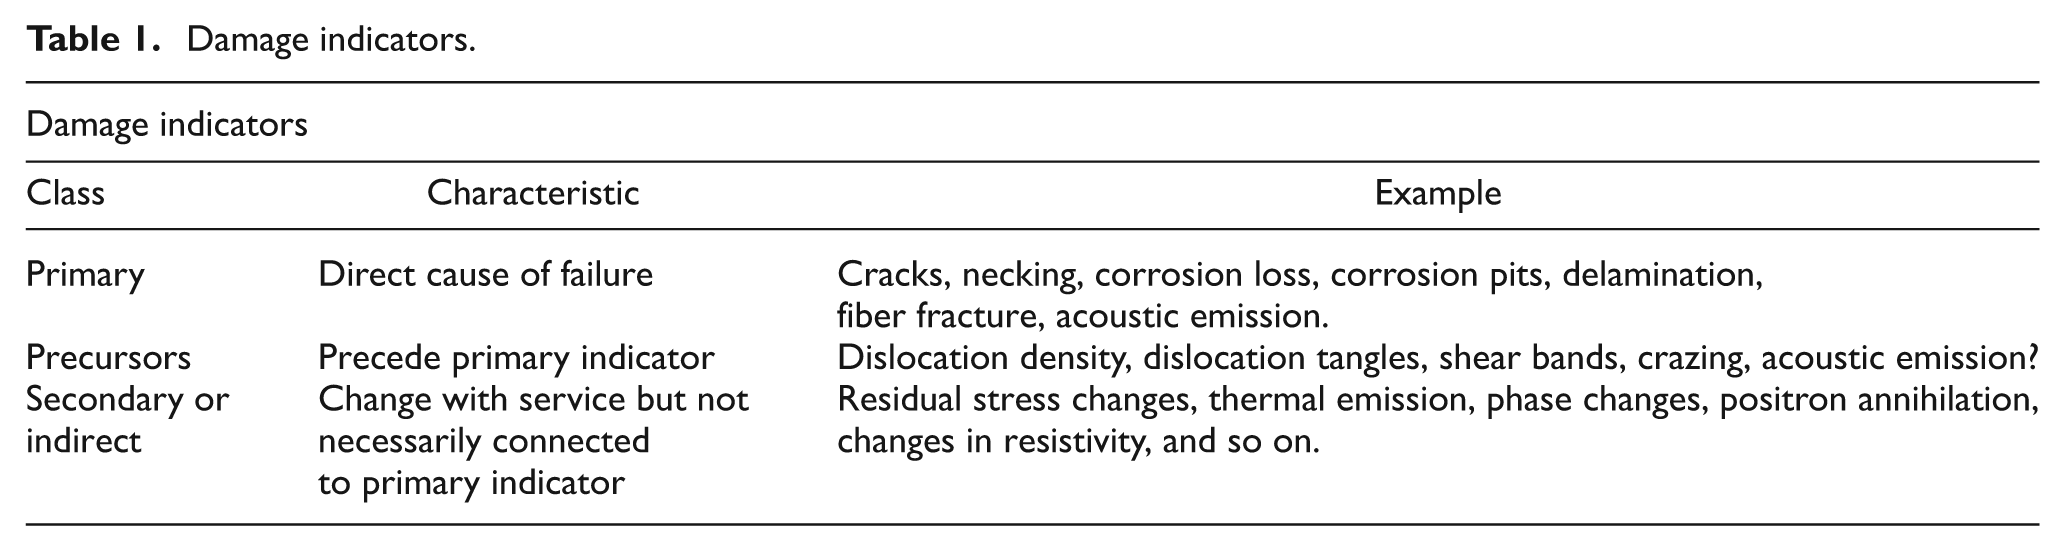
Considerable improvement in remaining life prediction could be achieved from measurements of other properties, other “damage indicators,” which change with service in a more gradual way. Among such damage indicators are precursors, property changes directly related to damage, such as adiabatic shear bands, and increased defect densities, as well as changes that occur during service but in themselves may not represent damage that leads to failure, such as electrical resistivity changes and changes in residual stresses. A tentative classification of damage indicators is present in Table 1.
Damage indicators.
Primary fatigue damage indicators
In almost all service failures in metal fatigue, failure is due to one or several cracks that (primarily originate at or near the surface) have propagated to critical size for the specific application, that is, geometry and loading history. Well-developed analysis techniques exist for a wide variety of applications. 9 For NDE purposes, measurements of crack length are the damage indicators. Measurement techniques include optical inspection, ultrasound reflection measurements, X-ray radiography and tomography, and eddy current measurements. Ideally, the measurement result can be directly converted into effective crack length. The critical characteristic for each measurement type is its “probability of detection curve” (POD), which has been the subject of many NDE studies. 10 Of course, the detection threshold is of primary interest, but for remaining life predictions, crack orientation and actual length are also required. But even if all required information of crack size, orientation and so on is available, the exponential character of the crack growth curve makes remaining life prediction difficult and inaccurate, except for the last 10%–20% of the service life, as shown in Figure 6. In this curve, the ratio of instantaneous crack length, ai, to critical crack length, af, is plotted against the cycle ratio Ni/Nf, for the data presented in Figure 4. The low slope of this damage ratio curve (damage indicator ratio (DIR) curve) below 60%–80% of the fatigue life makes life prediction inaccurate. It is for this reason that we must look for other, direct or indirect, damage indicators that characterize damage during the earlier portion of the life cycle.
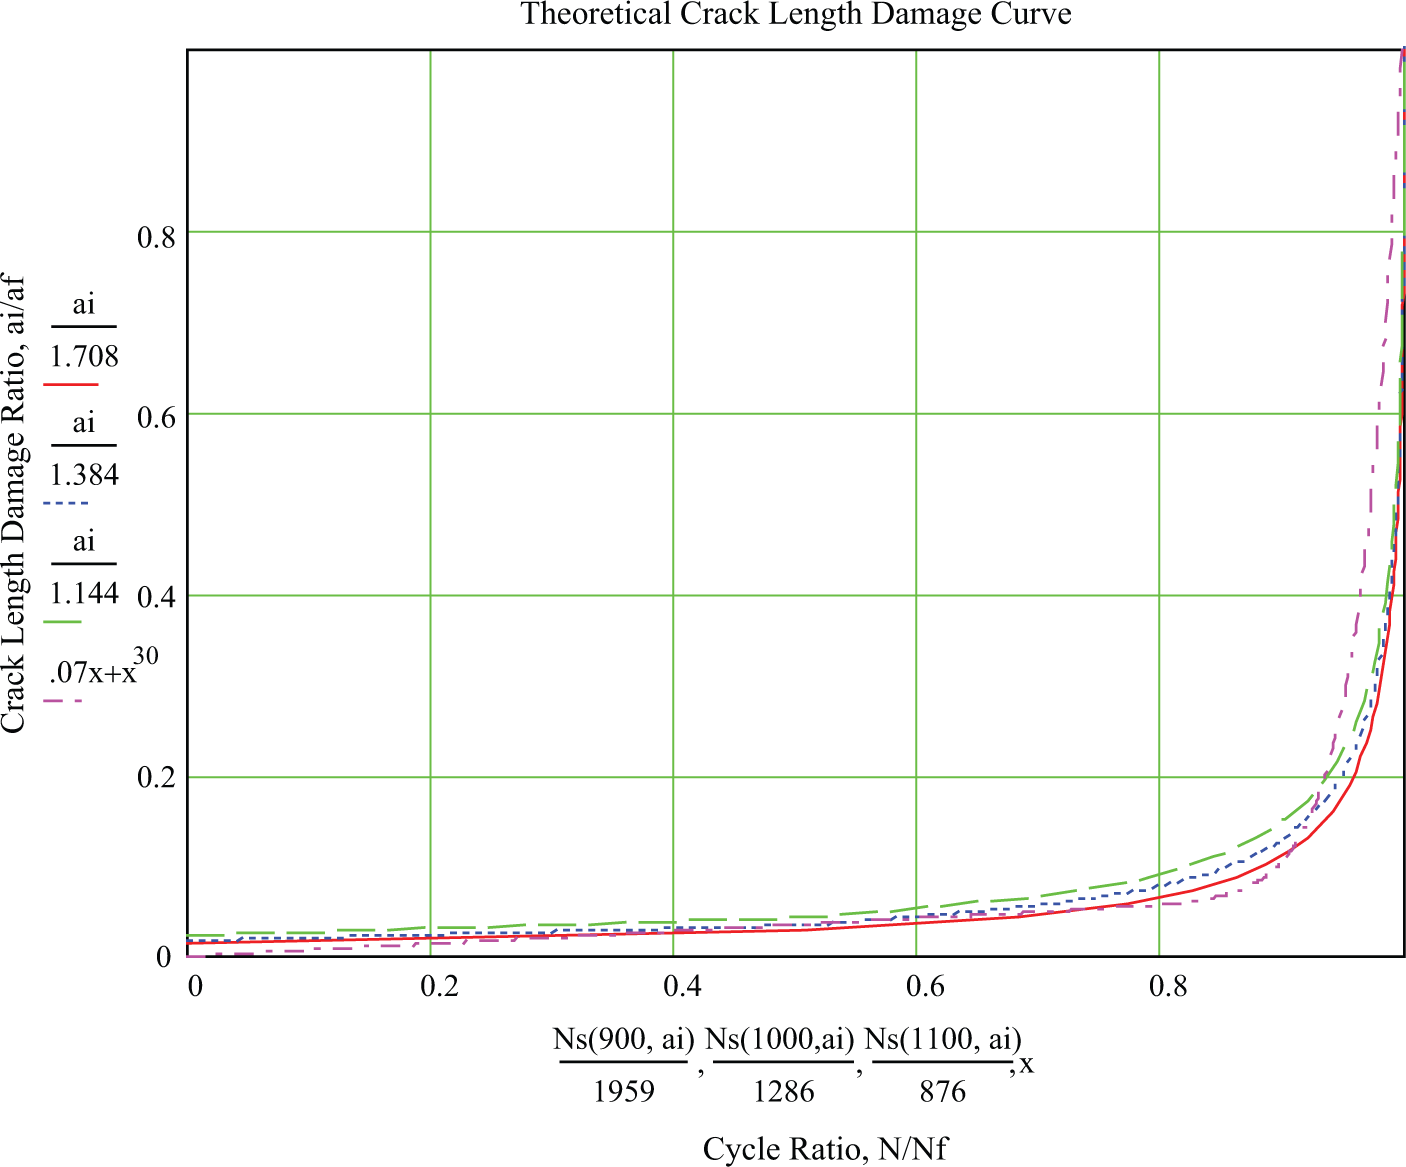
Damage indicator ratio curves (DIR curves) for the data shown in Figure 4.
Precursors to crack formation
There are several known and probably a few unknown phenomena that lead to crack formation, with often more than one opportunity of measurement. The longest known one is obviously plastic deformation, 7 which Regler 11 started to explored with X-ray diffraction in the 1930s. Two examples from the recent literature are presented here, X-ray diffraction line broadening to measure changes in micro-strain and particle size, and electrical resistivity, both relating to dislocation processes that precede crack formation. Reverse bending fatigue tests were conducted on Al and periodically interrupted for X-ray diffraction analysis by the Warren–Averbach12,13 method. This results in values for the micro-strain (dislocation density) and particle size (coherent diffraction domain size). It was found that as the cycle ratio increases, particle size decreases (domain fragmentation) and the micro-strain (dislocation density) increases. 9 These damage ratio curves (Figure 7, X-ray diffraction line density) are nearly linear, well suited for remaining life predictions, if the endpoints are known. The dislocation density ratio, subsurface to surface, is a useful measure of failure probability, 0 below a ratio of 0.6. Similar results were obtained by Taira and Kamachi, 14 based solely on diffraction line width, b. They plotted the fatigue cycle ratio against the line width ratio, b/B0, where B0 is the diffraction line width before the start of the test. The data suggest a weakly exponential dependence of the damage indicator, b/B, on the cycle ratio. Electrical resistivity measurements must also be considered as a potential precursor for fatigue crack formation because electrical resistivity is significantly affected by plastic deformation and fatigue. Eddy current measurements, well established for crack detection, clearly show resistivity changes as well, for Aluminum 2024 and 301 Stainless Steel, obtained by JENTEK Sensors 15 (Figure 7). Exploration for other precursors to crack formation should include measurement of local density changes, crazing in polymers, resistivity changes in conducting fibers in composites, and refractive index changes in transparent photo-elastic materials.
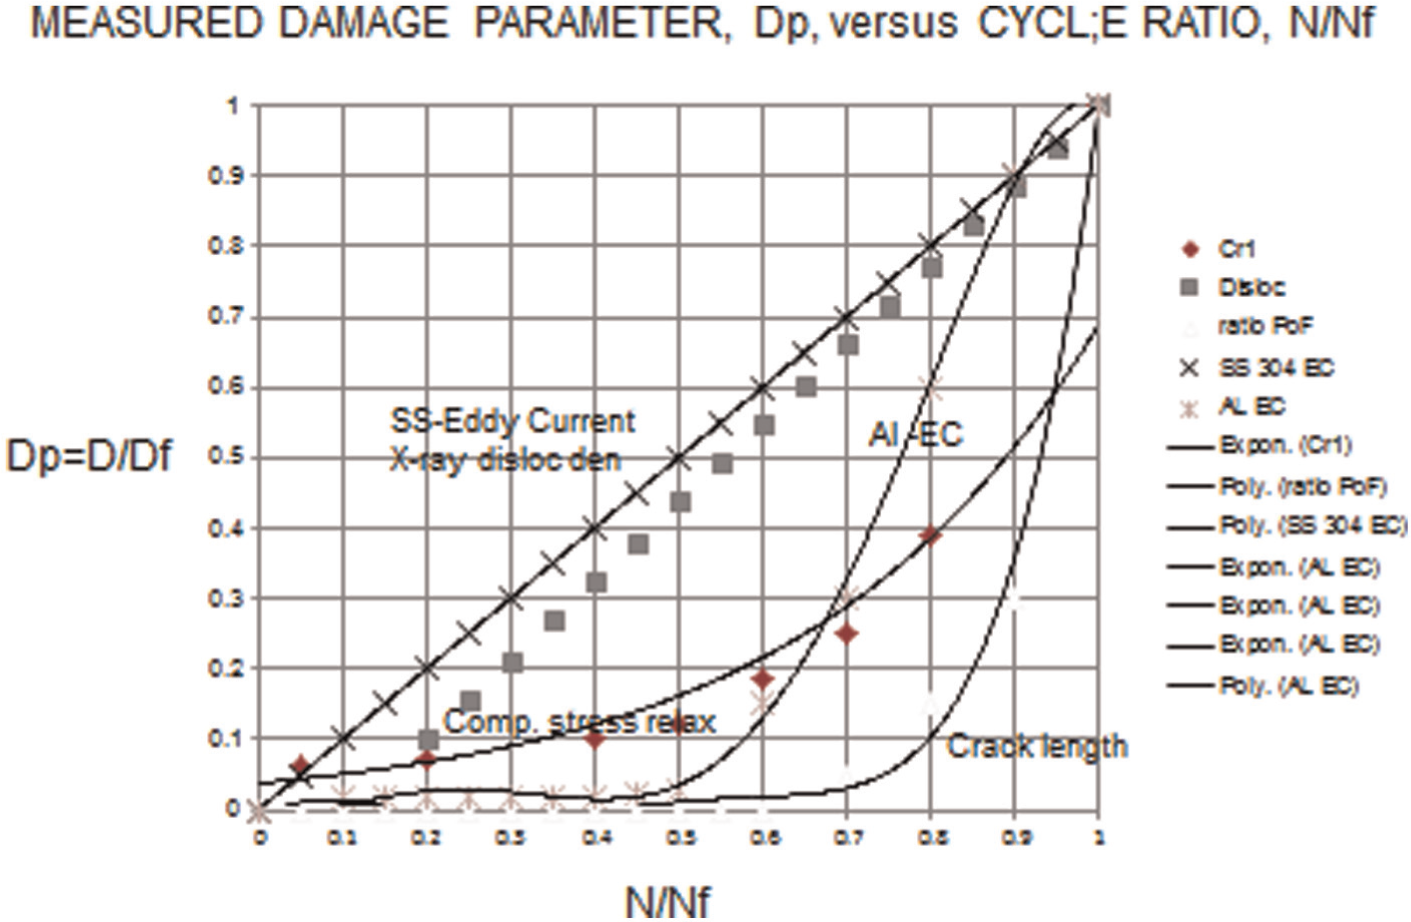
DIR curves for fatigue.
Indirect damage indicators
These are indicators that are related to service life, though not directly related to the primary cause of final failure. A typical example of such an indicator is the phase change in a metastable material such as Type 304 stainless steel. 16 In this material, small quantities of face-centred cubic (fcc) austenite transform to body-centred cubic (bcc) martensite during fatigue as well as plastic deformation. Measurements of phase changes may be practical for a select group of metastable materials, especially stainless steels, but potentially also for some Ti alloys. X-ray diffraction works for all cases, magnetic (permeability) methods and ultrasound works for steels. Another indirect method that has been successfully applied is the measurement of the relaxation of compressive residual stresses in critical areas. In many cases, controlled compressive residual stress regions are introduced in critical areas (e.g. fillets of axles) to extend fatigue life. Service causes relaxation of these residual stresses to a point where fatigue failure occurs, as illustrated in Taira and Kamchi. 14 Sensors that might be incorporated into a critical component may also serve as primary or secondary damage indicators; although if they are implanted for early fatigue crack detection, the problem of accurately predicting remaining life from signals collected near half-life remains, due to the severely exponential nature of crack growth. Undoubtedly, many more known and unknown damage indicators exist. They are all application specific. Selecting the most suitable combination for given application is the subject of the concluding remarks.
Selection of optimal damage indicators
The selection of the optimal combination of direct and indirect damage indicators will be application specific. For example, for ultra-high-strength steels and aluminum alloys, with high damage exponents n, where the critical crack length may also be very small and difficult to detect, measurements of reliable precursors and indirect damage indicators could significantly improve service life prediction. The DIR versus consumed life ratio (or fatigue cycle ratio, Ni/Nf, the DIR curve) as shown in Figure 6 can serve as an excellent characterization of a damage indicator for a given application. Since these are usually monotonically increasing curves, accuracy of remaining life prediction depends on the slope of the “DIR” curve, for the cycle ratio of interest for early damage detection. Determination of this slope must be accurate and reproducible. In Figure 7, fatigue damage DIR curves are presented for the examples presented here. Crack length is the primary damage indicator. Eddy current measurements can be considered both primary indicators and precursors, especially for the stainless steel. The compressive residual stress relaxation data, as well as the martensite transformation data (not shown in Figure 7), are secondary damage indicators. Fundamental and application-specific studies are required to generate reliable DIR curves and create the basis for the proposed approach for characterizing material state awareness and estimating remaining life.
Footnotes
Acknowledgements
The authors would like to acknowledge the contributions of Dr E. Lindgren (AFRL); Mr R. Dowding, Dr R. Brennan and Dr J. Tzeng (ARL-WMRD); Dr D. Stepp (ARL-ARO); Dr R. Benton (AED-AMRDEC); Dr M. J. Valco, Dr A. J. Hall, Dr M. Bundy, Dr D. B. Stringer and Mr D. Le (ARL-VTD); Dr J. T. Ayers (Honeywell); and Dr K. C. Liu (Intel Corporation) and they would also like to acknowledge other scientists and engineers from various DoD laboratories for contributing to the development of this research topic.
Funding
This research received no specific grant from any funding agency in the public, commercial, or not-for-profit sectors.