
Abstract
The morphology of the neat blends, microfibrillar blends and the corresponding microfibrillar composites based on low-density polyethylene and polyethylene terephthalate was analyzed. As the polyethylene terephthalate concentration increased, an increase in the diameter of polyethylene terephthalate spheres/fibrils was observed. The fibrils with relatively uniform diameter distribution were obtained in the range of 15–25 wt% polyethylene terephthalate concentration. The tensile properties of the blends and microfibrillar composites increased with polyethylene terephthalate concentration up to an optimum level. The neat blends exhibited inferior tensile properties in comparison with the microfibrillar composites. As the polyethylene terephthalate concentration increased, the solvent uptake reduced. The diffusivity and permeability of the microfibrillar composites were lower than the corresponding blends. The solvent uptake was found to be lowest for the composite with 25 wt% polyethylene terephthalate concentration. The polyethylene terephthalate microfibrils in the microfibrillar composites offered a tortuous path for the diffusion of the solvent.
Introduction
The weak boundaries existing between the constituent polymers in immiscible blends lead to their poor mechanical properties. The blend morphology could be tailored during melt processing to counter the negative effects of immiscibility.1,2 When two immiscible polymers are blended, they often create a partnership; whereby, the matrix constituent forms a homogeneous body in which the reinforcement constituent is randomly distributed. Just as in an ordinary composite, the qualities of this dispersion as well as the strength of the matrix-dispersed constituent interface are the determining factors for the mechanical properties of the final material. 3
The lack of chemical interaction between the blend constituents is generally considered as a disadvantage for traditional polymer blending; whereas, it is a significant factor in the successful creation of a new type of polymer–polymer composite from immiscible blends. Microfibrillar reinforced composites are comprised of an isotropic polymer matrix reinforced with an even dispersion of high aspect ratio microfibrils or nanofibrils, made from the secondary dispersed polymer after the blend has undergone strengthening via alignment and stretching of its molecular chains through a mechanical process.4–9 A lot of studies have shown that an elongational flow field and a small viscosity ratio (usually less than 1) can facilitate the fibrillation of the dispersed constituent in the polymer blends10–12 and microfibrillar blends (MFBs).1,13 In practice, especially in the case of MFBs and microfibrillar composites (MFCs), it has been demonstrated that even at higher viscosity ratios fibrillation of the dispersed polymer can be achieved.14,15
The static mechanical properties of composites are of supreme importance for any product, since they decide the load withstanding capabilities during service. Several studies were carried out on the mechanical properties of MFCs prepared from combinations of polyolefins and polyesters.16–24 Huang et al. 25 reported that the tensile strength of Nylon 6,6/polypropylene (PP) in situ composites increased till Nylon 6,6 weight fraction reached 15%. Beyond that the tensile strength decreased; whereas, the Young’s modulus increased up to a plateau level. Li et al.26,27 found that the mechanical properties of MFC at low polyethylene terephthalate (PET) concentrations were improved greatly in comparison with the common PET/polyethylene (PE) blend at the same composition. The samples with spherical particles of PET had much higher elongation at break than that with PET microfibres. In a study 28 involving HDPE/PET MFCs, certain equations suggested by Zhu et al. 29 was used to compare the theoretical tensile property values with the experimental ones. Li et al. 30 studied the effect of PET concentration on the morphology development of PP/PET MFCs. It was found that PET weight concentration of 40% was optimum for maintaining the desired fibrillar morphology of PET. Beyond 40%, phase inversion occurred from PP matrix to PET matrix defeating the concept of fibrillar reinforcement.
The transport behaviour of various organic solvents and gases through polymers is of great technological importance, since polymer membranes are increasingly used in various barrier applications. 31 With the ever-increasing application of polymer blends in packaging sector, the transport behaviour studies of organic solvents and gases have been directed at polymer blends as well.32–34 Solvent diffusion in polymeric composites has shown to be governed by three different mechanisms.35,36 The first involves diffusion of permeant molecules inside the microgaps between polymer chains. The second involves capillary transport into the gaps and flaws at the interfaces between the fibre and the matrix. The third is due to the transport of solvent through the microcracks in the matrix constituent formed during processing. Generally, based on these mechanisms, diffusion behaviour of polymeric composites can further be classified according to the relative mobility of the penetrant and of the polymer segments, which is related to either Fickian, non-Fickian or anomalous, and an intermediate behaviour between Fickian and non-Fickian.37,38
The barrier properties of the MFCs are reported scantily, as we understand from the literature survey. In a study by Monticciolo et al., 39 it was reported that toluene/methanol barrier properties of PE can be reduced upon blending with polybutylene terephthalate (PBT). The length and consequently, the aspect ratio of the PBT fibrils increased with draw ratio employed. The solvent barrier properties of these MFBs improved, as the aspect ratio of the PBT domains increased. In another study by Fakirov et al., 40 the oxygen permeability through Linear low density polyethylene (LLDPE)/PET MFC films was analyzed. The results of their investigation indicated that there is much potential for MFC films to be developed into packaging materials suitable for applications in which PE is currently the material of choice. Comparison of the oxygen barrier and mechanical properties of MFCs created during this investigation has confirmed significant improvements in both areas. Permeation results have shown that significant barrier improvements could be attained with a microfibrillar structure for the dispersed constituent.
There are generally two routes for the preparation of MFCs. The first one is the melt extrusion – solid state cold drawing – annealing method which was reported by Fakirov and co-workers.4–7 The other method suggested by Li and co-workers1,26–28 employed melt extrusion – hot stretching – quenching to attain fibrillar morphology for the blend constituents. In the present work, the first method is being followed for the preparation of MFCs. The morphology of the neat blends, MFBs and MFCs from low-density polyethylene (LDPE) and PET are being analyzed. We are also studying the tensile properties of LDPE/PET MFCs prepared in the weight ratios 95/5, 85/15, 75/25, 65/35 and 55/45. An effort is being made to optimize the PET concentration for enhanced properties of MFCs based on LDPE and PET. The uptake of xylene by LDPE, neat blends and MFCs are also studied. The results are expected to throw light on the effect of the morphology and concentration of the PET constituent on the diffusion, sorption and permeation of xylene through these blends and composites. In polymer blends and composites, the transport behaviour depends on many variables including miscibility, fibre type, matrix, temperature and reaction between solvent and the matrix, among others. Hence, the transport phenomena in polymer composites can be used as a characterization technique to understand the interfacial interaction as well as morphology of the system.
Experimental work
The materials used in this study were LDPE (Relene 16MA 400, Reliance, India, MFI: 30.0 g/10 min, Tm: 116.3°C) and a bottle-grade PET (940400-B, Futura Polymers, India, Intrinsic viscosity: 0.814 dl/g, Tm: 246.5°C). The PET material was dried for 12 h at 100°C. LDPE was tumble-mixed with dried PET at following weight ratios of LDPE/PET – 95/5, 85/15, 75/25, 65/35 and 55/45 w/w %. The prepared mixture was then melt blended in a single-screw extruder (screw diameter = 35 mm, L/D ratio = 30) provided with a strand die of diameter 2 mm at a set temperature profile of 185, 205, 245, 255 and 260°C from feed to die zone. The scheme of the experimental setup has been reported elsewhere. 24 The neat blends were extruded without any draw down applied beyond the die. In the case of MFBs, the speed of the rolls was adjusted to achieve a draw ratio (area of cross section of die/area of cross section of strand) between 6 and 8. The final diameter of the strands was in the range of 0.7–0.85 mm. The MFBs thus obtained were designated as MS95, MS85, MS75, MS65 and MS55. Downstream the rolls, the strands were granulated using a laboratory shear cutter. The granules thus produced were injection moulded in a Ferromatik Milacron-Sigma 50T machine. The extruded neat blends (obtained without drawing) were injection moulded at a temperature profile of 160, 220, 245 and 265°C from the feed zone to the nozzle. The injection-moulded neat blends were designated as N95, N85, N75, N65 and N55. All the MFBs were injection moulded at a set temperature profile of 130, 160, 180 and 200°C from the feed zone to the nozzle to preserve the fibrillar nature of PET. The MFCs thus obtained were designated as M95, M85, M75, M65 and M55.
Stages of MFC preparation
The photographs of the blends during the various stages of the MFC preparation are presented in Figure 1. In the Figure 1(a), the granules of LDPE (left side) and PET (right side) are shown. Figure 1(b) indicates the strands obtained without the application of any draw down, that is, corresponding to the neat blends. The sectional dimensions of these strands are in the range of 2.2–2.6 mm, which is slightly larger than the die opening due to the die swell characteristics. These strands are used to prepare injection-moulded specimens of neat blends.
Photographs of raw material and blends during the various stages of microfibrillar composites (MFC) preparation: (a) raw material granules, (b) neat blend strands, (c) microfibrillar blends, (d) neat and microfibrillar blends comparison, (e) chopped microfibrillar blends and (f) microfibrillar composite.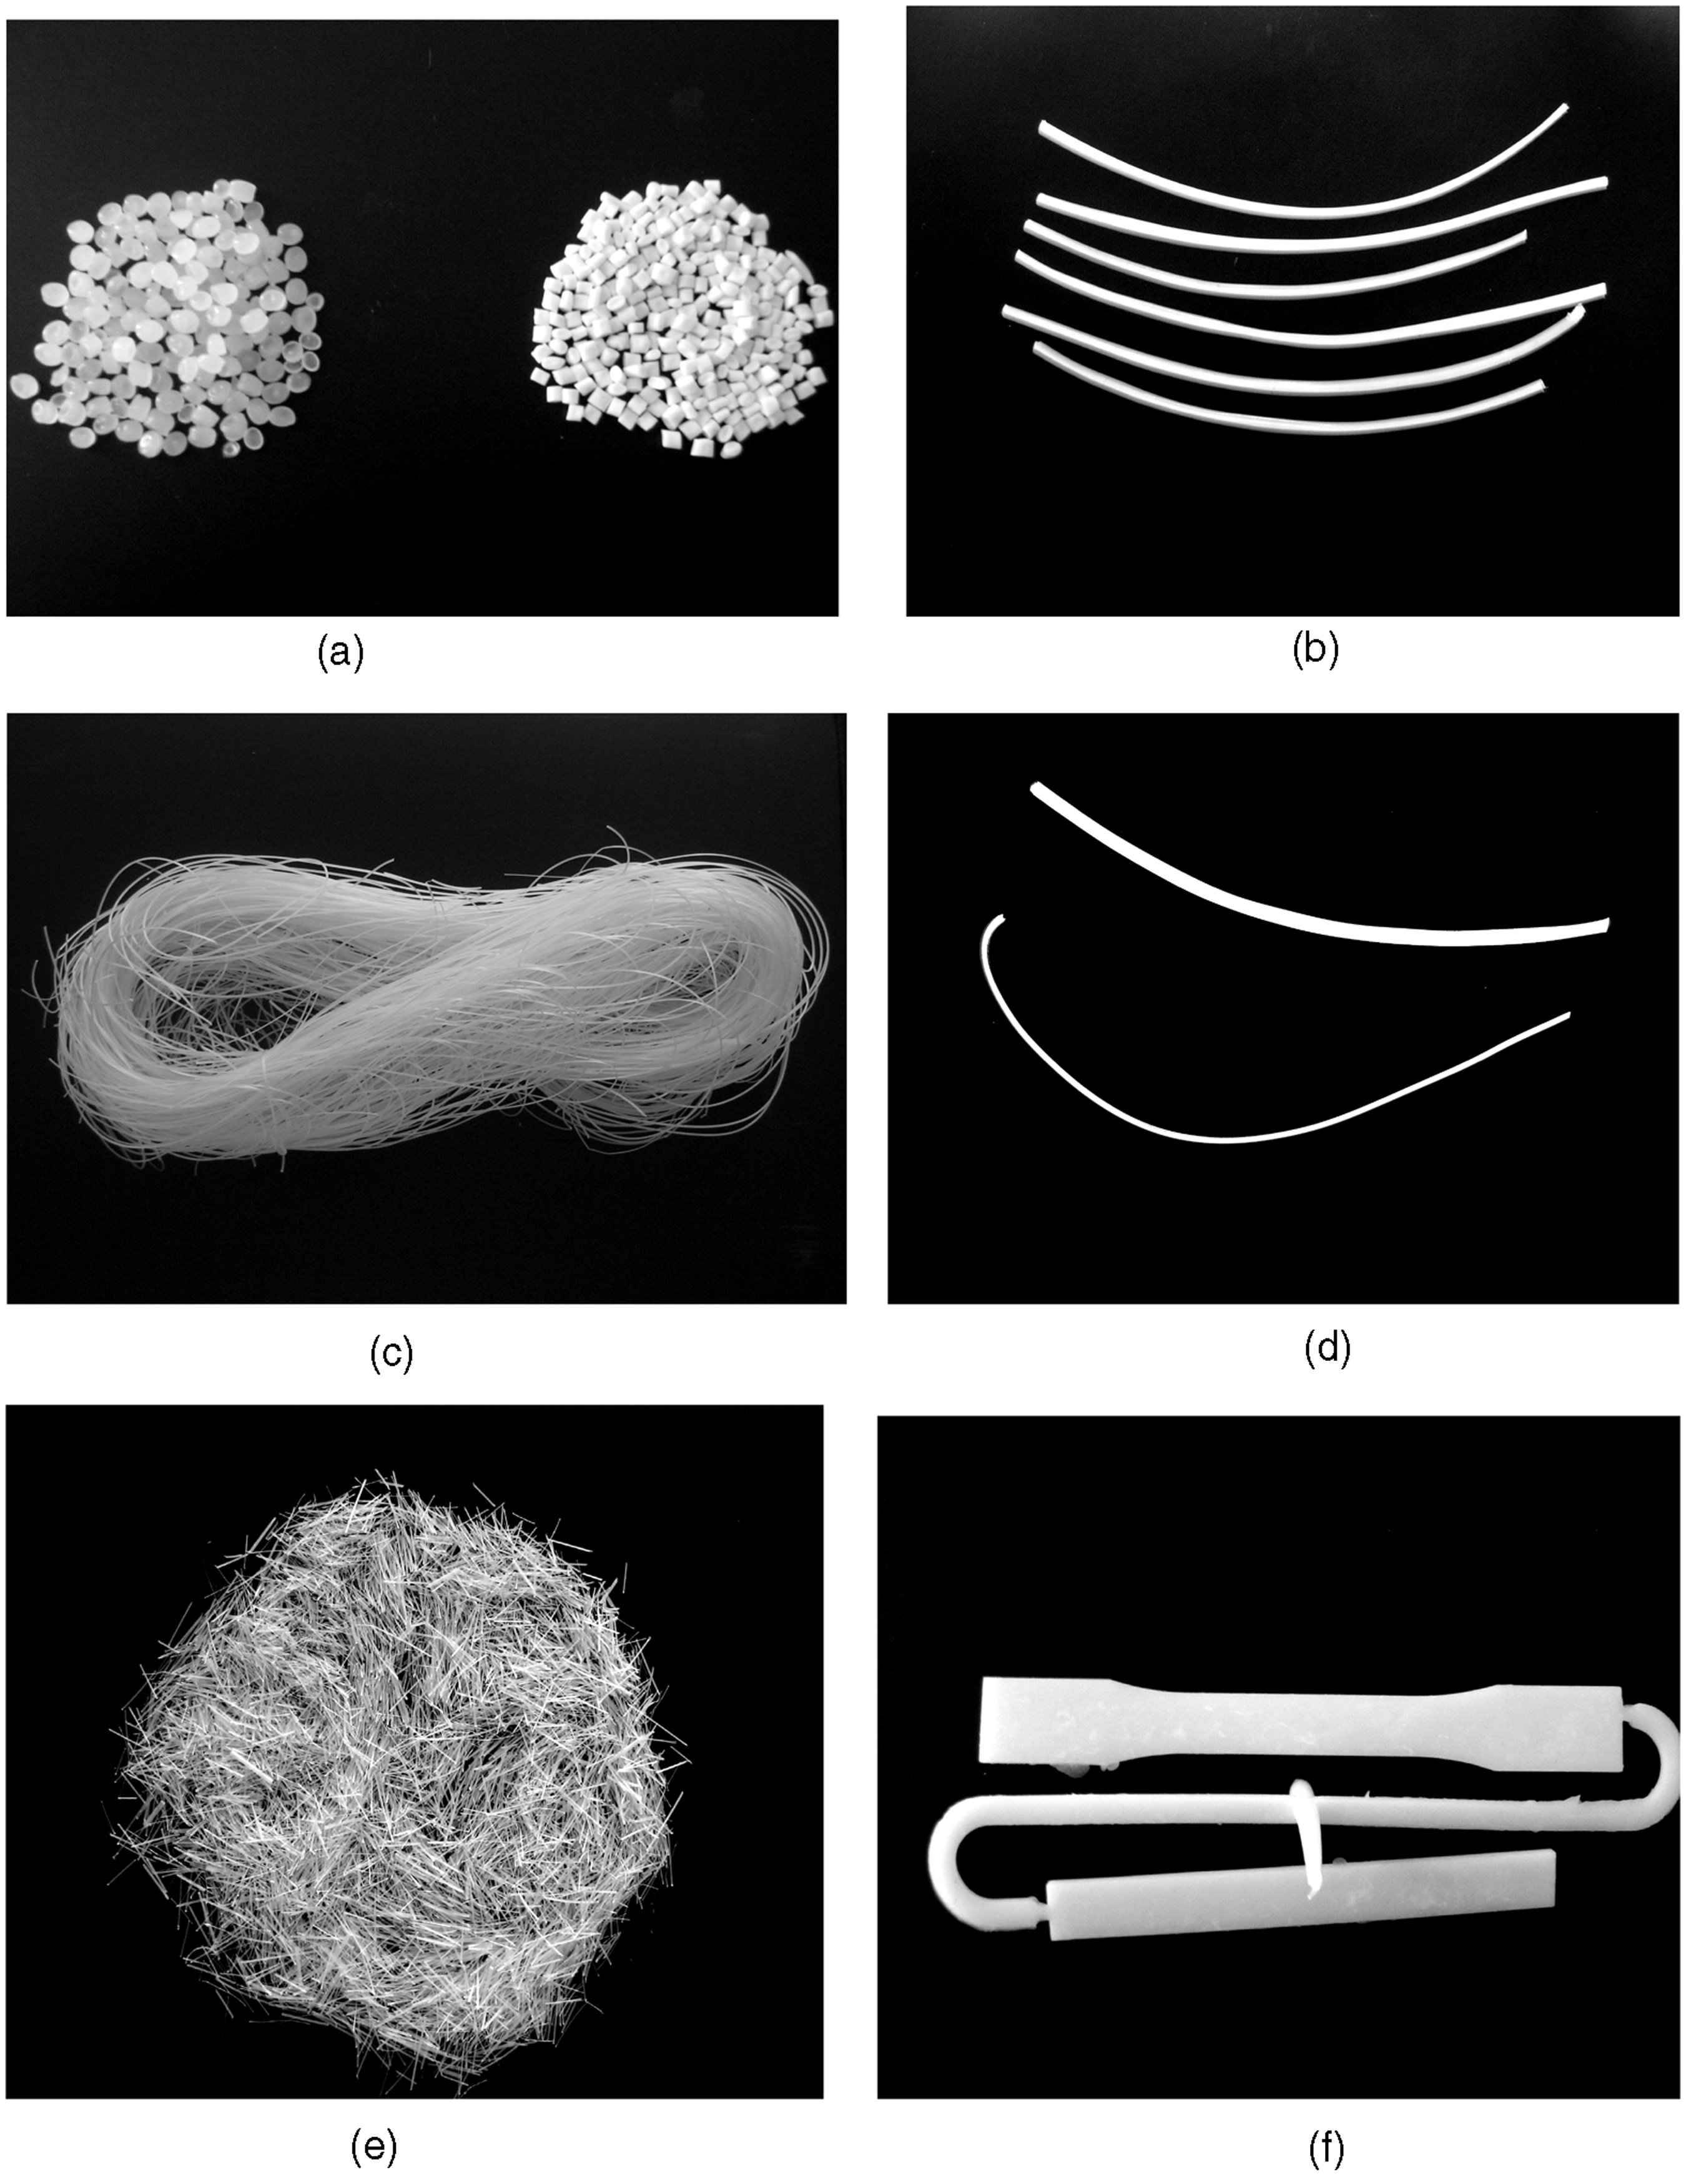
Figure 1(c) represents the bunch of strands of MFBs which are obtained by the continuous drawing of the extruded blends. The drawing process caused a reduction in the diameter of the strands. The diameter of the MFBs are in the range of 0.7–0.85 mm. Figure 1(d) gives a comparison of the dimensions of the strand of the neat blend (top) and the MFB (bottom). In the Figure 1(e), the granulated MFBs obtained by shear cutting to be used for injection moulding is shown. Figure 1(f) shows the injection-moulded test specimens (with feed system) prepared from the granulated MFBs to complete the preparation of MFCs.
Characterization techniques
Scanning electron microscopy
A JEOL JSM 840 SEM with an acceleration voltage of 20 kV was used for studying the morphology of the specimens. To extract PET from the specimens, a mixture of phenol/1,1,2,2-tetrachloroethane in 60/40 wt.% was used as the solvent. Similarly, to remove LDPE and retain the PET fibrils, the specimens were treated with hot xylene. All the specimens were coated with a thin gold layer prior to SEM analysis.
Measurement of dispersed constituent size
The dispersed constituent size was measured from the SEM images using an image analysis software. The diameter of about 100 fibrils was measured from the micrographs of stretched samples. The number-average diameter 
Mechanical properties measurements
The tensile properties of the neat blends and MFCs were measured at room temperature according to ASTM D-638 using the injection-moulded dumbbell specimens. All the tests were conducted at a constant crosshead speed of 100 mm/min. A total of five specimens were tested in each case and the average values are reported.
Solvent sorption experiments
For solvent sorption studies, rectangular samples of size 10 × 10 mm
2
were cut from the injection-moulded samples of LDPE, neat blends and MFCs. The edges of the samples were slightly curved to obtain uniform absorption of the solvent. The thickness of each sample was measured. The samples were fully immersed in xylene and kept at temperatures of 30, 50 and 70°C, respectively. At specific time intervals, the specimens were removed from the solvent one at a time. The excess solvent on the surface was removed using tissue paper and then weighed. The process was continued until the increase in mass of the solvent reaches equilibrium. The mole percentage uptake, Qt, for solvent was determined using the formula
The molar mass of xylene was taken as 106. The sorption data was evaluated by plotting the mole percentage uptake of the blends and composites versus square root time. The diffusion and permeability coefficients were then calculated.
Results and discussion
Morphology development
Neat blends
The SEM images of the moulded neat blends are presented in Figure 2. In the case of N95, the presence of dispersed constituent is least due to the low PET concentration. The general trend is that the size of the spherical entities increases with PET content. When the PET content increases to 45% co-continuous sort of morphology is observed.
Scanning electron microscope (SEM) images of neat injection-moulded blends: (a) N95, (b) N85, (c) N75, (d) N65 and (e) N55 with polyethylene terephthalate (PET) extracted.
Microfibrillar blends
During the drawing process, the neat blends are converted into MFBs as evident from the micrographs in Figure 3. The PET microfibrils in MS95 are scarce, as expected. MS85 and MS75 exhibit a collection of endless PET microfibrils. The diameter of some of the microfibrils in MS85 is high in comparison with those of MS75. The diameter distribution of the microfibrils in MS75 is uniform. MS65 and MS55 possess microfibrils with wide variation in the diameters. In the case of MS65 and MS55, the availability of PET species is high. The MFBs are formed by coalescence of the dispersed polymer followed by elongation during the drawing process. The larger domains of PET, especially in the case of 65/35 and 55/45 blends, although are coalesced are not elongated properly in spite of the application of elongational forces. The stretching and thereby the reduction in diameter of a set of coalesced PET droplets is hindered by the other coalesced PET droplets surrounding them. The net effect is the agglomeration of microfibrils which vary widely in their diameters.
Scanning electron microscope (SEM) images of microfibrillar blends: (a) MS95, (b) MS85, (c) MS75, (d) MS65 and (e) MS55 with low-density polyethylene (LDPE) extracted.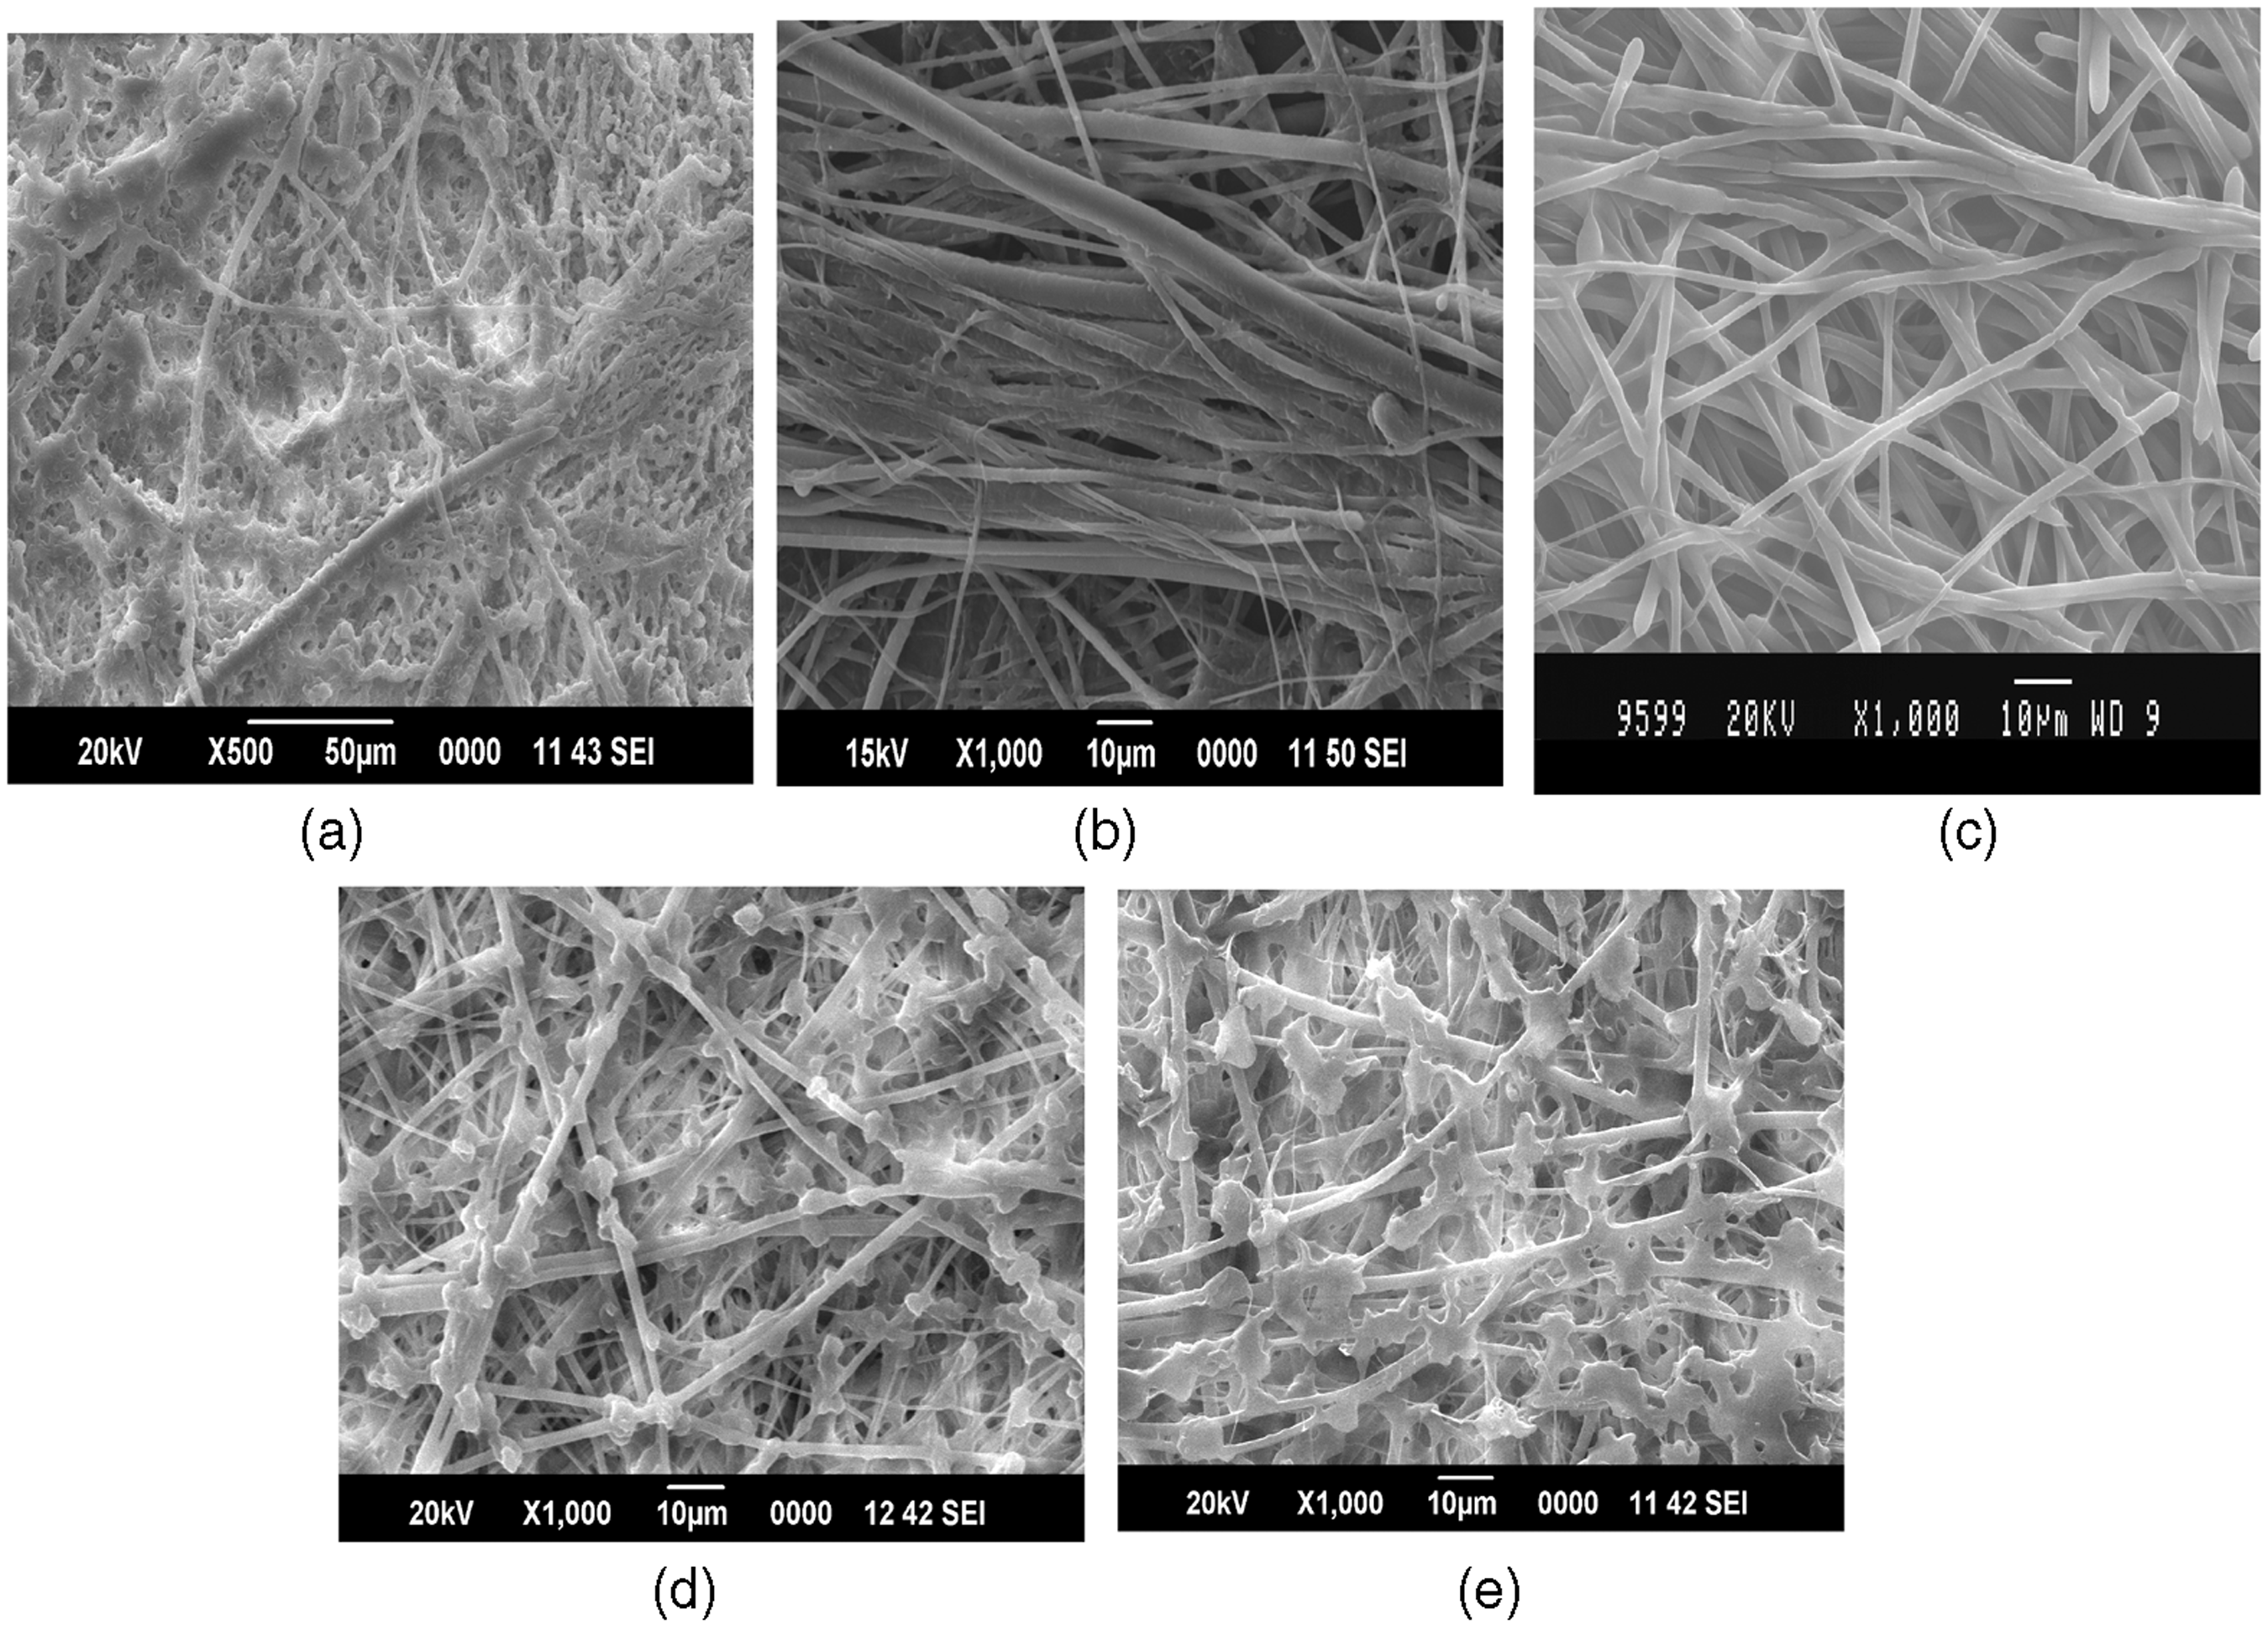
Microfibrillar composites
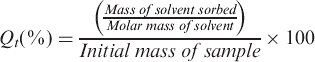
On injection moulding (isotropization), the MFBs are converted into MFCs which are characterized by the random dispersion of PET microfibrils in the LDPE matrix as observed in Figure 4. In the case of M95, PET microfibrils are sparingly seen. A few of them are observed at the edges which cannot be considered as a true representation of the bulk of the sample. M85 gives a network of very fine PET microfibrils which are slightly entangled. In the case of M75, the diameters are further reduced. In the case of M65, thick microfibrils are observed which are entangled. On observing the SEM image of M55, a combination of spheres and fibrils of PET are seen. The available PET microfibrils are agglomerated and space between the neighbouring fibrils is minimal. Moreover, a wide variation in the diameters of the microfibrils is detected.
Scanning electron microscope (SEM) images of microfibrillar composites: (a) M95, (b) M85, (c) M75, (d) M65 and (e) M55 with low-density polyethylene (LDPE) extracted.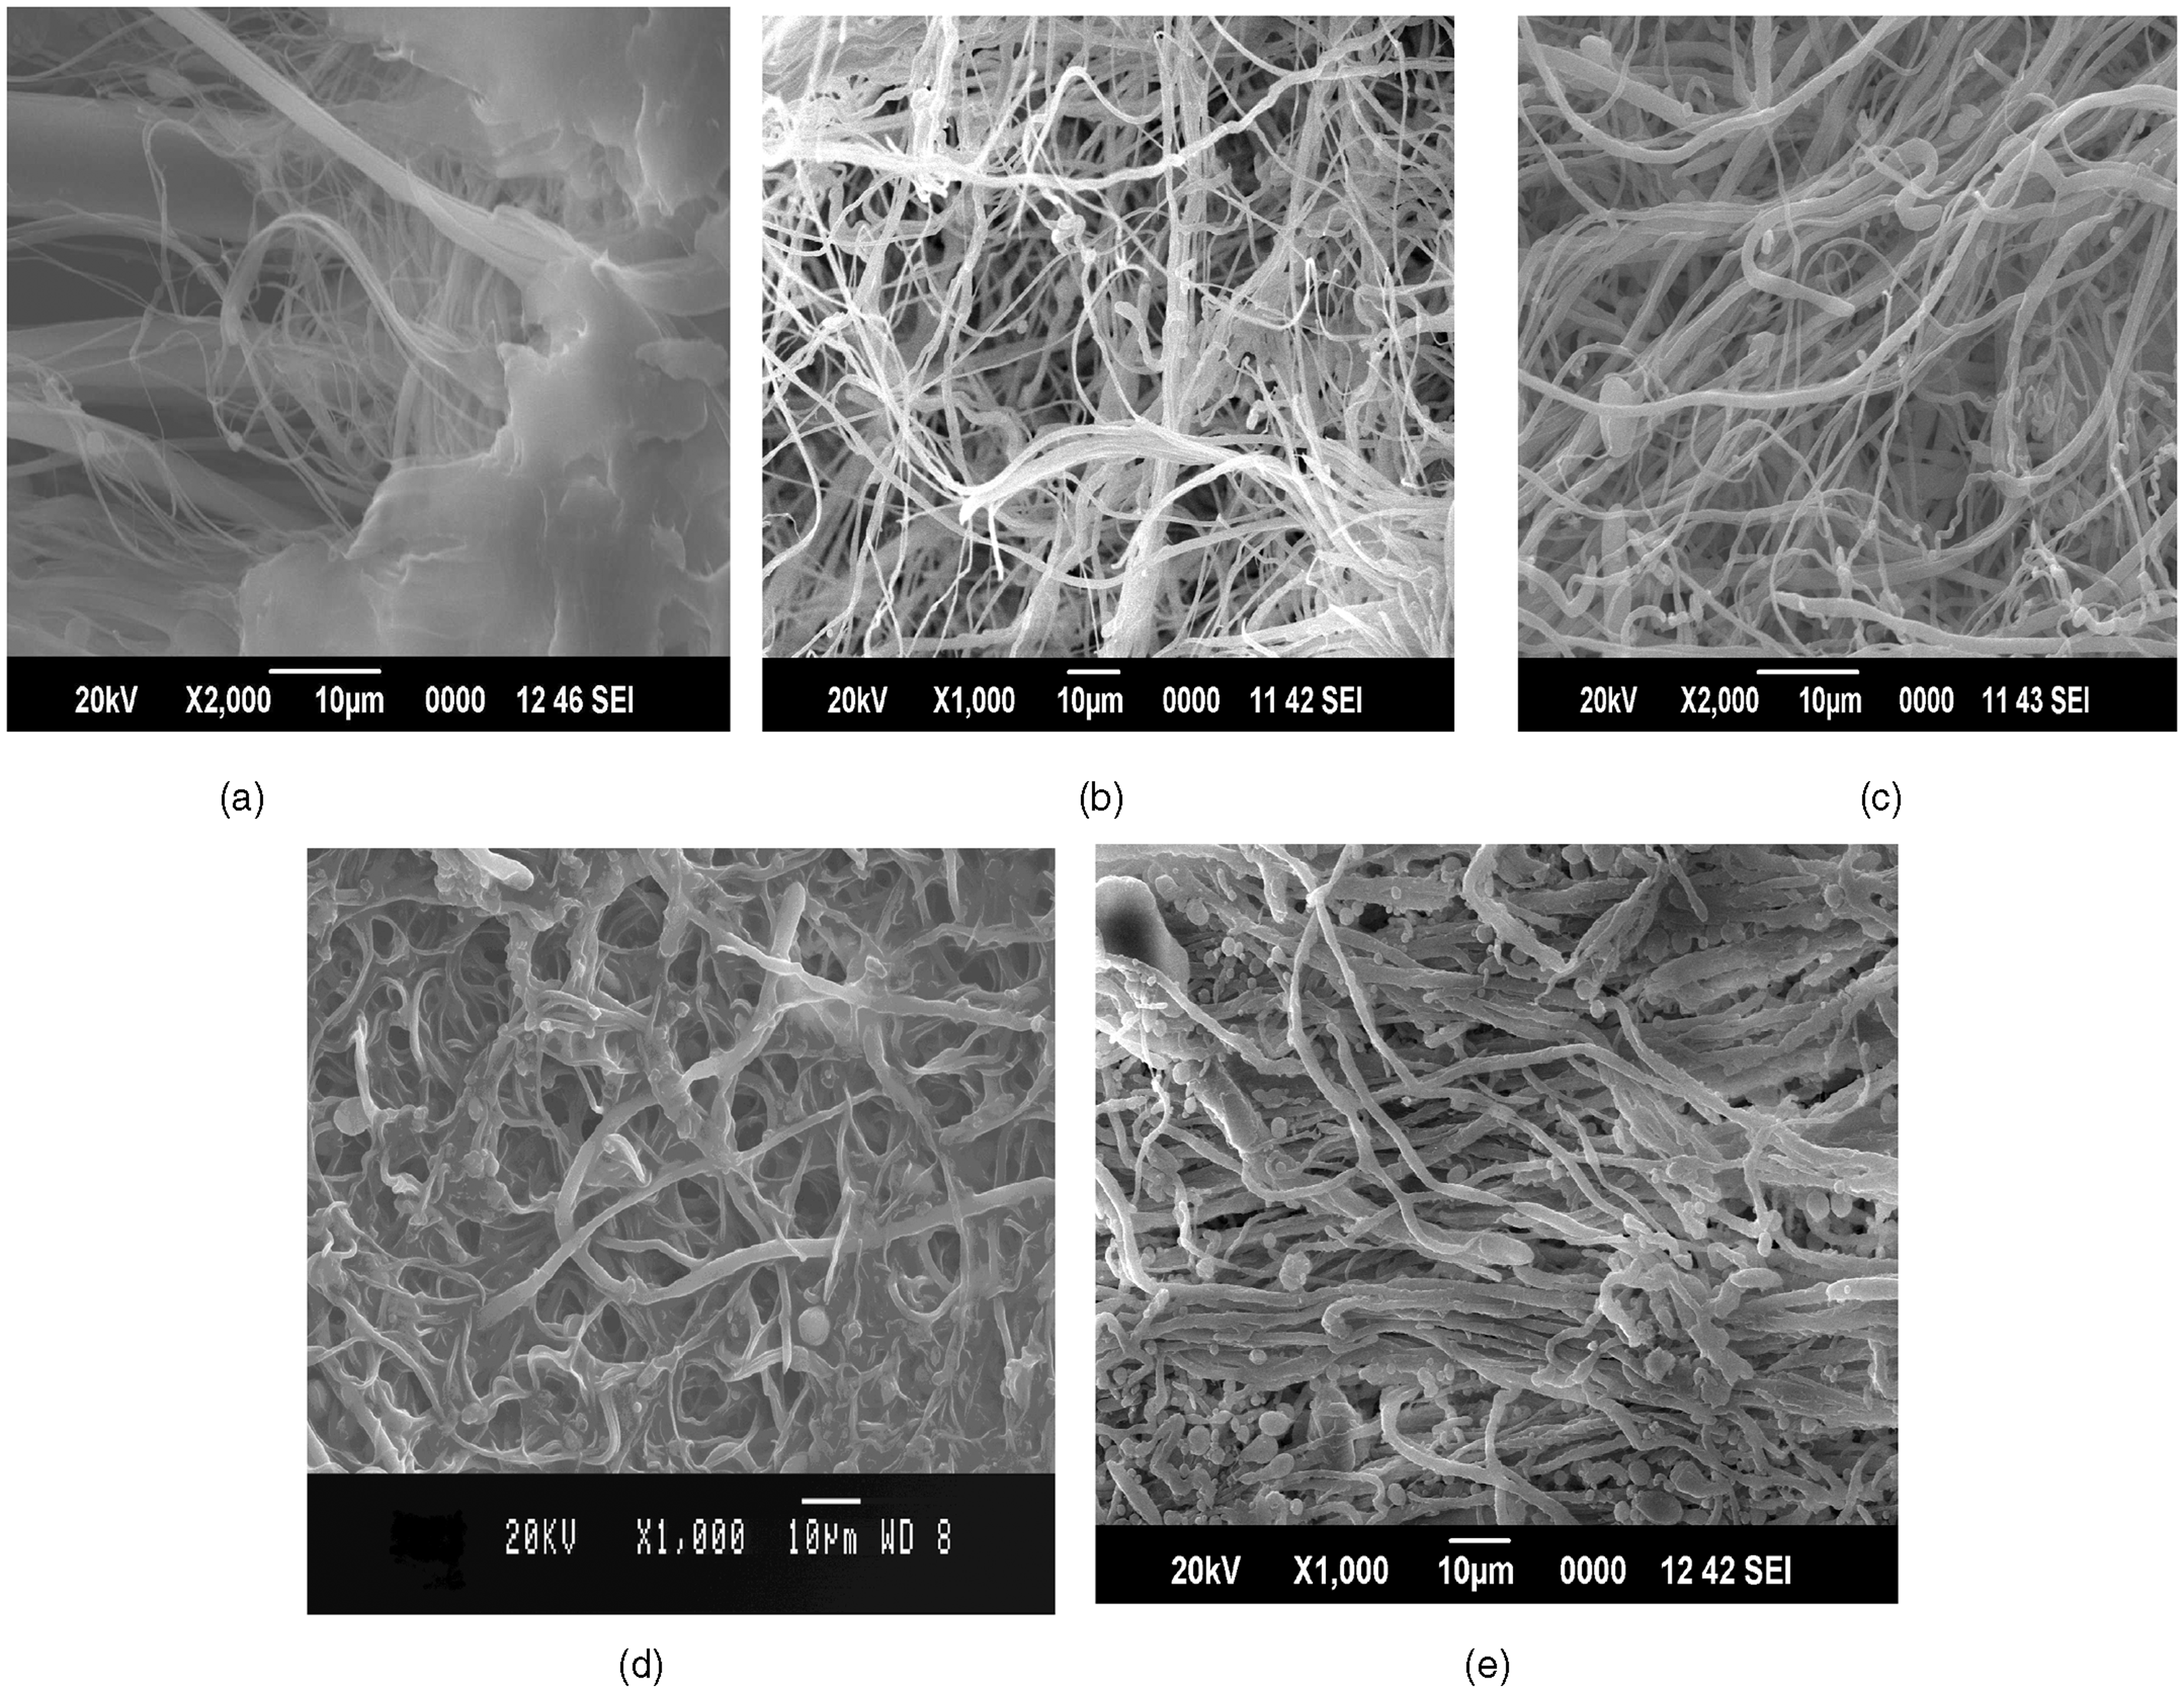
Measurement of dispersed constituent size
Average, maximum and minimum diameters of PET spheres/fibres in the neat blends, microfibrillar blends and composites
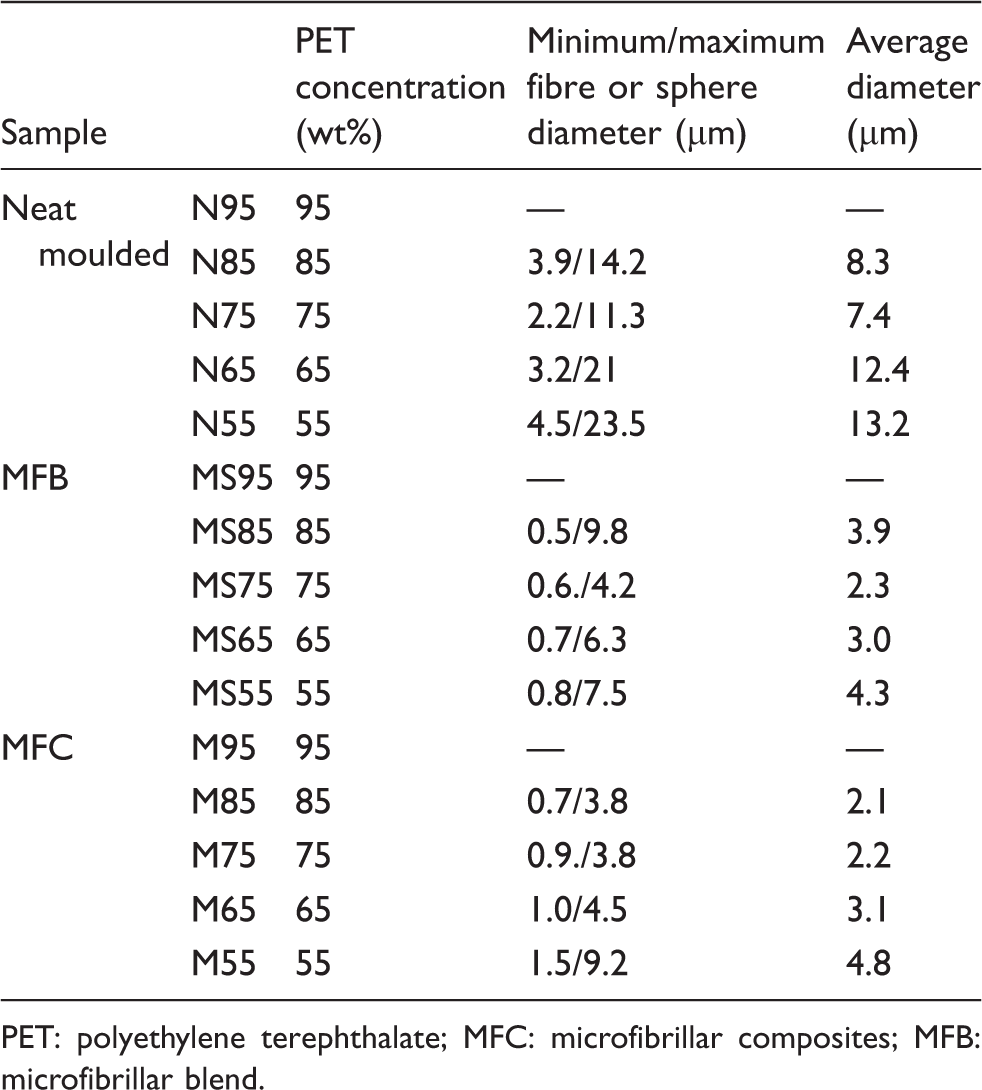
PET: polyethylene terephthalate; MFC: microfibrillar composites; MFB: microfibrillar blend.
Effect of PET concentration on the tensile properties
Tensile properties of neat blends and microfibrillar composites
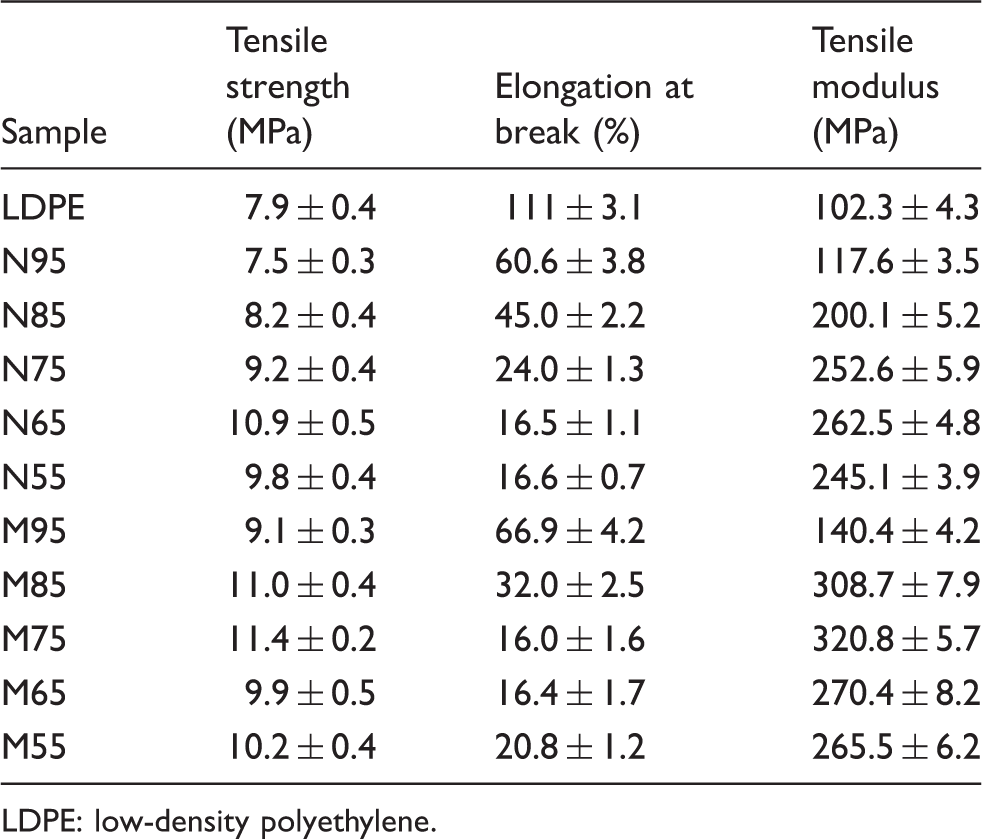
LDPE: low-density polyethylene.
The tensile response of the neat blend and MFCs are further compared with the individual stress–strain curves at each level of PET addition. Figure 5(a) indicates the stress–strain behaviour of N95 and M95. The yielding takes place at higher stress levels for M95 in comparison with N95 demonstrating the positive effect of the PET microfibrils. It should be remembered that the only very few microfibrils were seen in the case of M95, but even they are capable to strengthen LDPE. In the case of 85/15 and 75/25 (Figure 5(b) and (c)) blends, there is dramatic difference in the stress–strain behaviour of blend and MFCs. The stiffness of the MFCs is much higher than the blends as evident from the increase in the slope of the initial portion of the stress–strain curve of the composites. The elongation at break of the MFCs is lower for 85/15 and 75/25 blends. This is a clear indication of the restrictions the microfibrils impose on the deformation of the composite, on the application of the tensile loads. In addition, the yielding take place at higher stress levels in the case of MFCs, indicating the improvement in the strength and hardness.
Stress–strain behaviour comparison of neat blends and microfibrillar composites: (a) N95 and M95, (b) N85 and M85, (c) N75 and M75, (d) N65 and M65 and (e) N55 and M55.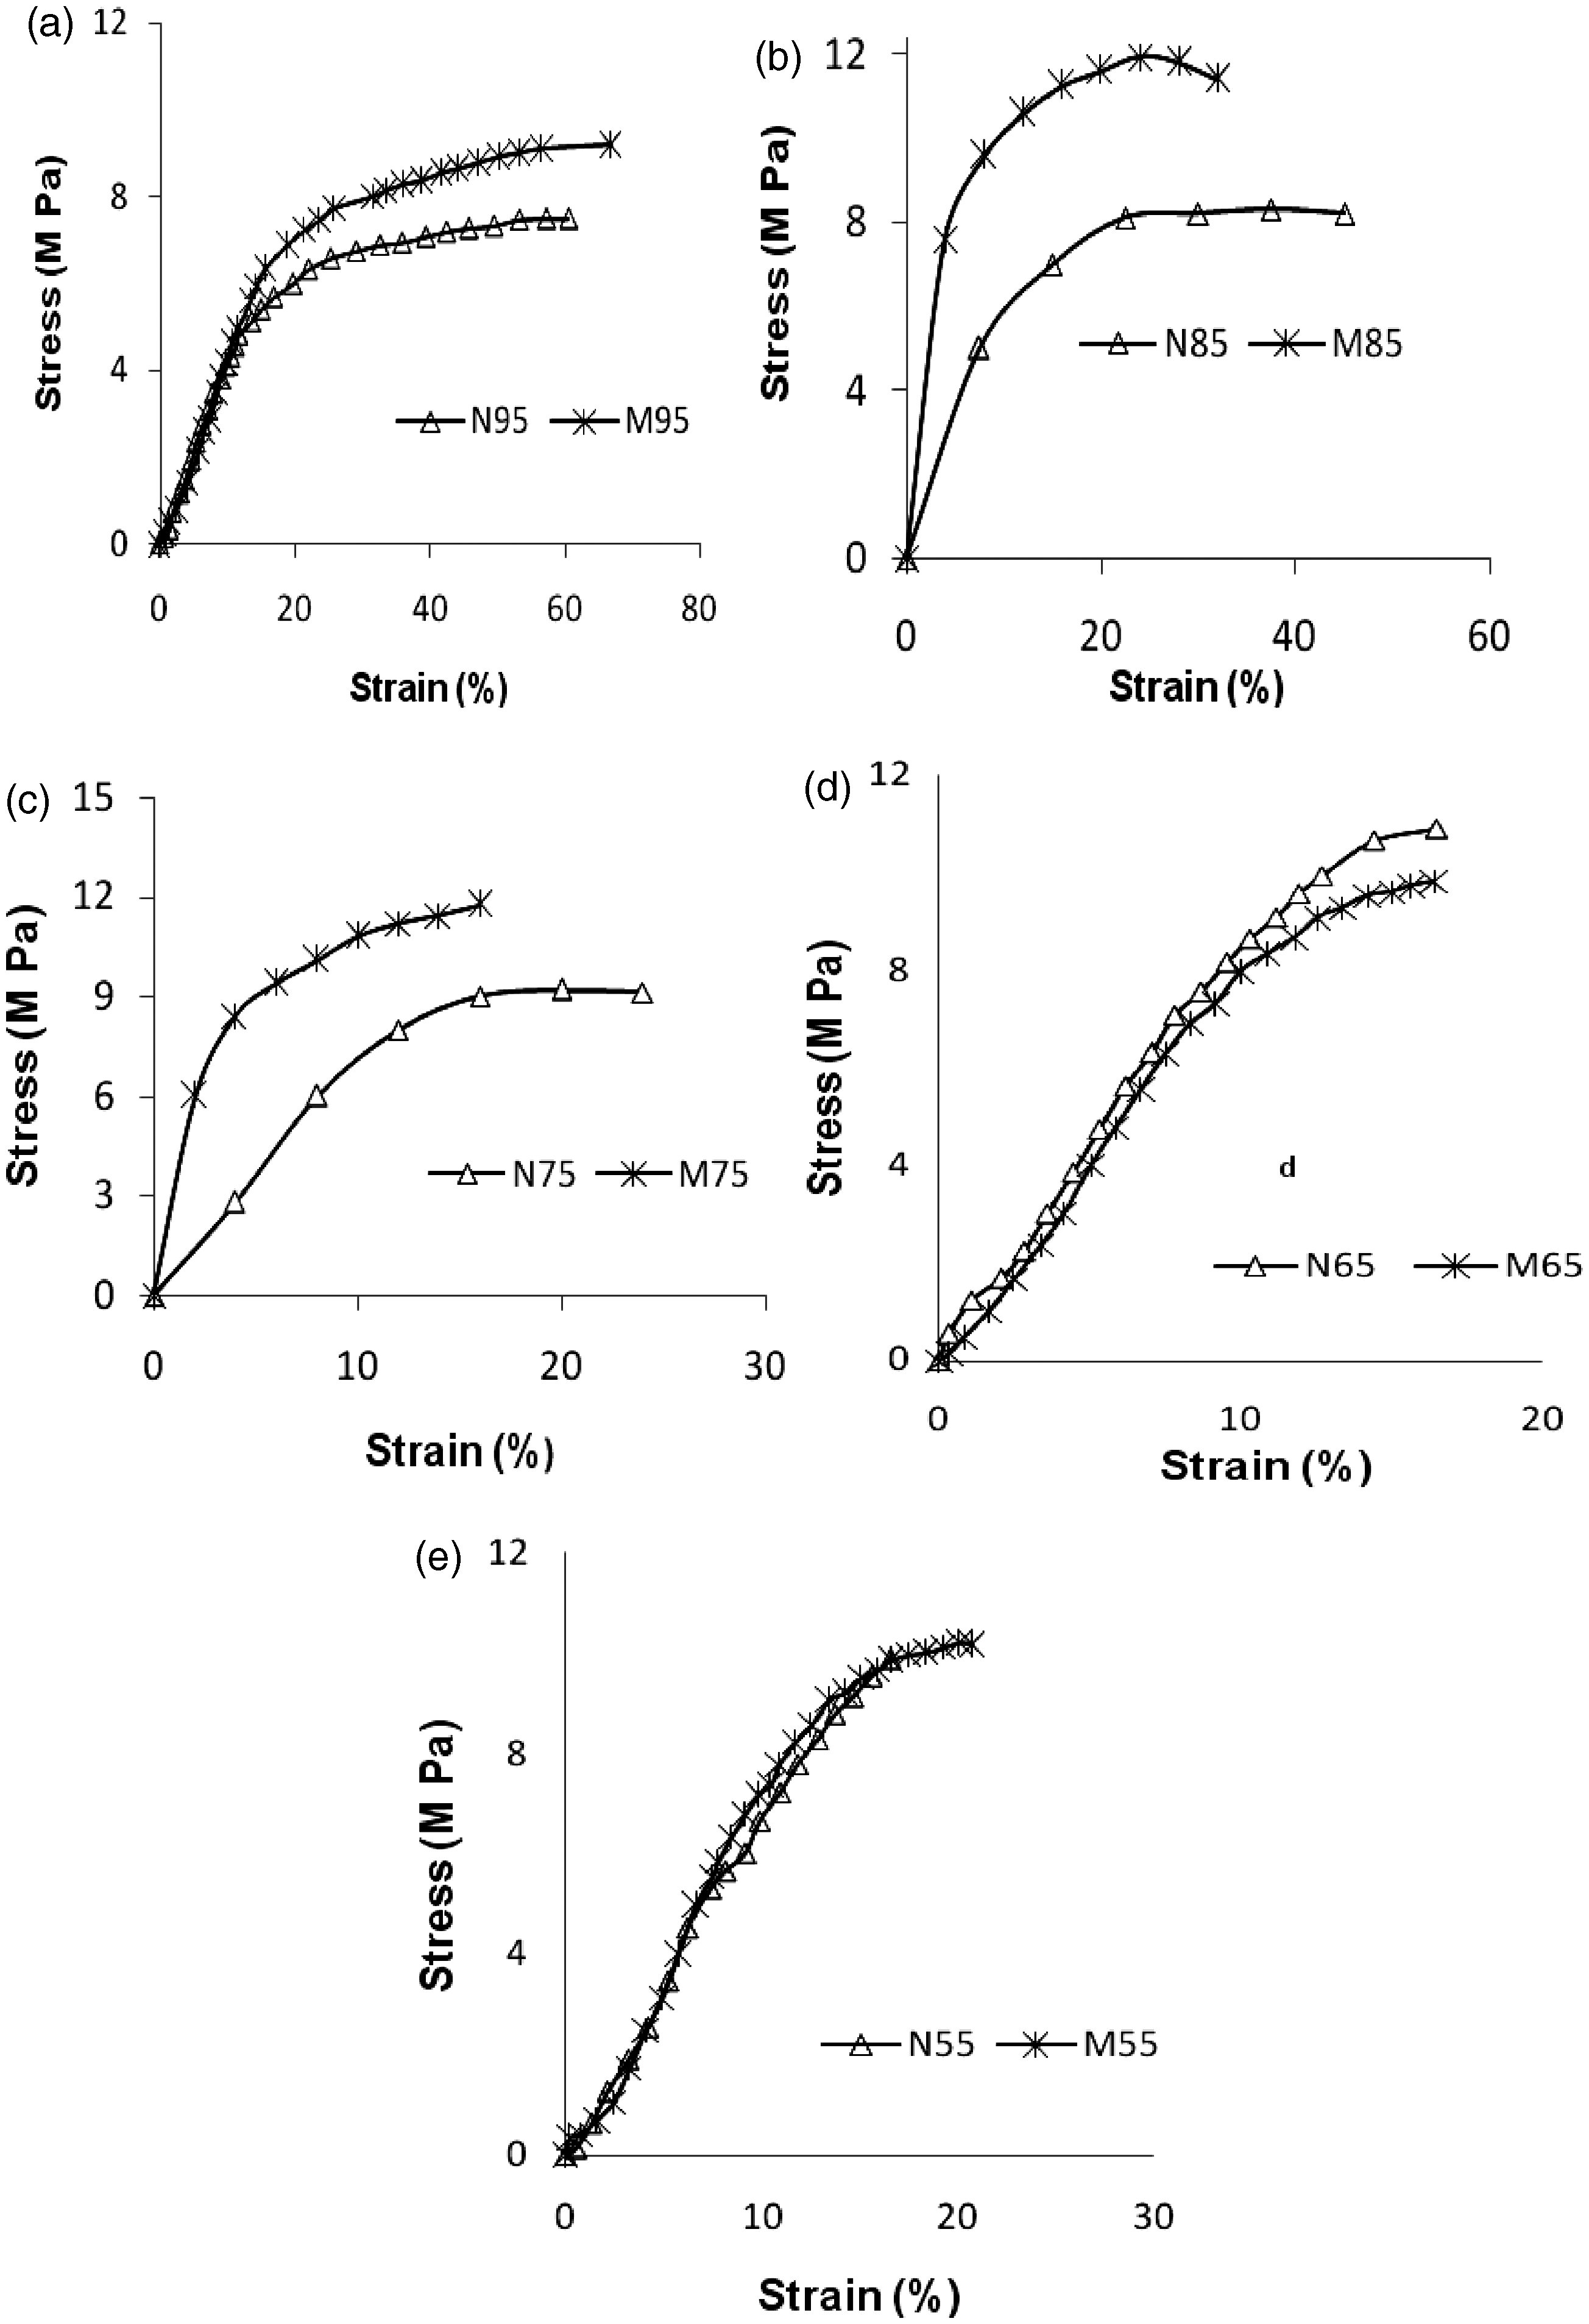
Some interesting observations could be made from the stress–strain behaviour of 65/35 (Figure 5(d)) and 55/45 (Figure 5(e)) blends. The stress–strain behaviour of both blend and MFC are almost identical at these PET concentrations. This trend is quite different from those of 95/5, 85/15 and 75/25 blends. It has been reported by Li and co-workers 26 that higher concentrations of the dispersed polymer may not encourage the enhancement of mechanical properties of MFCs. The obvious reason could be the agglomeration of the microfibrils which are not efficient in stress transfer through the isotropized LDPE matrix. One of the possible methods to restrict the agglomeration of PET microfibrils is to add nanofillers like TiO2. It has been reported by Li et al.44,45 that TiO2 when blended with PP and PET are preferentially located on PET which contributes to a finer blend morphology.
The variation of tensile strength and tensile modulus of neat blends and MFCs with PET concentration are delineated in Figure 6. It could be concluded that the optimum PET concentration for enhanced tensile properties for MFCs is in the range of 25–30%. Beyond 35% of PET loading, the tensile properties of neat blends and MFCs are almost same. The enhanced properties at around 30% are due to the formation of a three-dimensional microfibrillar network of PET, as evident from the SEM images (Figure 4(c) and (d)).
Variation of (a) tensile strength and (b) tensile modulus with polyethylene terephthalate (PET) concentration for neat blends and microfibrillar composites.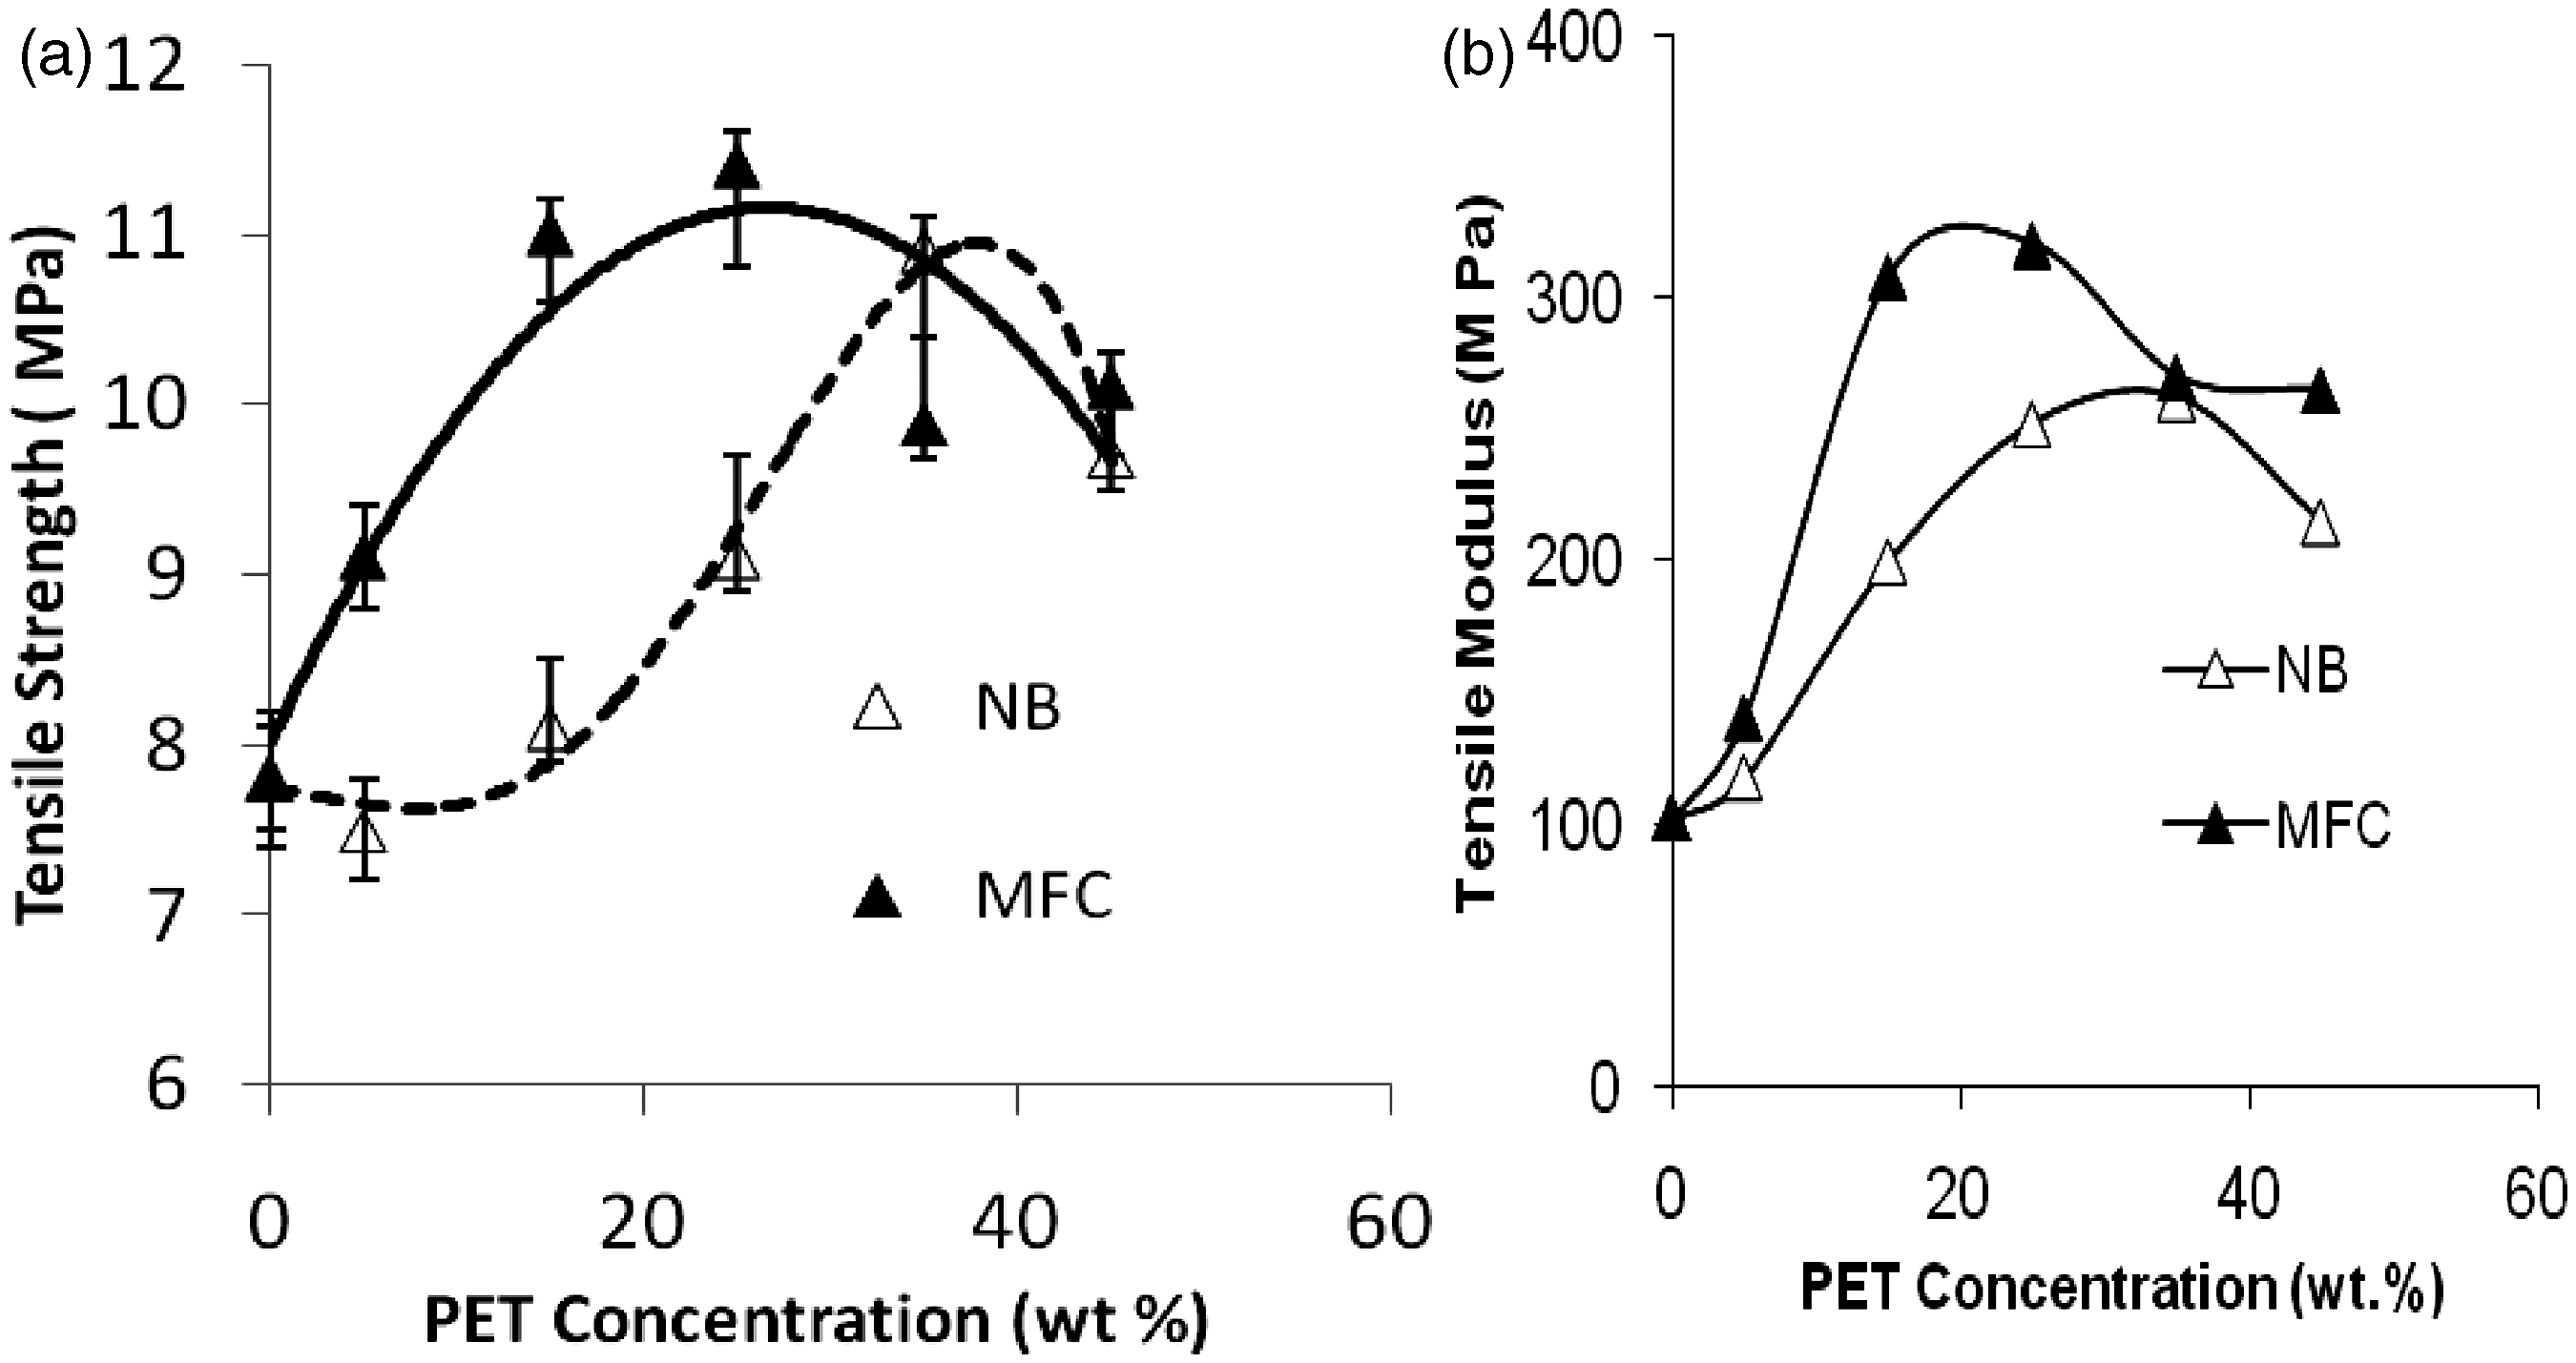
Transport behaviour
The samples used for analysis were LDPE, neat blends like N95, N85, N75 and N65, and the corresponding MFCs, M95, M85, M75 and M65. The experiments were conducted at 30, 50 and 70°C. A possible source of error in these measurements is that arising during weighing. Since the sample has to be taken out from the solvent for weighing, evaporation of the solvent might occur. However, since the weighing is completed within 20–30 s, the error can be neglected. 46
The net diffusion through polymer depends on the difference in the amount of penetrant molecules between the two surfaces. Hence, the permeability
47
can be expressed as

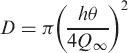
The equilibrium uptake, Q∞, of the solvent was determined. From a plot of mol% uptake (Qt) versus t1/2, a single master curve is obtained which is initially linear. D can be calculated using the equation
48
given below
The permeability of solvent molecules through the blends and composite sample depend on the sorption of solvent by the samples. Therefore, the sorption coefficient is calculated using the equation

Effect of PET concentration
Diffusion, sorption, permeability coefficients of LDPE, neat blends and microfibrillar composites at 30°C
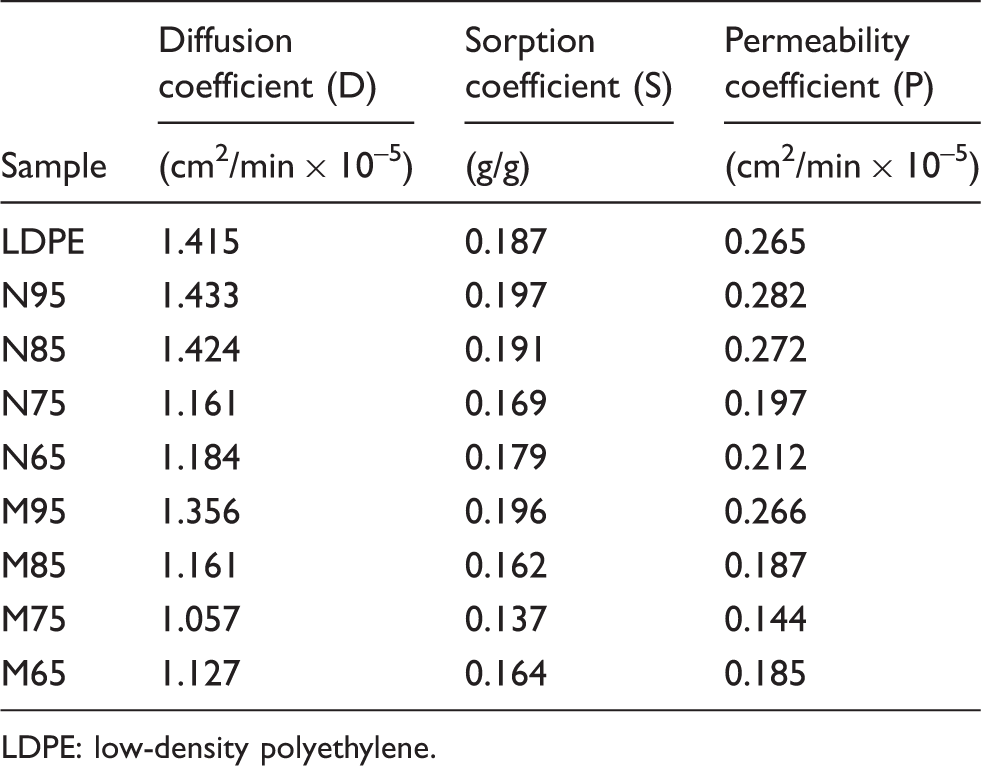
LDPE: low-density polyethylene.
Neat blends
On observing the sorption curve of neat blends at 30°C (Figure 7), the solvent uptake of N95 and N85 was found to be higher than that of LDPE. The addition of PET in low concentrations hastens the sorption of xylene by the blends. It can be attributed to imperfections created at the interface region of the two constituents. The diffusion of xylene is hastened through the LDPE constituent as well as through the weak interface. When the PET concentration is increased to 25% the uptake of xylene is retarded, since the diffusion through PET regions is low. When the PET concentration reaches 35% the size of the dispersed constituent is high, as evident from the SEM images of N65. Large size of the dispersed constituent affects the packed arrangement of the continuous constituent and thereby the transport of the solvents through them.
49
In this case, it can be understood as the loose packing of the LDPE polymer chains because of the presence of larger PET domains and thereby accelerated uptake of xylene.
Sorption curves for low-density polyethylene (LDPE) and neat blends at 30°C.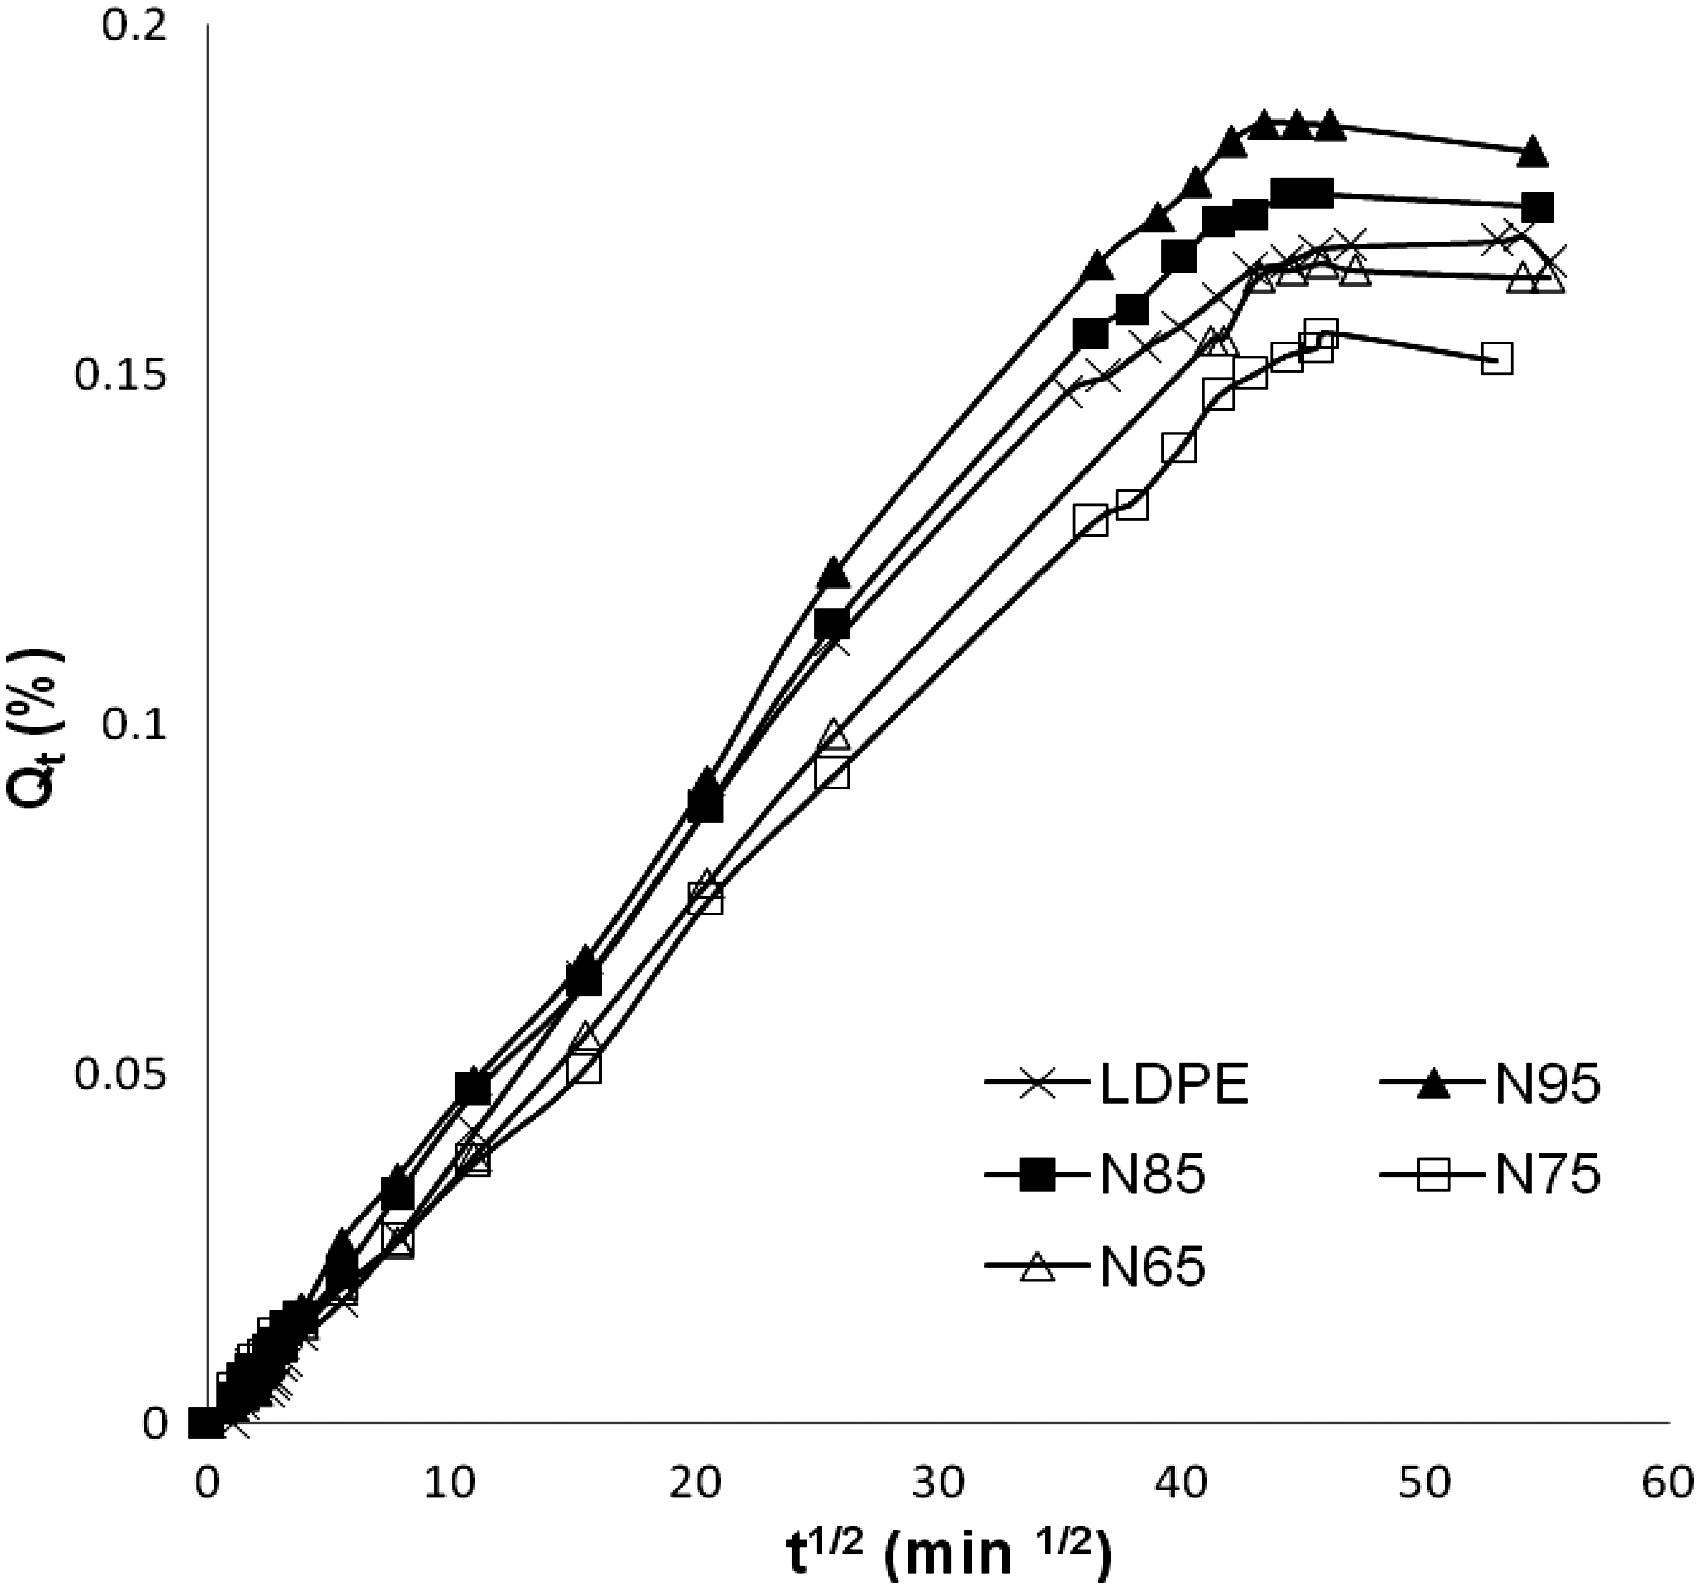
Microfibrillar composites
All the MFCs possess diffusion coefficients lower than LDPE and the corresponding neat blends. The lowest diffusion, sorption and permeability coefficients were obtained for M75. The sorption curves of the MFCs are shown in Figure 8. The low concentration of PET even in the microfibrillar form does not restrict the segmental mobility of the LDPE. Hence, the uptake of xylene in M95 is more than that of LDPE. For the other MFCs, viz. M85, M75 and M65, the molar mass uptake of the solvent was lesser than LDPE. M75 exhibited the lowest solvent uptake at room temperature owing to the presence of randomly oriented microfibrils forming a physical network with LDPE.
Sorption curves for low-density polyethylene (LDPE) and microfibrillar composites at 30°C.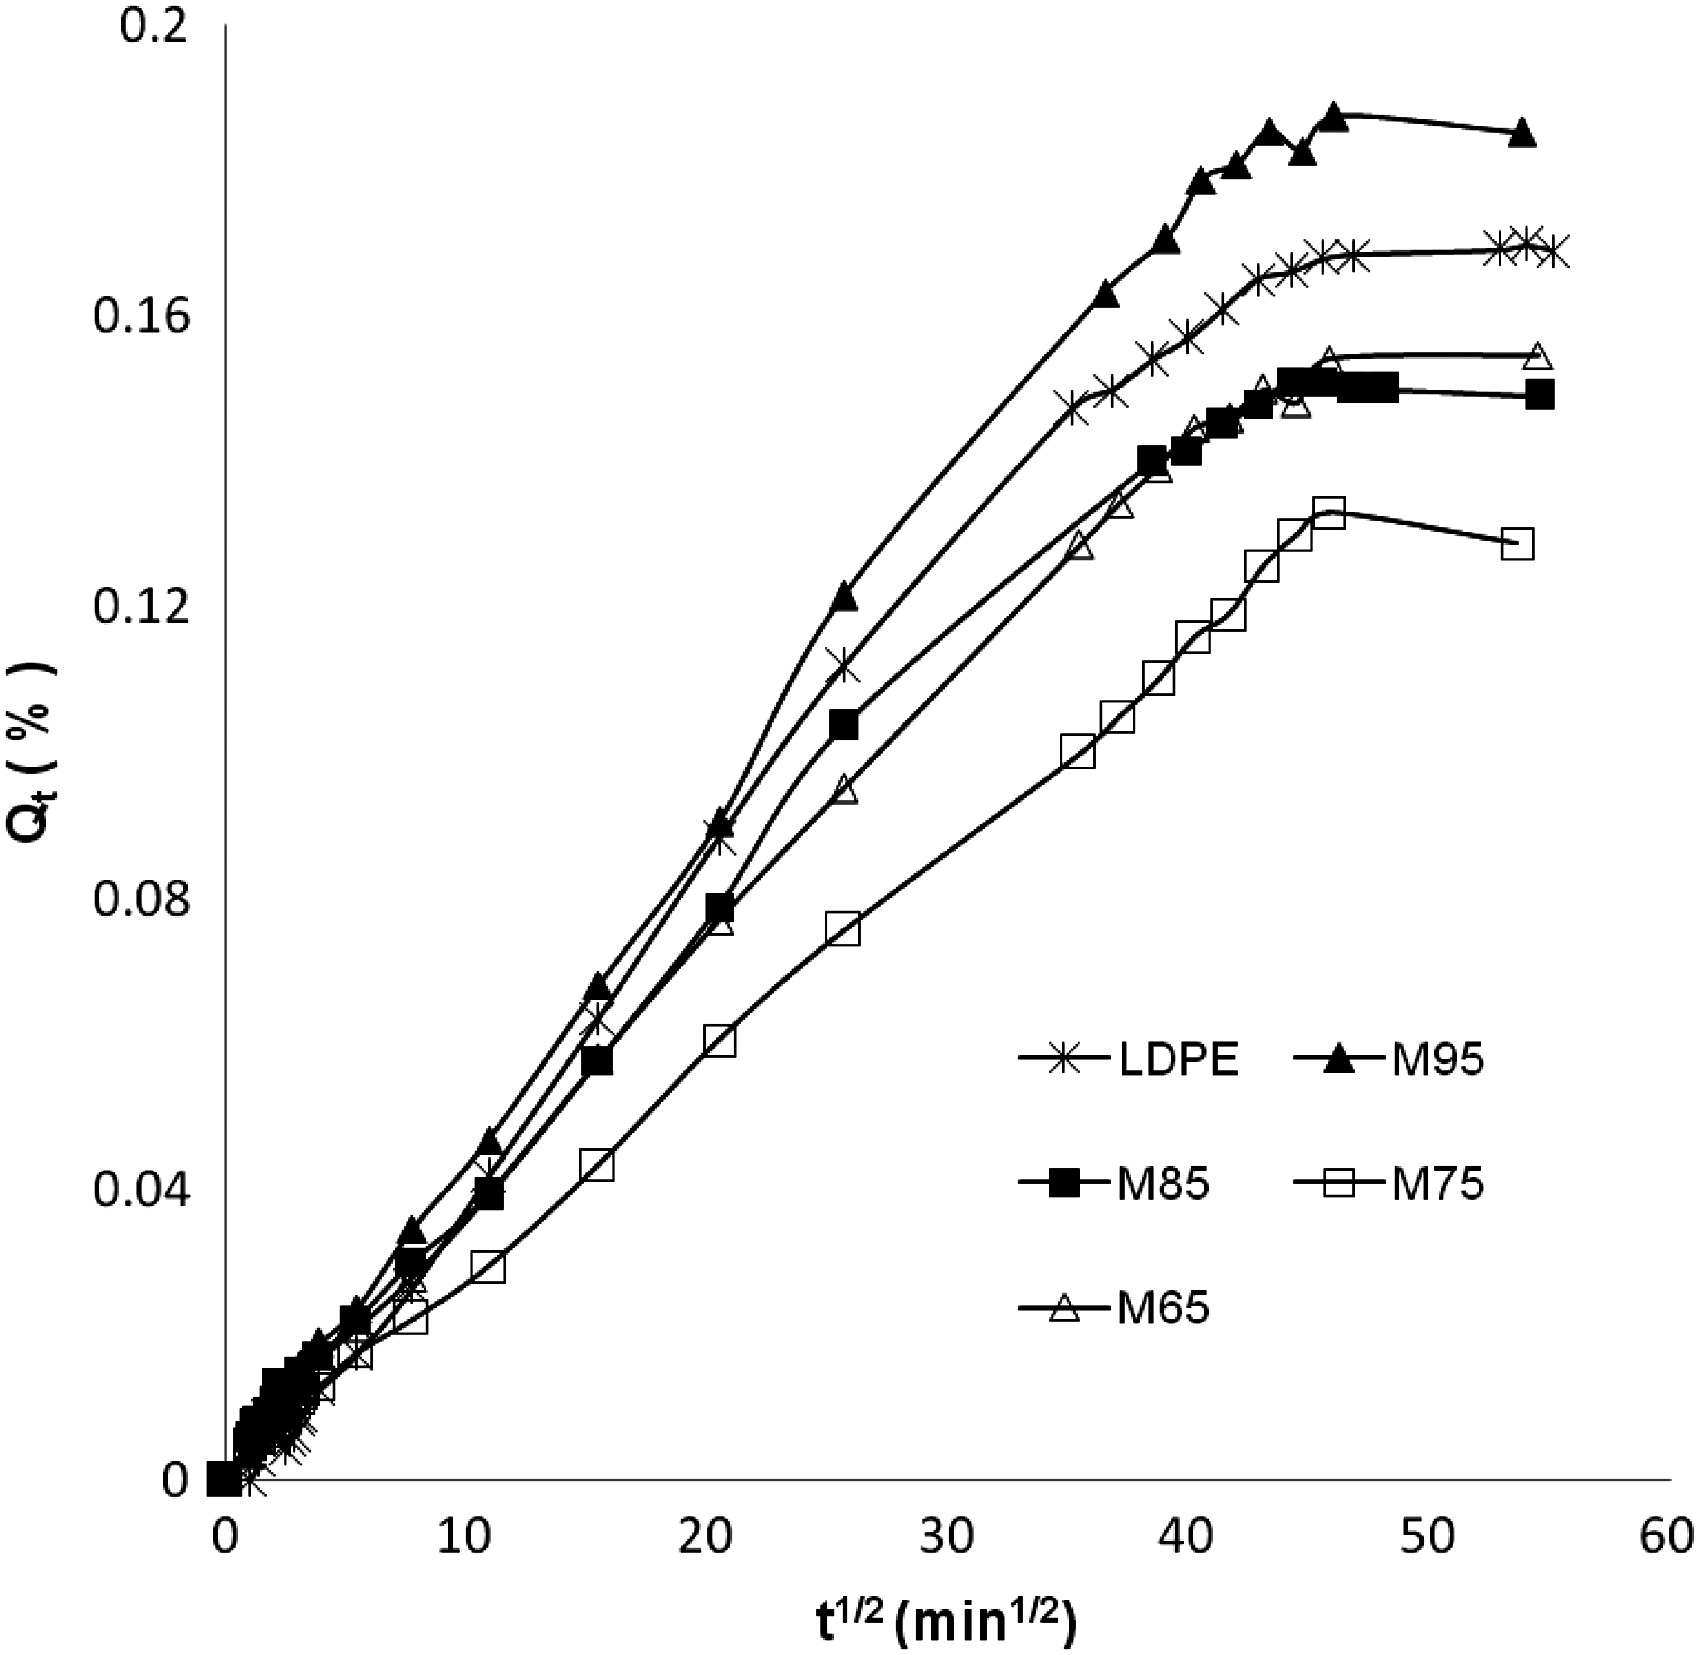
The diffusion coefficients of M85 and M65 were found to be higher than M75. This indicates that the optimization of PET concentration is of profound importance even in the case of MFCs. Higher levels of PET leads to an increase in the size of the microfibrils which is not preferable to reduce the transport of solvents. The morphology investigation using SEM clearly demonstrates that spheres are the least effective barrier shape which the reinforcing constituent can assume, a conclusion that was expected and supports the results of other studies using PE/polyamide blends.
50
The relatively high levels of chain-packing efficiency that occur in the crystalline regions of a polymer reduce the free volume available for solvent permeation to such an extent that this phase may be regarded as impermeable with respect to the amorphous phase.
51
A scheme for the diffusion of xylene through the blend and MFC is presented in Figure 9. The random arrangement of PET microfibrils acts as impediments for the solvent molecules movement in the MFC.
Diffusion scheme of solvent through (a) neat blends and (b) microfibrillar composites.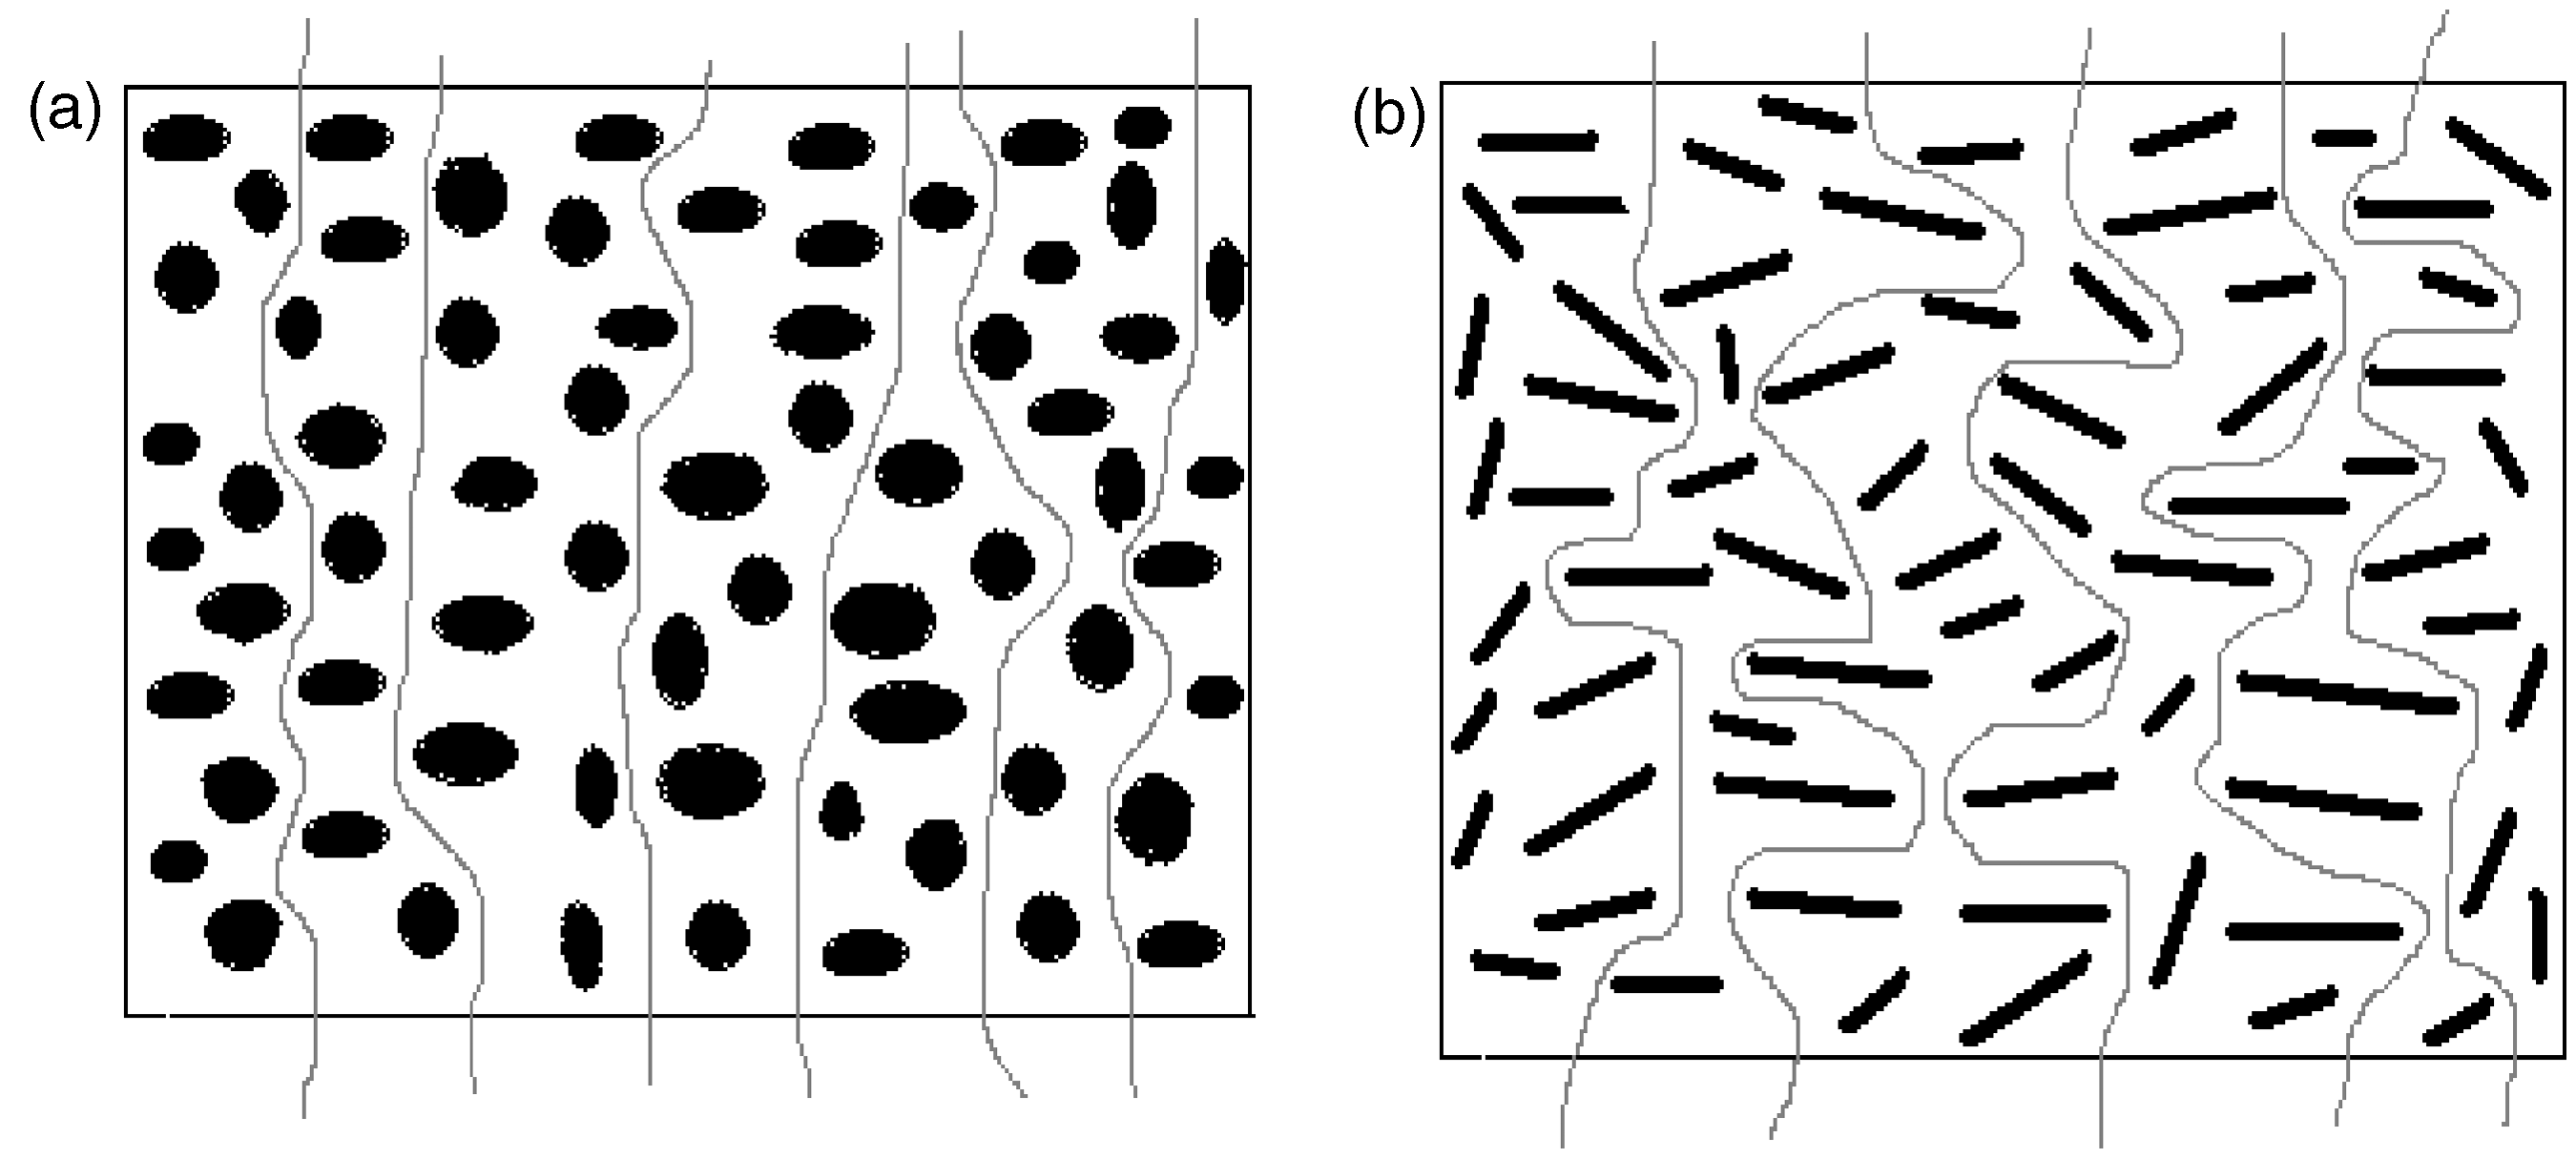
Effect of temperature
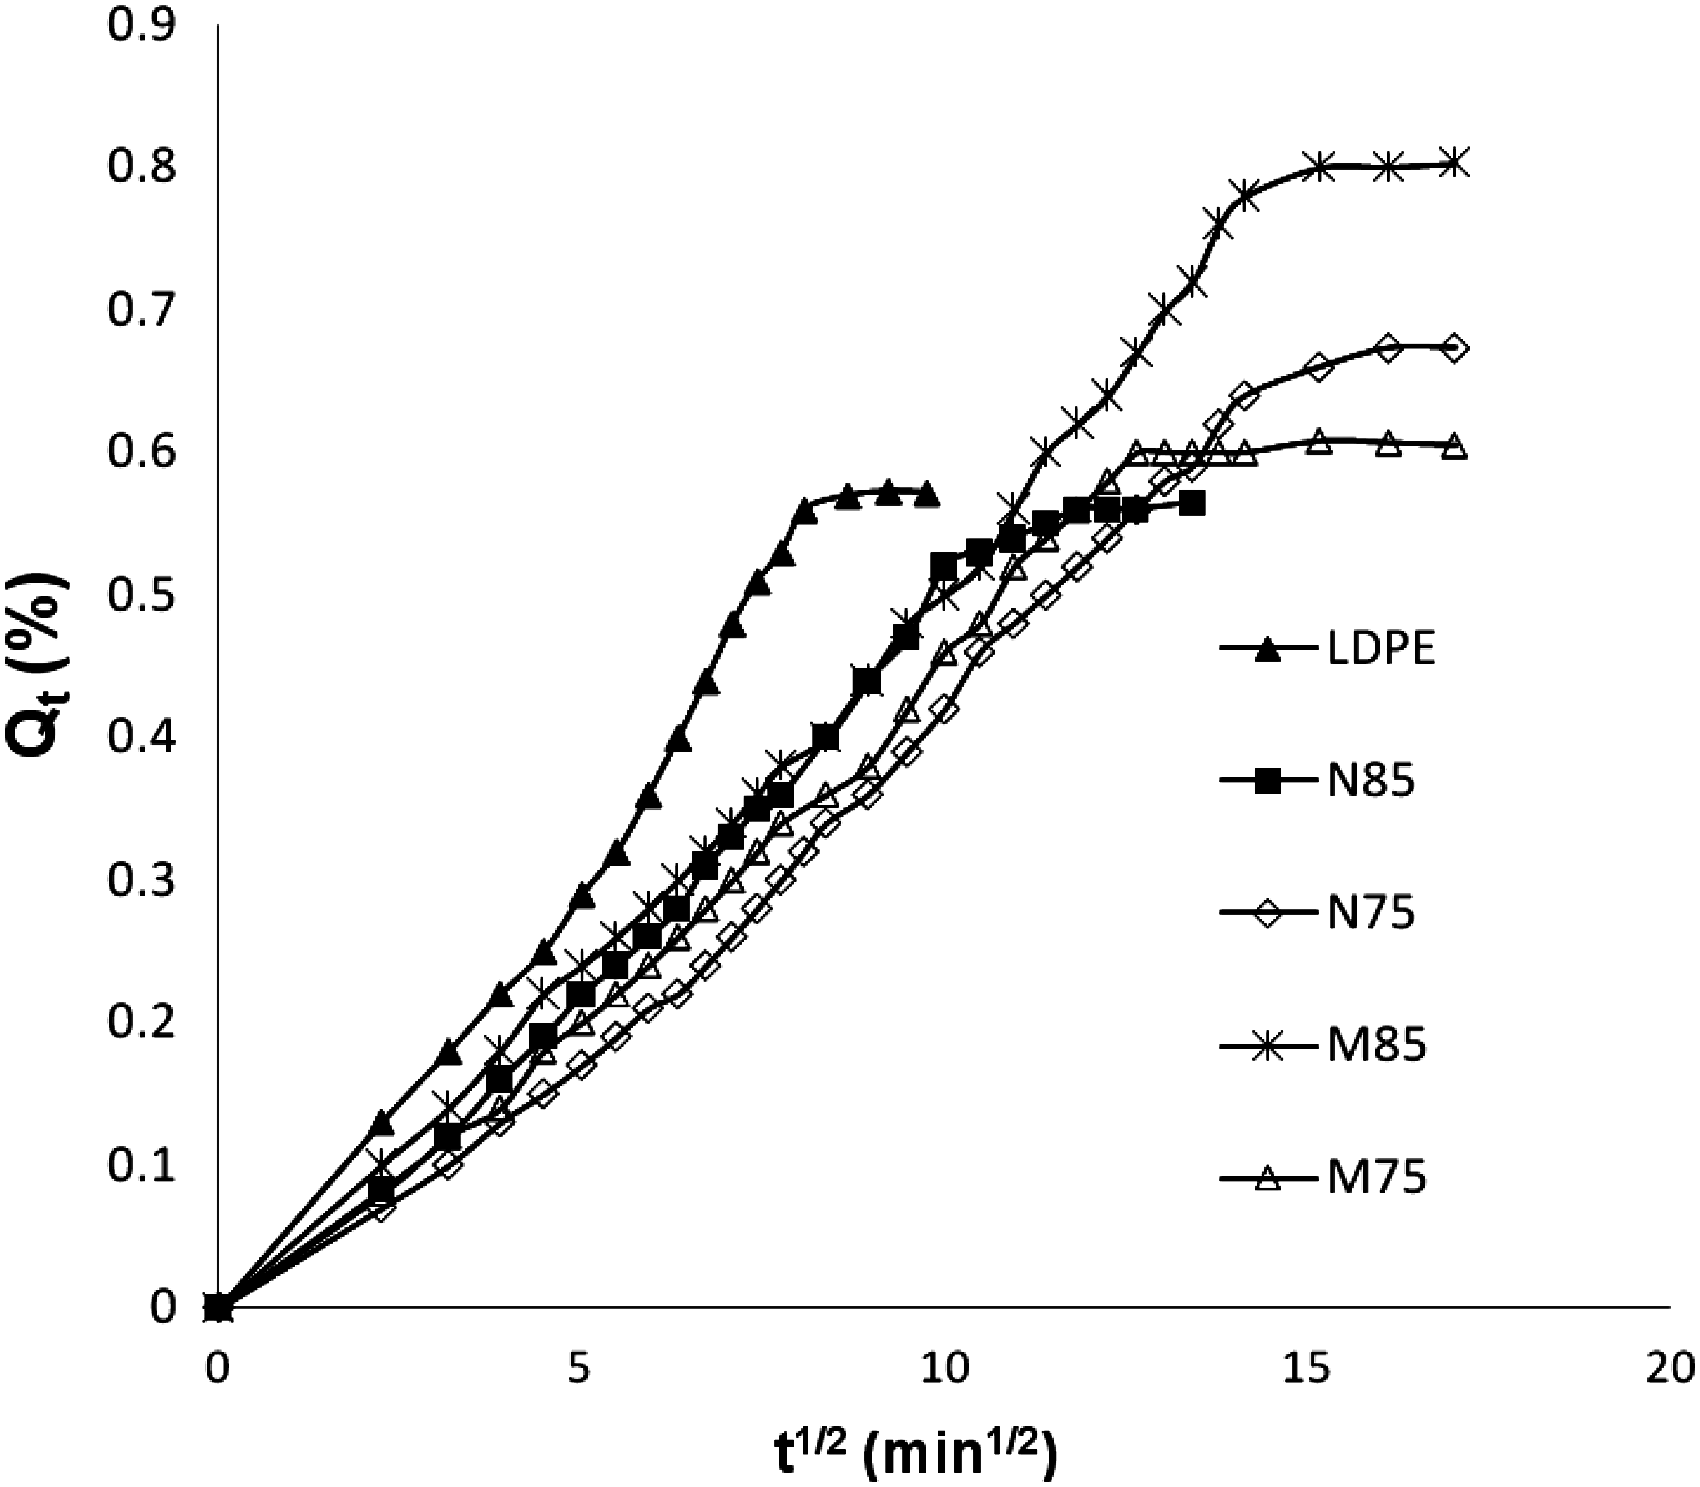
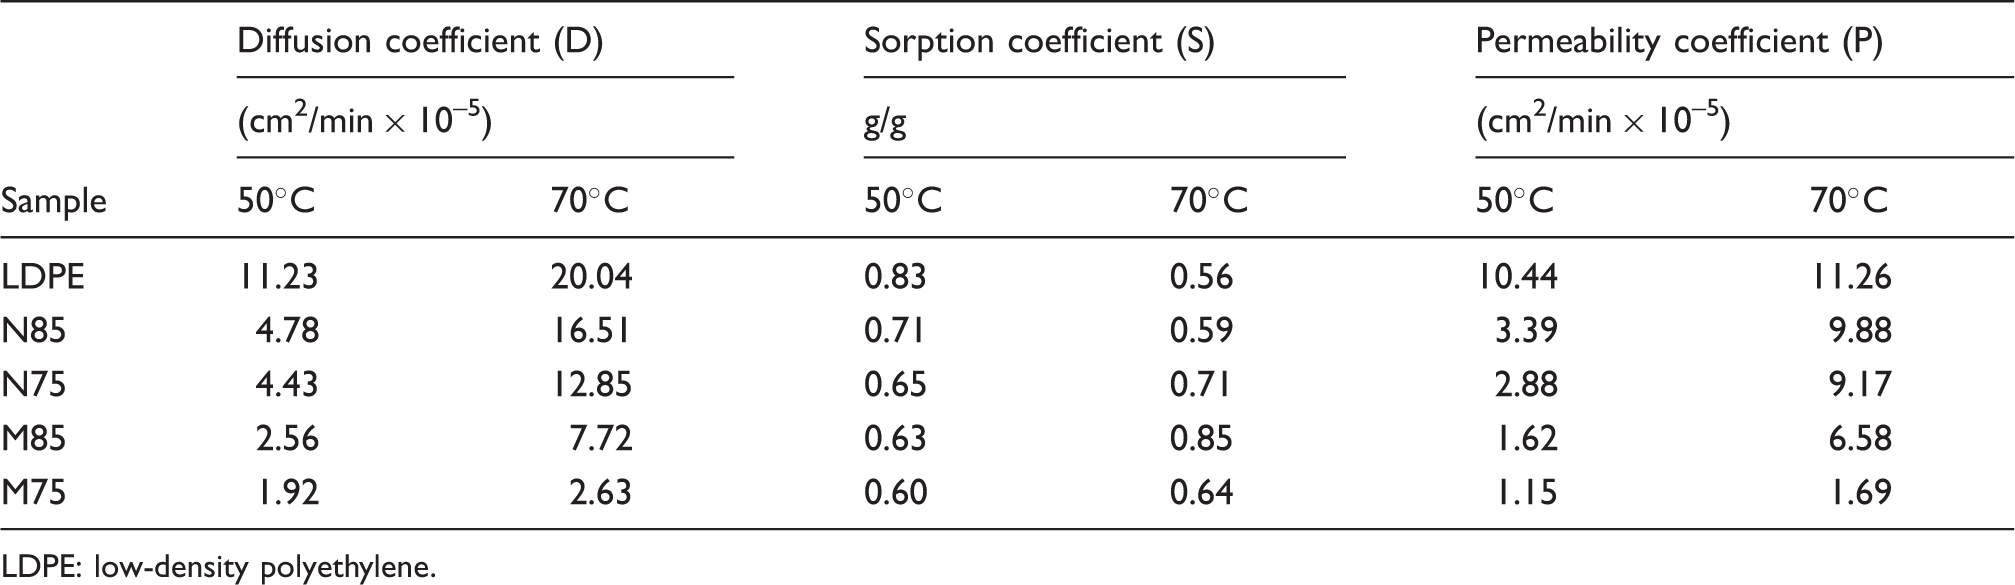
The effect of temperature on the transport characteristics of LDPE, N85, N75, M85 and M75 was studied. The experiments were carried out at 50 and 70°C. The permeability coefficients of the samples increase at 50°C as observed from Table 3. The diffusion of the solvent is faster for neat blends than the MFCs, as evident from the initial slopes of the curves in Figure 10. There is considerable difference in the sorption characteristics of N85 and M85. In the initial stages of solvent uptake, the rates of diffusion of these samples are almost same under the influence of concentration gradient and elevated temperature of 50°C. A major deviation in the sorption behaviour is observed as the time progresses. Initially, the movement of the solvent takes place through the LDPE matrix and interface between LDPE and PET. The PET constituent in the spherical shape does not provide a tortuous path for the movement of the penetrant molecules. However, in the case of MFCs, the random arrangement of the microfibrils poses obstructions to the diffusion of xylene. When the temperature increases to 70°C the dissolution of LDPE occurs very fast, as evident from Figure 11. Hence, the sorption coefficient is low, but the diffusion coefficient is high. The diffusion coefficients of the MFCs are much lower than the corresponding neat blends as observed from Table 4. The high sorption coefficient of MFCs, especially M85, proves the capability of PET microfibrils to hold LDPE together.
Sorption curves for low-density polyethylene (LDPE), neat blends and microfibrillar composites at 50 and 70°C. Variation of solvent uptake (Qt) with square root of time (T1/2) at 30, 50 and 70°C for (a) low-density polyethylene (LDPE), (b) N75 and (c) M75. Diffusion, sorption, permeability coefficients of LDPE, neat blends and microfibrillar composites at 50 and 70°C LDPE: low-density polyethylene.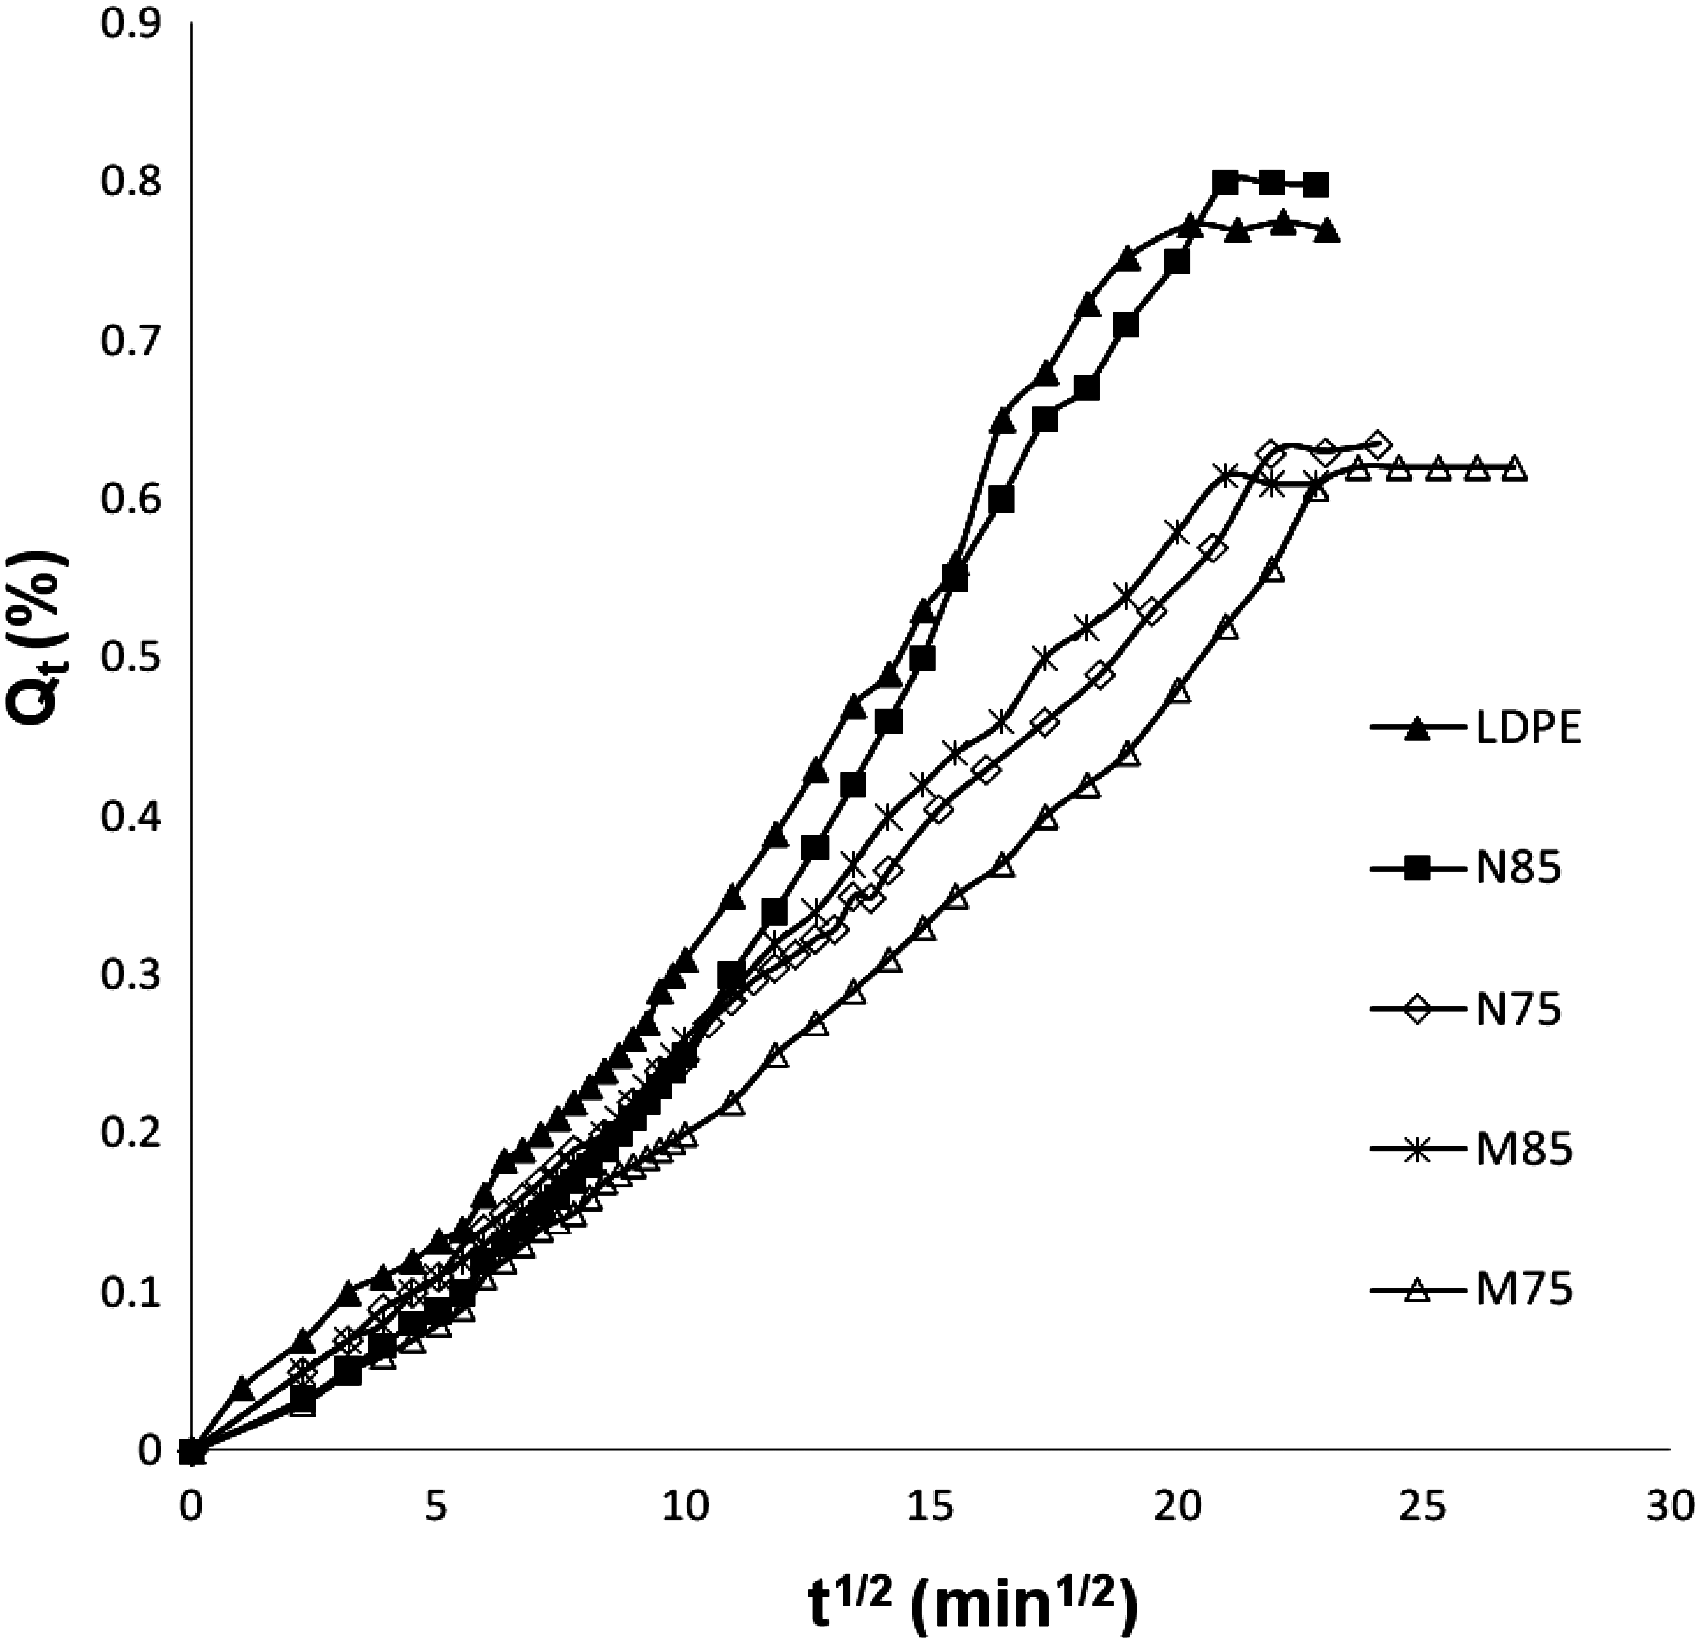
Determination of n and k values

The n and k values for diffusion of xylene through LDPE, neat blends and microfibrillar composites at different temperatures
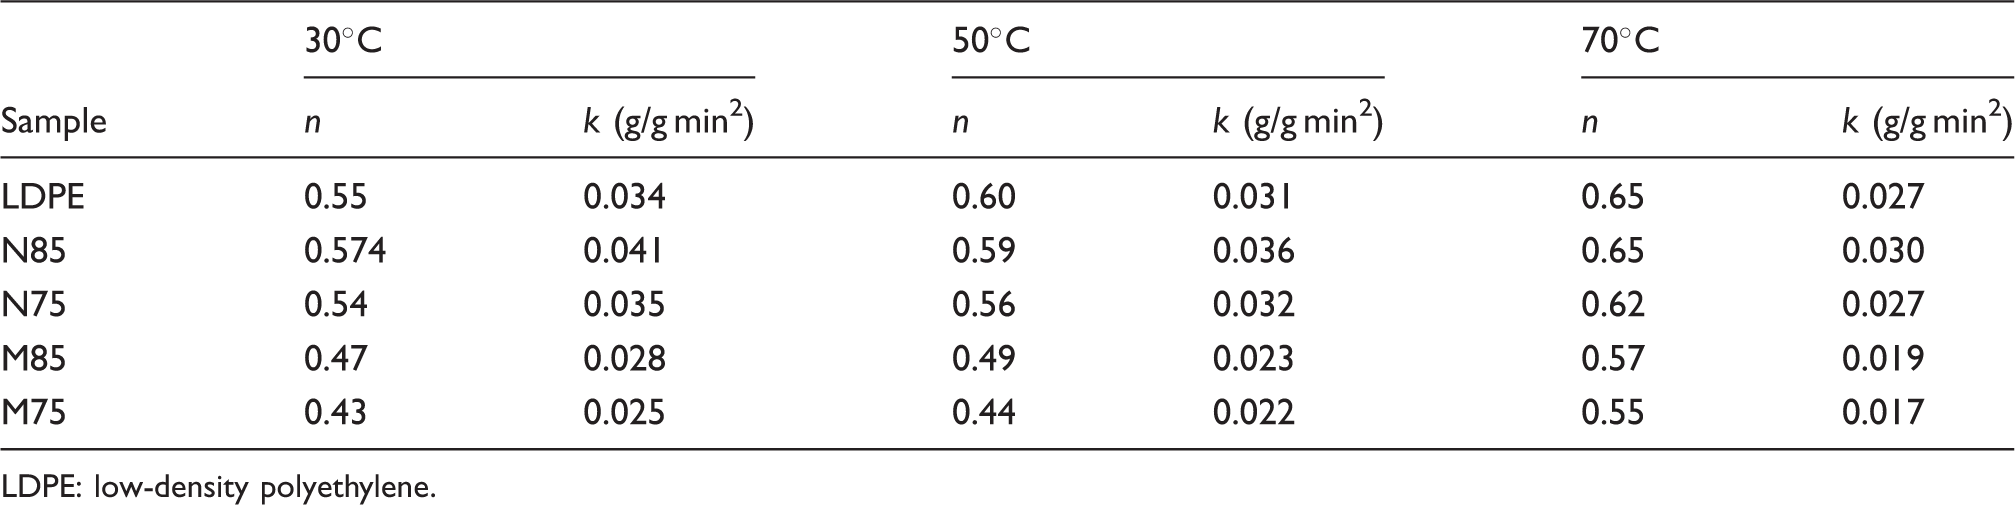
LDPE: low-density polyethylene.
Conclusion
The morphology of the neat blends and the corresponding MFCs are analyzed at the various stages of their preparation. The dispersed constituent exhibits a spherical/nodular morphology in the case of the neat blends. These discrete domains point towards the immiscibility of the LDPE and PET. The average diameter of PET constituent increases with an increase in the PET concentration for the neat blends. The morphology of the blends exhibits co-continuity at very high PET concentration of 45%. At 15 and 25% of PET loading, completely formed microfibrils of PET are observed. At higher PET concentrations, the fibrils formed are not uniform in their diameters. During isotropization for the preparation of MFCs, the aspect ratio of the PET microfibrils reduces. The diameter of the microfibrils is the lowest for M85 and M75. Beyond 35% PET concentration, the microfibrils are found to be agglomerated. The mechanical properties of LDPE/PET neat blends and MFCs were compared at varying PET concentrations from 5 to 45%. The tensile strength of neat blends increases up to 35% of PET loading, beyond which it dropped. The tensile properties are found to increase with PET concentration up to 25% in the case of MFCs, beyond which it declines. The uptake of xylene by LDPE, neat blends and MFCs are analyzed. As the PET concentration increases, the diffusion and permeability coefficients of neat blends and MFCs reduce up to 25%, beyond which they increase. The diffusivity and permeability of the MFCs are found to be lower than that of the neat blends owing to the tortuous path they create for the diffusion of the solvent. The increase in solvent temperature enhances the diffusivity and permeability of all the samples.
Footnotes
Acknowledgement
The authors gratefully acknowledge M/s Futura Polymers Ltd., India for the kind supply of PET material, Sophisticated Test and Instrumentation Centre – Kochi, India for SEM analysis and Dr. K. M. Mini for the illustrations.