
Abstract
In order to analyze the effect of multiwalled carbon nanotubes on the thermal transport/stability characteristics of styrene butadiene rubber, five diverse loadings of multiwalled carbon nanotubes were impregnated in the rubber matrix using dispersion kneader and two roller mixing mill. Thermal conductivity and thermal impedance of the nanocomposite specimens were evaluated according to ASTM E1225-99 and D5470-03. It was observed that the thermal conductivity was reduced up to 79% while thermal impedance of the polymer nanocomposite was improved up to 390% at 523 K with 1 wt% impregnation of nanotubes into the base composite formulation. Thermal stability of the polymer nanocomposite was augmented up to 6%, with the utmost incorporation of the nanotubes. Glass transition and crystallization temperatures were diminished, while the onset and peak melting temperatures were increased with increasing filler to matrix ratio. The percent crystallinity of the nanocomposites has been augmented up to 5%, with 1 wt% incorporation of multiwalled carbon nanotubes into the host matrix. Scanning electron microscopy along with energy dispersive X-ray spectroscopy was used to examine the multiwalled carbon nanotubes dispersion in the rubber matrix, for surface analysis of the post-thermally tested composite specimens and for their compositional analysis.
Keywords
Introduction
Polymer nanocomposite is a combination of a polymer matrix and nanoreinforcement. Thermal, mechanical and electromagnetic properties of polymer nanocomposites are quite different compared to the pristine polymer matrix. 1 Nanoincorporations like nanofillers, nanotube, nanofibers and nanorods interact with the molecular chains of the polymer chemically or physically at the nanoscale, which remarkably influences the physical and chemical properties of the host matrix.2,3 Styrene butadiene rubber (SBR) is produced using emulsion or solution polymerization. SBR composites are used in tire treads, conveyor belt covers, gaskets, mats, shoe soles, etc, due to their excellent impact strength, good resilience, tensile strength, abrasion resistance, metallic adhesion, tear resistance, acid resistance, water resistance and good flexibility at lower temperatures.4,5 SBR is a thermoplastic rubber that is vulcanized with the addition of a vulcanizing agent, i.e. sulphur, peroxides or by using radiation vulcanization techniques. A crosslinked rubber has better thermal stability, mechanical strength, aging resistance, abrasion resistance, weather resistance and tear strength compared with pristine rubber.6,7 Different fillers (nanoclays, nanocarbon, nanosilica, carbon nanotubes (CNTs), graphene, silicon carbide, alumina, and so forth) have been used to tailor the thermal, mechanical, adhesion and abrasion properties of SBR.8–10 SBR is widely used in the tire industry. The mechanical properties of polymer composites directly depend upon their thermal characteristics. In order to maintain the mechanical strength of the rubber composites, thermal stability improvement is also demanded.11,12 CNTs are believed to be remarkable fillers for polymer matrices due to their high modulus, aspect ratio, tensile strength, thermal stability, specific surface area and low density. 13 The incorporation of CNTs in a polymer matrix is a challenging task due to their hydrophobic nature and van der Waals interaction among the nanotubes that agglomerates them and makes their uniform dispersion in the polymer difficult. So, in order to disperse CNTs in the polymer matrix, surface modification of the nanotubes has been carried out. However, this surface treatment also degrades the mechanical strength of the nanotubes.14,15 Thermal properties, i.e. thermal conductivity (TC)/diffusivity, thermal impedance (TI), thermogravimetric stability, glass/crystallization/melting temperatures and their enthalpies are of great importance for polymer nanocomposites because they define their suitable area of application.16,17
This research work aims to study the thermal properties of pristine multiwalled carbon nanotube (MWCNT) impregnated SBR nanocomposites. Varying concentrations of MWCNTs were incorporated into the SBR matrix using dispersion kneader and two roller mixing mill to fabricate rubber nanocomposites to evaluate their thermal responses in the heating environment. This research study reports the novel effects of MWCNTs on the thermal stability/transport and glass transition/crystallization/melting temperatures of carbon black filled composites.
Experimental
Materials
MWCNTs (fabricated through chemical vapour deposition method with Fe catalyst, purity >95%, diameter 20–30 nm, length 50–70 µm, average aspect ratio 2400:1) were supplied by Nanoport Co Ltd, China, and were used as received. Emulsified SBR (INDOPOL 1502) was purchased from Evergreen Global Pte, Singapore. Nanocarbon, sulphur, zinc oxide, wax and stearic acid were purchased from BDH. Vulcanizing accelerators, dibenzothiazole disulphide (MBTS) and N-cyclohexyl-2-benzothiazole sulphenamide (HBS), were purchased from Dalian Richon Chemical Co Ltd, China. Aromatic oil was purchased from International petrochemicals (Pvt) Ltd, Pakistan.
Formulation and fabrication of nanocomposites
Basic formulation with different wt% loadings of MWCNTs.
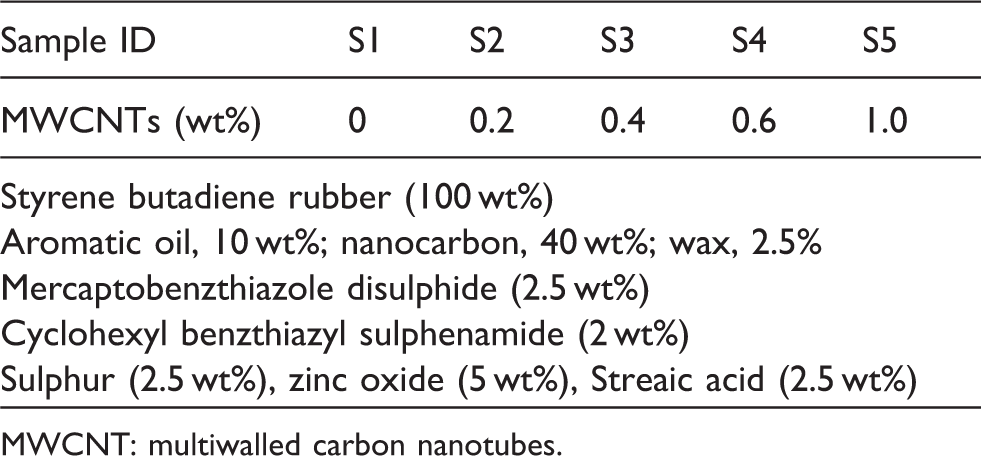
MWCNT: multiwalled carbon nanotubes.
SEM characterization
Scanning electron microscopy (SEM) (JSM 6940 A, Jeol, Japan) along with energy dispersive spectroscopy was used to observe the dispersion of MWCNTs in the SBR matrix, for surface analysis of the post-TC tested specimens and for the compositional analysis of the nanotube and nanocomposite. The 1 cm2 portion from the TC tested and tensile fracture composite specimens was cut and gold coated (3 nm) using automatic ion sputtering device (GFC1500) to make them conductive for the microscopic analysis.
TC and TI experiments
TC of the polymer nanocomposites specimens was carried out using ASTM E1225-99. The thickness of the TC/TI testing polymer composite specimens is 2 mm. The hot and cold meter bars used in the TC apparatus are well polished and leveled copper cubes to enhance the contact probability between the bar and the testing specimen. All the heat transport measurements are recorded under steady-state conditions. Schematic illustration of comparative guarded longitudinal heat flow system in Figure 1 shows the possible locations of temperature sensors, heating source, water heat sinker, temperature data logger and a laptop. Time–temperature contours of all thermocouples located at specific positions were displayed on the laptop screen via OQ610 Portable Temperature Data Logger. TC of the composite specimens was measured using equation (1).
Schematic illustration of thermal conductivity and thermal impedance apparatus.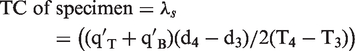
T1, T2, T3, T4, T5 and T6 are the temperatures of six thermocouples and d1, d2, d3, d4, d5 and d6 are the positions of these six thermocouples.
TI of a material is its ability to resist thermal/temperature fluctuations in a variable heating environment. For TI, four thermocouples have been used instead of six in aforementioned TC apparatus. TI of the nanocomposite specimens was measured according to ASTM D5470-03 and by following equation (2).

Temperature of upper meter bar surface in contact with the specimen (K) = TA
Temperature of lower meter bar surface in contact with the specimen (K) = TD
T1 (K): upper temperature of upper meter bar; T2 (K): lower temperature of upper meter bar; T3 (K): upper temperature of lower meter bar; T4 (K): lower temperature of lower meter bar; dA (m): distance between T1 and T2; dB (m): distance between T2 and specimen; dC (m): distance between T3 and T4 and dD (m): distance between specimen and T3.
Thermogravimetric study
Thermal stability and heat flow response of the polymer composites were characterized using Perkin Elmer Diamond TG/DTA, Japan. Heating rate and temperature range during the thermogravimetric and differential thermal analyses of the specimens was 10℃/min and 25–800℃, respectively.
Differential scanning calorimetric analysis
Perkin Elmer Diamond DSC, Japan, was used to analyze physical transformations like phase transitions (glass, crystallization and melting) and the corresponding specific enthalpy of the fabricated samples with heating rate (10℃/min) from −75 to 450℃.
Results and discussion
Dispersion of MWCNTs
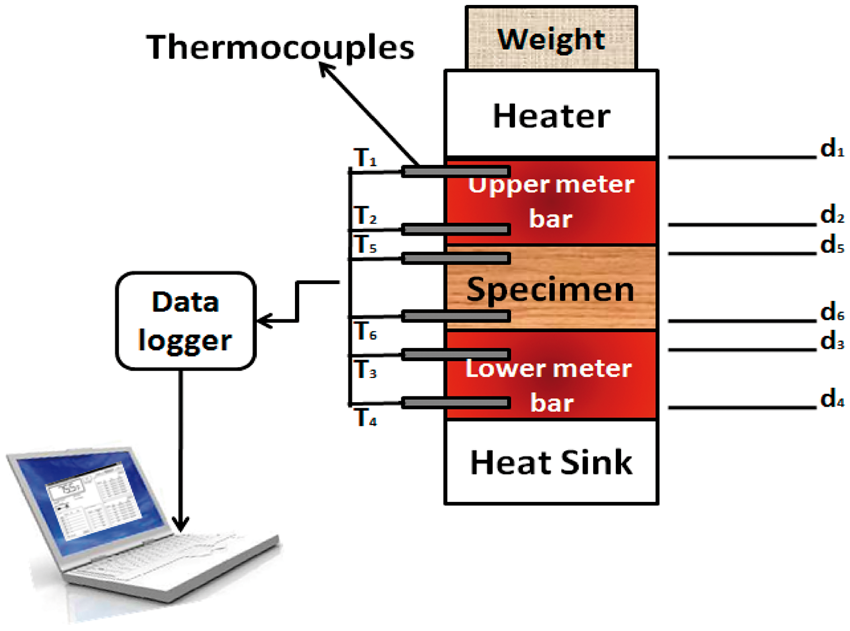
Figure 2(a)–(c) elucidates the even dispersion of nanotubes in the rubber matrix along with the compositional analysis of the nanotubes. The homogenous mixing of CNTs in the polymer matrix is due to the proper diffusion of nanotubes into the rubber matrix in internal dispersion kneader. The longitudinal, transverse and horizontal flow of material during its passage through the twin roll nip of two roller mixing mill in the post-mixing stage also imparts an important role to disperse nanotubes efficiently in the SBR matrix.
SEM images of MWCNTs distribution in the SBR matrix and the compositional analysis of a nanotube in S5 nanocomposite.
Thermal conductivity (λs)
TC contours of the nanocomposite specimens in the temperature range 323–523 K are displayed in Figure 3. At low temperatures from 323 to 348 K, the TC of all composites enhances synchronously but the improvement of S1 composite specimen is almost half compared with the other ones. From 373 to 523 K, rubber nanocomposite specimens maintain a specific level of λs and no further big ups and downs are observed in λ
s
values with increasing temperature. S5 nanocomposite settles itself at a lowest level of λ
s
after 348 K till the end due to the utmost level of MWCNTs loading in the polymer matrix.
18
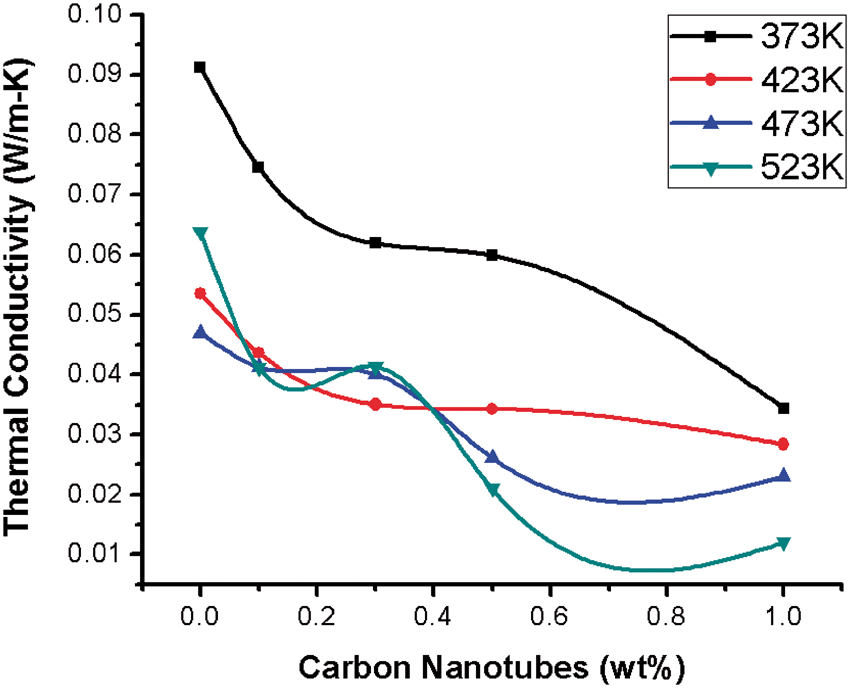
CNTs physically interact with the molecular chains of the polymer at the nanoscale and restrict the thermal motion of polymeric chains in the heating environment. MWCNTs in the SBR matrix entrap phonons, which reduce the thermal conduction and maximize the thermal stability of the nanocomposite specimen.19–22 Figure 4 shows a downfall in TC values at 373, 423, 473 and 523 K, simultaneously with increasing nanotube concentration in the rubber matrix. The maximum values of TC (in W/m-K) are observed for S1, i.e. 0.091, 0.063, 0.053 and 0.047, respectively, at the above-mentioned temperatures. The minimum levels of λ
s
(in W/m-K) are noticed for 1 wt% loaded composite specimen, i.e. 0.034, 0.029, 0.023 and 0.012, respectively, at the above-mentioned temperatures. S5 has 63%, 54%, 57% and 74%, respectively, less TC compared with S1 at the specific temperatures shown in Figure 4. Thermal transport through a solid material is strongly dependent upon the anisotropic factor, The effect of temperature on the thermal conductivity of the MWCNT/SBR composites. The effect of MWCNTs concentration on the thermal conductivity of the polymer nanocomposites.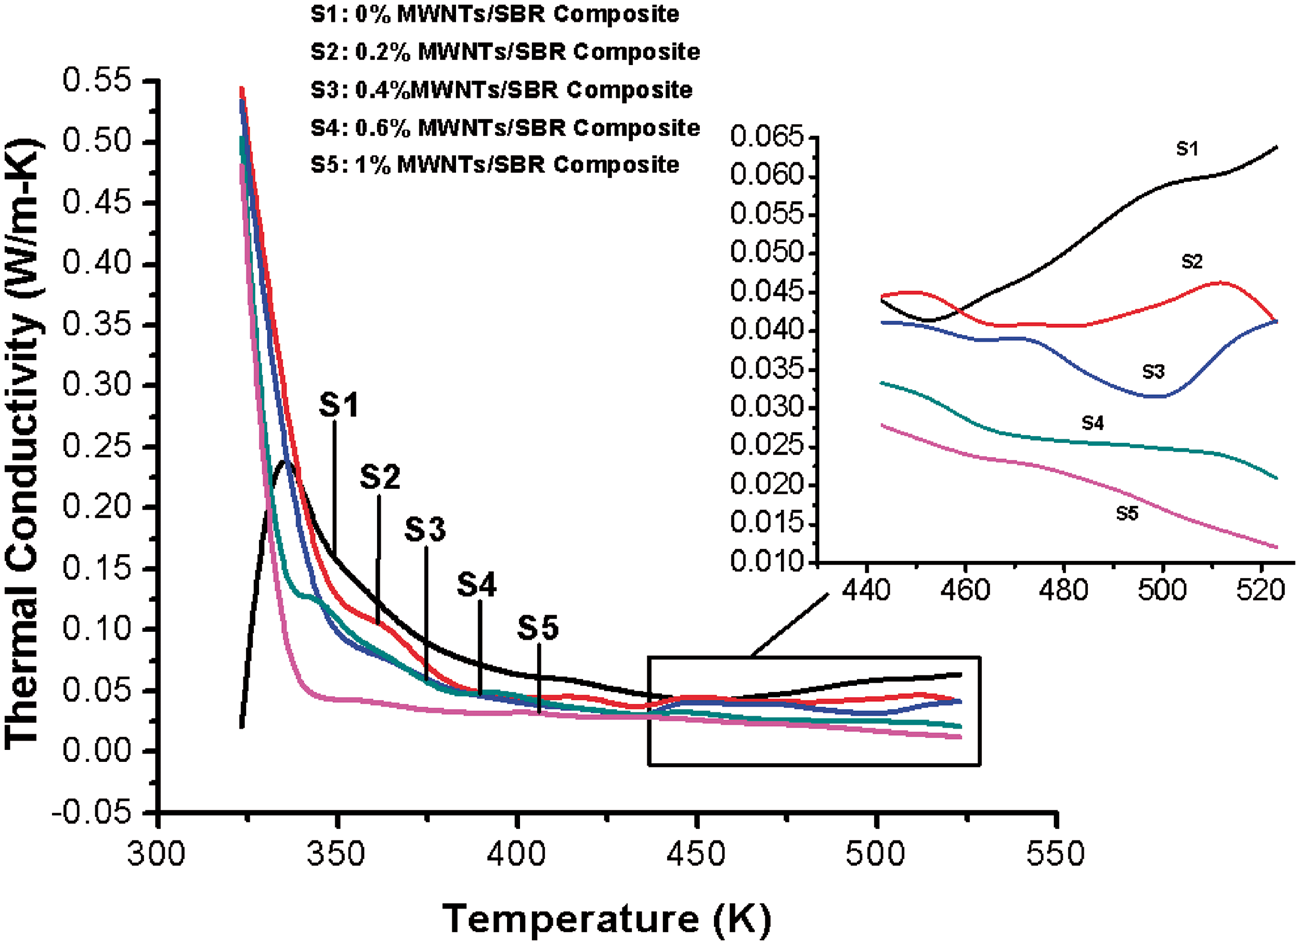
Thermal impedance
The TI (R) is the material’s ability to resist heat flow and is measured according to ASTM 5470-03 and equation (2) in the temperature range 323–523 K. Figure 5 illustrates an evolution in R values with increasing upper copper bar temperature up to 473 K for all rubber nanocomposites simultaneously and then a downfall is observed for S1 to S3 composites. The S1 composite occupies the lowest R level at 523 K, while S5 maintains an approximate equilibrium after 473 K and it also has the maximum R value among all the fabricated specimens.27,28 S5 has 30% higher thermal resistance compared with the S1 at 473 K due to the incorporation of MWCNTs in the polymer matrix, which enhance the insulation capability of the nanocomposite. The combination of MWCNTs and SBR has diminished the thermal mobility of phonons, which increases TI of the polymer nanocomposites. SEM images of the post-TC/TI tested composite specimens are shown in Figure 6(a)–(e).
Thermal impedance of MWCNT/SBR composites in the temperature range 323–523 K. SEM images of post-thermal conductivity/impedance tested nanocomposite specimens: (a) S1, (b) S2, (c) S3, (d) S4 and (e) S5 and (f) EDS analysis of S4 composite specimen.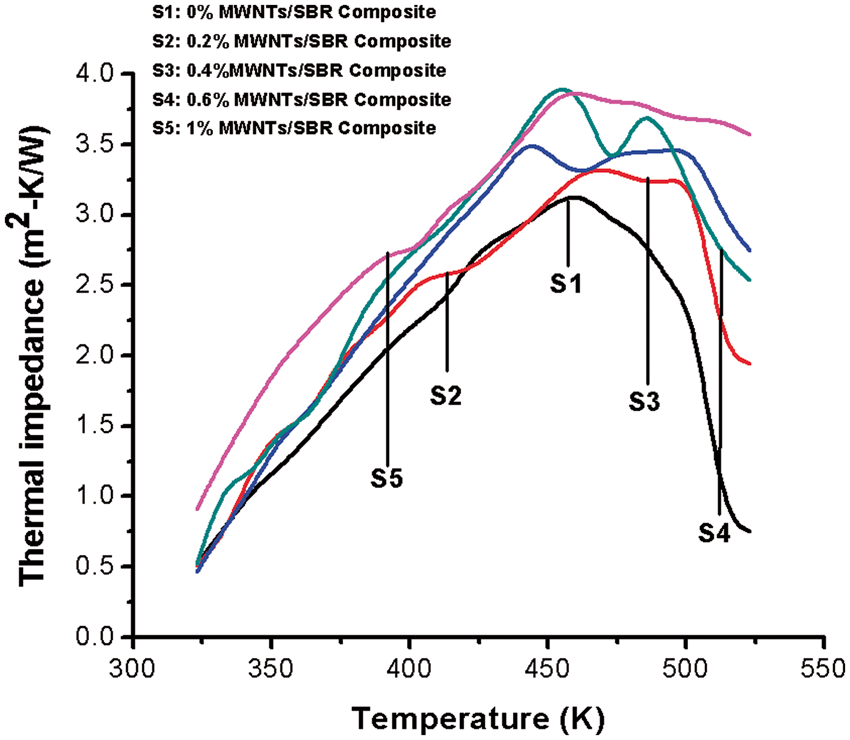
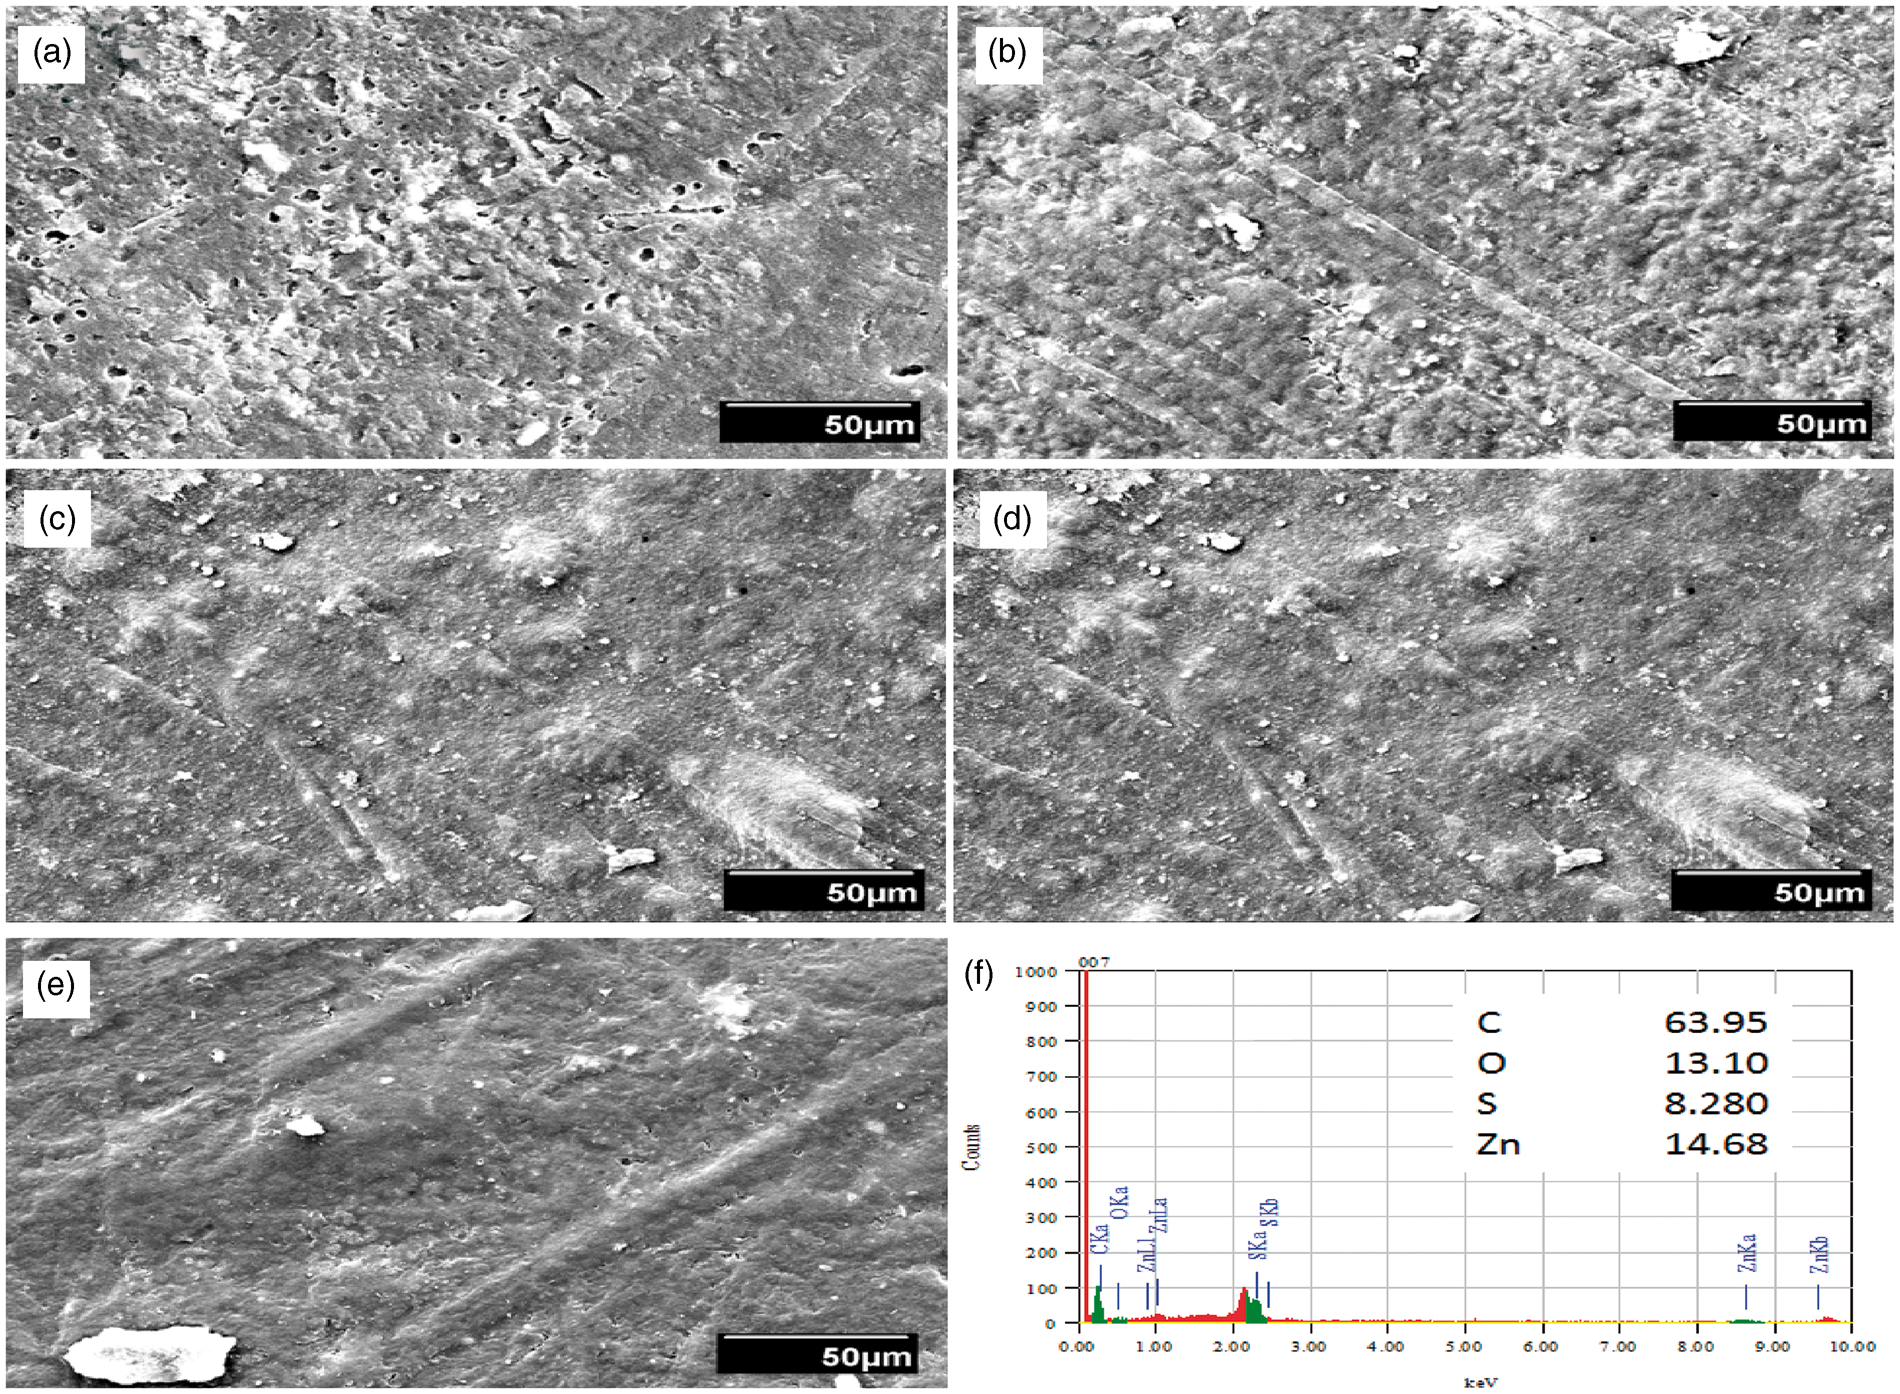
The S1 composite has the maximum porosity compared with the other nanocomposites, which means that the composite surface damage is higher in the heat atmosphere in contrast with the other ones. The progressive addition of nanotubes in the polymer matrix has augmented the thermal stability and surface layer protection of the composite specimens. C, S, Zn and O are the elements detected in EDS analysis of S5 and shown in Figure 6(f). The incorporation of the nanotubes into the base composite formulation enhances the surface protection of the composite specimen in the steady-state heat atmosphere owing to the high thermal stability and aspect ratio relative to the carbon black. 19
Thermal stability and heat flow response
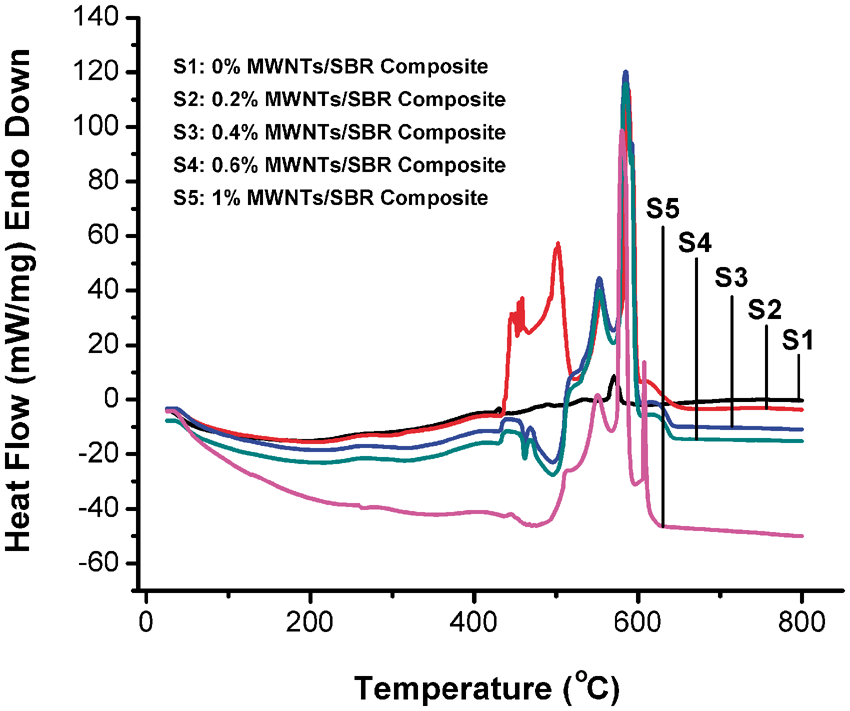
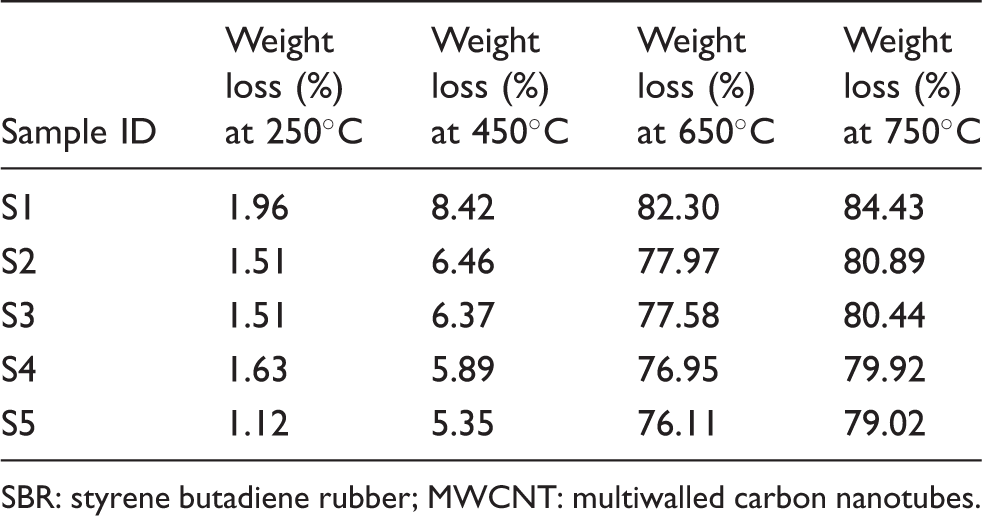
Thermogravimetric analysis of the rubber nanocomposites in the temperature range 25–800℃ is shown in Figure 7 to ascertain the effect of the MWCNTs loadings on the thermal stability of SBR matrix. Insignificant weight loss is observed up to 460℃ and the maximum thermal degradation of the composite specimens is noticed in the preceding 140℃. Thermal stability of the polymer nanocomposites has been improved with increasing nanotubes concentration in the rubber matrix, as is clear from Table 2, which shows the comparative study of weight loss at four diverse temperatures.29,30 Figure 8 elucidates the heat flow response of the polymer nanocomposites and the maximum variation in heat flow is observed in the temperature range in which the maximum thermal degradation has been noticed in thermogravimetric analysis. The composite materials tend towards the endothermic response with the progressive incorporation of MWCNTs in the base composite (S1). S5 has absorbed the maximum input heat compared with the others.
Effect of MWCNTs concentration on the thermal degradation of polymer nanocomposites. Heat flow response of MWCNT/SBR composites. Percentage weight loss of MWCNT/SBR composite specimens at diverse temperatures. SBR: styrene butadiene rubber; MWCNT: multiwalled carbon nanotubes.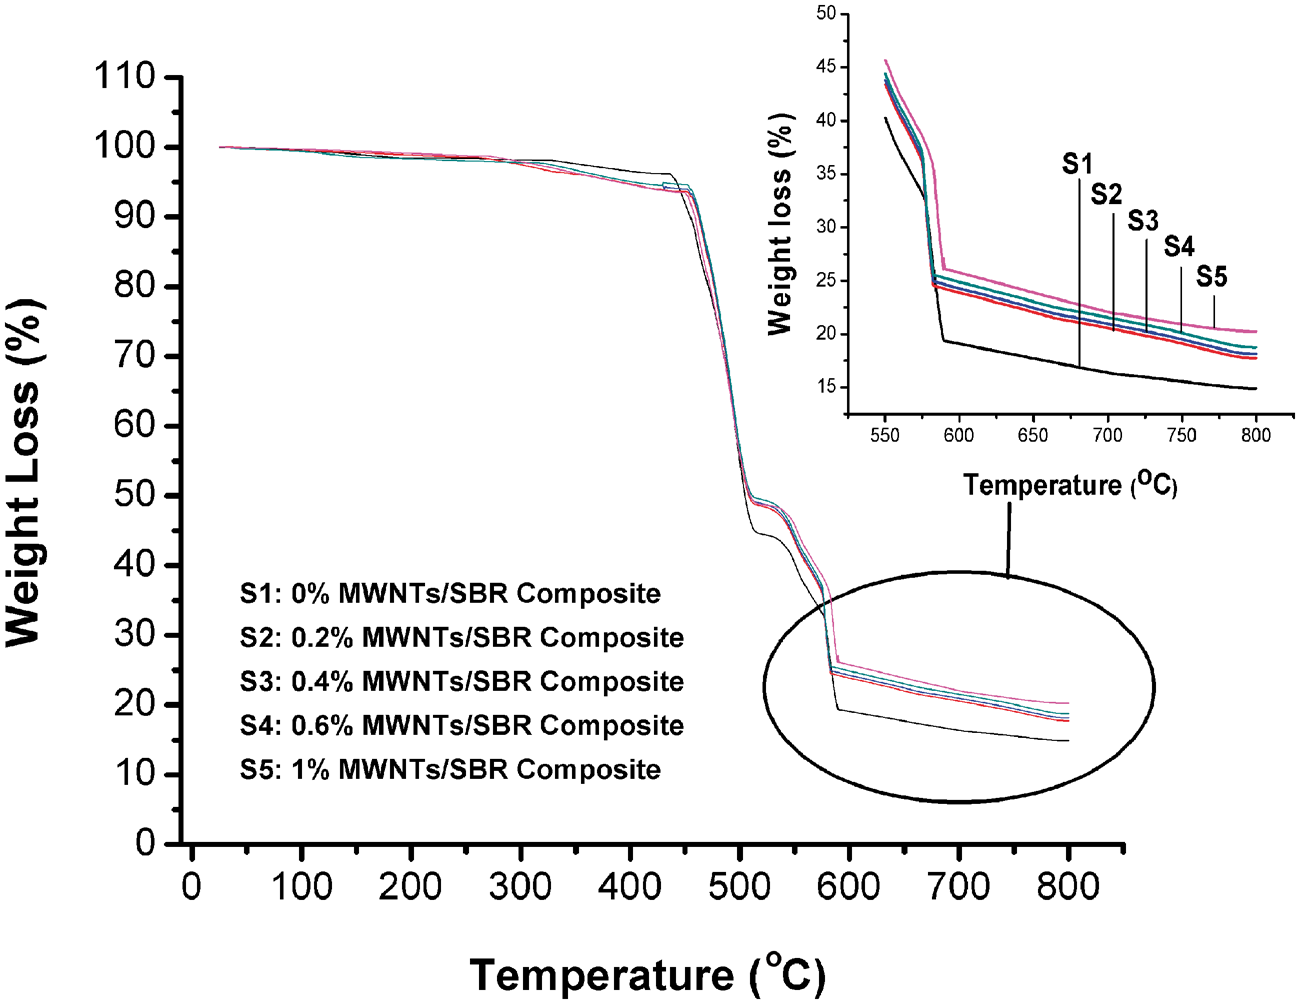
Differential scanning calorimetric study
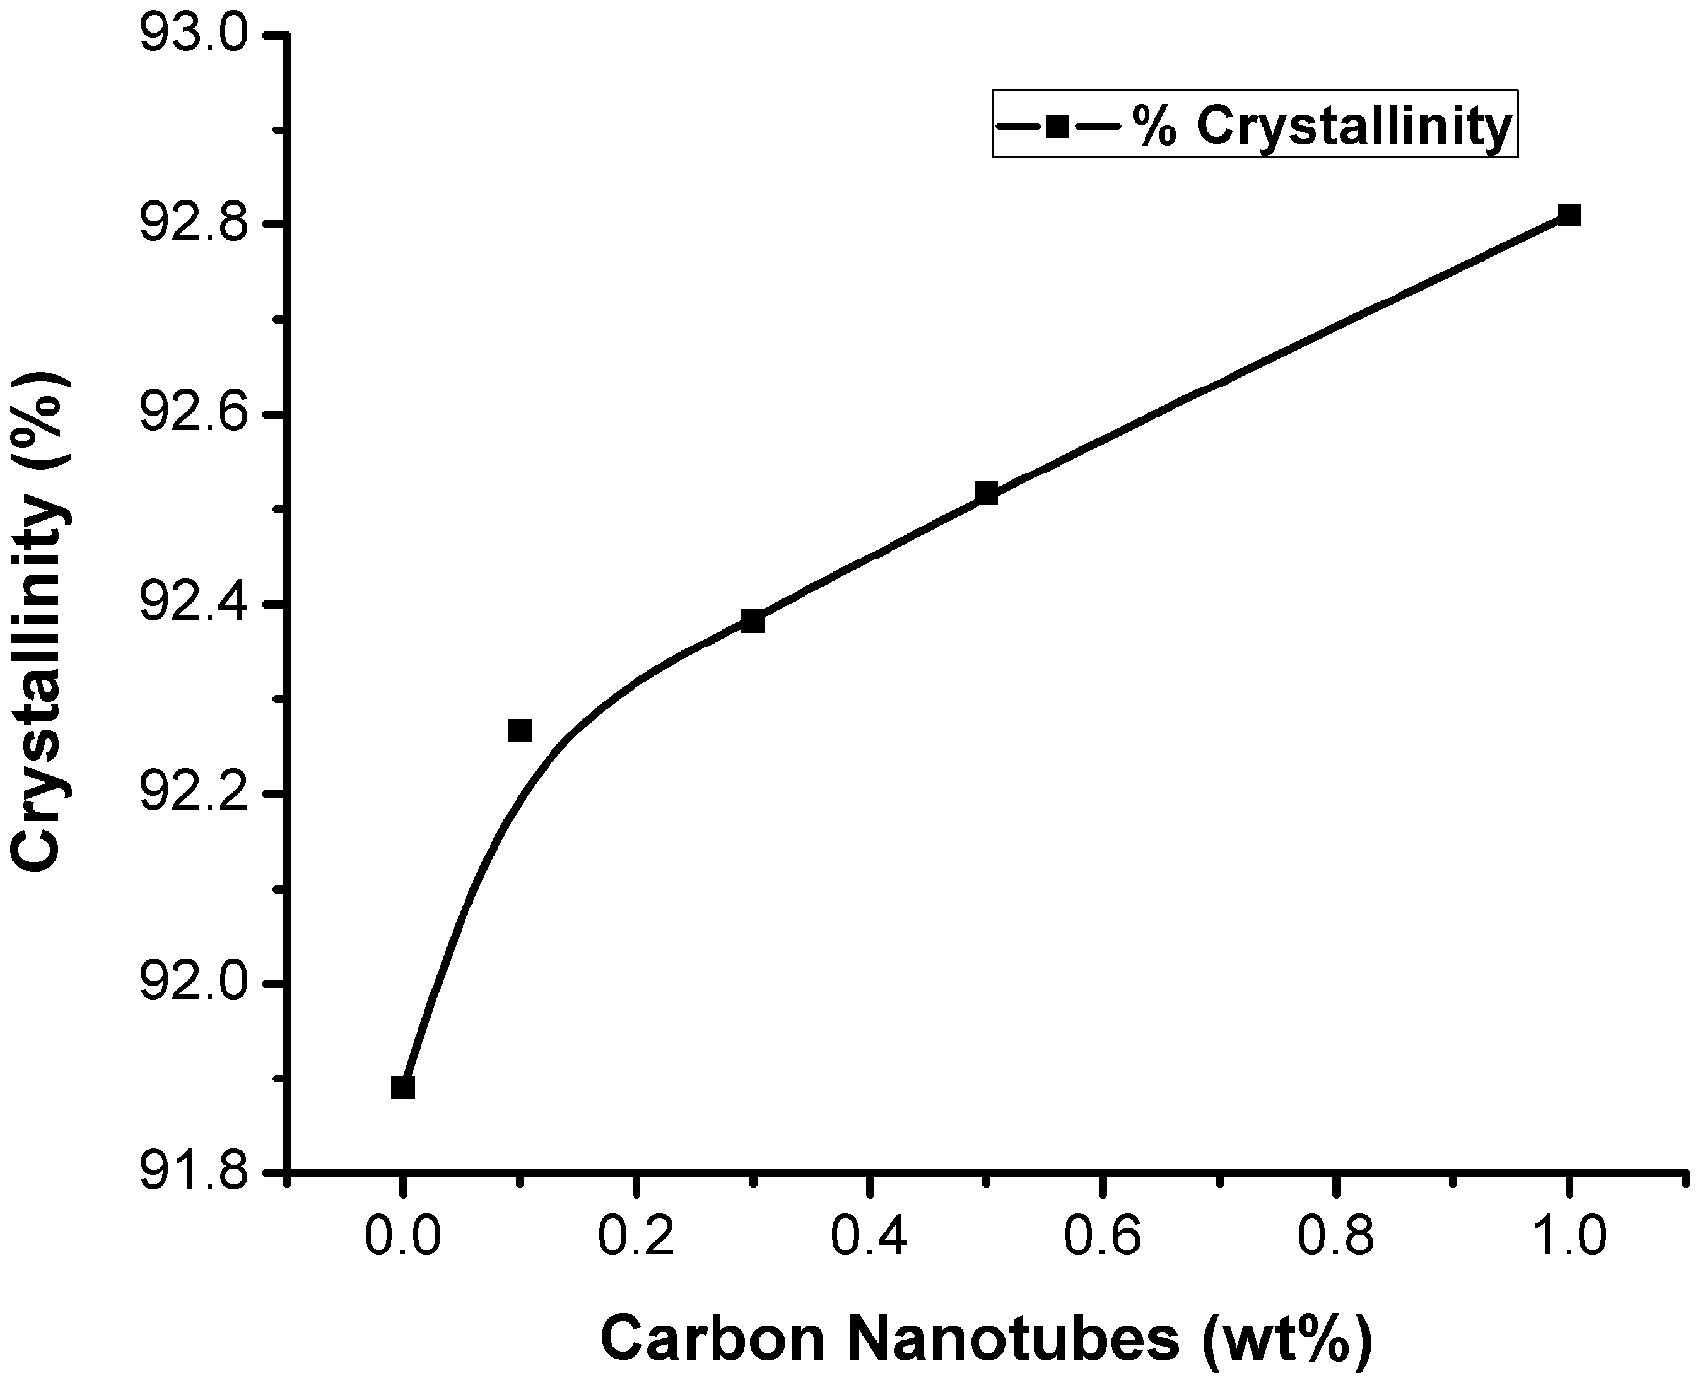
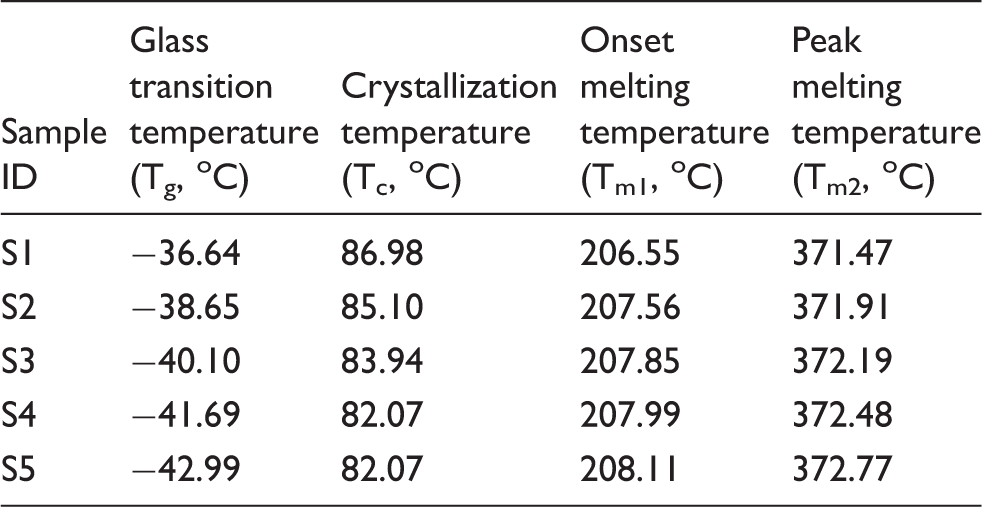
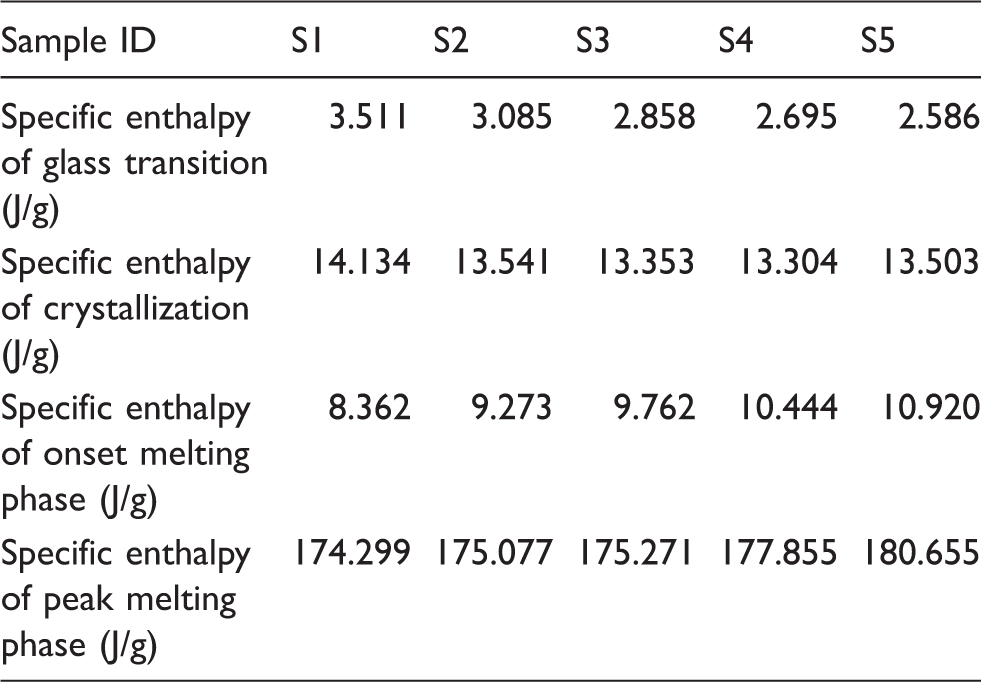
In order to analyze the effect of MWCNTs concentration on the glass transition temperature (Tg), crystallization temperature (Tc) and melting temperature (Tm) including their specific enthalpies, differential scanning calorimetric analysis was used in the temperature range −74℃ to 450℃. Figure 9 and the data in Table 3 show that Tg reduces up to 6.35℃, Tc diminishes up to 4.91℃, onset melting temperature (Tm1) and peak melting (Tm2) shift forward up to 1.44℃ and 1.30℃, respectively, with 1 wt% addition of MWCNTs in the S1 composition. The movement of Tg in the backward direction improves the rubbery behavior of S5 and makes the polymeric chain mobility possible even in more negative temperature. The reduction in Tc with increasing nanotubes concentration in the rubber matrix indicates that the crystallinity of the nanocomposite has been effected, which is clear from Figure 10, which elucidates an augmentation in percent crystallinity with increasing filler to matrix ratio. The advancement in the first and second melting points of the polymer composites is due to resistance offered by the MWCNTs to slower down the thermal chain mobility of the polymer matrix in the heating environment. Table 4 shows an effective reduction in specific enthalpies of glass transition/crystallization and improvement in specific enthalpies of onset and peak melting phases with the progressive incorporation of nanotubes in the base polymer composite due to high thermal stability, resistance to polymeric chain mobility and heat absorbing capability of the incorporated MWCNTs.31,32
DSC contours of MWCNT/ SBR composites. Percent crystallinity trend against increase wt% content of MWCNTs in SBR matrix. Glass transition, crystallization and first/second melting phase temperatures of rubber composites. Specific enthalpies of glass transition, crystallization and onset/peak melting phase of rubber composites.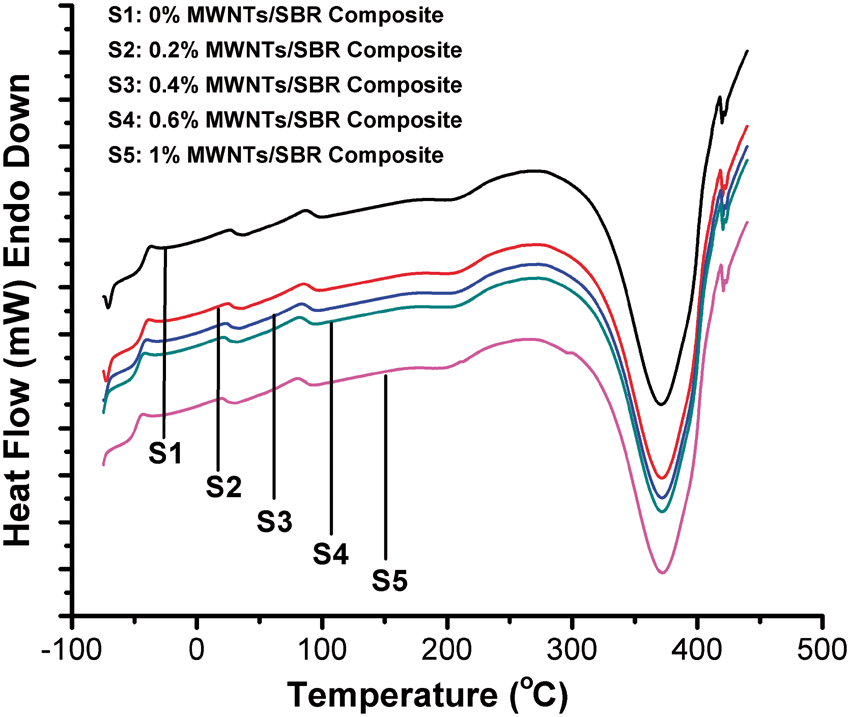
Conclusion
MWCNTs were dispersed in the SBR matrix using internal dispersion kneader and two roller mixing mill. SEM micrographs have elucidated the even distribution of nanotubes in the rubber matrix. A remarkable reduction (up to 79%) at 523 K is observed in the TC of the polymer nanocomposites with increasing filler concentration in the base composite (S1). TI of the composite specimens was augmented up to 390% at 523 K with the incorporation of 1 wt% MWCNTs in the rubber matrix. Thermal stability and heat absorbing capability of the nanocomposites have increased with increasing filler to matrix ratio. Tg and Tc of the polymer composites have decreased while Tm1 and Tm2 progressed with increasing nanotubes concentration in the polymer matrix. The 1 wt% addition of MWCNTs in the SBR matrix advances the specific enthalpy of melting of the nanocomposite up to 4% compared with the base composite formulation. The surface morphology analysis of the post-thermal transport tested composite specimens reveals the utmost surface protection for the maximum MWCNTs loaded rubber nanocomposite compared with other fabricated rubber composite counterparts.
Footnotes
Acknowledgement
The authors specially acknowledge Longman Mills, Lahore, for providing facilities for rubber mixing and fabricating polymer nanocomposites.