
Abstract
This paper reports a melt blend of poly(lactic acid)/liquid natural rubber with Cloisite C30B (C30B). The mechanical, thermal and morphological properties of poly(lactic acid)/liquid natural rubber and nanocomposites were investigated. Results indicate that Young’s modulus and flexural modulus increased with the addition of C30B to the poly(lactic acid)/liquid natural rubber blend. The elongation at break of poly(lactic acid)/liquid natural rubber increased significantly as compared to nanocomposite with 1% of C30B, i.e. from 37.3% to 62.4%. Nevertheless, the elongation at break and impact strength decreased gradually when nanoclay content increased above 3%, suggesting the addition of clay changed the strain response in the blend systems. The incorporation of nanoclay in the poly(lactic acid)/liquid natural rubber blends lowered the glass transition temperature values relative to poly(lactic acid). This behavior may be associated with more free volume available in the nanocomposite blend systems compared with pure poly(lactic acid). Morphological analyses by scanning electron microscope and transmission electron microscope revealed that different types of morphologies exist for poly(lactic acid)/liquid natural rubber and nanocomposites. This study indicates that poly(lactic acid)/liquid natural rubber-toughened nanocomposites with a higher modulus and that thermal stability could be produced.
Introduction
Poly(lactic acid) (PLA) is a well-known bioplastic made using renewable biomass. Due to its biodegradability and renewability as compared to the petroleum-based plastics, PLA is gaining attention in the marketplace. Moreover, PLA is an eco-friendly material that readily competes with traditional plastics in a broad range of applications. However, PLA is too brittle to be used in commercial applications and toughening is generally required. Some strategies used to toughen the brittle PLA include blending with plasticizers.1–4 and rubber5–9. One of the main problems with PLA toughening through plasticizers or rubber is the reduction in strength and modulus properties. In the PLA/rubber blend, for example, reduction in stiffness mainly occurs due to the low modulus of the rubber component itself.
Polymer nanocomposites for traditional polymers such as polypropylene, polyamide and polyethylene have long been reported in the literature. Typically, polymer nanocomposites based on layered silicate (such as montmorillonite or MMT) have been commonly used due to a high aspect ratio that enables performance improvements such as mechanical, thermal, fire retardant and gas barrier properties 10–16. In terms of processing, the nanolayers are not easily dispersed due to their preferred face-to-face stacking in agglomerated tactoids. Moreover, the dispersion of tactoids is further hindered by the incompatibility of hydrophilic layered silicates and hydrophobic plastics. Therefore modification of layered silicates enables production of a polymer-compatible clay. 17 Generally an organically modified clay is added to the plasticized or toughened PLA to form a biodegradable nanocomposite, as reported by previous researchers18–23.
Both natural rubber (NR) and the PLA are derived from renewable sources and are benign to the environment. Liquid natural rubber (LNR) is a low molecular weight version of NR which is used to toughen brittle polymers. Nanocomposites based on PLA/LNR blends are very attractive and offer many potential practical applications. This paper describes the mechanical, thermal and morphological properties of PLA/rubber-toughened nanocomposites.
Experimental
Materials
PLA Natureworks Ingeo™ Biopolymer 2002D (D-content 4.25%) grade (supplied by Unic Technology Ltd, China) thermoplastic resin was used in this study. It has a density of 1.24 g/cm 3 and melt flow index of 4–8 g/10 min (190℃/2.16 kg) and a melting temperature between 160℃ and 170℃. Natural rubber of the SMR L type with a density of 0.91 g/cm3 was produced by the Malaysia Rubber Board. LNR was synthesized using a photochemical oxidation technique on SMR L in our laboratory. A natural MMT modified with a quaternary ammonium salt (Cloisite C30B from Southern Clay Inc. USA) was also used. The Cloisite C30B is known for additive for plastics and rubbers to improve various physical properties such as reinforcement, synergistic flame retardant and barrier. Other chemicals were used as received.
Blend preparation and compounding
Sample designation and composition.
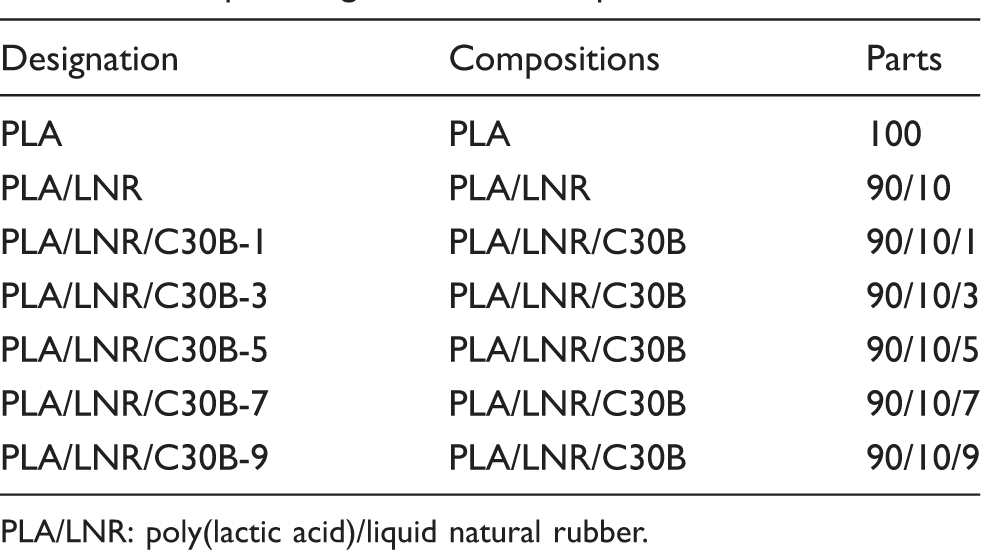
PLA/LNR: poly(lactic acid)/liquid natural rubber.
The clay was initially dispersed in the LNR by a mechanical stirrer for 10 min prior to the melt blending in the internal mixer. The rotor speed of the internal mixer was fixed at 50 r/min, and blending occurred for 15 min. The PLA was first melted for 3 min; subsequently, LNR containing dispersed clay was incorporated during another 60 s. The mixing of PLA/LNR in the mixing chamber was continued for another 11 min.
The blend was removed from the internal mixer and molded at 180℃ under 45 MPa of pressure for 13 min using a hot press. This produced a sheet measuring 150 mm wide × 125 mm long with 1 mm thickness.
Morphological analysis
The scanning electron microscopy (SEM) morphology characterization provides insight into: distribution of the rubbery impact modifiers in a polymer matrix; distribution of components in binary blends; the effect of interfacial addition on particle size; and the crystalline phase and dispersion/agglomeration of particles as well as particle size. SEM was performed on small pieces of the fractured specimens after the tensile test using a LEO 1450 VP Scanning Electron Microscope (LEO Electron Microscopy Ltd., UK). Prior to microscopic observation, the fractured surfaces were sputter-coated with a thin layer of gold.
The X-ray diffraction (XRD) analysis was carried out on Bruker D8 Diffractometer apparatus (Bruker Corporation, Germany) which was used to assess the dispersion of Cloisite 30B in the blends.
Stress–strain analysis
All compositions of blend were tested and compared in terms of their mechanical properties. Tensile test was carried out according to ASTM D638 using a Testometric M350-10CT tensile machine (from Testometric Company, Ltd., UK) under ambient conditions with crosshead speeds of 50 mm/min. The stress–strain properties values were taken from an average of five specimens.
Impact properties
The notched Izod impact testing was examined following ASTM 256 with the Ray-Ran Universal Impact tester (from Ray-Ran Test Equipment Ltd., UK). The rectangular specimen was prepared by compression molding with a thickness of 3 mm, width of 12.7 mm and length of 64 mm. Specimens were notched with a 2.54 mm depth at 60° angle on motorized Ray–Ran cutter prior to testing. Impact tests were carried out at room temperature and impact energy was reported in kilojoule/square meter. The values are taken from an average of five specimens.
Flexural properties
Flexural test was carried out in accordance to ASTM D790 by a Testometric M350-10CT tensile machine under ambient conditions with a crosshead speed of 3 mm/min. Flexural stress, strain and flexural modulus were determined from an average of five specimens.
Thermal analysis
Crystallization behavior of blend components was demonstrated on compression molded specimens. Differential scanning calorimetric (DSC) measurements were taken under nitrogen atmosphere on samples of 5–8 mg using a Mettler Toledo DSC 822 apparatus (from Mettler Toledo (M) Sdn. Bhd). Samples were placed in standard aluminum pans with pierced lids. Samples were heated to 200℃ at a scan rate of 10℃/min. The glass transition, crystallization temperature and melting temperatures were determined. Polymer crystallinity was determined with DSC using the heat associated with melting (fusion) of the polymer. The degree of crystallinity (Xc) was calculated from the following equation:

Dynamic mechanical analysis
Dynamic mechanical properties of PLA/NR blends were examined using a dynamic mechanical analyzer, DMA Q800 (from TA Instruments, USA). A rectangular shape specimen with a width, thickness and height of 13 × 3 × 56 mm, respectively, was used. Measurement was performed with three-point bending mode between −100℃ and 150℃, with a constant strain of 0.02% of heating rate of 5℃/min, using liquid nitrogen as a cryogenic medium and controlled by the flow nitrogen gas of 20 mL/min. Constant frequency of 1 Hz was examined with dynamic controlling. Storage modulus (E′) and tan delta (tan δ) were recorded as functions of temperature.
Thermal degradation
Thermogravimetric analysis (TGA) is a technique that measures mass and the change of mass of the sample during heating as a function of time and/or temperature. Decomposition of mass may be due to chemical reactions or physical changes during heating. The evaluation of thermal stability of PLA and blends was carried out using a Mettler Toledo TGA/SDTA 851 apparatus (from Mettler Toledo (M) Sdn. Bhd). Samples (12 ± 0.2 mg) were placed in alumina crucibles. An empty alumina crucible was used as reference. Samples were heated from ambient temperature, i.e. 25–600℃ at a scanning rate of 20℃/min under nitrogen. The sample temperature, sample weight, its derivative and heat flow were recorded.
Results and discussion
Mixing torque development
The results of mixing torque with PLA/LNR nanocomposites are given in Figure 1. The results show that torque increased sharply but decreased immediately with mixing time. This was attributed to the high viscosity of PLA at the beginning of the mixing but dropped after 1 min of mixing time. The torque dropped further after the addition of LNR/Cloisite C30B for 1%, 3% and 5% of clay loadings as shown in Figure 1. However, the torque subsequently increased again as a function of clay loadings. In general, the concentration of nanoclay in the PLA/LNR blends has shown a little effect on the mixing torque.
Representative torque values are plotted as a function of mixing time for (a) 1% (b) 3% and (c) 5% C30B blends.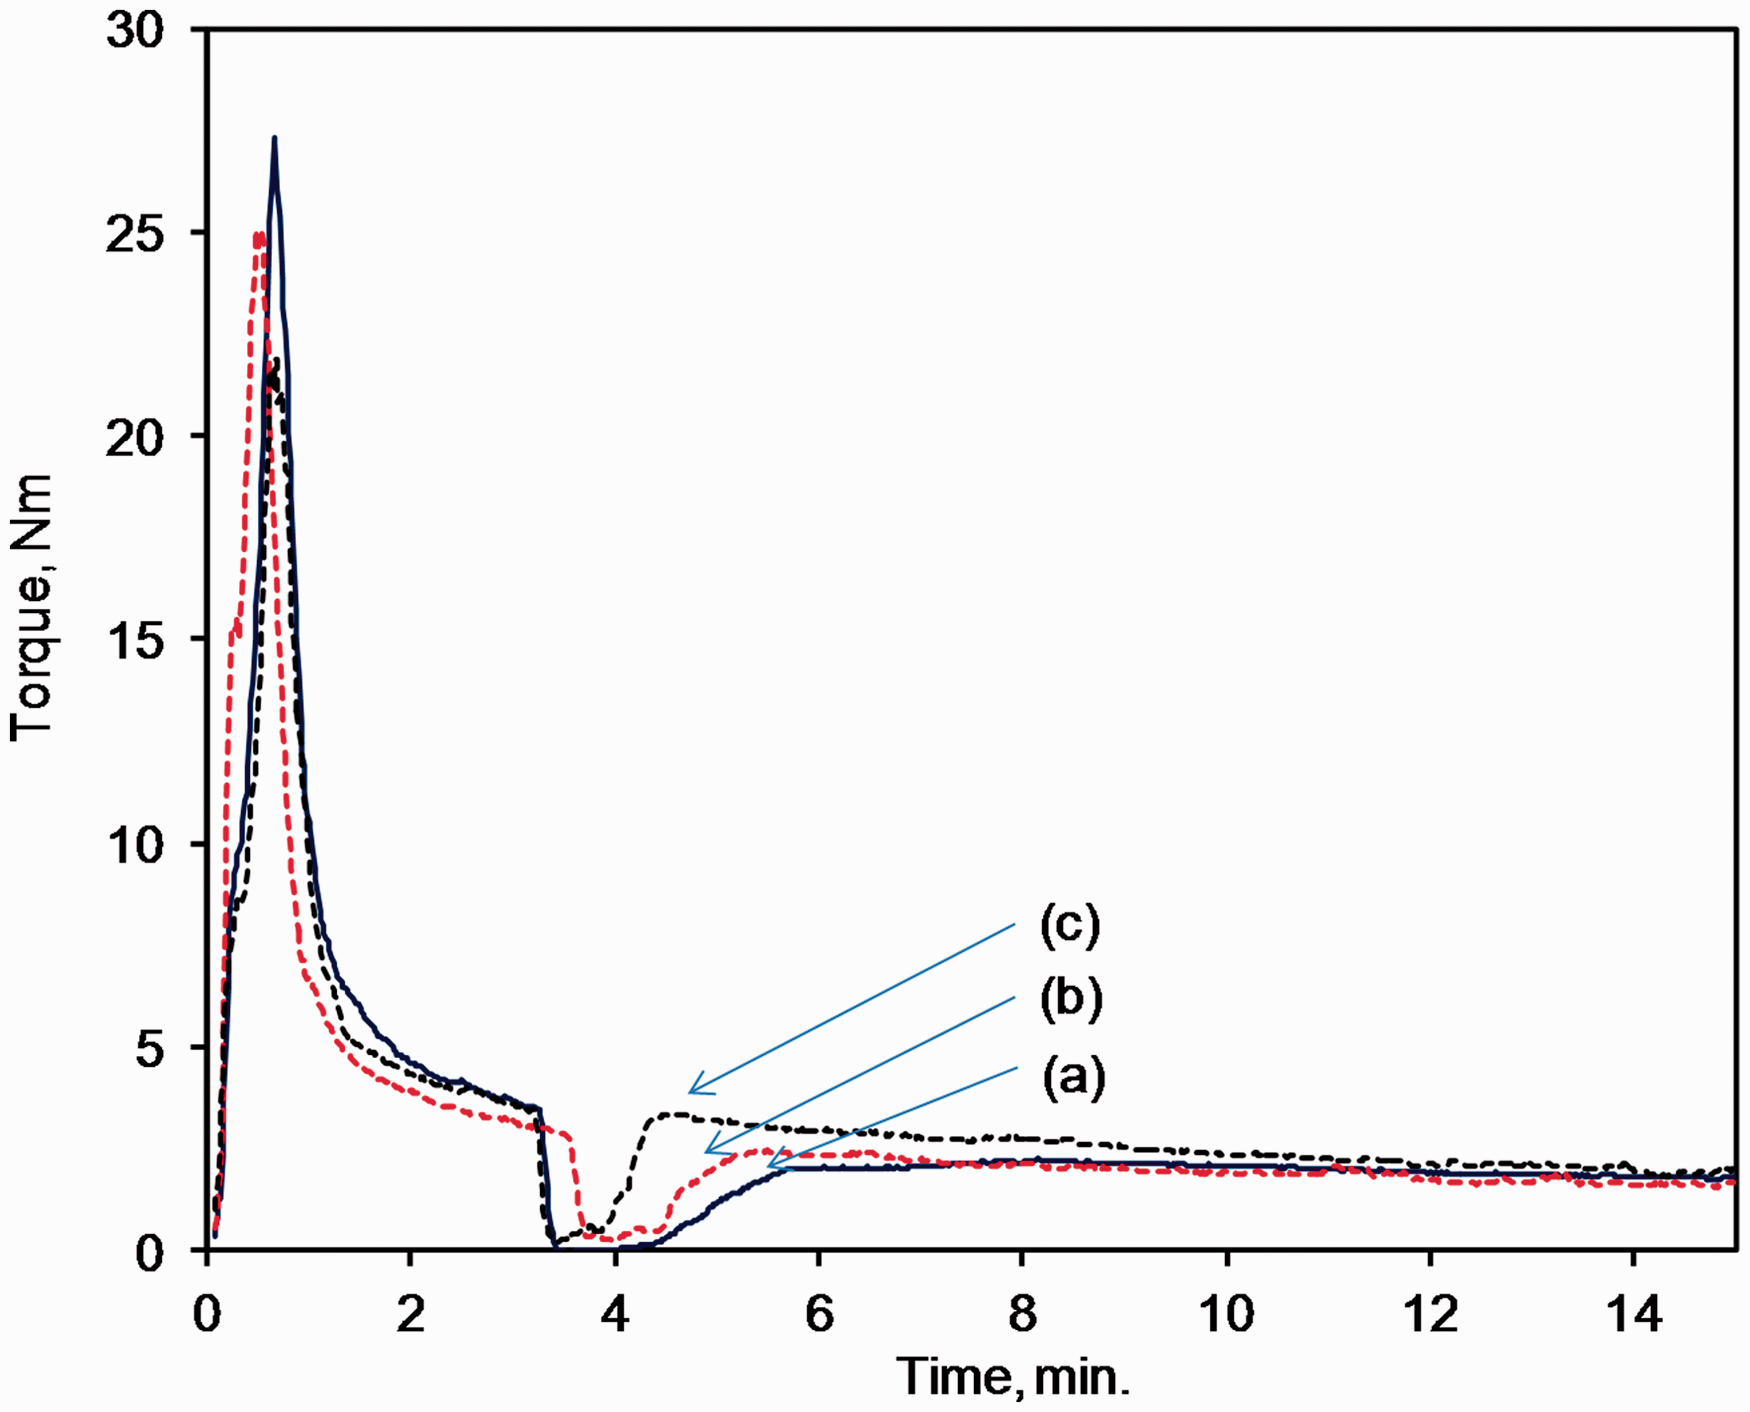
XRD and transmission electron microscopy analysis
The apparatus used in assessing the dispersion of C30B were XRD and transmission electron microscopy (TEM). The d-001 spacing corresponds to the interlayer spacing of the clay, for example, 18.5 Å for C30B. This gives an indication of the blend’s state of intercalation and exfoliation. Meanwhile, the TEM provides indication of dispersion of clay particles in the blend system through visualization.
The XRD diffractogram of pure C30B and PLA/LNR/C30B blends are shown in Figure 2. Observe that the C30B has a few peaks (only one peak shown) compared to the neat PLA and nanocomposite blends. The diffractogram of PLA/LNR filled with clay shows significantly different behavior; that is, the series of peaks found the pure C30B has disappeared. This suggests that the nanocomposite blend is in a state of exfoliation for a clay loading value of 1%, 3%, 5% and 7%. However, as the clay loading increased to 9%, two peaks appeared at diffraction angle 2θ = 5.12° and 6.68°, respectively. It is worth noting that the appearance of these two peaks in the 9% clay loading indicates that there is still an ordered structure retained after melt mixing. A similar observation was also reported by Sinha Ray et al.
28
for their PLA/MMT nanocomposite. They reported that as clay content increased to 7% the peaks of 2θ = 2.89° and 2θ = 5.7° became stronger and shifted toward to higher diffraction angle at 2θ = 3.16° and 2θ = 5.75°, respectively.
28
In another study by Zaidi et al.,
29
it was reported that the PLA-based nanocomposites containing 1, 3 and 5 wt% of organoclay exhibited no significant diffraction peak in the region of 2θ = 2–8°, suggesting that the structure was predominately exfoliated. Furthermore, they suggested that the exfoliated structure could be due to a more heterogeneous structure of the nanocomposite; this is due to the difficulty of obtaining a homogeneous material when the nanofiller content is high.
30
XRD diffractograms of (a) neat C30B (b) PLA/LNR (c) PLA/LNR/C30B-1 (d) PLA/LNR/C30B-3 (e) PLA/LNR/C30B-5 (f) PLA/LNR/C30B-7 and (g) PLA/LNR/C30B-9.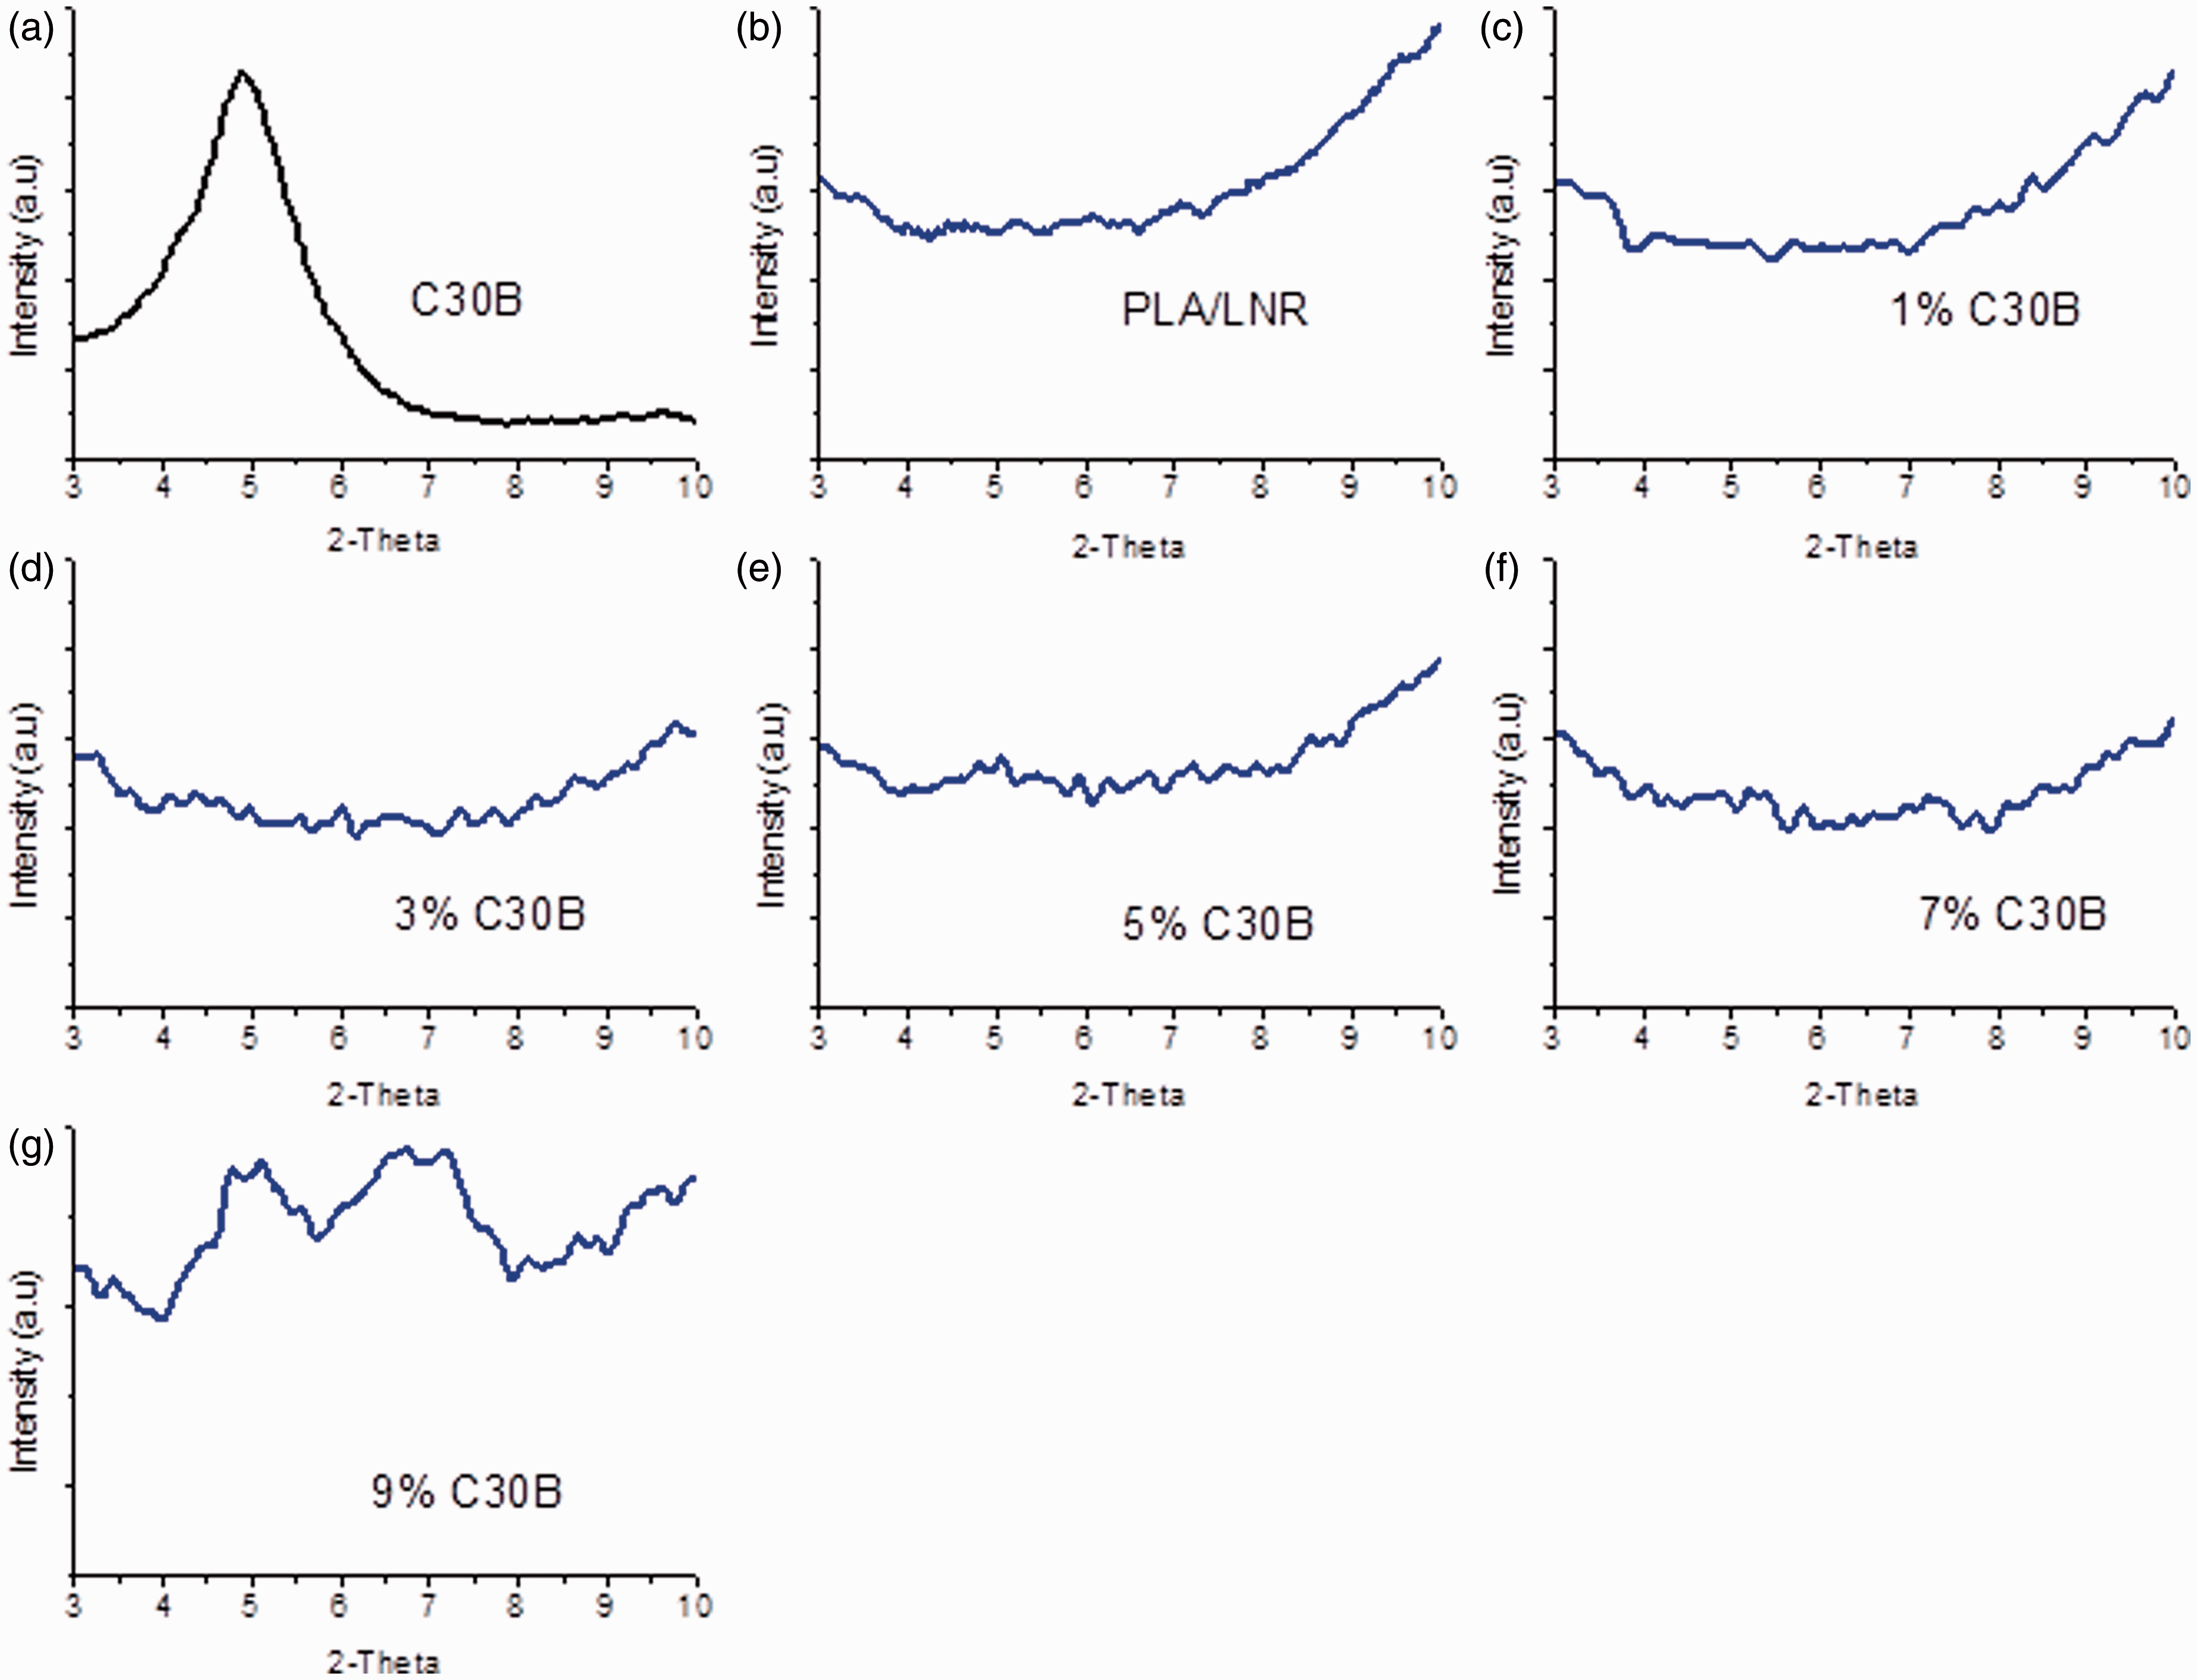
Figure 3(a) and (b) shows the TEM micrographs of PLA and its nanocomposites. It was observed from the figure that the C30B nanoclay was dispersed in the PLA/LNR matrix. When the C30B concentration was at 1% the layers of nanoclays were separated and elongated. However, a different structure with some isolated particles was observed at 3% of C30B as illustrated in Figure 3(b).
TEM images for (a) PLA/LNR/C30B-1 and (b) PLA/LNR/C30B-3.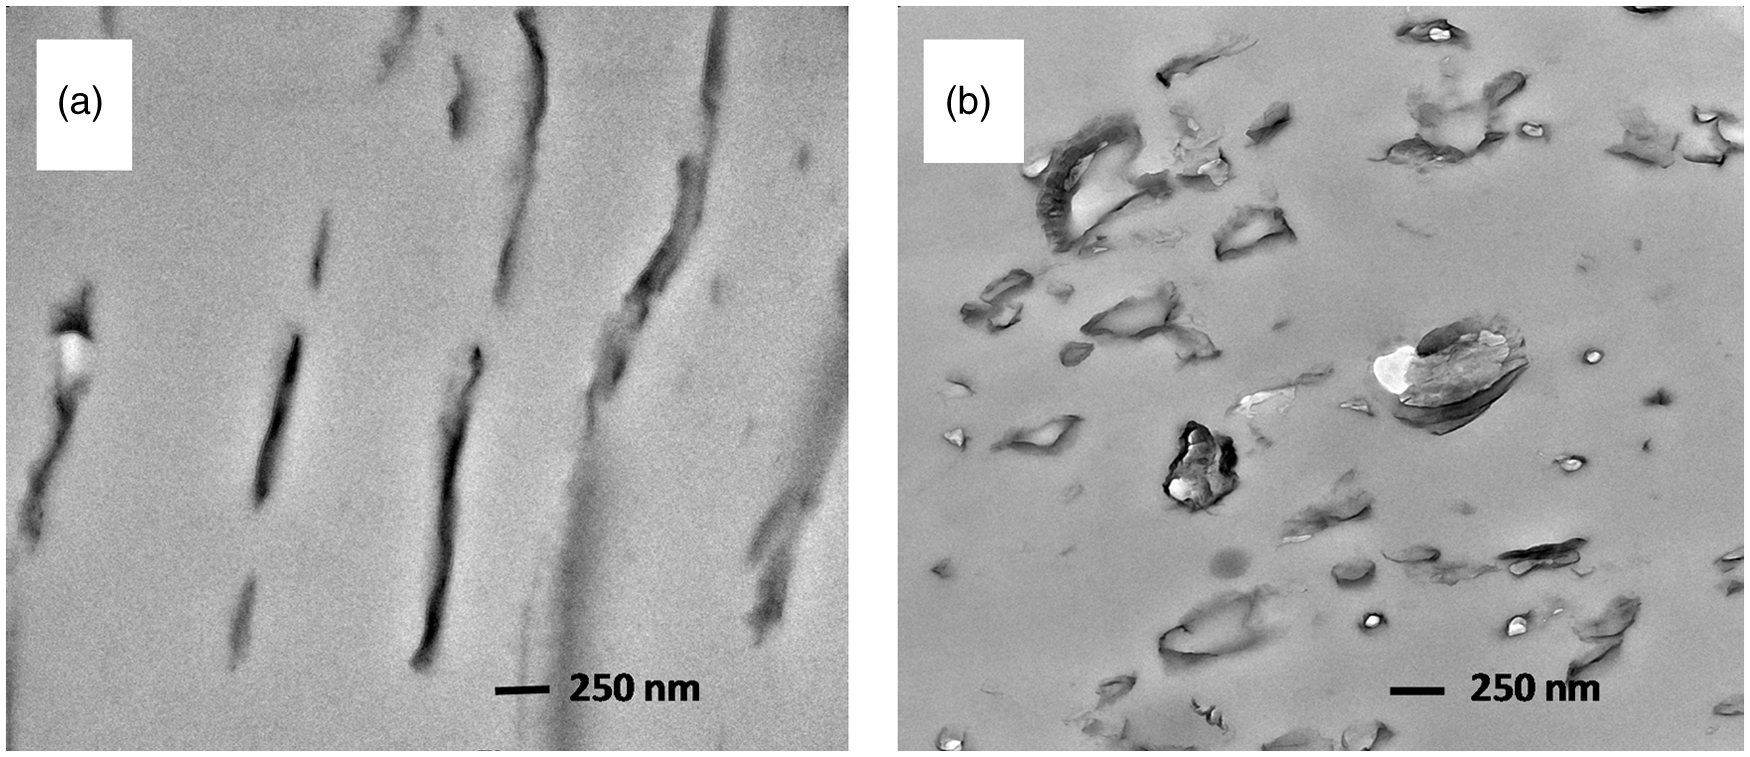
Mechanical properties
The stress–strain properties of the PLA and PLA/LNR nanocomposite blends with different ratios of C30B are shown in Table 2. It is well known that nanocomposites display increase in properties such as strength and modulus. As such, tensile properties are expected to increase if the nanoclay is well dispersed in the polymer matrix. It was found that the tensile strength showed the highest value at 1% of C30B loading. Beyond this concentration, we noted that the tensile strength values steadily decreases. Figure 4(a) to (e) shows SEM micrographs of tensile-fractured specimen for the PLA, PLA/LNR and nanocomposites with 1%, 3% and 5% nanoclay loadings correspondingly.
SEM micrographs of tensile-fractured specimen for (a) PLA (b) PLA/LNR (c) PLA/LNR/C30B-1 and (d) PLA/LNR/C30B-3 (e) PLA/LNR/C30B-5. Mechanical properties of PLA and PLA/LNR nanocomposites. PLA/LNR: poly(lactic acid)/liquid natural rubber.
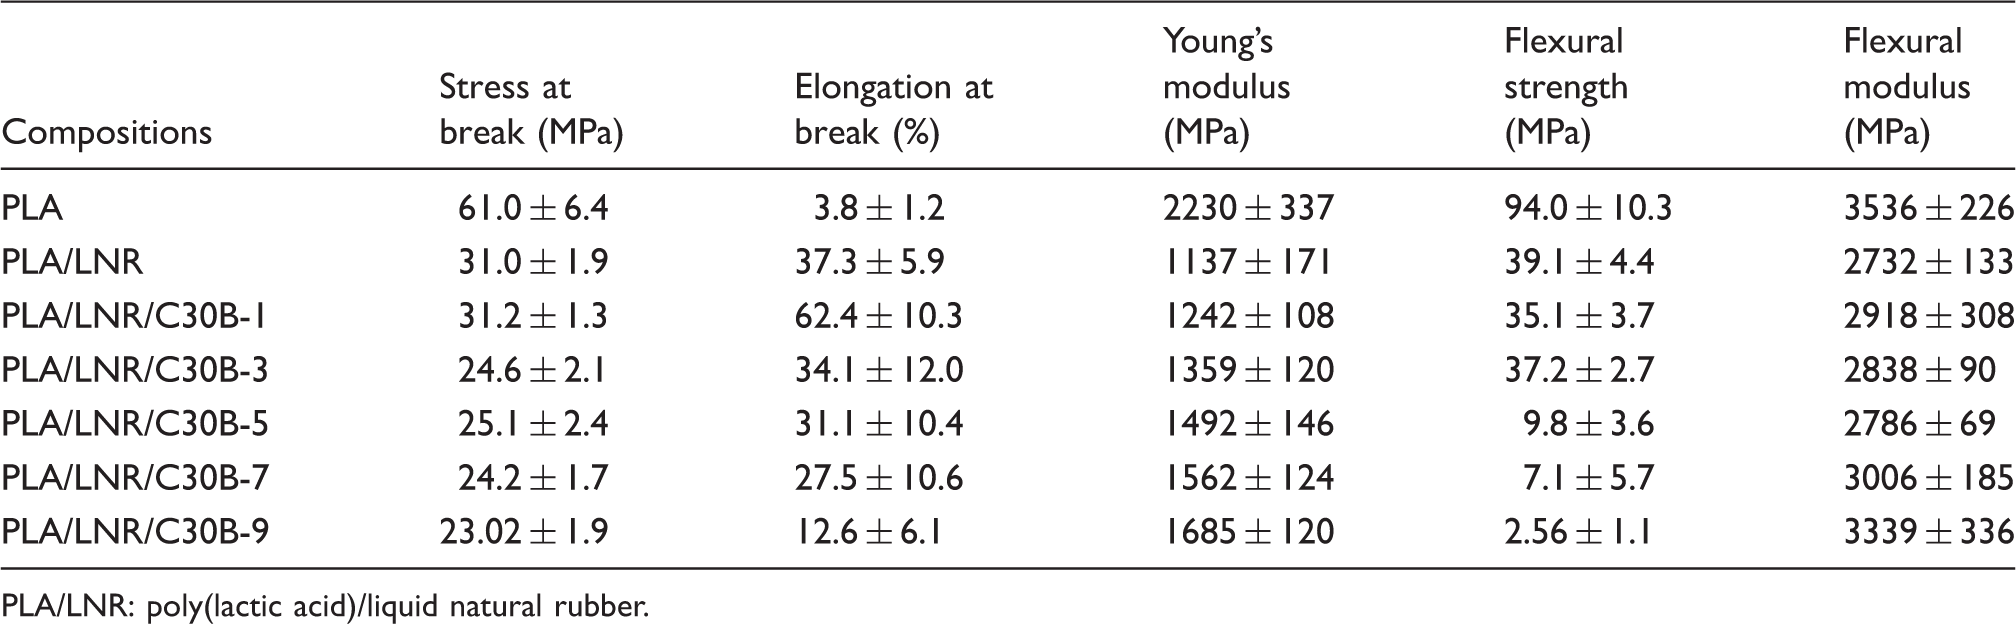
The effect of nanoclay in the PLA/LNR blends on elongation at break is given in Table 2. It is evident that the addition of nanoclay increased the elongation at break of 37.3–62.4% for unfilled and 1% of C30B, respectively. This is probably attributed to the alignment of nanoparticle upon applying stress when the 1% of nanoclay was loaded in the system. As a result, the alignment of nanoparticle acts as stress homogenizers allowing slippage and redistribution of stress among polymer chains. This phenomenon was believed to hinder the growing of cracks. 20 Nevertheless, elongation at break decreases gradually when the clay concentration was increased above 3%. This suggests that the addition of clay changed the strain response in both unfilled and filled blend systems.
Young’s modulus of all nanocomposites shows an increasing trend for all compositions as shown in Table 2. Young’s modulus increased gradually with the concentration of C30B; this agrees with dynamic mechanical analysis (DMA) results, which will be discussed in the next section. The increase in Young’s modulus can also be explained due to hydrogen formed between the functional groups present on the surface of C30B with carbonyl groups of the PLA segment. Previous studies have also shown similar observations.20,31 This phenomenon may be due to the dispersion of nanoclay in the PLA matrix. This finding is not surprising as the increase in modulus is associated with the higher aspect ratio of the silicate layers and large surface area; hence, layered silicates of organoclay act as a mechanical reinforcement of polymer chains. 32 Furthermore, the functional groups present on the surface of the C30B clay tend to form hydrogen-bonding with carbonyl groups of the PLA segments. According to Bitinis et al., 20 the hydrogen-bonding will result in an increase in Young’s modulus due to the strong affinity of the clay with the continuous phase. At higher C30B concentrations, the decrease in elongation at break can be explained by the embrittlement of the PLA matrix. 20
As expected the flexural modulus and flexural strength are much lower than that of neat PLA as illustrated in Table 2. Except for neat PLA, all PLA/LNR nanocomposites did not break under the same testing condition; suggesting an improved toughness was achieved. It can be seen that the flexural modulus increase steadily with concentration of C30B loading. The increase in flexural modulus is thought to be associated with the reinforcement effect by the rigid MMT platelets. The movement of PLA chain may have been suppressed by the MMT teething and gallery confinement. On the other hand, the flexural strength decreases with the loading of nanoclay. This reduction may be related to the MMT layer which acts as a local stress concentrator; hence initiated the failure as discussed by the previous authors. 19 It can be observed that the flexural modulus increases gradually by increasing the amount of C30B. The addition of 1% and 3% of C30B has increased the flexural modulus by 7% and 4%, respectively, as compared to the PLA/LNR blend system. Other researchers have reported similar findings on various PLA nanocomposites blends.19,31–33
In general, the effect of C30B on tensile and flexural modulus of PLA and PLA/LNR nanocomposites are summarized in Table 2. It is evident that the tensile strength and flexural strength decreased steadily with increasing concentration of C30B loadings. Interestingly, we observed almost no change in tensile strength value when the C30B was at 1% loading as compared to unfilled PLA/LNR blend. However, the tensile strength decreased significantly, i.e. at 21% when the loading was increased to 3%. The reduction in tensile and flexural strengths could be attributed by the aggregation of C30B particle in the polymer matrix; which promotes flaws in the system.
The effect of C30B on impact strength of PLA and PLA/LNR nanocomposites is illustrated in Figure 5. Figure 5 shows the impact strength increasing sharply from pure PLA (2.65 kJ/m2) to PLA/LNR (6.44 kJ/m2); when 10% of LNR was added as a toughening agent. The impact strength was further increased by only 1% of C30B concentration used. However, beyond 1% of C30B, the impact strength gradually decreases. It is worth noting that a remarkable increase in impact strength from 2.65 kJ/m2 to 8.88 kJ/m2 suggested that the clay platelet could have improved the toughness of the matrix by inducing shear yielding mechanism. Perhaps, this phenomenon can be explained due to the well-dispersed C30B at lower concentration, i.e. at 1% (Figure 2(c)). Nevertheless, when the loading of C30B increases, C30B clay tends to aggregate easily and intercalation of the polymer chain becomes difficult.
34
Another reason for this reduction in impact strength at higher concentration of C30B is the filler interaction, which promoted premature material failure prior to shear yielding as reported by Balakrishnan et al.
19
Impact strengths of PLA, PLA/LNR and nanocomposites.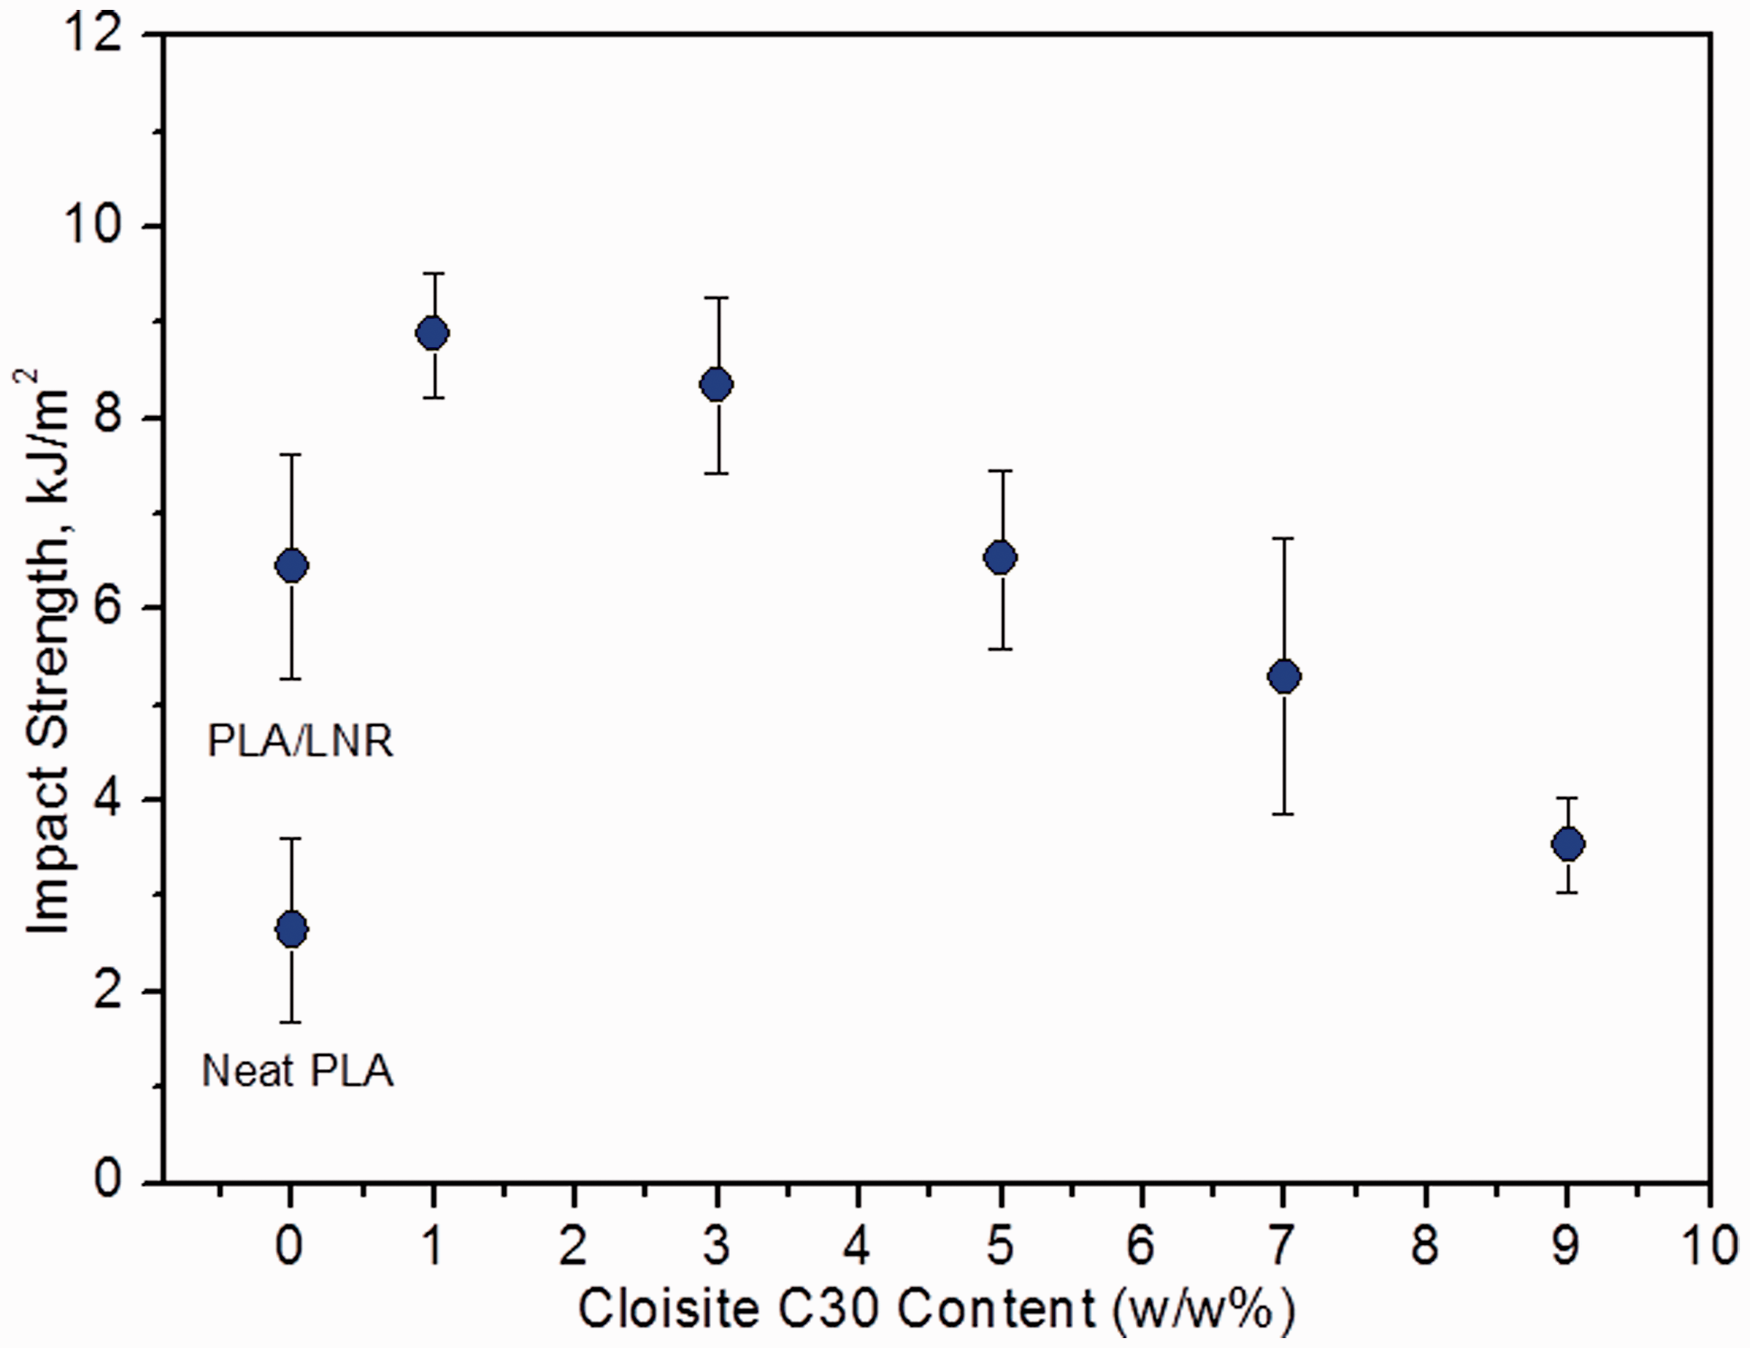
Figure 6(a) to (d) shows SEM micrographs of the impact-fractured specimens for PLA and PLA/LNR nanocomposites. The PLA fractured in the brittle manner; clean separation was observed as in Figure 6(a). However, the addition of C30B stabilized the morphology; this is evident in Figure 6(c) and (d). A high impact strength blend with 1% and 3% of C30B may be attributed by the stabilization of morphology in an immiscible polymer blends as reported by previous studies.35,36
SEM micrographs of impact-fractured specimen for (a) PLA (b) PLA/LNR (c) PLA/LNR/C30B-1 and (d) PLA/LNR/C30B-3.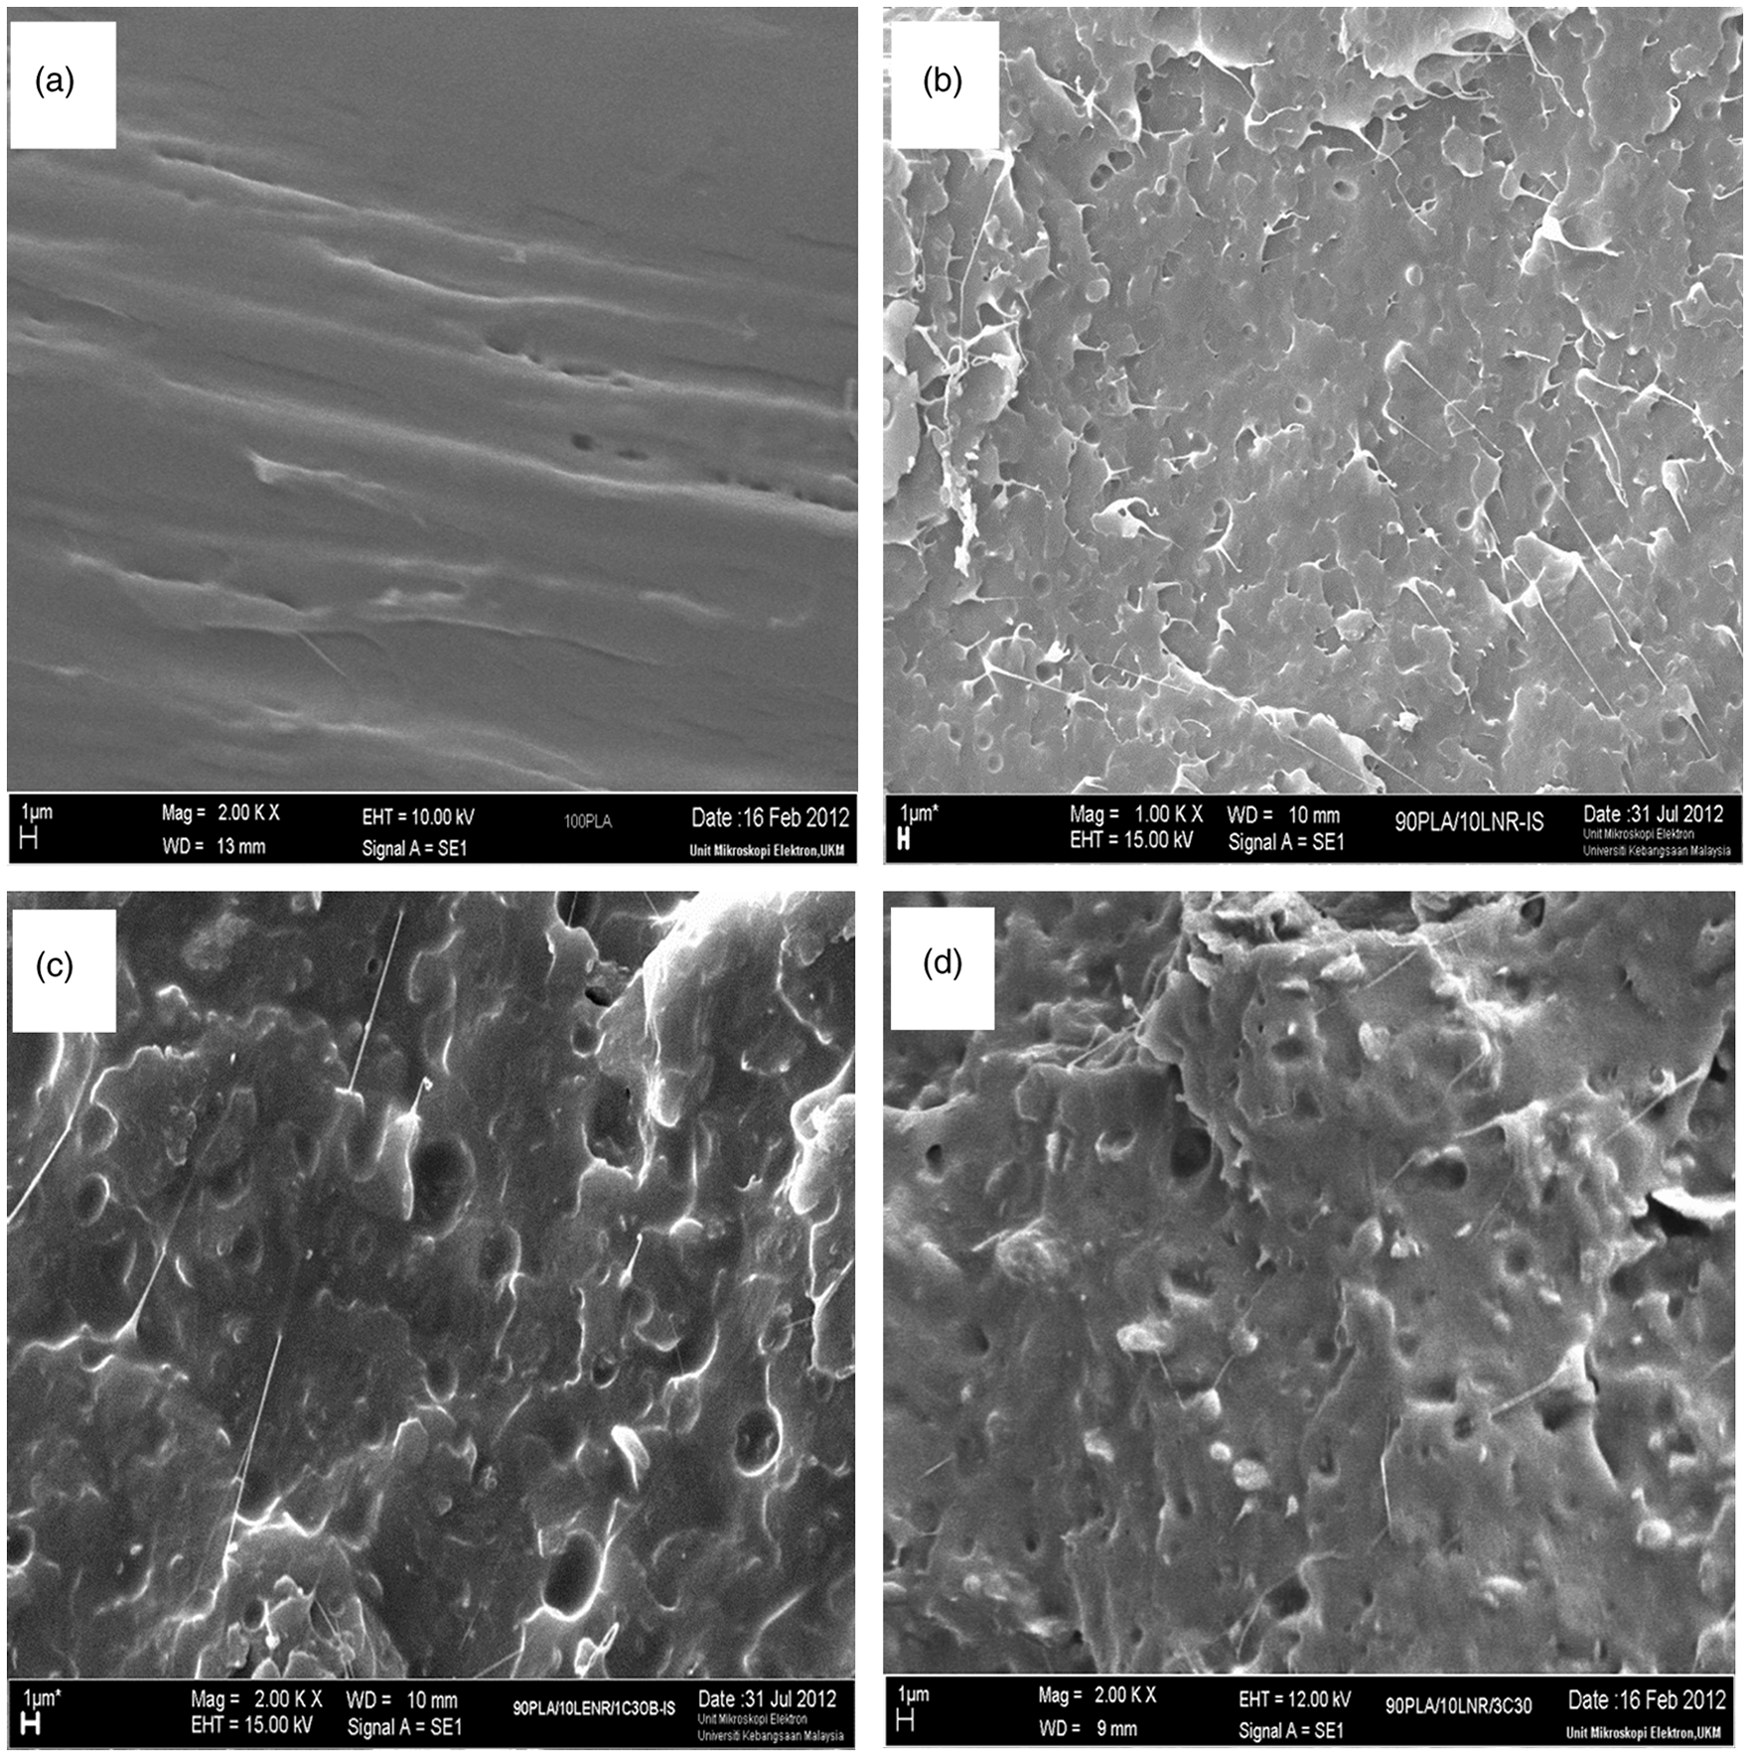
Thermal properties
DSC
The glass transition temperature, cold crystallization, melting temperature and percentage of crystallinity are given in Table 3. The cold crystallization peak of the neat PLA occurred at 86.3℃ as shown in Figure 7. It can be seen in Table 3 that Tc of PLA/LNR was shifted to lower temperatures with increasing loadings of C30B in the PLA/LNR nanocomposites. The reduction in Tc could be explained by the ability of clay particles act as an effective nucleation sites of PLA crystallization. This finding is consistent with the finding of Lee et al.
32
who reported that the crystallization temperature decreased by the incorporation of clay as compared to neat PLLA. According to Wu et al.,
37
the reduction in Tc with increasing MMT loadings suggested that the presence of MMT tactoids can promote initial crystallization of PLA matrix. Moreover, the incorporation of nanoclay in the blend leads to different state of melt dispersion; hence, the crystallization behavior of PLA could be influenced.
37
DSC thermograms of (a) PLA (b) PLA/LNR (c) PLA/LNR/C30B-1 (d) PLA/LNR/C30B-3 and (e) PLA/LNR/C30B-5. DSC data of the PLA, PLA/LNR and nanocomposite blends. DSC: differential scanning calorimetric; PLA/LNR: poly(lactic acid)/liquid natural rubber.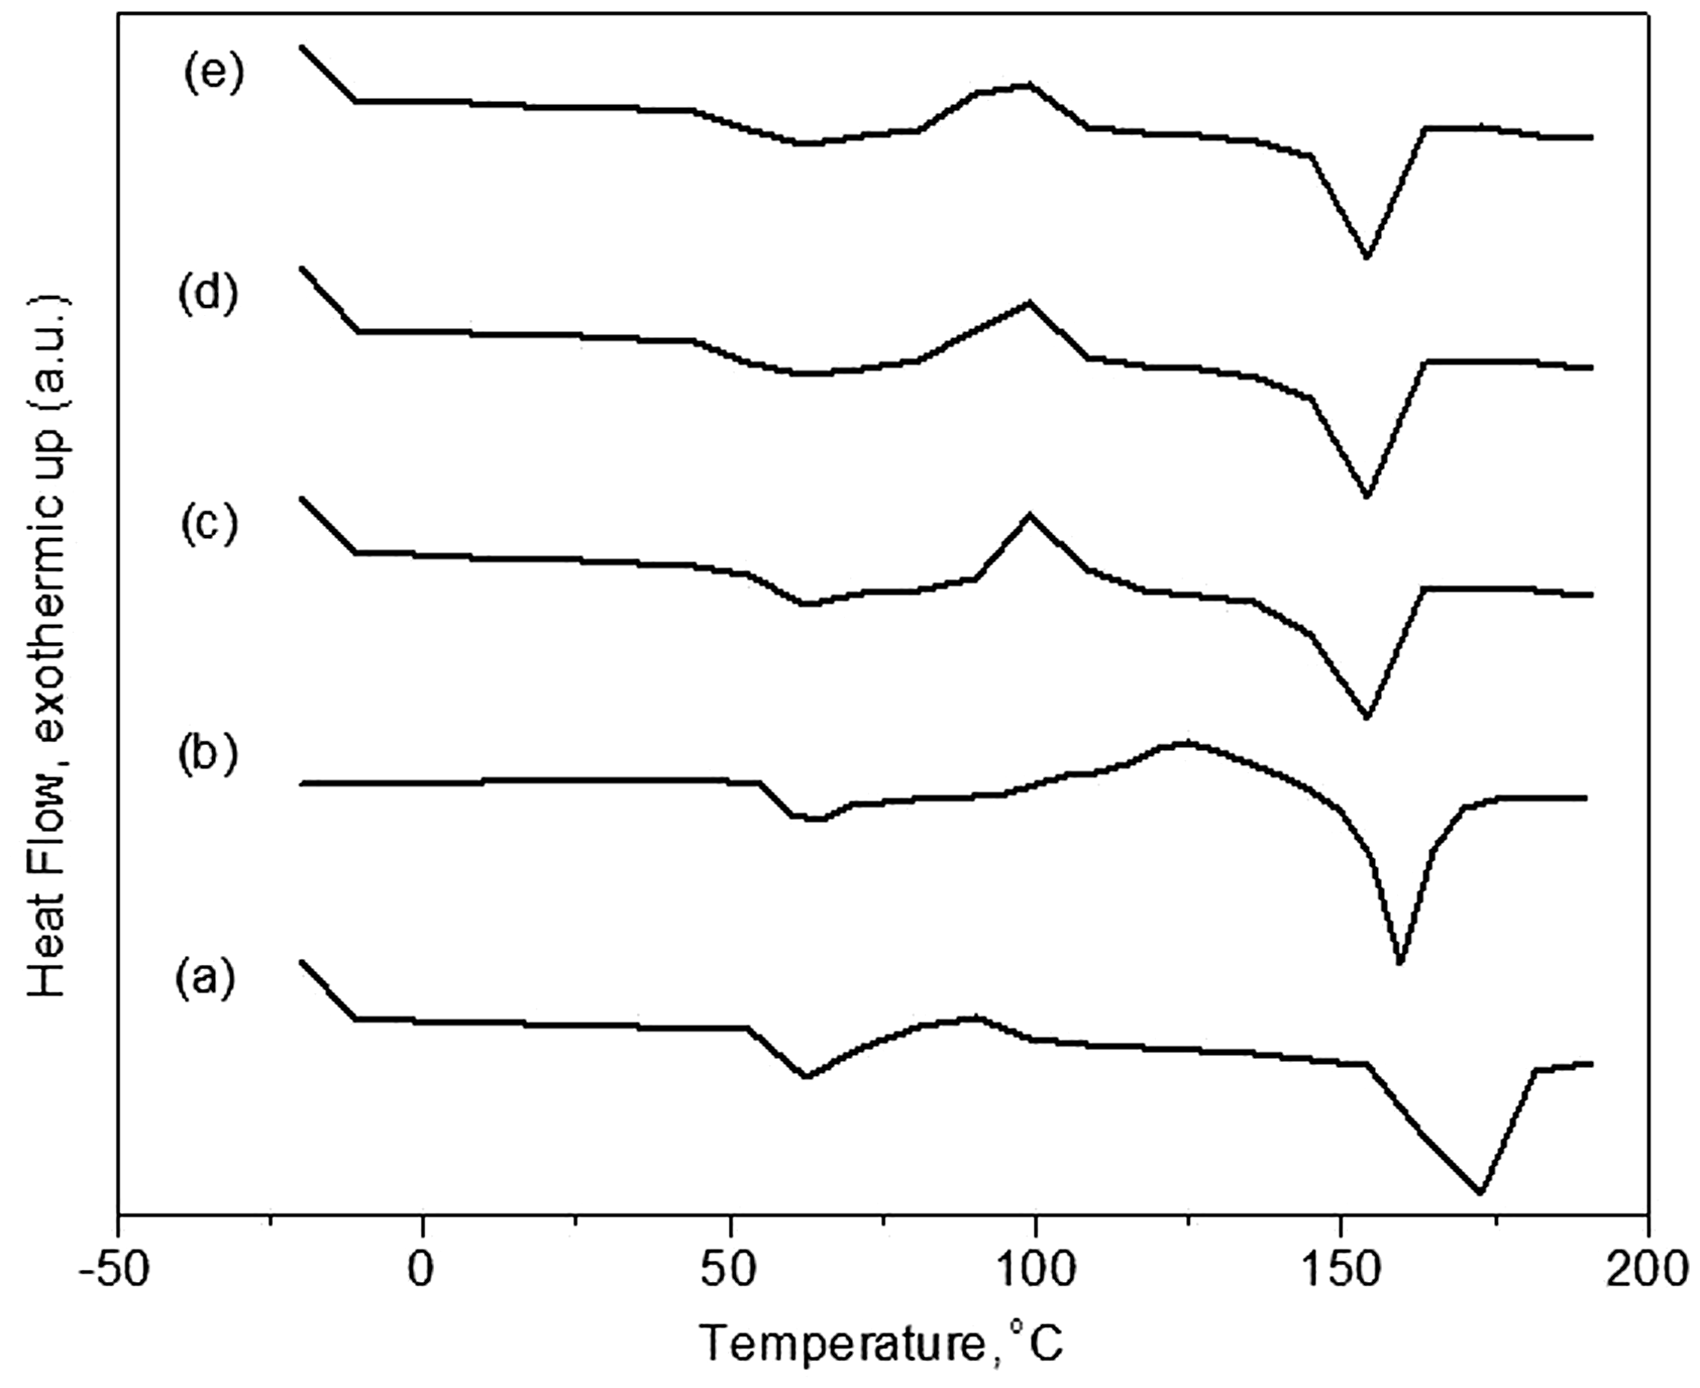
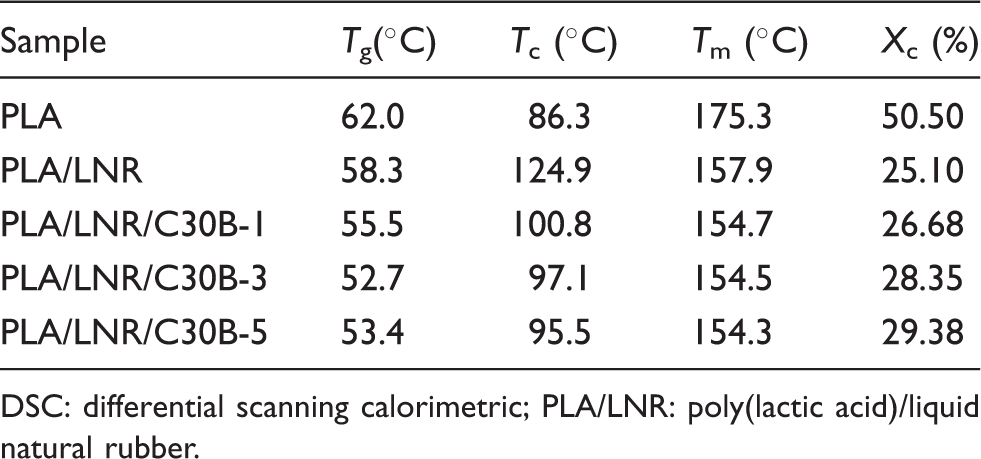
It was observed that the Tg of PLA/LNR was lower than that of neat PLA by about 3.7℃. The Tg was reduced further when 1% of nanoclay was added to the PLA/LNR blends. According to Gamez et al., 38 the reduction in Tg for the PLA nanocomposites could be related to the polymer chain in nanocomposites that have more free volume than in pure PLA; as a result of the molecular weight loss during processing. The degradation of PLA was also reported to be due to chain scissions. 39 The chain scissions generate smaller chains and has similar effect like plasticizer inside the material. As a result, the shorter chains have higher mobility and contribute to the free volume of the system.
It should be noted that the addition of nanoclay has not shown any effects to the melting temperature as given in Table 3. The Tm of PLA/LNR reduced ca 17.4℃ compared to neat PLA, which was reduced from 175.3℃ to 157.9℃. This observation is consistent with other studies on PLA/MMT which reported that the MMT filler content did not significantly influence the Tm of PLA.19,40 The degree of crystallinity was calculated from the enthalpy of melting transition. It was observed that PLA/LNR nanocomposite exhibits higher degree of crystallinity than that of neat PLA. Such behavior could be explained due to the fact that the presence of nanoclay acts a nucleating agent.
DMA
Figure 8 shows the storage modulus (E′), loss modulus (E′′) and tan δ of neat PLA matrix and PLA/LNR/C30B-3 nanocomposite over a temperature range of −100℃ to 150℃. The storage modulus E′ is the elastic component and is related to the sample stiffness. On the other hand, E′′ is the loss modulus and the viscous component and is related to the sample’s ability to dissipate mechanical energy through molecular motion. As expected the storage modulus reduced in the PLA/LNR blend system due to the low modulus of rubber. It can be clearly seen that the E′ of PLA/LNR/C30B-3 nanocomposite showed a much higher value as compared to the neat PLA as depicted in Figure 8(A), indicating that Cloisite C30B has a strong influence on the elastic properties of pure PLA. The E′ of neat PLA dropped abruptly due to its glass transition temperature (Tg), until it reaches a maximum value about 84℃. In the temperature range of 90–100℃, the PLA/LNR/C30B-3 exhibited increase in E′; an increase of 128% of storage modulus for 3% of C30B over neat PLA. This can be explained by the mechanistic reinforcement by clay particles at high temperature. Note that above Tg, the reinforcement of effect of clay particles becomes prominent due to the restricted movement of the polymer chains, thus contributing to the modulus enhancement. As for the neat PLA, above the Tg, it was noted that the E′ increased again to the maximum storage modulus value when the temperature was raised from 85℃ to 116℃.
Storage modulus, E′ (A), loss modulus E′′ (B) and tan δ (C) for (a) PLA (b) PLA/LNR and (c) PLA/LNR/C30B-3.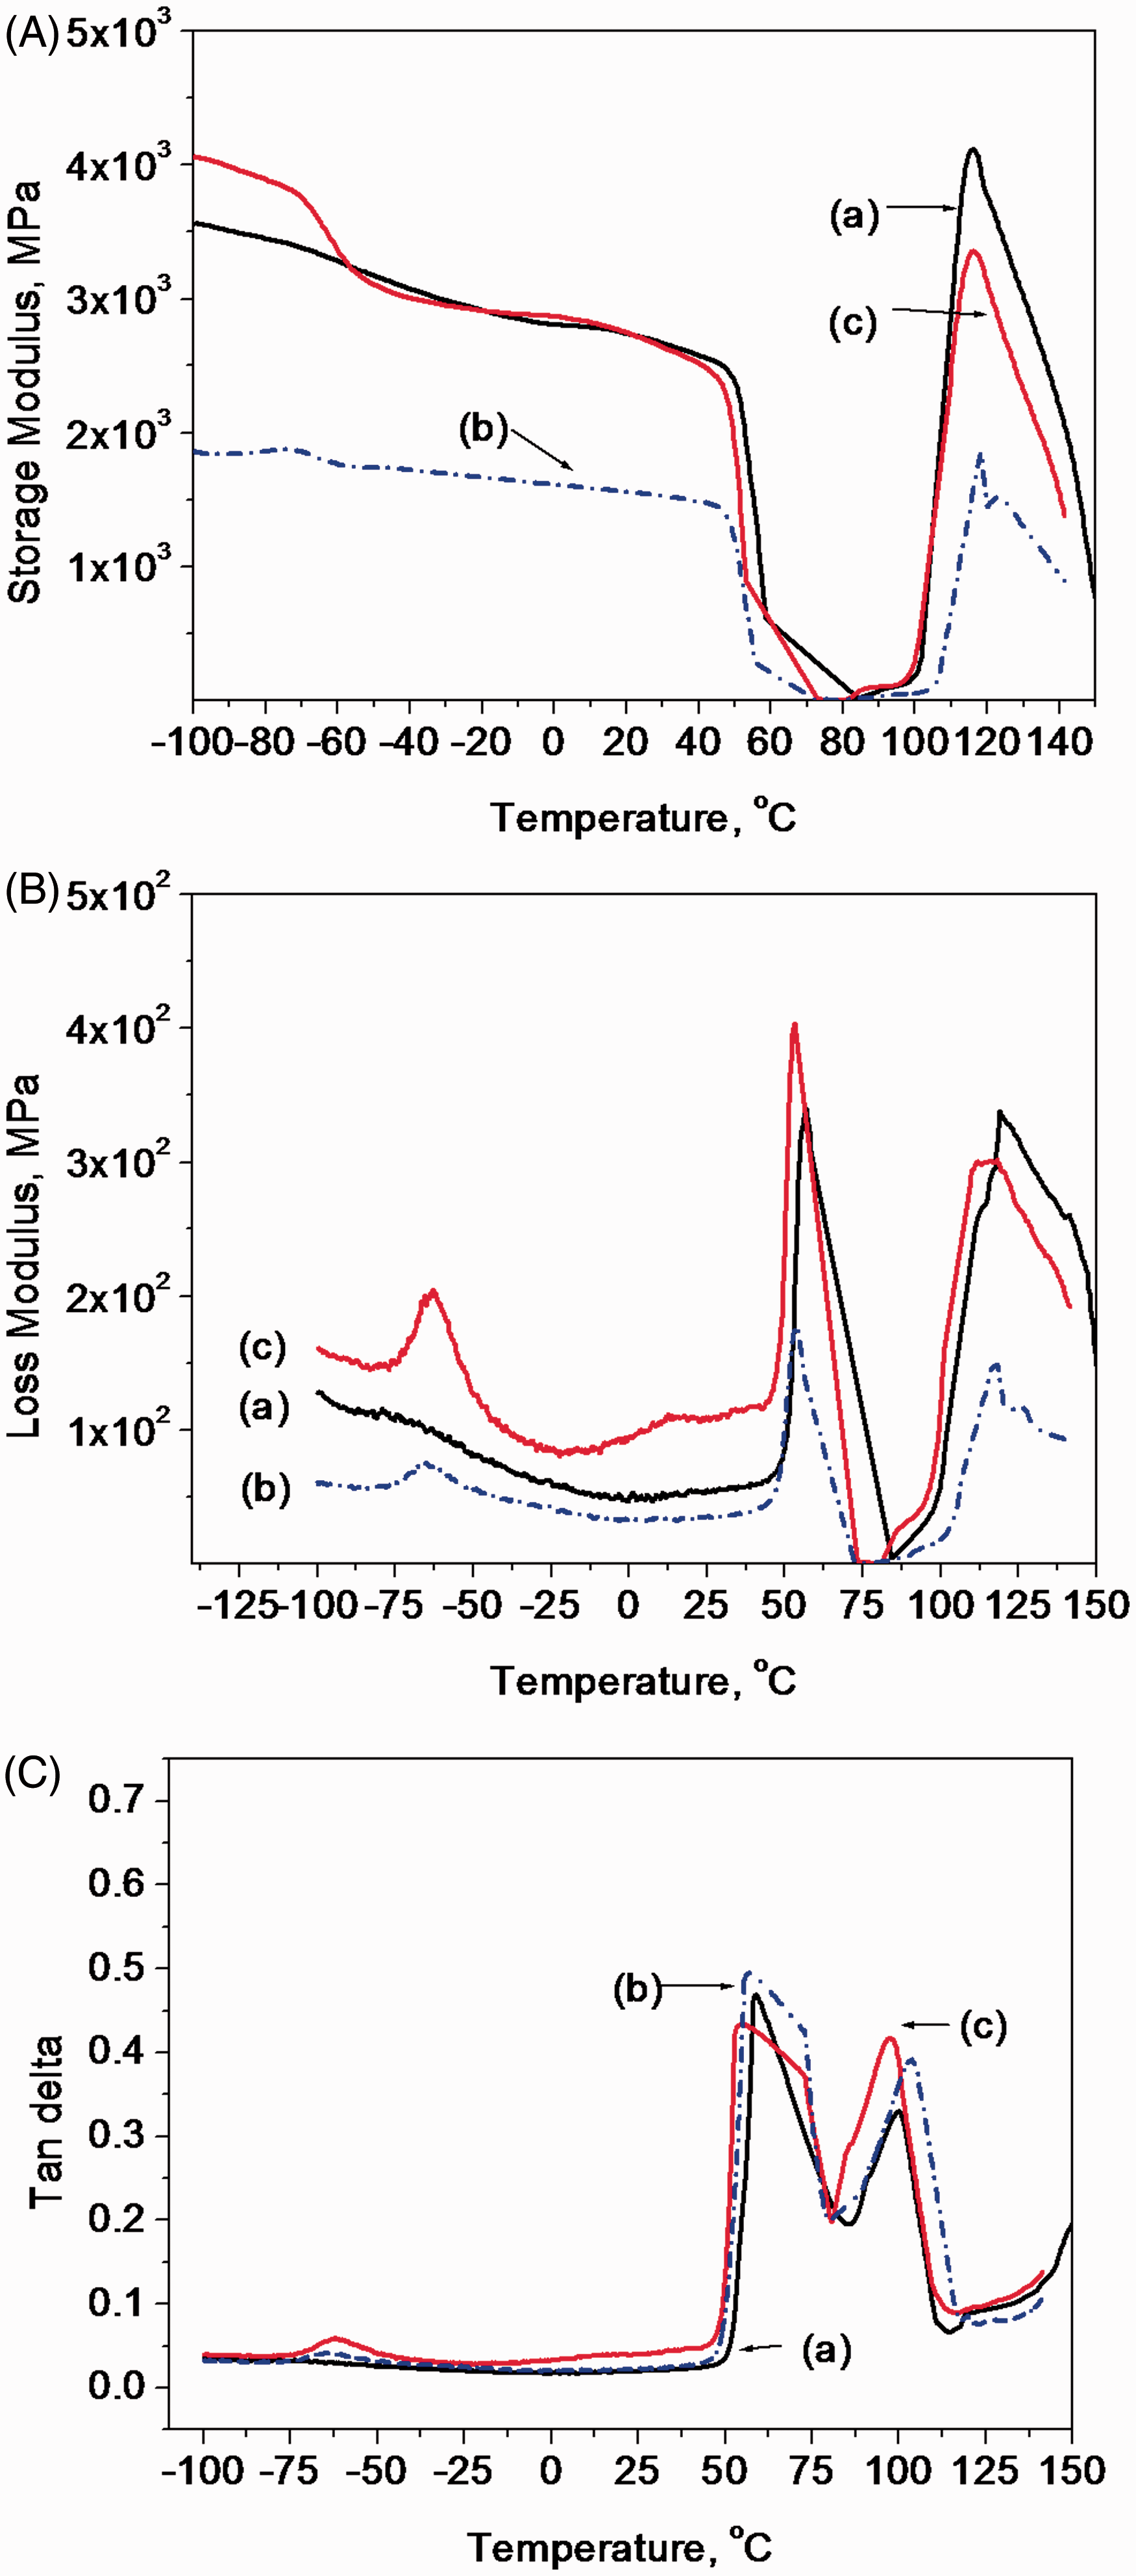
The tangent of phase difference, or tan δ, is another common parameter that provides information on the relationship between the elastic and inelastic components. The ratio of loss modulus E′′ and storage modulus E′ known as tan δ of PLA, PLA/LNR and PLA/LNR/C30B-3 is shown in Figure 8(C). It can be distinctly seen that there two Tg transition regions, i.e. NR and PLA components. This indicates that the blends of PLA/LNR and nanocomposite are immiscible. The Tg of PLA determined by the peak of tan δ was found to be 62.8℃; this value is comparable to the value determined by DSC. Similar decreasing trend of Tg values were also observed in the PLA/LNR and PLA/LNR/C30B-3 where the values reduced by 2.6℃ and 5.3℃, respectively. Therefore, these results are quite consistent with the Tg values determined by the DSC method as previously discussed.
TGA
TGA data of PLA, PLA/LNR and nanocomposites.
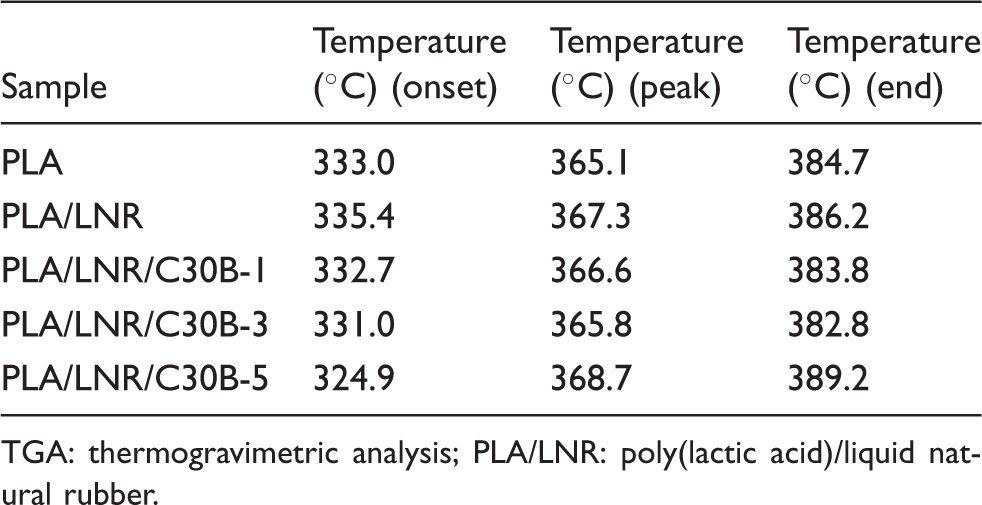
TGA: thermogravimetric analysis; PLA/LNR: poly(lactic acid)/liquid natural rubber.
In general, at lower concentrations of nanoclay (1% and 3% C30B), the onset degradation temperature shows a slightly lower value as compared to the neat PLA as given in Table 4. Nevertheless, the peak and end degradation temperatures of 5% C30B were found to be at 368.7℃ and 389.2℃, respectively. This result suggests that the beginning of degradation seems to be more sensitive by the introduction of lower nanoclay loadings as illustrated in Figure 9. According to Zaidi et al.,
29
the temperature at which 50% degradation occurs is less affected than the temperature corresponding to 10% degradation due to more time taken for the thermal decomposition to start in the presence of a few percent of organoclay. The clay exfoliation dominates at lower clay concentration; it is not sufficient to enhance the thermal stability of the nanocomposites.
29
On the other hand, a more exfoliated individual particle is found with higher filler content, resulting in an increase in thermal stability and achievement of critical concentration. It is interesting to note that Ahmed et al.
44
reported that an increase in thermal stability is achieved when the presence of higher filler loadings leads to more exfoliated individual particles. They further suggested that the critical concentration level varies between 3% and 6%; this phenomenon is associated with free volume, polymer–clay interaction, exfoliation and space available in the polymer matrix.
44
TGA curves for PLA, PLA/LNR and nanocomposites.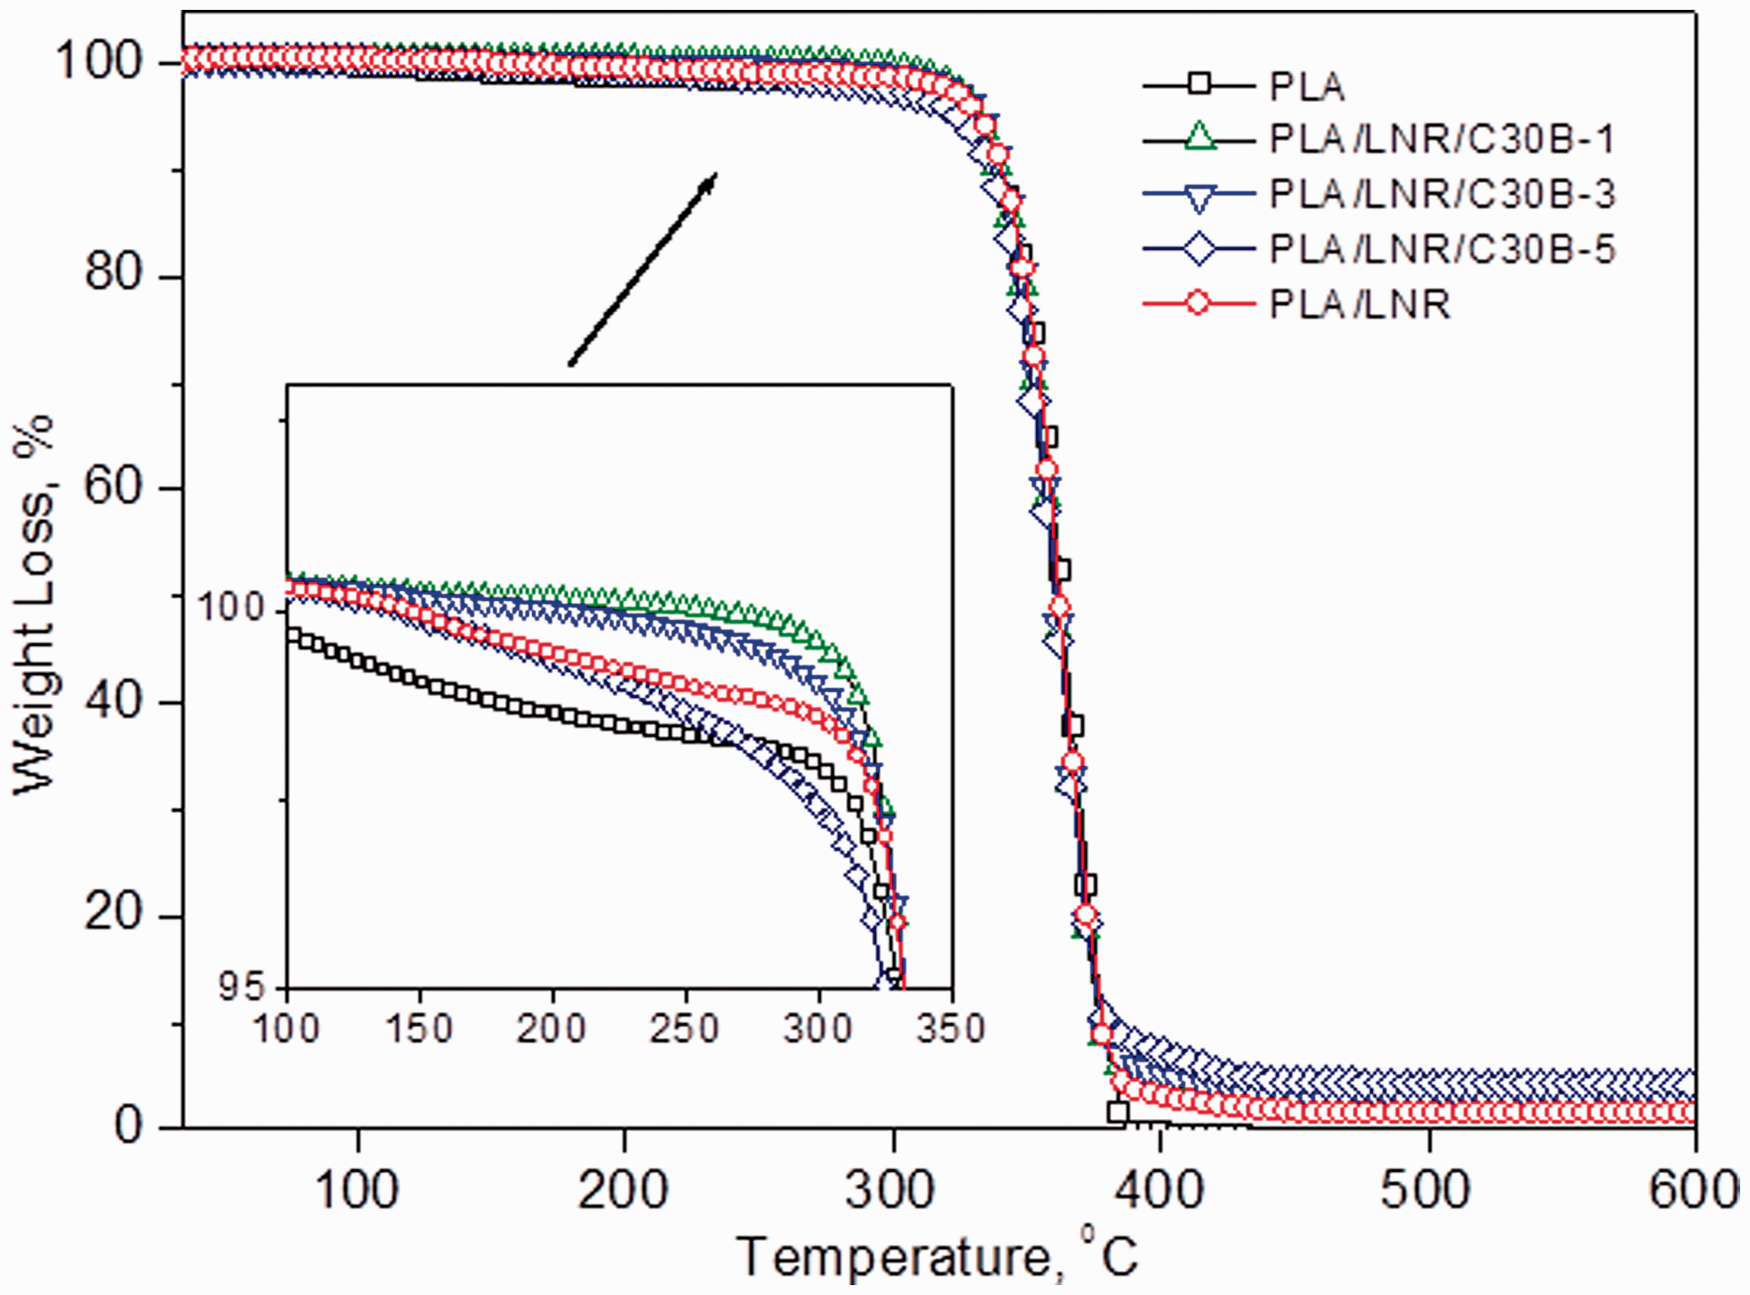
Conclusions
The mechanical, thermal and morphological properties of PLA/LNR and nanocomposites were studied. It was found that Young’s modulus and flexural modulus increased with the addition C30B in the PLA/LNR blend. The elongation at break of PLA/LNR increased significantly as compared to nanocomposite with 1% of C30B, i.e. from 37.3% to 62.4%. However, the elongation at break and impact strength decreased gradually when the clay was increased above 3%; suggesting the addition of clay has changed the strain response in the blend systems. The incorporation of nanoclay in PLA/LNR lowered the glass transition temperature values and this behavior could be related to the polymer chain in nanocomposites that have more free volume than in pure PLA, as a result of the molecular weight loss during processing. The DSC and DMA results suggested that the blend of PLA/LNR and C30B is immiscible.
Footnotes
Funding
The authors would like to thank Universiti Malaysia Pahang (UMP) and Universiti Kebangsaan Malaysia (UKM) for sponsoring this research project under FRGS grant (RDU100114).
Conflict of interest
None declared.