
Abstract
The effects of clay particle size distributions on their dispersion in poly(ethylene terephthalate) (PET)/clay nanocomposites have been studied. A two-step centrifugation method was used to remove large particles from commercial montmorillonite (MMT). Scanning electron microscopy of aqueous dispersions of MMT and centrifuged clay (CMMT) illustrated that average particle size of CMMT in water is much lower than that of MMT in water. PET/clay nanocomposites with MMT and CMMT were prepared by using a modified melt-blending method of mixing PET and a clay–water slurry instead of direct introduction of dried clay. Transmission electron microscopy and X-ray diffraction results showed that CMMT with their smaller particles have better dispersion into the polymer matrix than uncentrifuged MMT. Melt viscosity results revealed that good dispersion of CMMT into the PET matrix reduces the effect of hydrolytic degradation of PET in the presence of water. Differential scanning calorimetry results indicated that the particle size distribution of nanoclays and consequently, the morphology of nanocomposites have a key role on the nucleating effect of clay particles and crystallinity of final samples. Nanoclays with smaller particle size distributions exhibit better dispersion of particles in the polymer matrix and this decreases their nucleating effects and the crystallinity of nanocomposites.
Keywords
Introduction
In recent years, the use of polymer/clay nanocomposites has increased because they provide advantages compared to conventional composites. The introduction of nanoclays into the polymer matrix improves the physical and mechanical properties of final products.1–3 These properties of polymer/clay nanocomposites are influenced by the dispersion of nanoclays into the polymer matrix. Preparing nanocomposites with an exfoliated structure leads to better barrier and mechanical properties.4,5 Considerable work has been done to improve the dispersion and properties of polymer/clay nanocomposites in recent years. Tarawneh et al. 6 have used ultrasonic treatment to improve the dispersion and properties of thermoplastic natural rubber (TPNR)/clay nanocomposites. Both in situ polymerization and melt compounding have been developed by Huang et al. 7 to improve the dispersion and properties of PVC nanocomposites. A proper dispersion of nanoclays into the different polymer matrices has always been a challenge for researchers.
Poly(ethylene terephthalate) (PET) is a semicrystalline thermoplastic with good physical and mechanical properties. Introducing small amounts of nanoclay into PET provides further improvement in its physical and mechanical properties.8,9
PET/clay nanocomposites have been prepared by using in situ polymerization,9–12 solution mixing,11,13 and melt blending.9,14,15 Recently, a modified melt blending method was introduced in which MMT water solution was blended with the polymer in a twin-screw extruder. 16
Most of the recent efforts were focused on modification of pristine nanoclays to make them more compatible with PET. Commercial modified nanoclays have widely been used in the preparation of nanocomposites with different polymer matrices. Cloisite 15A, 25A, and 93A have been used to prepare polylactide/modified layered silicates nanocomposites. 17 Sodium fluorohectorite (FH), and a combination of hydrogenated nitrile rubber (HNBR), FH and bohemite alumina (BA) have been used to improve the properties of polystyrene and polyamide-6, respectively.18,19 Commercial modified clays, especially those modified with quaternary ammonium surfactants, however, degrade at PET processing temperatures (270–300℃). Some researchers have used thermally stable surfactants such as imidazolium,8,20–22 quinolinium, 23 phosphonium,8,9,24 and pyridinium surfactants. 25 The results indicate that in most cases a combination of intercalated and exfoliated morphologies have been achieved and the dispersion of nanoclays into the PET matrix is still a challenging problem.
Pristine MMT and modified MMT have a wide range of particle sizes, and consequently, aqueous dispersions of MMT are turbid since they include micron size aggregates. Cipriano et al. 26 used a centrifugation method to remove large aggregates from pristine clay. They introduced this fractionated clay into a polystyrene matrix to make nanocomposite samples with improved morphology. 26
In the current study, the approach is to narrow the particle size distribution of clay particles by using a centrifugation method and to observe the effects of particle size distribution on the properties of PET/clay nanocomposites. No published reports have been found describing the effects of clay particle size distribution on the morphology of final PET/clay nanocomposite samples. The modified melt blending method presented by Wang and Jabarin 16 has been used for preparing nanocomposites.
Experimental
Materials
PET resin (grade HP806) with a density of 1.37 g/cm3 (25℃), a melting point of 240℃, and an intrinsic viscosity (IV) of 0.84 dL/g was obtained from Wellman Company (Bay St. Louis, MS). MMT with a d-spacing of 1.27 nm and a cation exchange capacity of 92.6 mEq/100 g clay was generously donated by Southern Clay Products (Gonzales, TX). The length and thickness of nanoparticles were about 150 nm and 1 nm, respectively.
Preparation of CMMT
Na-MMT dispersion was prepared by adding 80 g of MMT to 1920 g of deionized water (4 wt%) by stirring vigorously using a magnetic stirrer for 5 h. CMMT was prepared by using the method of Cipriano et al.
26
with some modification. The prepared clay slurry was centrifuged for 30 min at 3250×g by using a Beckman Avanti J-30 centrifuge (Beckman Coulter, CA). The precipitate containing large aggregates was discarded. The supernatant which was more transparent than the original dispersion was centrifuged again for 30 min at 18500×g. This precipitate was collected and identified as CMMT (Figure 1). CMMT was vacuum dried at 80℃ overnight. This centrifugation process yielded CMMT representing about 35 wt% of the initial clay.
Preparation of CMMT from MMT by using a two-step centrifugation process.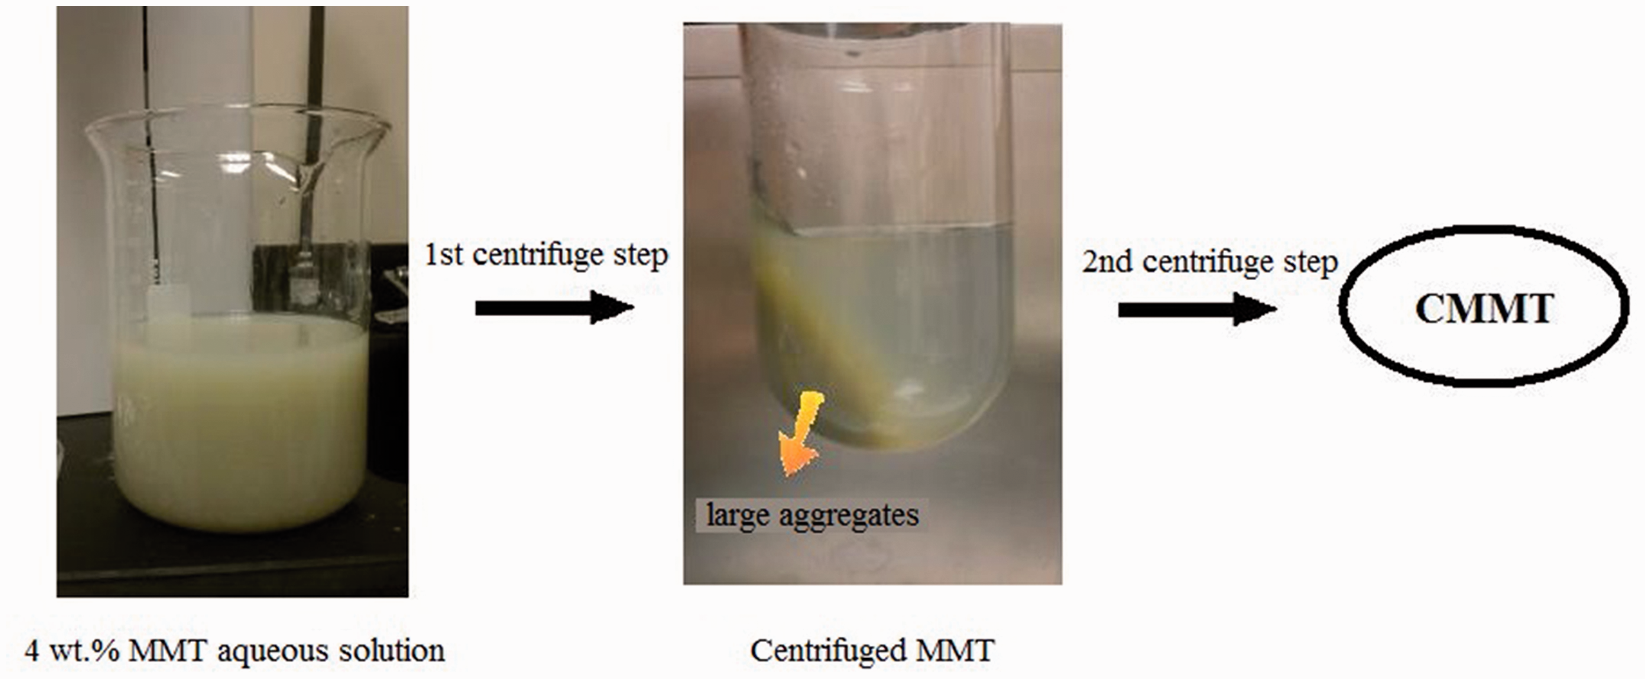
Preparation of clay slurry and nanocomposites
About 4 wt% of MMT and CMMT were each dispersed in deionized water and stirred using a magnetic stirrer for 15 h to prepare clay slurries.
Before the extrusion process, the PET resin was dried using a Conair dehumidifying air dryer at 140℃ for 12 h. PET/MMT and PET/CMMT nanocomposites (0.5 wt% and 2 wt%) were prepared by feeding the clay slurries and resin pellets into the ZSK-30 co-rotating twin-screw extruder (Werner & Pfleiderer Corp., Ramsey, NJ). The peristaltic pump for dispersion of the clay slurry and water into the extruder was calibrated. At low flow rates, the calibration curve of clay slurry was in good agreement with that of deionized water alone. The feed rate of PET was set at 100 g/min. Feeding rates of clay slurries were set at 12.5 g/min and 50 g/min to respectively achieve final nominal clay concentrations of 0.5 wt% and 2 wt% after water removal. Extruded PET and PET in the presence of water were used as controls. Water with two different feeding rates was added to the PET to make PET–water control samples (12.5 g/min and 50 g/min as controls of 0.5 wt% and 2 wt% nanocomposites, respectively). They were identified as PET-W-0.5 and PET-W-2.
The screw speed and temperatures of zones one through five were set at 200 r/min and 280℃, respectively. To reduce the effect of hydrolytic degradation of PET at high processing temperatures, water was removed by using a vacuum pump. Extruded material was cooled in room temperature water, pelletized, and dried for further characterization. 16
Characterization
Wide angle X-ray diffraction
A Rigaku Ultima X-ray diffractometer (The Woodlands, TX) with a Ni-filtered Cu Ka radiation (0.1541 nm wavelength) generated at 44 kV and 44 mA was used to determine the basal spacing of clays and their nanocomposites using the Bragg equation (λ = 2d sin θ), where θ is the diffraction angle, λ is the wavelength, and d is the basal spacing of clays. Samples were scanned at 0.5°/min in the range of 2θ = 1–8°.
Morphology
The particle size distribution of different nanoclay solutions was examined with a Hitachi HD-2300A scanning transmission electron microscope (STEM) at an activation voltage of 200 kV (Hitachi High-Technologies Corporation, Japan).
The morphological analysis of nanocomposites was carried out on the same Hitachi HD-2300A TEM instrument at a 200 kV accelerating voltage. The samples were embedded in epoxy resin and trimmed before being microtomed by using a Leica EM UC6 Ultramicrotome (Wetzlar, Germany). The sections were collected on 200-mesh copper grids and dried prior to the TEM evaluation.
Melt viscosity
Melt viscosity and rheological measurements of nanocomposites were determined by using a parallel-plate Rheometric Scientific (RDA III) dynamic analyzer (Piscataway, NJ). Vacuum-dried samples were melted between parallel disks (diameter: 2.5 cm) at 270℃ in the presence of nitrogen at 15% strain amplitude.
The conversion of melt viscosity values, taken at 10 rad/s, to PET equivalent IV values was done according to the method described by Tharmapuram and Jabarin, 27 and the calibration curve including nanocomposites as described by Kim et al. 11
Differential scanning calorimeter
A Perkin- Elmer differential scanning calorimeter 7 (DSC, Shelton, CT) was applied to measure the thermal characteristics of extruded PET and its nanocomposites in a nitrogen atmosphere. Dried samples of about 10 mg were heated at a rate of 10℃/min from 40℃ to 300℃. In addition, non-isothermal crystallization kinetics of extruded PET and nanocomposites were obtained from the molten states and observed at cooling rates of 40℃/min, 50℃/min, 60℃/min, 70℃/min, and 80℃/min.
Results and discussion
Particle size distribution
Figure 2 shows SEM micrographs of 2 wt% dispersions of MMT and CMMT in water. There are large aggregates of clay platelets in the case of the MMT aqueous solution (Figure 2(a)). The image of CMMT in water shows smaller particles of sizes not exceeding 100 nm (Figure 2(b)).
SEM micrographs of: (a) 2 wt% of MMT, and (b) 2 wt% of CMMT aqueous solutions.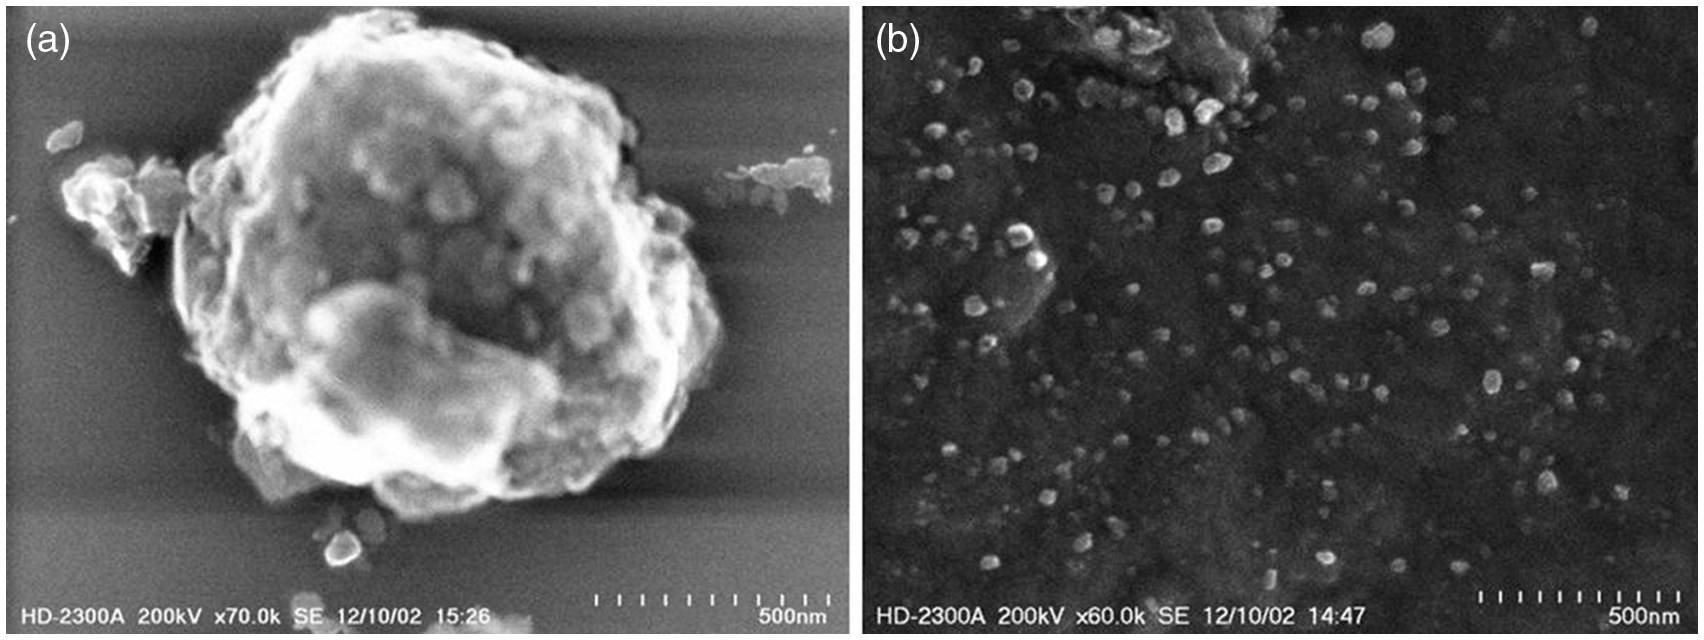
Particle size distributions of 2 wt% of MMT and CMMT in water were also determined (Figure 3). Figure 3(a) shows the particle size distribution of 2 wt% of MMT in water. The histogram reveals a number of aggregates of sizes exceeding 200 nm, and the most populated particle size of 160 nm. Large aggregates are removed in the case of 2 wt% of CMMT aqueous solution. As can be seen in Figure 3(b), the most populated particle size of CMMT in water is 40 nm.
Particle size distribution of: (a) 2 wt% of MMT, and (b) 2 wt% of CMMT aqueous solutions (scales are different).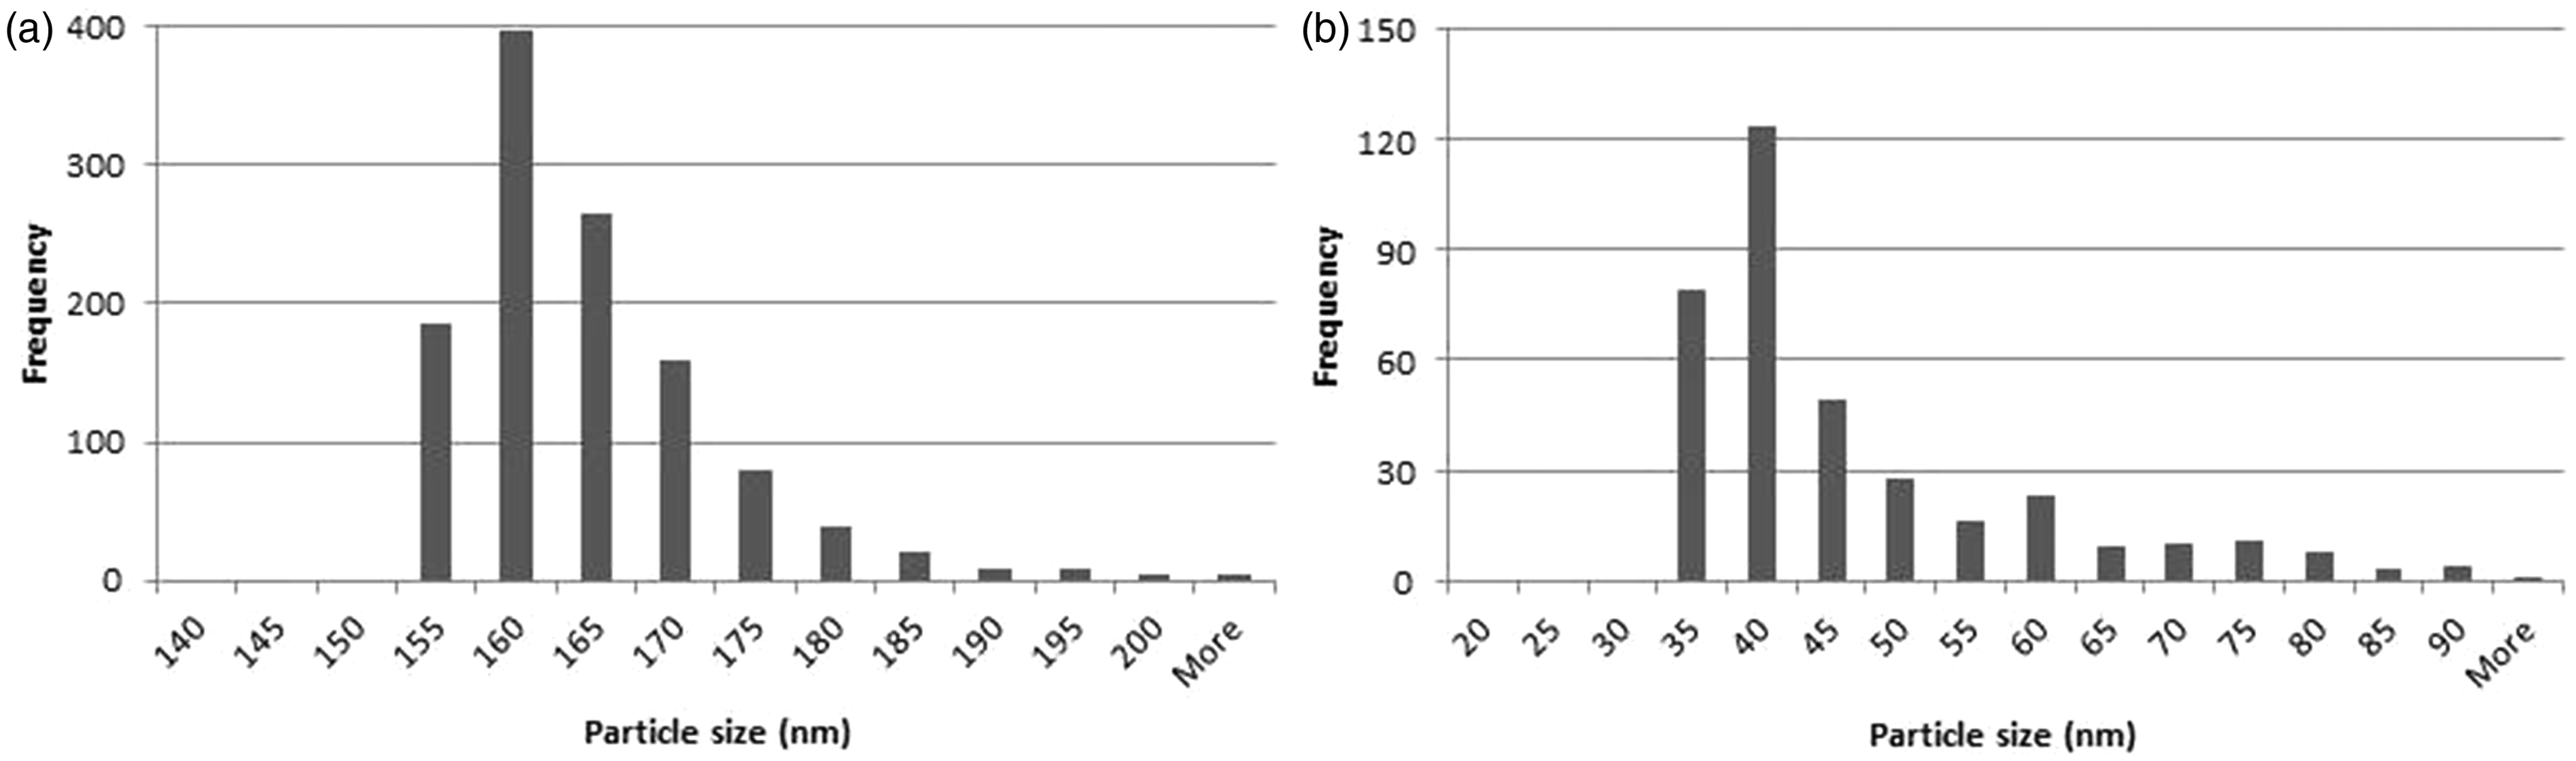
X-ray diffraction results
The effect of initial clay particle size distribution on the morphology of final nanocomposites has been studied by using X-ray diffraction (XRD) and TEM techniques. XRD data for dried MMT, CMMT and their nanocomposites are shown in Figure 4. A characteristic diffraction peak appears at 2θ = 7.0° with a d-spacing of 1.27 nm for Na-MMT. Centrifugation of clay enlarged the gallery spacing and hence the shift in the peak position to a lower angle in the XRD pattern (1.41 nm) indicates that the clay has a larger gallery spacing after centrifugation. The peak of CMMT is broader and has lower intensity also indicating greater delamination of centrifuged nanoparticles. The peak intensity of 0.5 wt% and 2 wt% nanocomposites is much lower than that of CMMT, suggesting improved dispersion and delamination of silicate layers into the polymer matrix. There is no peak in the samples of PET prepared with both MMT and CMMT, indicating that exfoliation may have occurred. However, XRD alone is not reliable in determination of nanocomposite structures. Some factors such as different particle sizes of samples can affect the results of XRD and lead to a mixed layering or peak broadening of XRD data. TEM should be used to verify the XRD results.16,28–30
XRD results for MMT, CMMT, and their nanocomposites.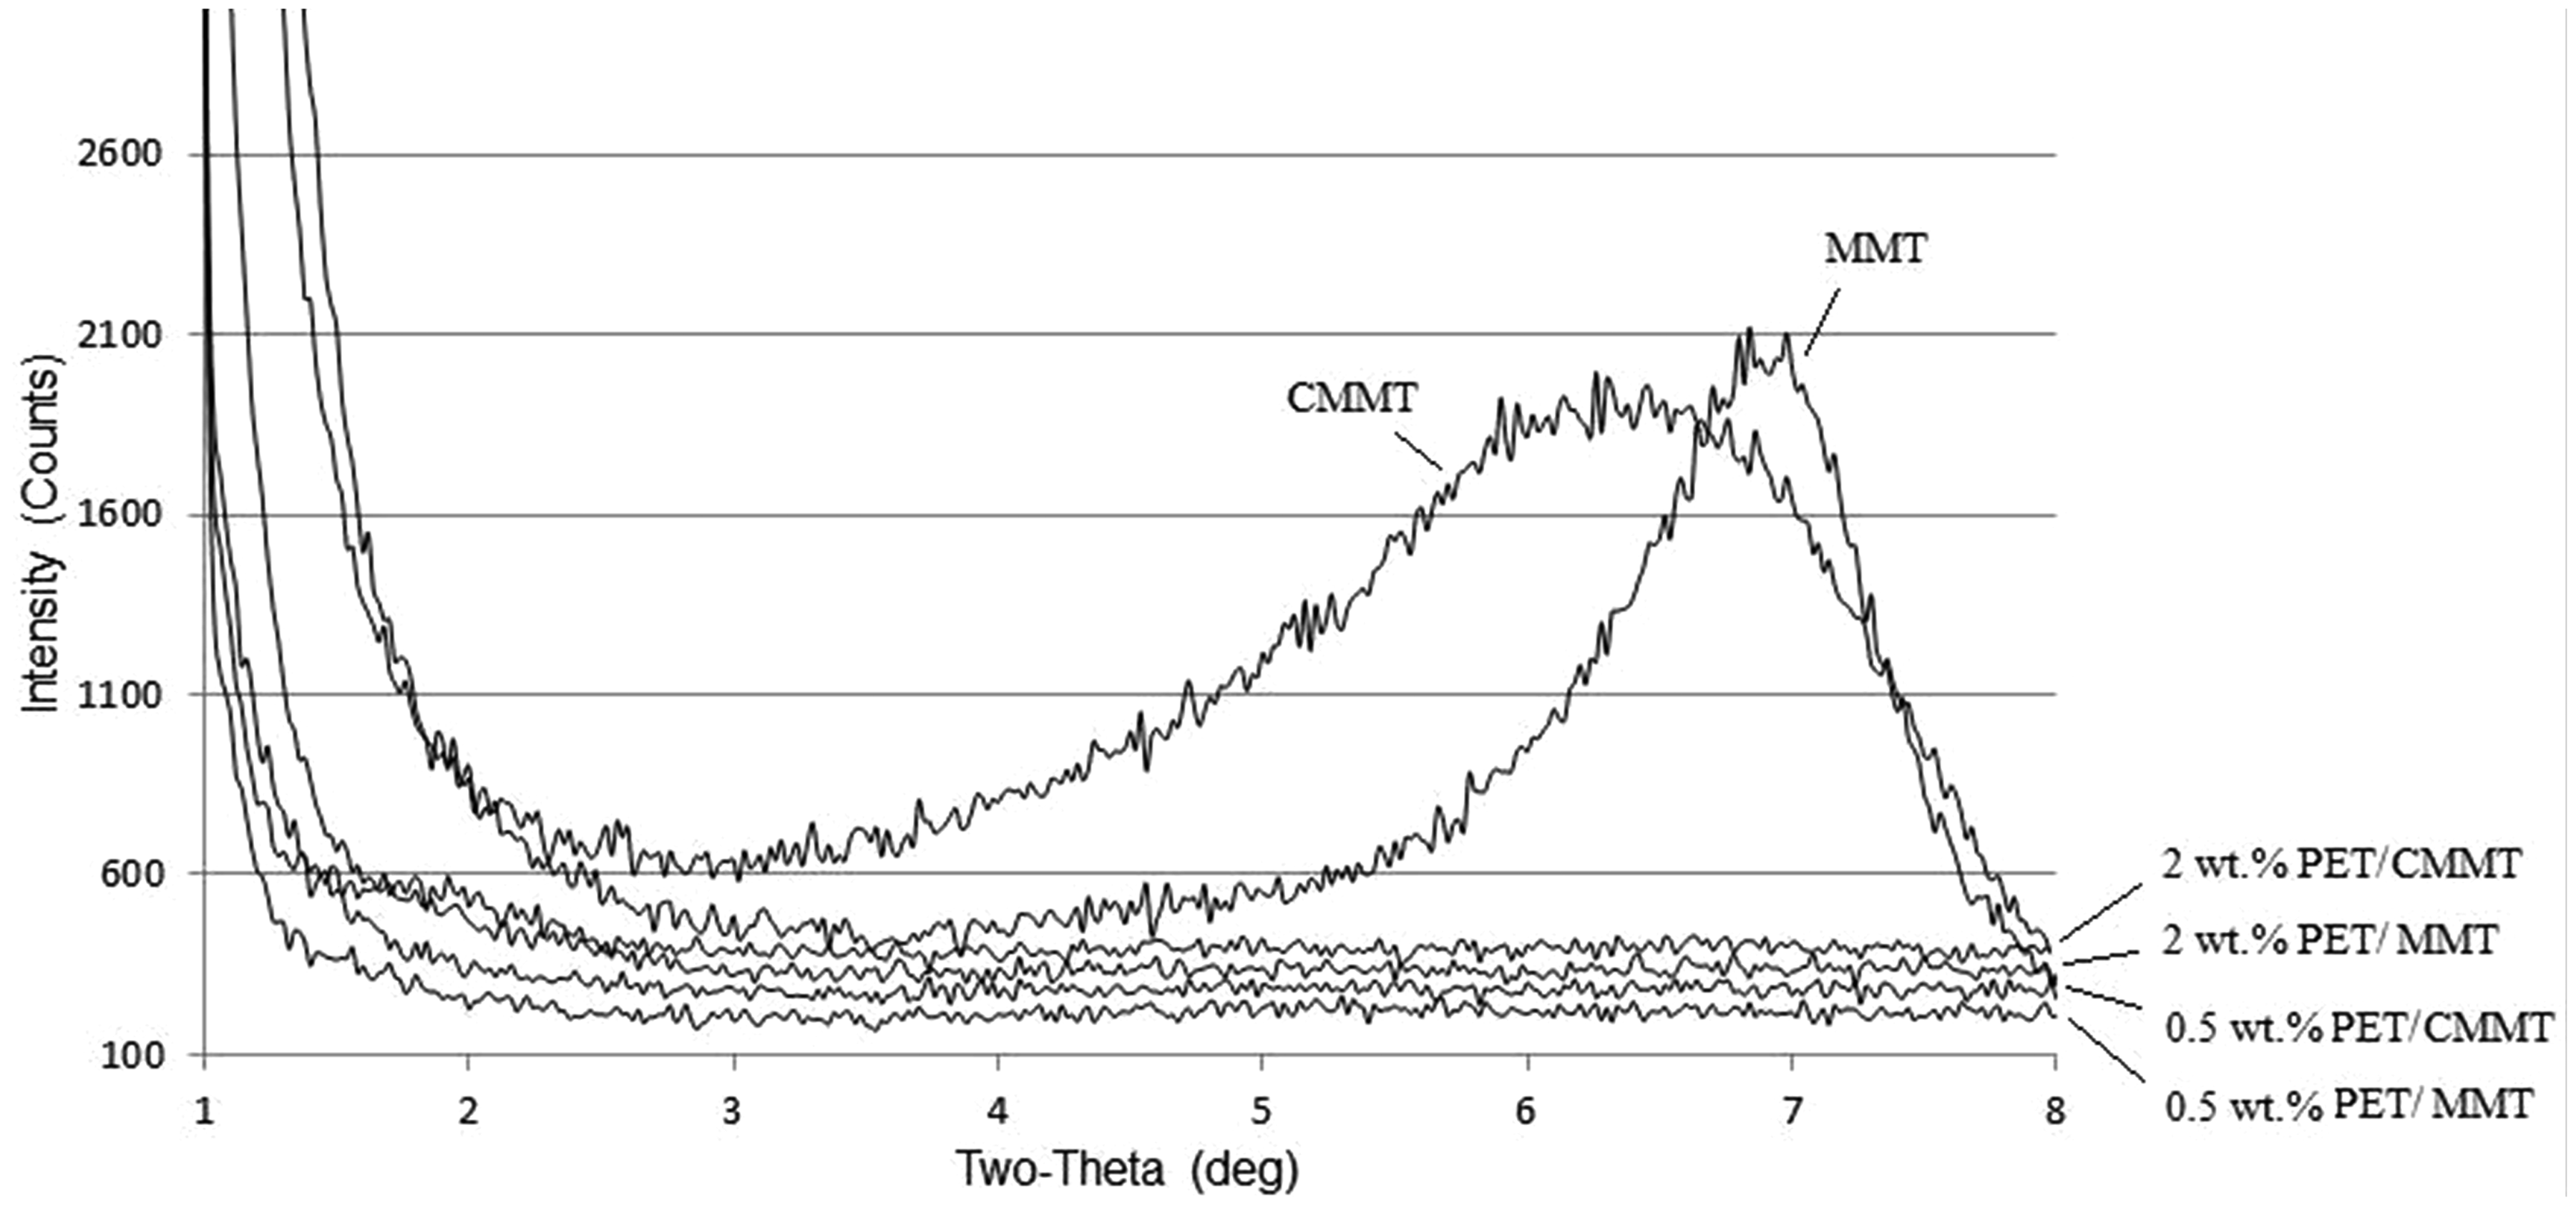
TEM images
TEM was used to verify the results obtained from XRD data. Micrographs of 0.5 wt% and 2 wt% nanocomposites are shown in Figure 5. The black lines correspond to the clay platelets, while the lighter background represents the polymer matrix. It can be seen that the nanoclays have been intercalated in the PET/MMT nanocomposites, and tactoids with large numbers of clay platelets can be seen in 0.5 wt% MMT nanocomposites structure (Figure 5(a)). In the case of 0.5 wt% CMMT nanocomposites; however, CMMT is highly dispersed in the PET matrix. There are some single layers and some tactoids with a small number of clay platelets (Figure 5(b)).
TEM micrographs of: (a) 0.5 wt% of PET/MMT, (b) 0.5 wt% of PET/CMMT, (c) 2 wt% of PET/MMT, and (d) 2 wt% of PET/CMMT nanocomposites.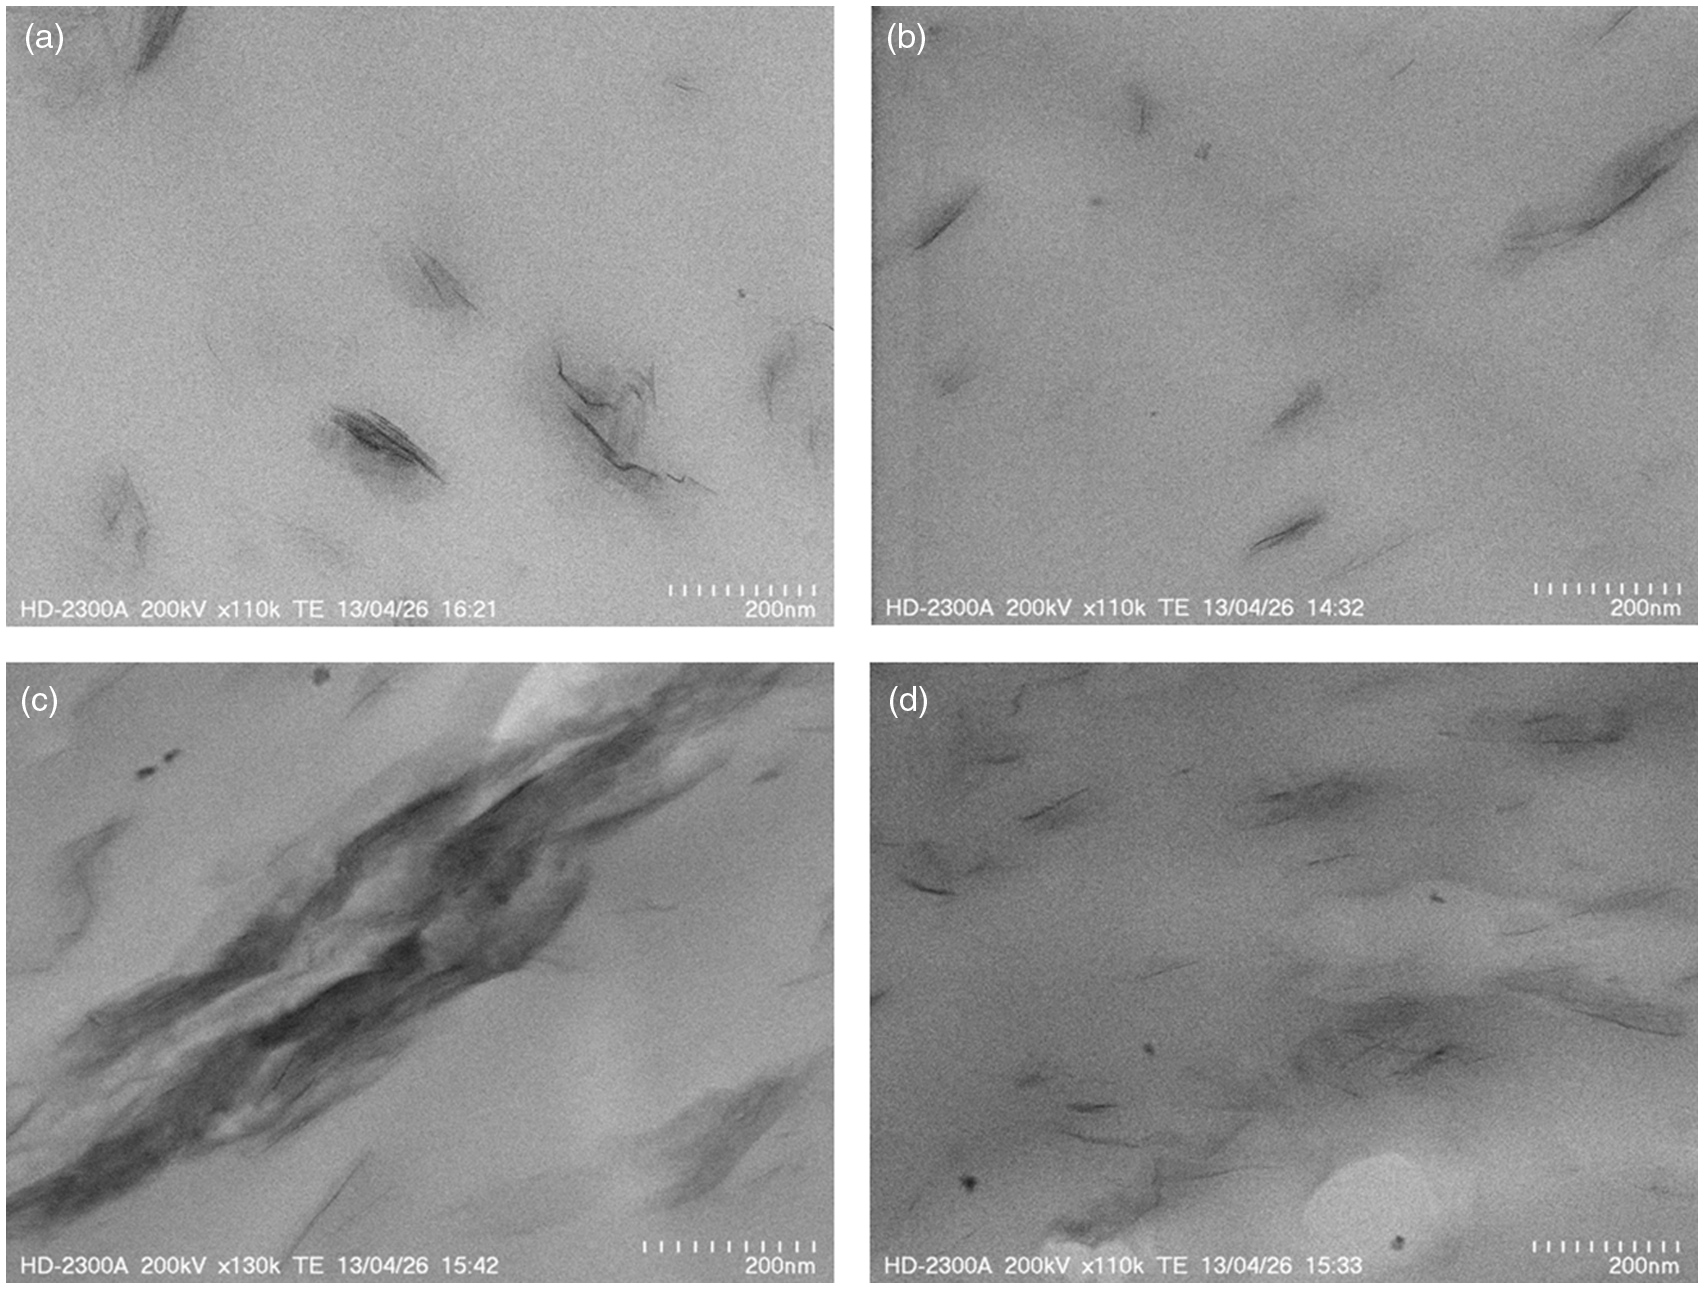
Figure 5(c) indicates that at higher clay loading, an intercalated structure has also been obtained, but large aggregates of MMT in the polymer matrix are observed. In the case of PET/CMMT nanocomposites, single layers of CMMT are observed and processed clay particles are very well-dispersed into the PET matrix (Figure 5(d)).
TEM results confirm the effect of initial particle size distribution of silicate layers on the dispersion and delamination in the final nanocomposites samples. Better dispersion of nanoclays in the final PET/clay nanocomposites can be obtained by removal of large particles from pristine clay. The presence of water and vigorous mixing of water with clay particles in the centrifugation step expands the gallery spacing of clay platelets, making it easier for polymer chains to diffuse inside the gallery spacing of those particles. Centrifugation also results in removing the large aggregates of nanoparticles which hinder the diffusion of polymer chains in the melt blending of PET and nanoclays; therefore, it is easier for polymer chains to break down the smaller agglomerations of nanoparticles compared to the larger aggregates.
Rheology
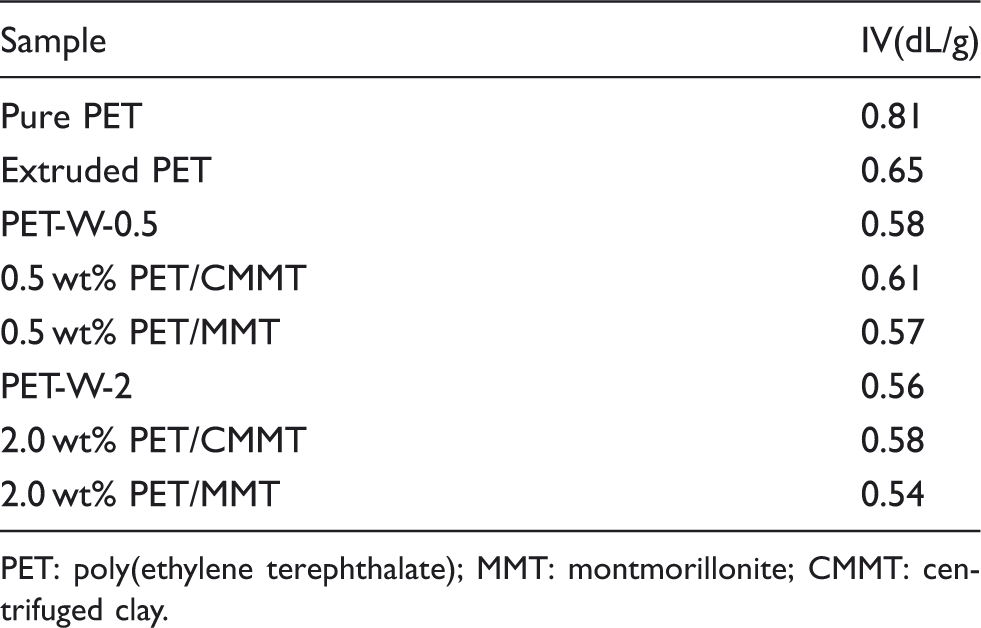
Examples of melt viscosity results and corresponding PET equivalent IV values for PET, PET in the presence of water and nanocomposites are shown in Figure 6 and Table 1. The complex viscosity decreased with increasing angular frequency for all the samples. The maximum value of complex viscosity was observed for extruded PET. Introducing water into the PET reduced its complex viscosity and consequently the IV as expected through hydrolytic degradation. The 0.5 PET/CMMT nanocomposites exhibited higher complex viscosity and IV values compared to its control (PET-W-0.5). The 2 wt% nanocomposites exhibited the same behavior (they are not shown in Figure 6). The CMMT nanoclay, which included more uniform and smaller particle size distributions (less than 100 nm) improved the dispersion of nanoparticles into the PET matrix. These well-dispersed nanoparticles appeared to have a shielding effect which reduces the mass transport rates during the degradation process in the polymer matrix.
31
PET/MMT nanocomposites exhibited lower complex viscosity and IV values compared to the controls. In fact, the degradation of polymer matrix was accelerated by the large aggregates of MMT nanoparticles.
Melt viscosity of PET, PET with water, and nanocomposites. IV values of PET and nanocomposites. PET: poly(ethylene terephthalate); MMT: montmorillonite; CMMT: centrifuged clay.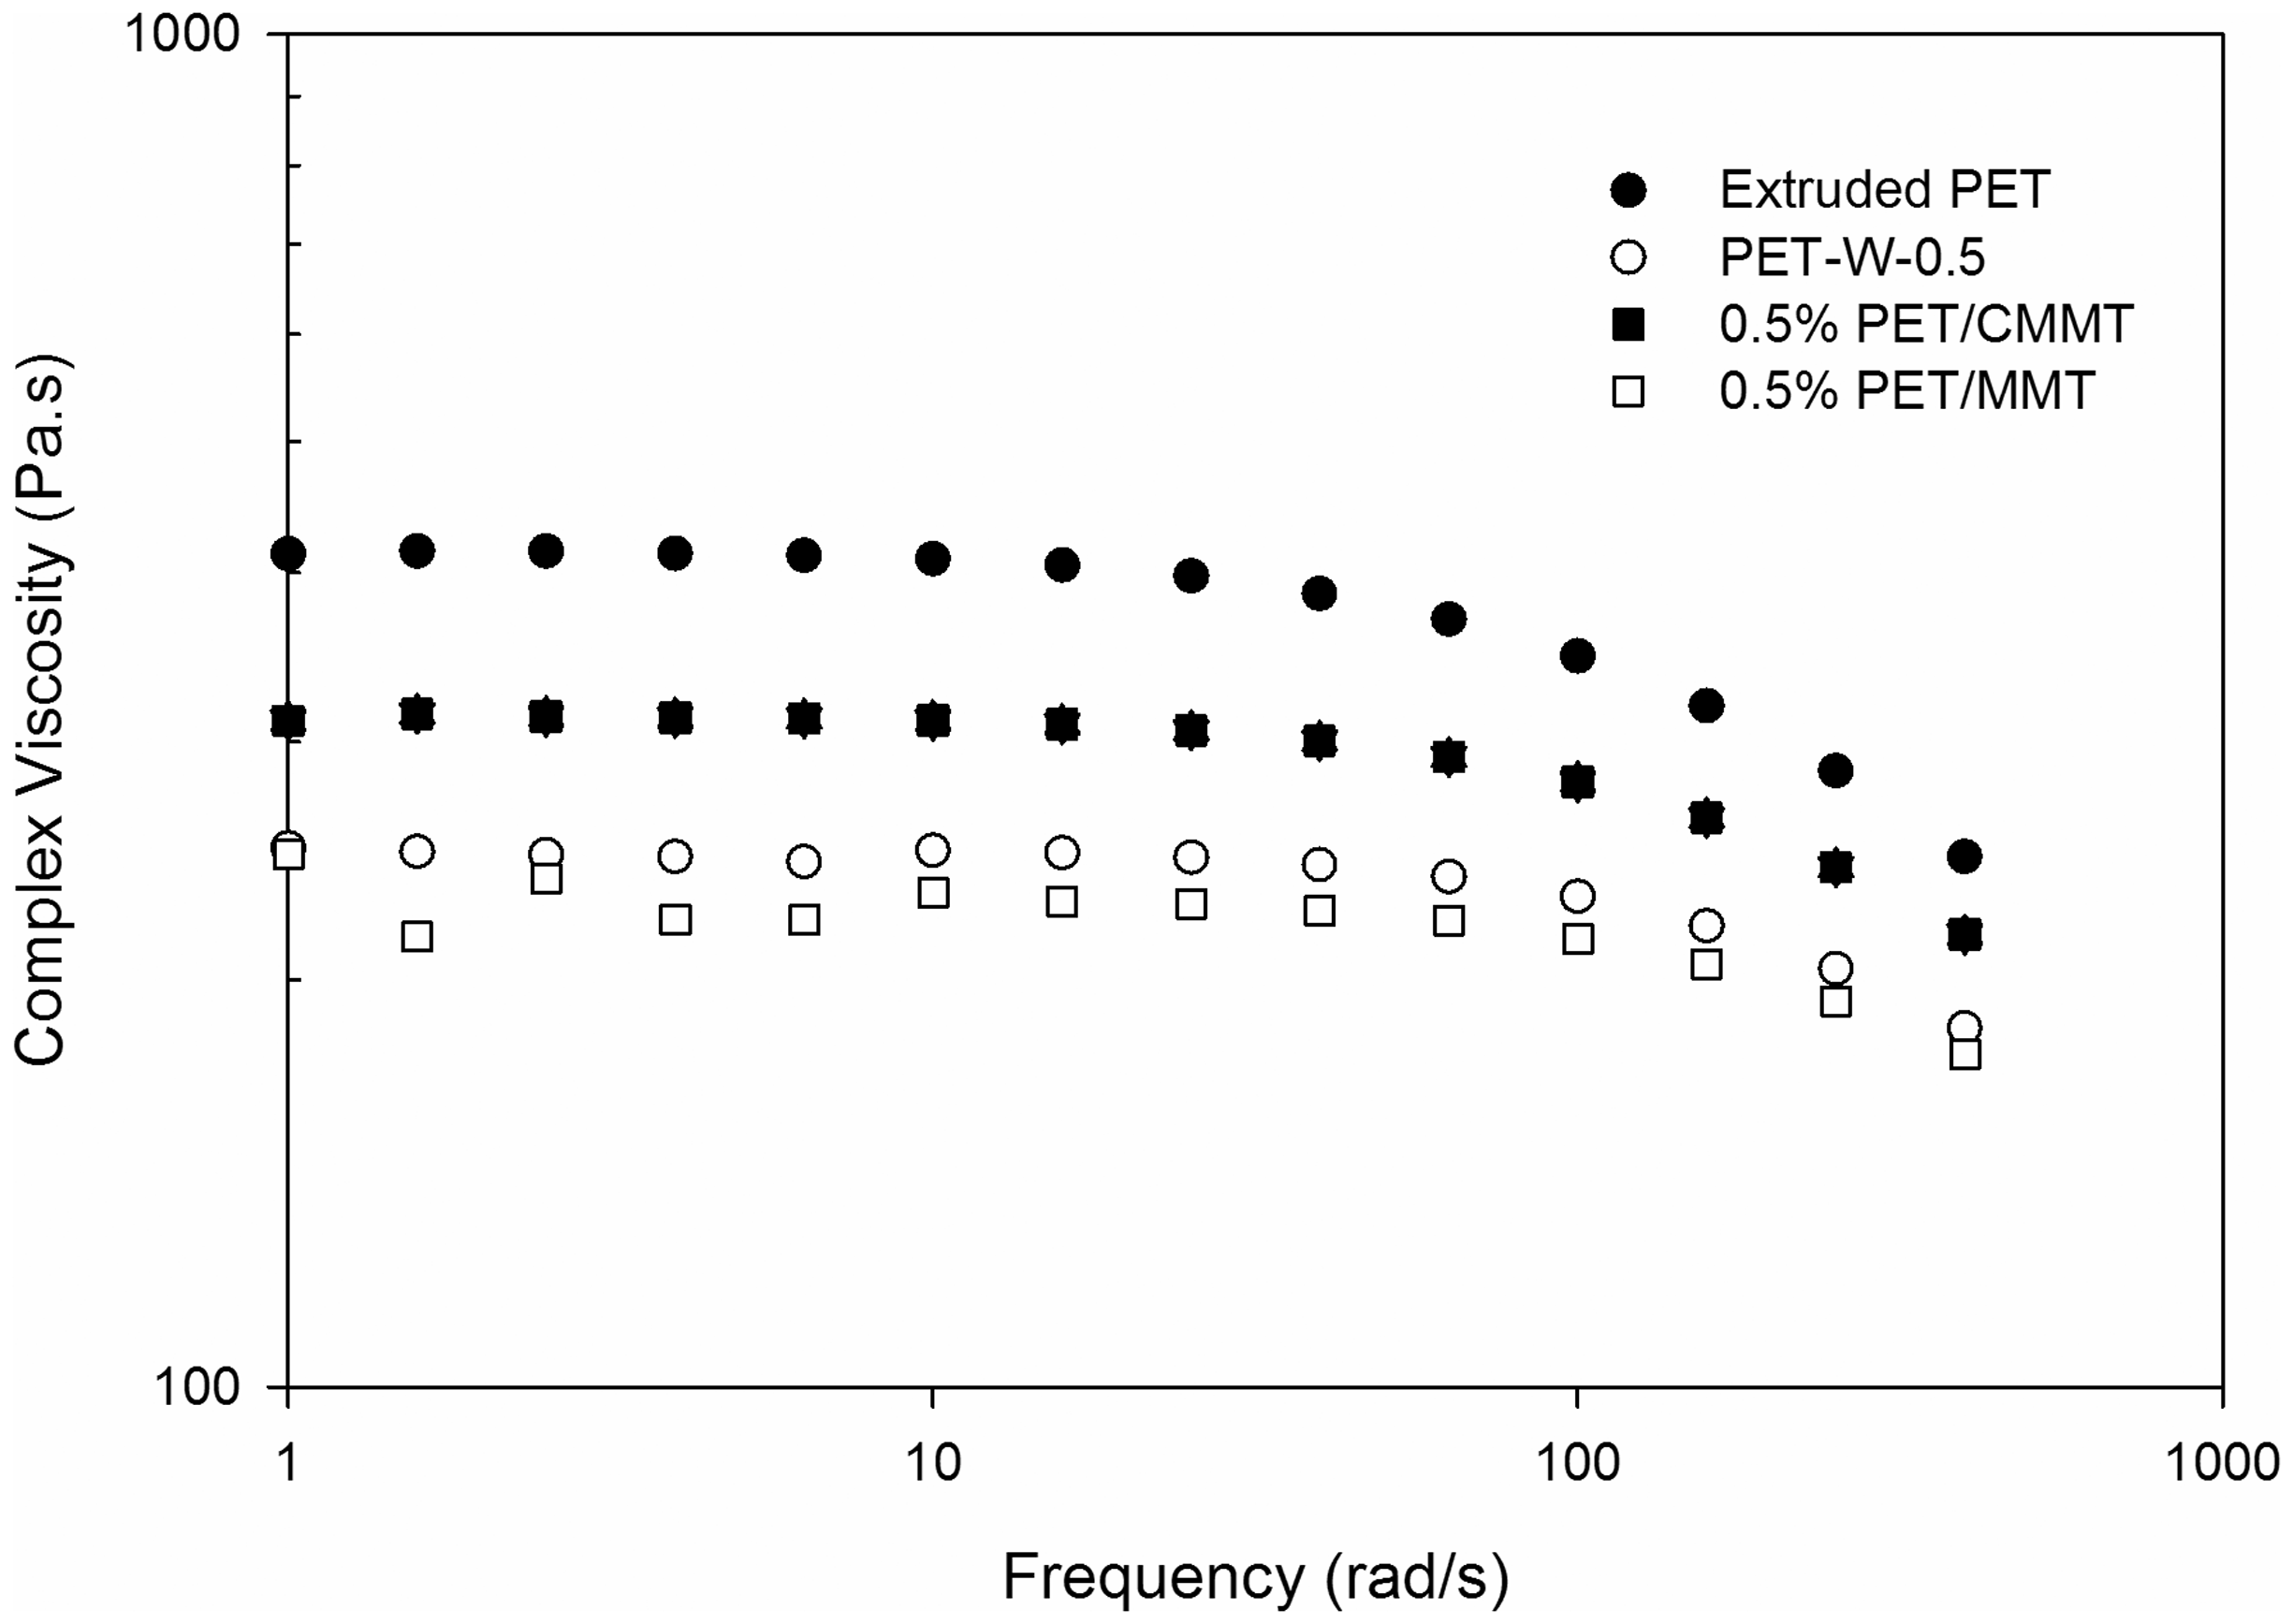
The storage modulus (G′) which is a measure of the elastic response of a material versus frequency for different samples is shown in Figure 7. Samples prepared in the presence of water showed lower storage modulus because of the hydrolytic degradation of PET. On the other hand, extruded PET exhibited higher storage modulus and more solid-like behavior. The presence of 0.5 wt% and 2 wt% centrifuged nanoclays slightly increased the storage modulus of nanocomposites compared to their controls because of some conformational hindrances which occur in the presence of nanoclays. Although conformational hindrances also occurred in the case of 0.5 wt% and 2 wt% PET/MMT nanocomposites, poorer dispersion of MMT particles accelerated the degradation process in the PET matrix; hence the storage modulus of PET/MMT nanocomposites is lower than that of their controls. Differences between the storage modulus of extruded PET and all the samples are reduced at higher frequencies, where the behavior of the matrix is dominant.
Storage modulus of PET, PET with water, and nanocomposites.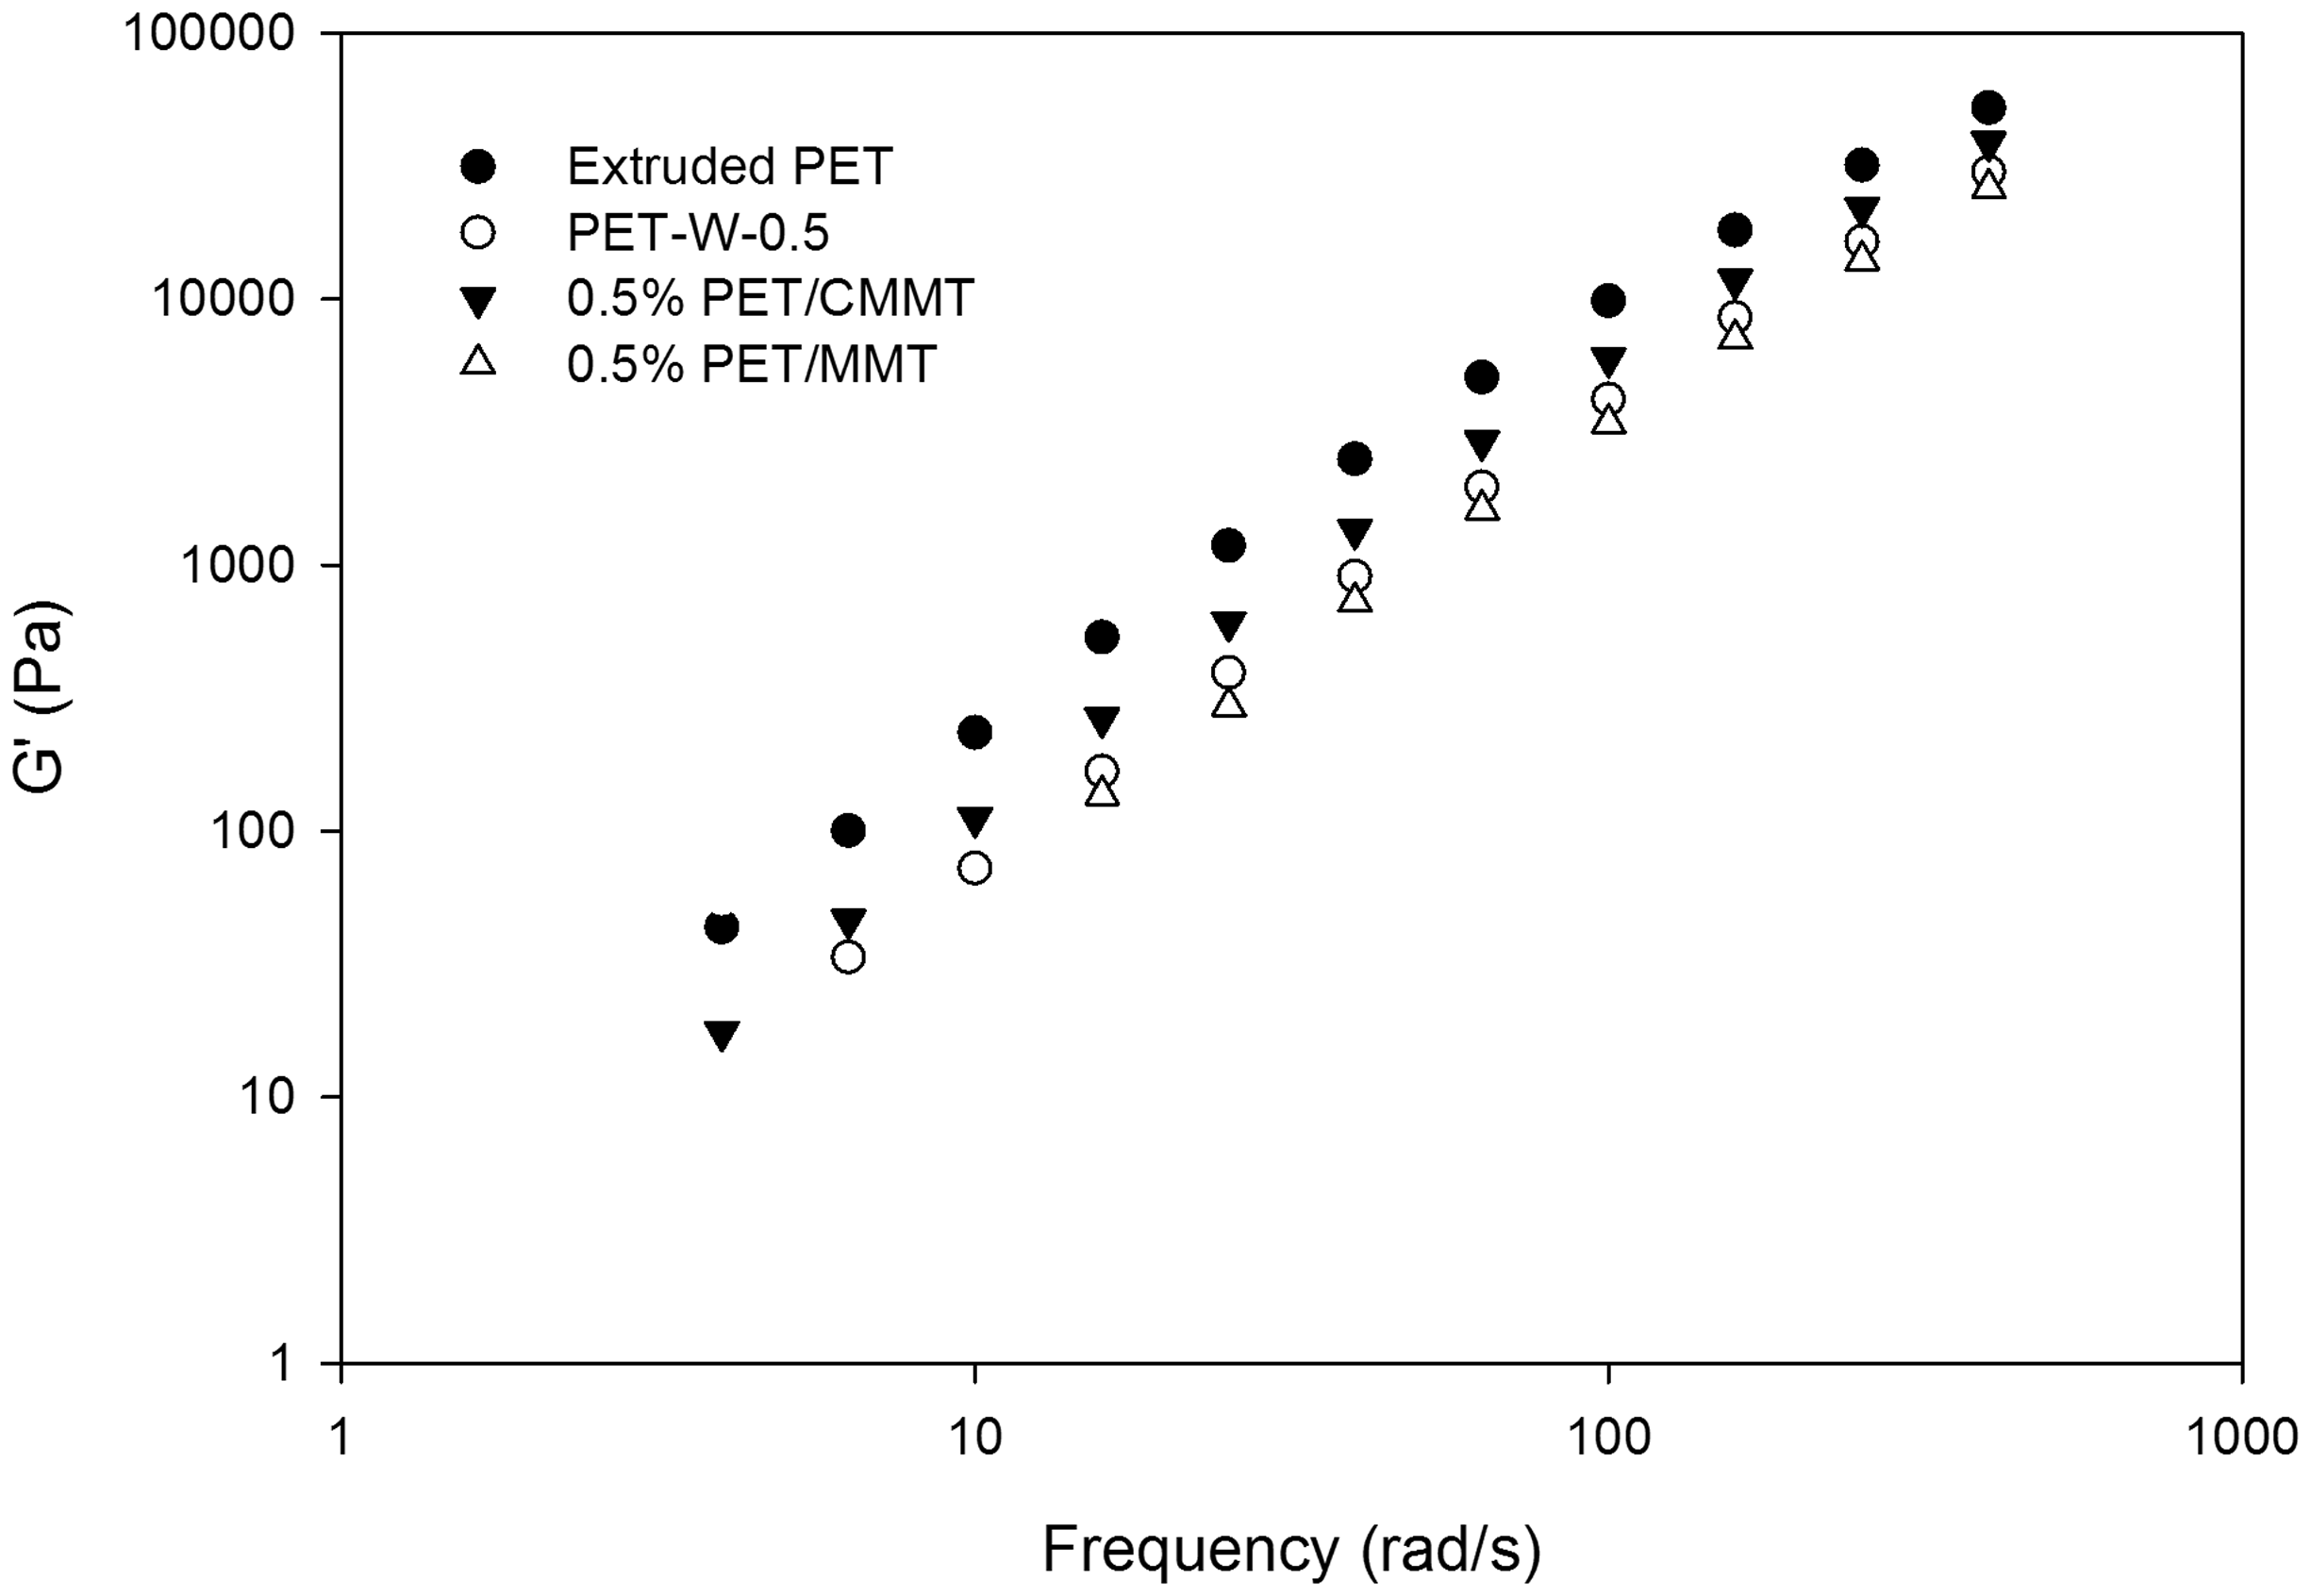
Phase angle versus frequency for different samples is shown in Figure 8. Phase angle is related to the ratio of loss (G″) and storage moduli. The Newtonian plateau is reduced for extruded PET because of its higher molecular weight and more chain entanglements. Since it has higher molecular weight compared to the PET-W-0.5 sample and the PET nanocomposites, its phase angle decreases more with increasing frequency. Because of the lower molecular weight of nanocomposites and PET-W-0.5, the importance of their storage moduli is less significant than that of extruded PET; hence the decrease in their phase angle values would be less.
Loss angle of PET, PET with water, and nanocomposites.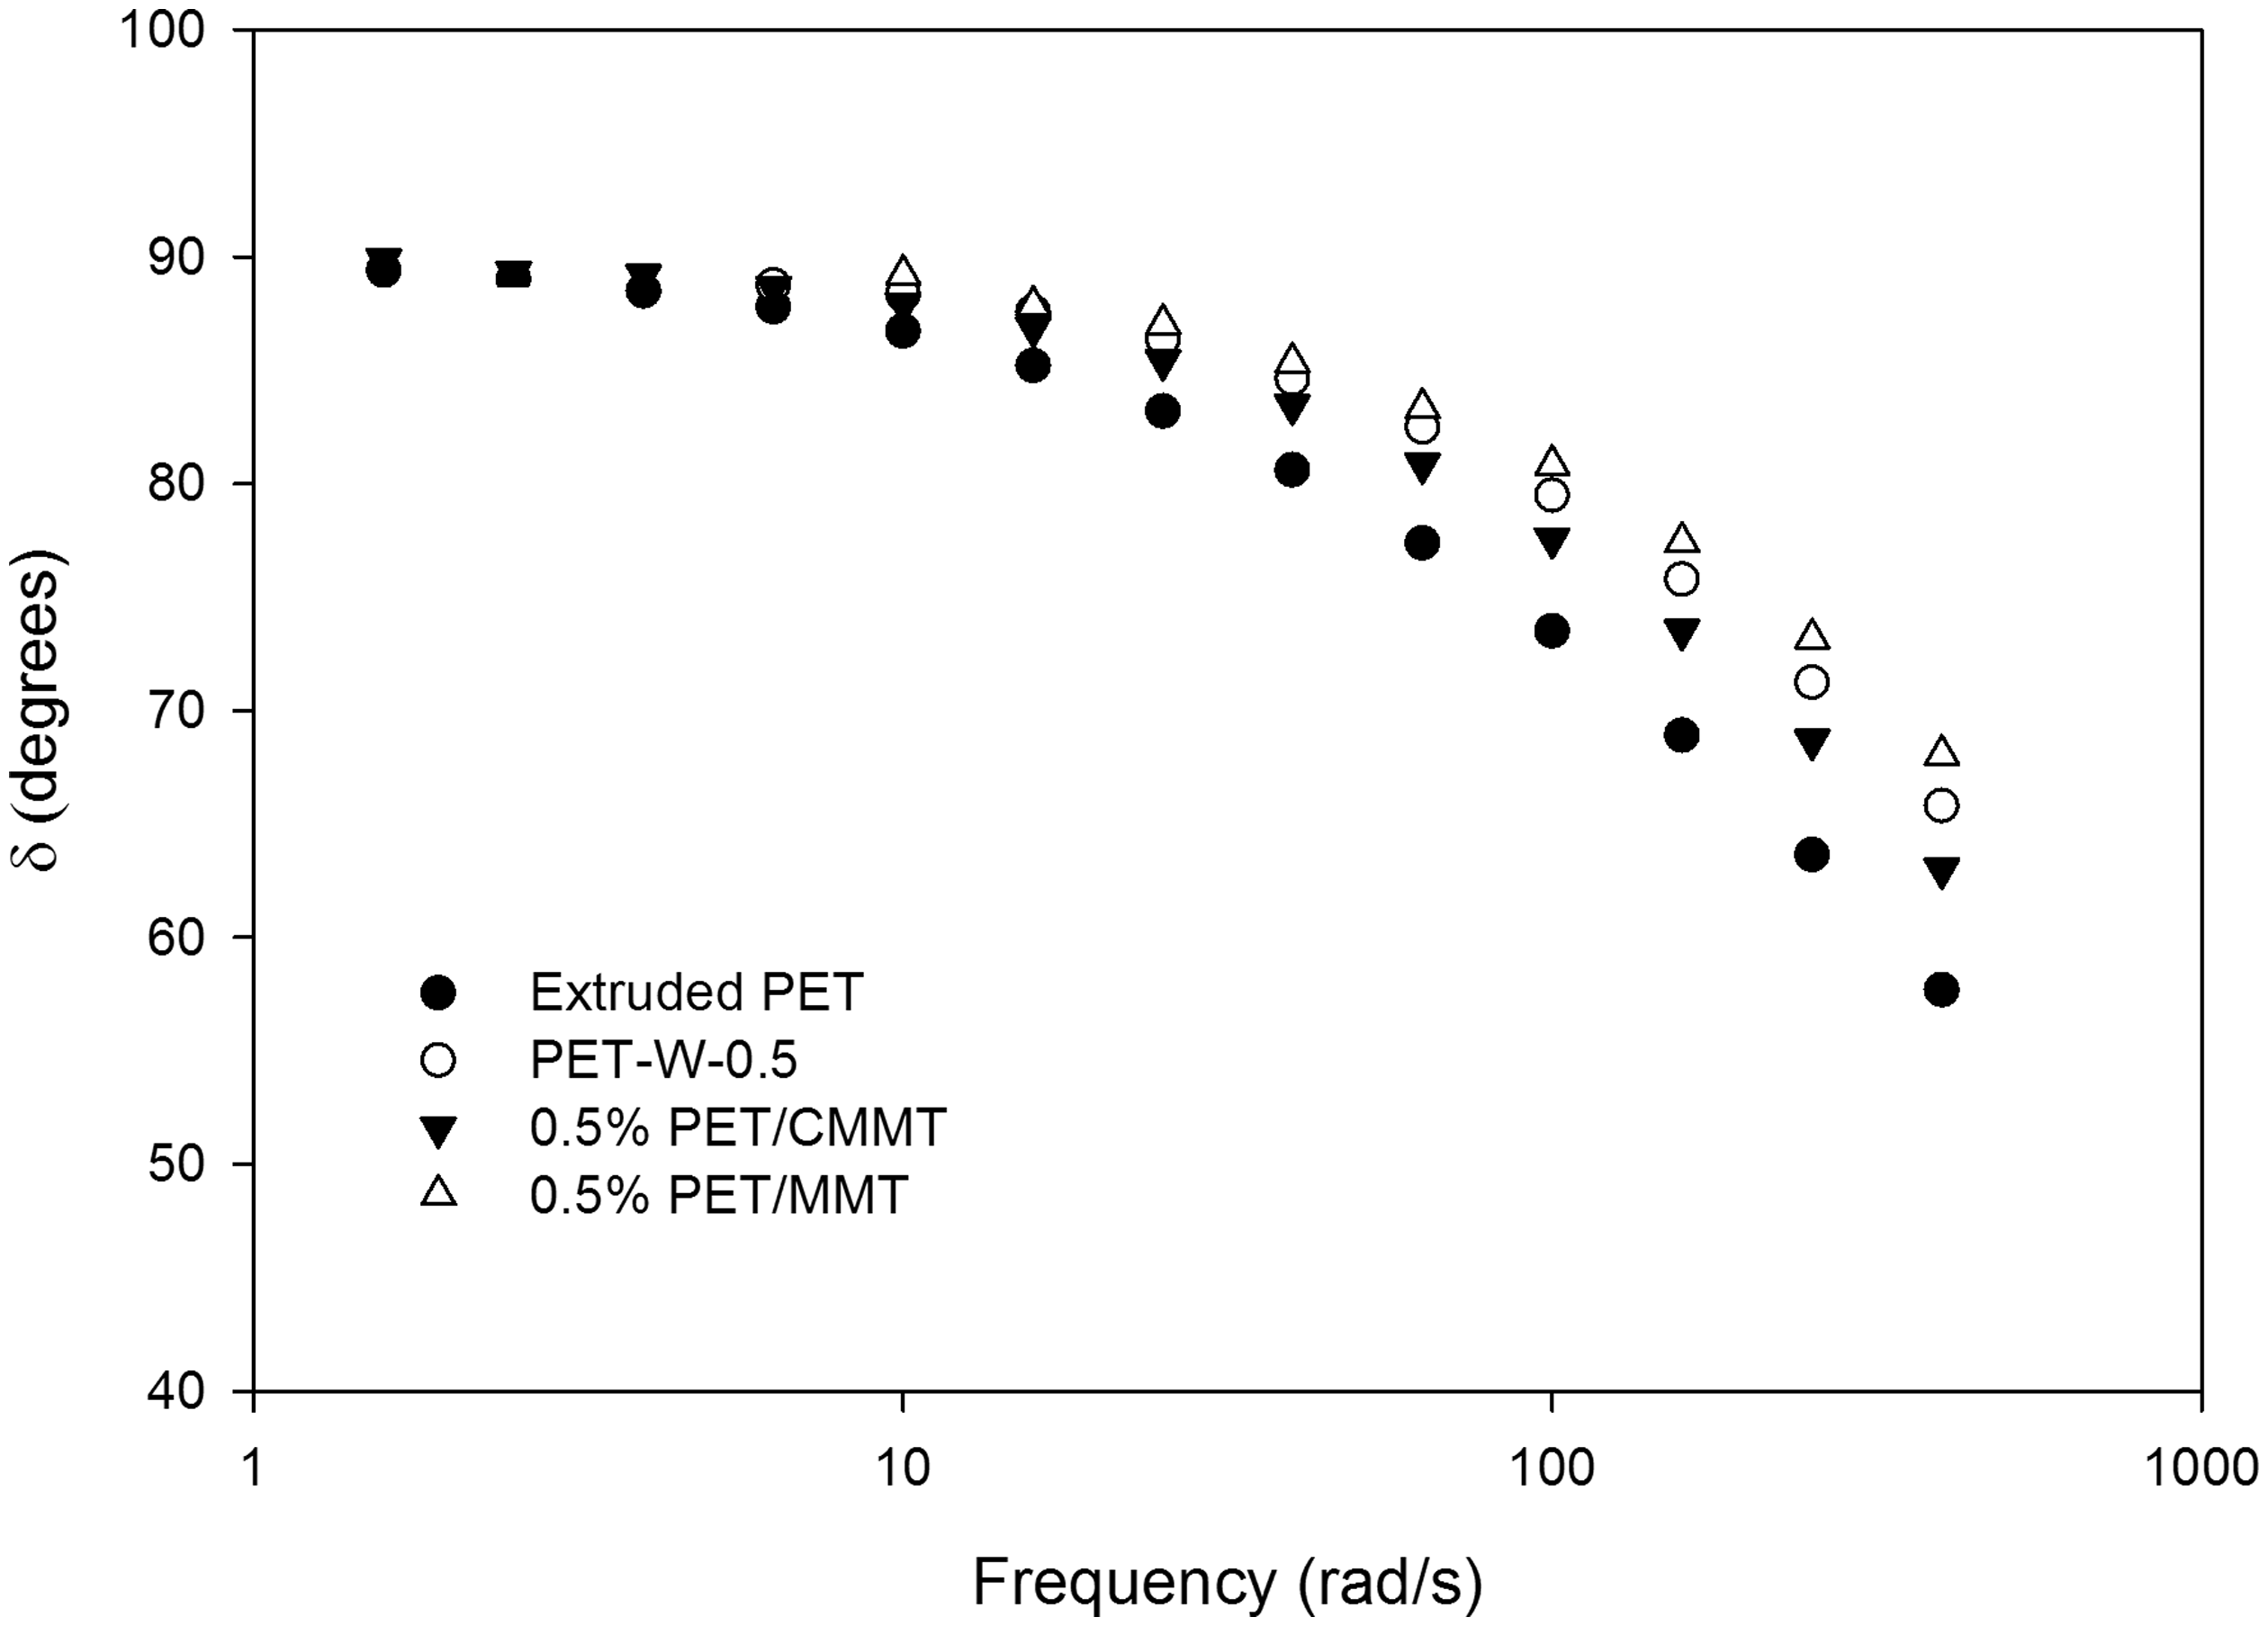
Gel point, which is a transition point from liquid like to solid like viscoelastic behavior, can be determined by a tan δ (the ratio of G″ over G′) versus angular frequency plot. 32 In this research, tan δ was greater than 1 for all frequencies for all the samples indicating the dominance of viscous behavior (G″) over the elastic behavior (G′) (the plot is not shown here). It indicated that adding the nanoparticles up to 2 wt% did not significantly change the elastic behavior of the polymer matrix. All the rheology measurements are in agreement with the TEM results which show a better dispersion and less agglomerated particles in the case of nanocomposites prepared with CMMT compared to those prepared with MMT.
Thermal properties
DSC analysis was used to investigate the thermal characteristics of extruded quenched samples that appeared to be totally amorphous. Clay particles can act as nucleating agents, which increase the rate of polymer crystallization.30,33–35 Since the amount of clay is low in the nanocomposites, their glass transition temperatures (Tg) and melting temperatures (Tm) are close to those of pure PET. The difference between melting and crystallization enthalpies has been taken to indicate the level of crystallization that occurs during the quenching step. 16 This difference is zero for extruded PET as expected. Since the quenching process occurs very fast after extrusion, there is not enough time for the polymer to crystallize, and the extruded PET is totally amorphous. The differences between the melting and crystallization enthalpies are higher for PET–water controls and the nanocomposites than that for pure PET, revealing these materials are not completely amorphous, even after quenching. This difference is also higher for nanocomposites with higher clay loading due to the nucleation effect of clay particles. 36
Normalized DSC data of extruded PET and PET/clay nanocomposites after extrusion.
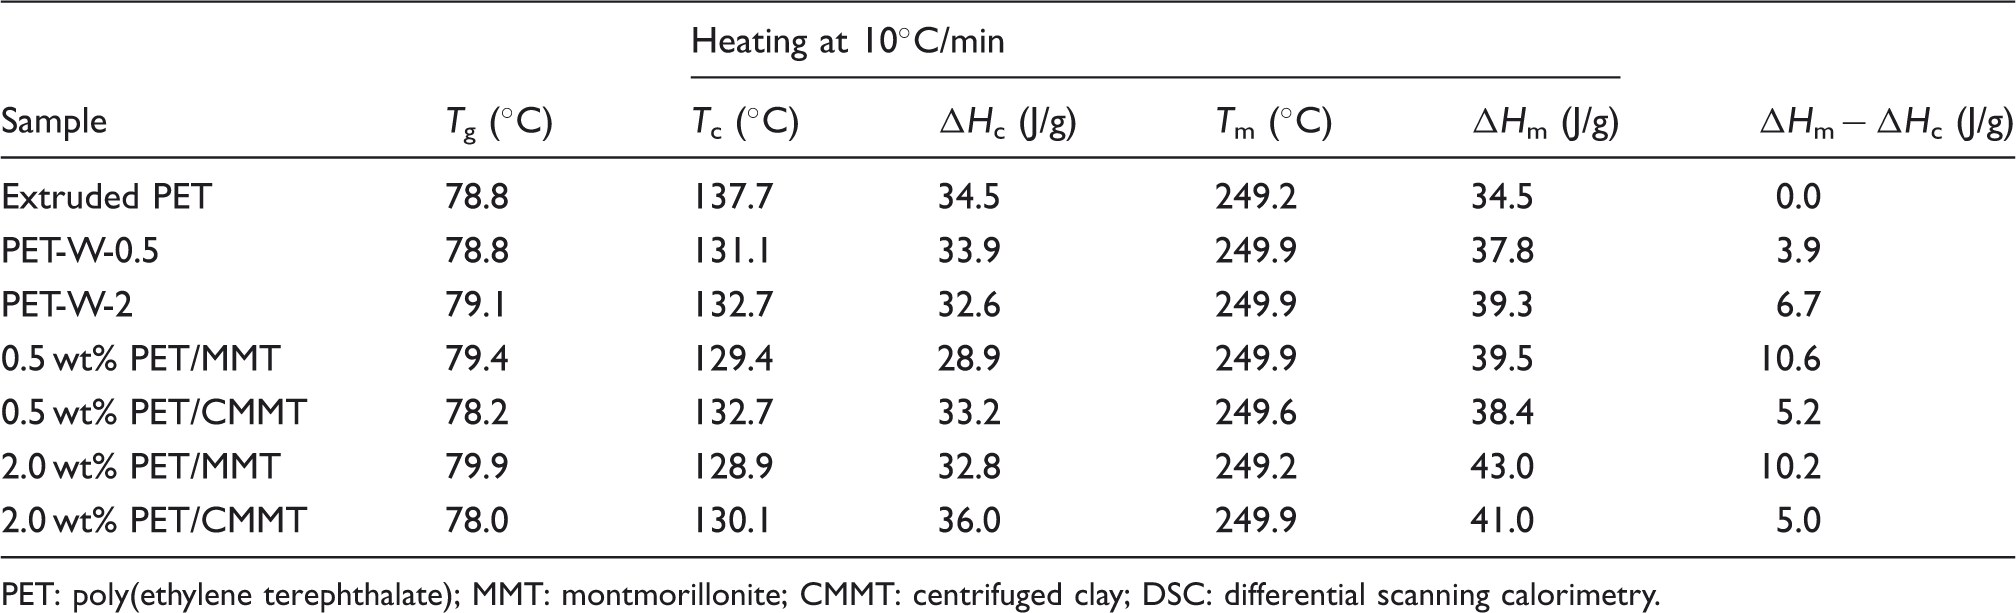
PET: poly(ethylene terephthalate); MMT: montmorillonite; CMMT: centrifuged clay; DSC: differential scanning calorimetry.
To more fully investigate the crystallization behavior of PET nanocomposites, thermal characteristics of all samples were examined at different cooling rates. Figure 9 shows examples of the changes in enthalpies upon cooling as functions of the reciprocals of cooling rates for extruded PET and the 2 wt% nanocomposites. Non-isothermal crystallization behaviors of all samples are summarized in Table 3. As expected, the crystallization enthalpies (ΔHc), normalized in terms of nominal clay contents, decrease with increasing cooling rate for all samples. At higher cooling rates, there is less time for polymer chains to be crystallized, resulting in the lower crystallization enthalpies. The required cooling rates to achieve totally amorphous material can be obtained with extrapolation of the lines to the X-axis in Figure 9. Based on results shown in the last line in Table 3, extruded PET is expected to remain completely amorphous when cooled at 89℃/min. Similarly, the PET–water samples and 0.5 wt% nanocomposites can be quenched into the amorphous state at higher cooling rates.
Crystallization behavior of PET/clay nanocomposites at different cooling rates. Normalized DSC data for PET/clay nanocomposites at different cooling rates. PET: poly(ethylene terephthalate); MMT: montmorillonite; CMMT: centrifuged clay; DSC: differential scanning calorimetry.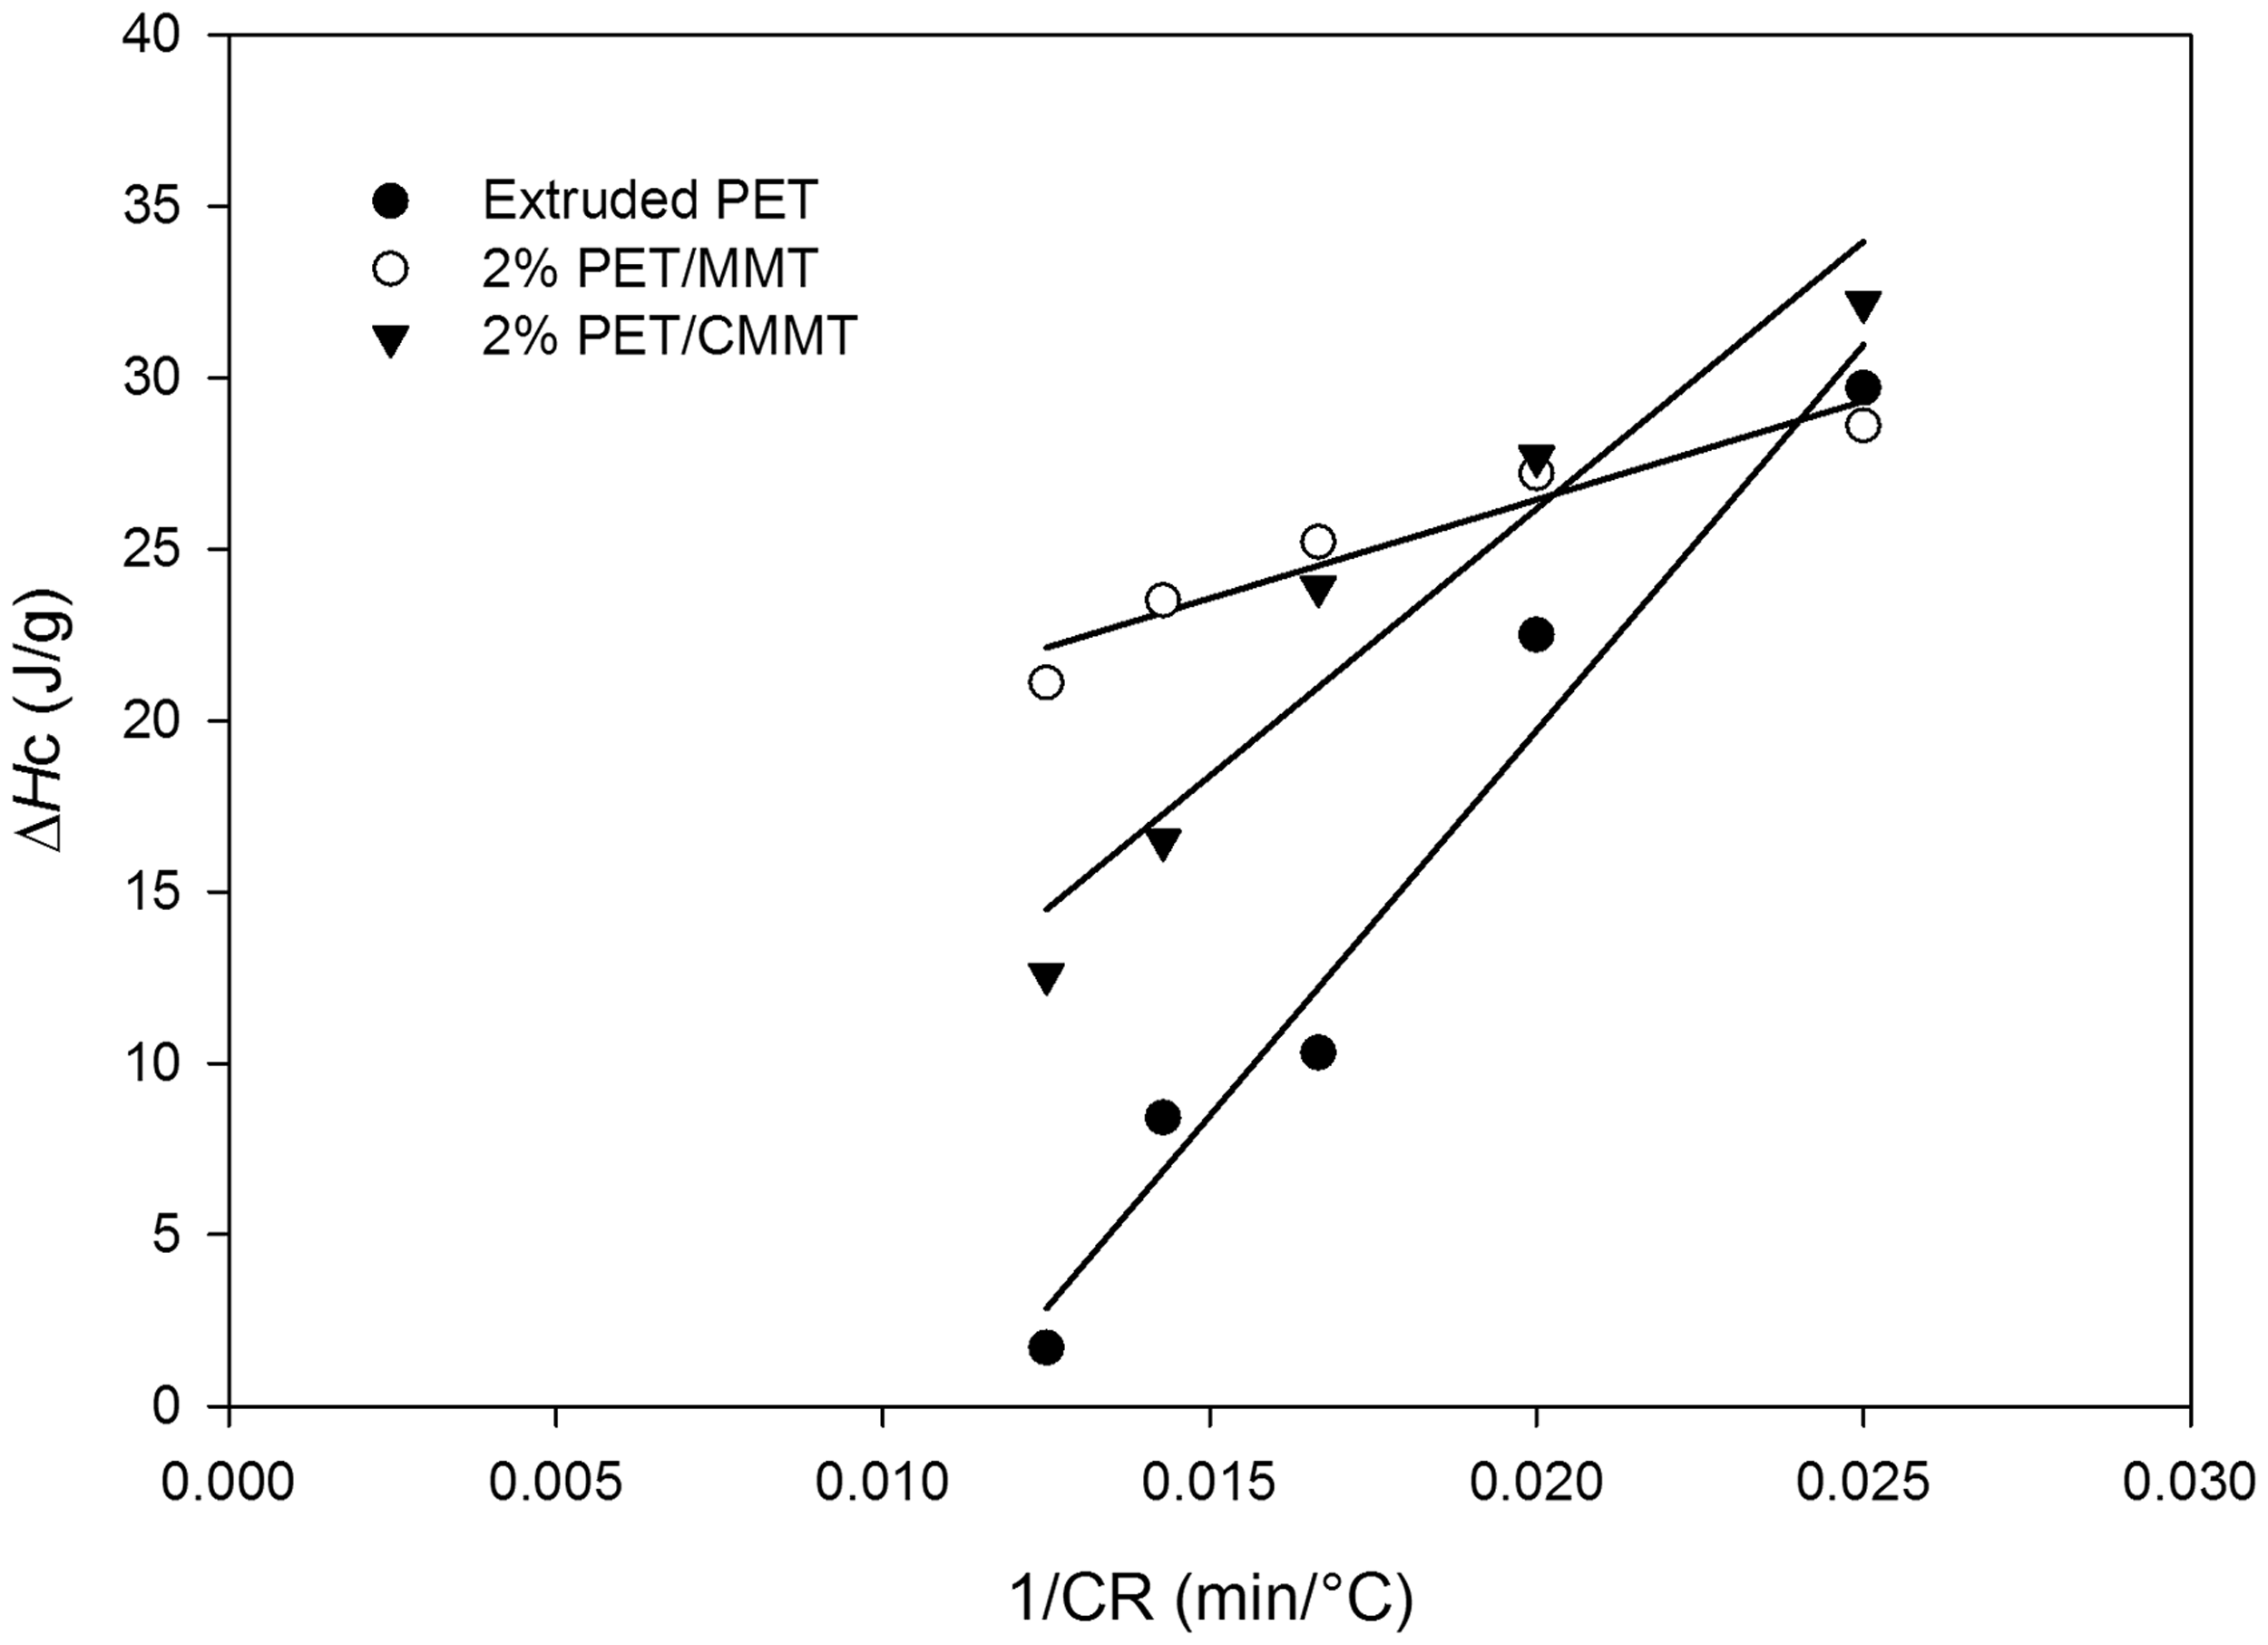
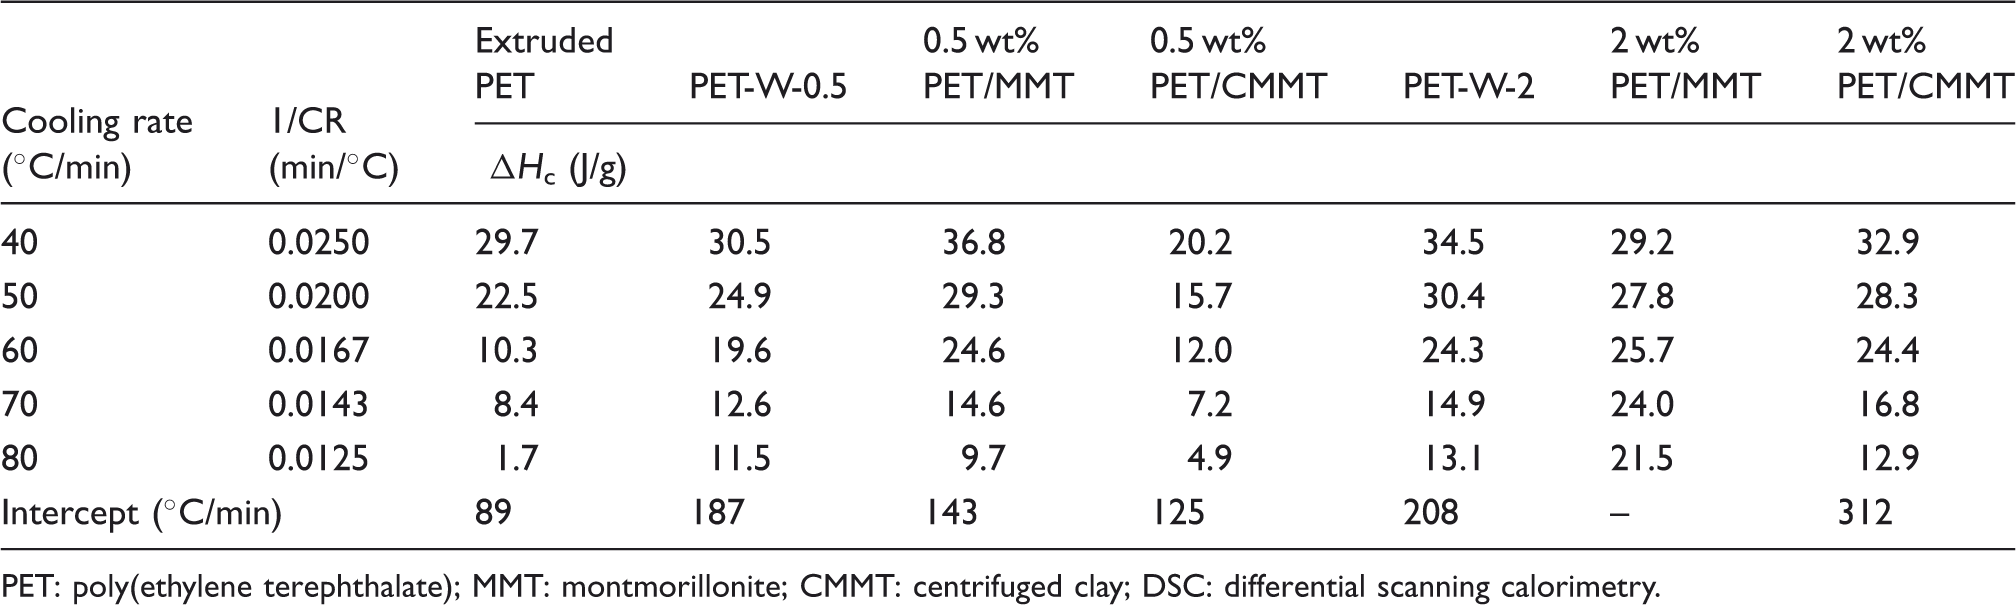
Crystallization temperatures for PET/clay nanocomposites at different cooling rates.
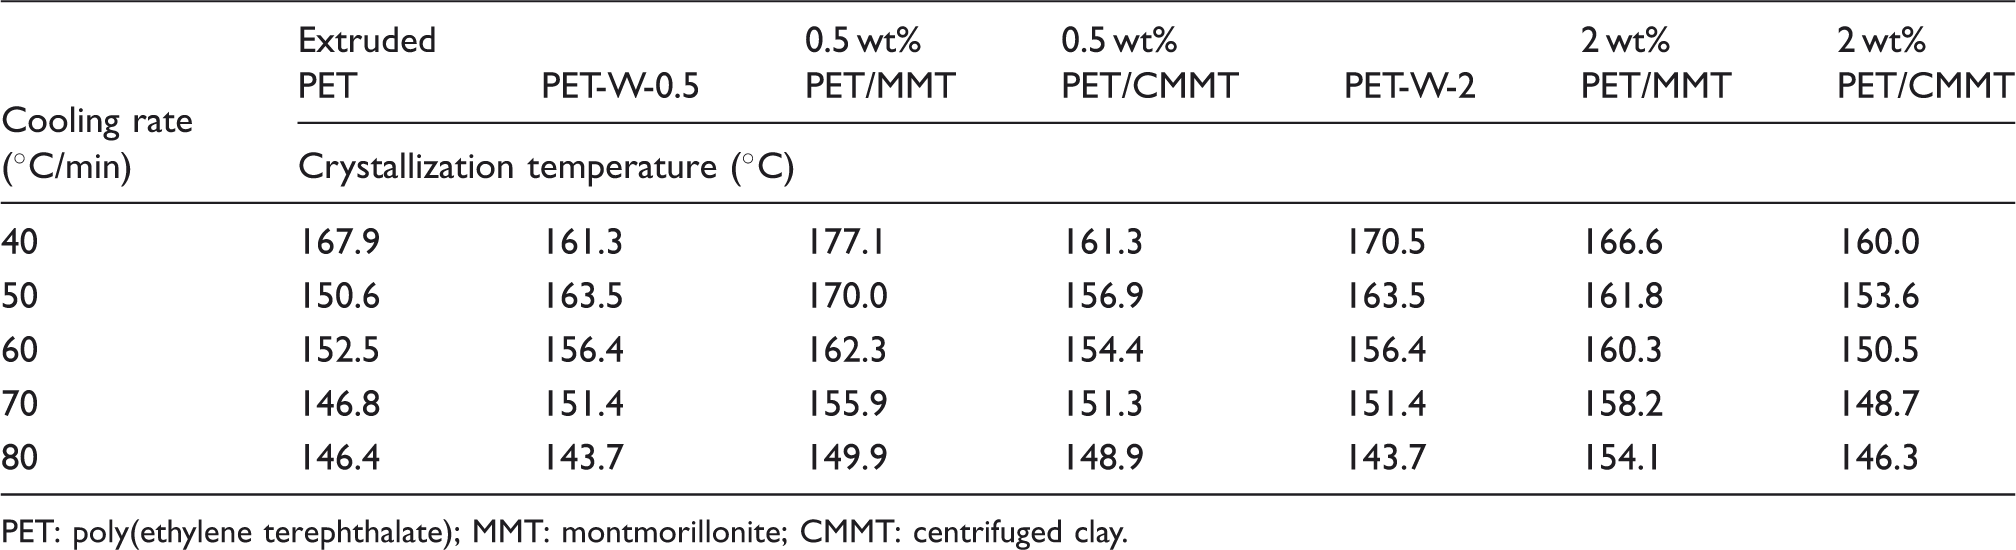
PET: poly(ethylene terephthalate); MMT: montmorillonite; CMMT: centrifuged clay.
Conclusions
The effects of nanoclay particle size distributions on the dispersion, rheological, and crystallization behaviors of PET/clay nanocomposites were investigated. Centrifuged clay (CMMT) was prepared by removing large aggregates from the commercial clay (MMT). A SEM micrograph of aqueous dispersion of CMMT showed small particles of sizes not exceeding 100 nm, while MMT in water consisted of larger aggregate sizes. Shifting in the peak position to a lower angle in the XRD pattern indicated the delamination of nanoparticles after centrifugation compared to the original MMT. PET/clay nanocomposite samples with MMT and CMMT were prepared using a co-rotating twin screw extruder to determine the effect of particle size distribution of nanoclays on the dispersion of PET/clay nanocomposites. TEM revealed an improvement in the dispersion of centrifuged nanoclays into the polymer matrix for both 0.5 wt% and 2 wt% of nanocomposites compared to MMT that had not been centrifuged.
Melt viscosity showed that well-dispersed nanoparticles may have a shielding effect in the polymer matrix reducing mass transport rates during the degradation process. DSC data indicated that MMT and CMMT act as nucleating agents, which accelerated the rate of crystallization; however, the level of crystallization is lower in the case of CMMT nanocomposites. Non-isothermal crystallization behaviors at different cooling rates show that in the case of the 2 wt% PET/ MMT nanocomposite, the material crystallizes even when quenched at an infinite rate, while 2 wt% PET/ CMMT nanocomposite can be quenched into the amorphous state at high cooling rates. Nanocomposites prepared with CMMT show better dispersion in comparison to the samples prepared with commercial MMT. The preparation of nanocomposites by using clay with smaller and more uniform particle sizes can lead to samples with better properties.
Footnotes
Funding
The authors gratefully acknowledge PET research consortium for their kind support of this research.
Conflict of interest
None declared.