
Abstract
Fibre-reinforced composites are an important field of composite research and are used in an enormous range of applications from special high-tech applications such as aeronautics to consumer goods such as sporting goods. The objective of this study is to assess the monetary value of fibres to be used for reinforcement in composites by the relation of price and certain fibre properties. To model this, relationship data from different types of technical fibres were used. An economic approach is used to identify the determinants of fibre value. In total, four regression models were calculated. The models give an impression of the impact of the explanatory variables. This work shows that the evaluation of the economic value of a reinforcement fibre by technical properties is feasible.
Introduction
The reinforcement of polymers with fibres presents itself as evermore virulent research field. It is, on one hand, the type of fibres from natural to synthetic ones and from natural to industrially processed ones, and on the other, the compounding with different kinds of polymer matrices.
In the field of fibre-reinforced composites, industry heavily pushes scientific research efforts. This material group has an enormous range of applications from special high-tech applications such as aeronautics to consumer goods such as sporting goods.
In 2010, the global composite materials industry reached a total value of US $17.7 billion at an annual growth rate of 10.3%. 1 The share of fibres of the global revenue of the composite materials market is estimated to be as high as US $7.7 billion. 1
Providing strength and stiffness, the fibre reinforcement is crucial for the performance of a composite in most cases. Considering that, unsurprisingly, fibres can also be an expensive raw material for composite producers. Bader 2 states that the feedstock makes up more than 40% of the total costs in a conventional composite production process. Fibre costs can range from as inexpensive as US $0.22/kg for flax fibres 3 up to more than US $200/kg for non-aero grades of carbon fibres.
Glass fibres (US $1.30/kg to US $2.00/kg according to
New fibres especially from renewable resources are used and developed for reinforcement purposes in composites to provide increased sustainability (e.g.
Along with material component research, new processing technologies are developed and tested in consideration of industrial application – a huge amount of publications can be found on these topics.9,10 Sapuan and Abdalla 11 developed a prototype knowledge-based system for the material selection of polymeric-based composites for automotive components. Their system was created to facilitate the selection of materials in composite development based on predefined criteria and constraints. 11
As often, when new products are developed or existing products are used in new applications, the market potential is an important question to be addressed. 12 While total market volumes are comparably easy to assess by secondary data and industrial capacity information, it is particularly hard to assess the value of a product in question due to high uncertainty. 13
Both volume and price information can be assessed in context to product properties. Such an assessment is particularly difficult to apply but can be of great value in terms of advanced product development. 14 Knowledge regarding possible relationships between product properties and the according demand (volume and price) is essential for economic efficient technical development. 14
Problem description and objective
A large and ever-increasing number of technical fibres are available for utilization as reinforcement in composite materials. Product development could be organized in a more efficient way by taking the current market demand into account.
This paper tries to use the market-based pricing approach 15 and connect the product performance to the product value. 16
Hence, the objective of this study is to assess the monetary value of fibres to be used for reinforcement in composites by the relation of price and certain properties of fibres that are already in use.
In order to achieve these goals, the paper proposes a method to estimate the market value of a reinforcement fibre before entering the market. The market value will be estimated based on technical properties, an adjustment of technical properties will be possible before the fibre is produced and brought to the market.
Theoretical background – Pricing
Phillips 15 states three aspects that should be taken into account when deciding on a product price. A pricing decision should include the costs, the competition and the consumer demand or the willingness to pay.
Traditional pricing approaches (Phillips, 2005).
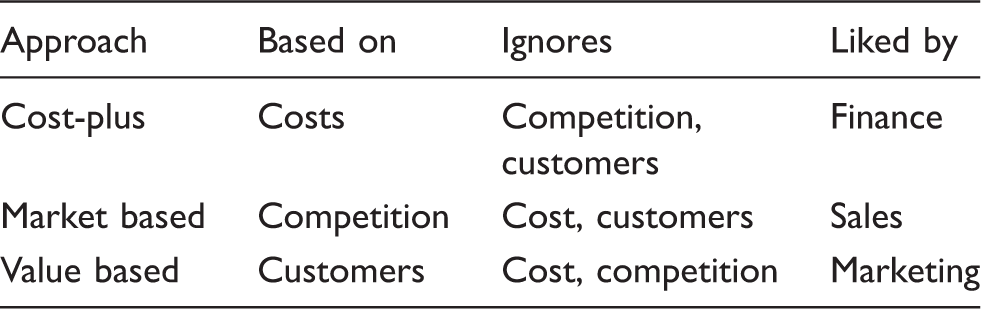
The pricing method mentioned second is the orientation on established market prices.17,18 Abratt and Pitt 19 studied the pricing practices in the construction and the chemical industry and found that ‘the most important factors that influence pricing in both industries are cost and competitor’s price’. In commodity markets, this method is often used, 15 contrary to speciality markets due to the incomparability of the products. A method used in high-tech technologies is so-called price-performance curve. The basic idea of price-performance curves is to show the relationship between the performance of products and market prices and to help to find a niche and/or place in the market that is not yet occupied by others. 16 For consumer goods markets, studies have been done addressing price-quality relations. These relations are not expressed by a curve, but by calculation of correlations.
The third approach shown in Table 1 is value-based pricing, which focuses on the consumers and their willingness to pay. Value-based pricing is another denotation for preference data-derived methods. It is often associated with consumer surveys, focus groups and other methods like conjoint analysis.15,18 In a German study, e.g. the quality was correlated to the price in the food market using product test findings from ‘Stiftung Warentest’, a consumer protection organisation, for the measurement of quality. 20 The overall assessment of these product tests already included a weighting of the tested categories and their combination to an index. 20
Material and methods
To model the relationship between technical properties and value of reinforcement fibres, data from different types of technical fibres were used. The technical properties used as explanatory variables in the regression model were chosen due to their availability for all fibre types. A classification of existing fibres is presented in Figure 1. Not all the fibres that can be seen in the figure were included in the study, some of them being produced for textiles as f.e. Lyocell or Elastan.
Classification of fibres; underlined fibres are included in the models20,21 (based on 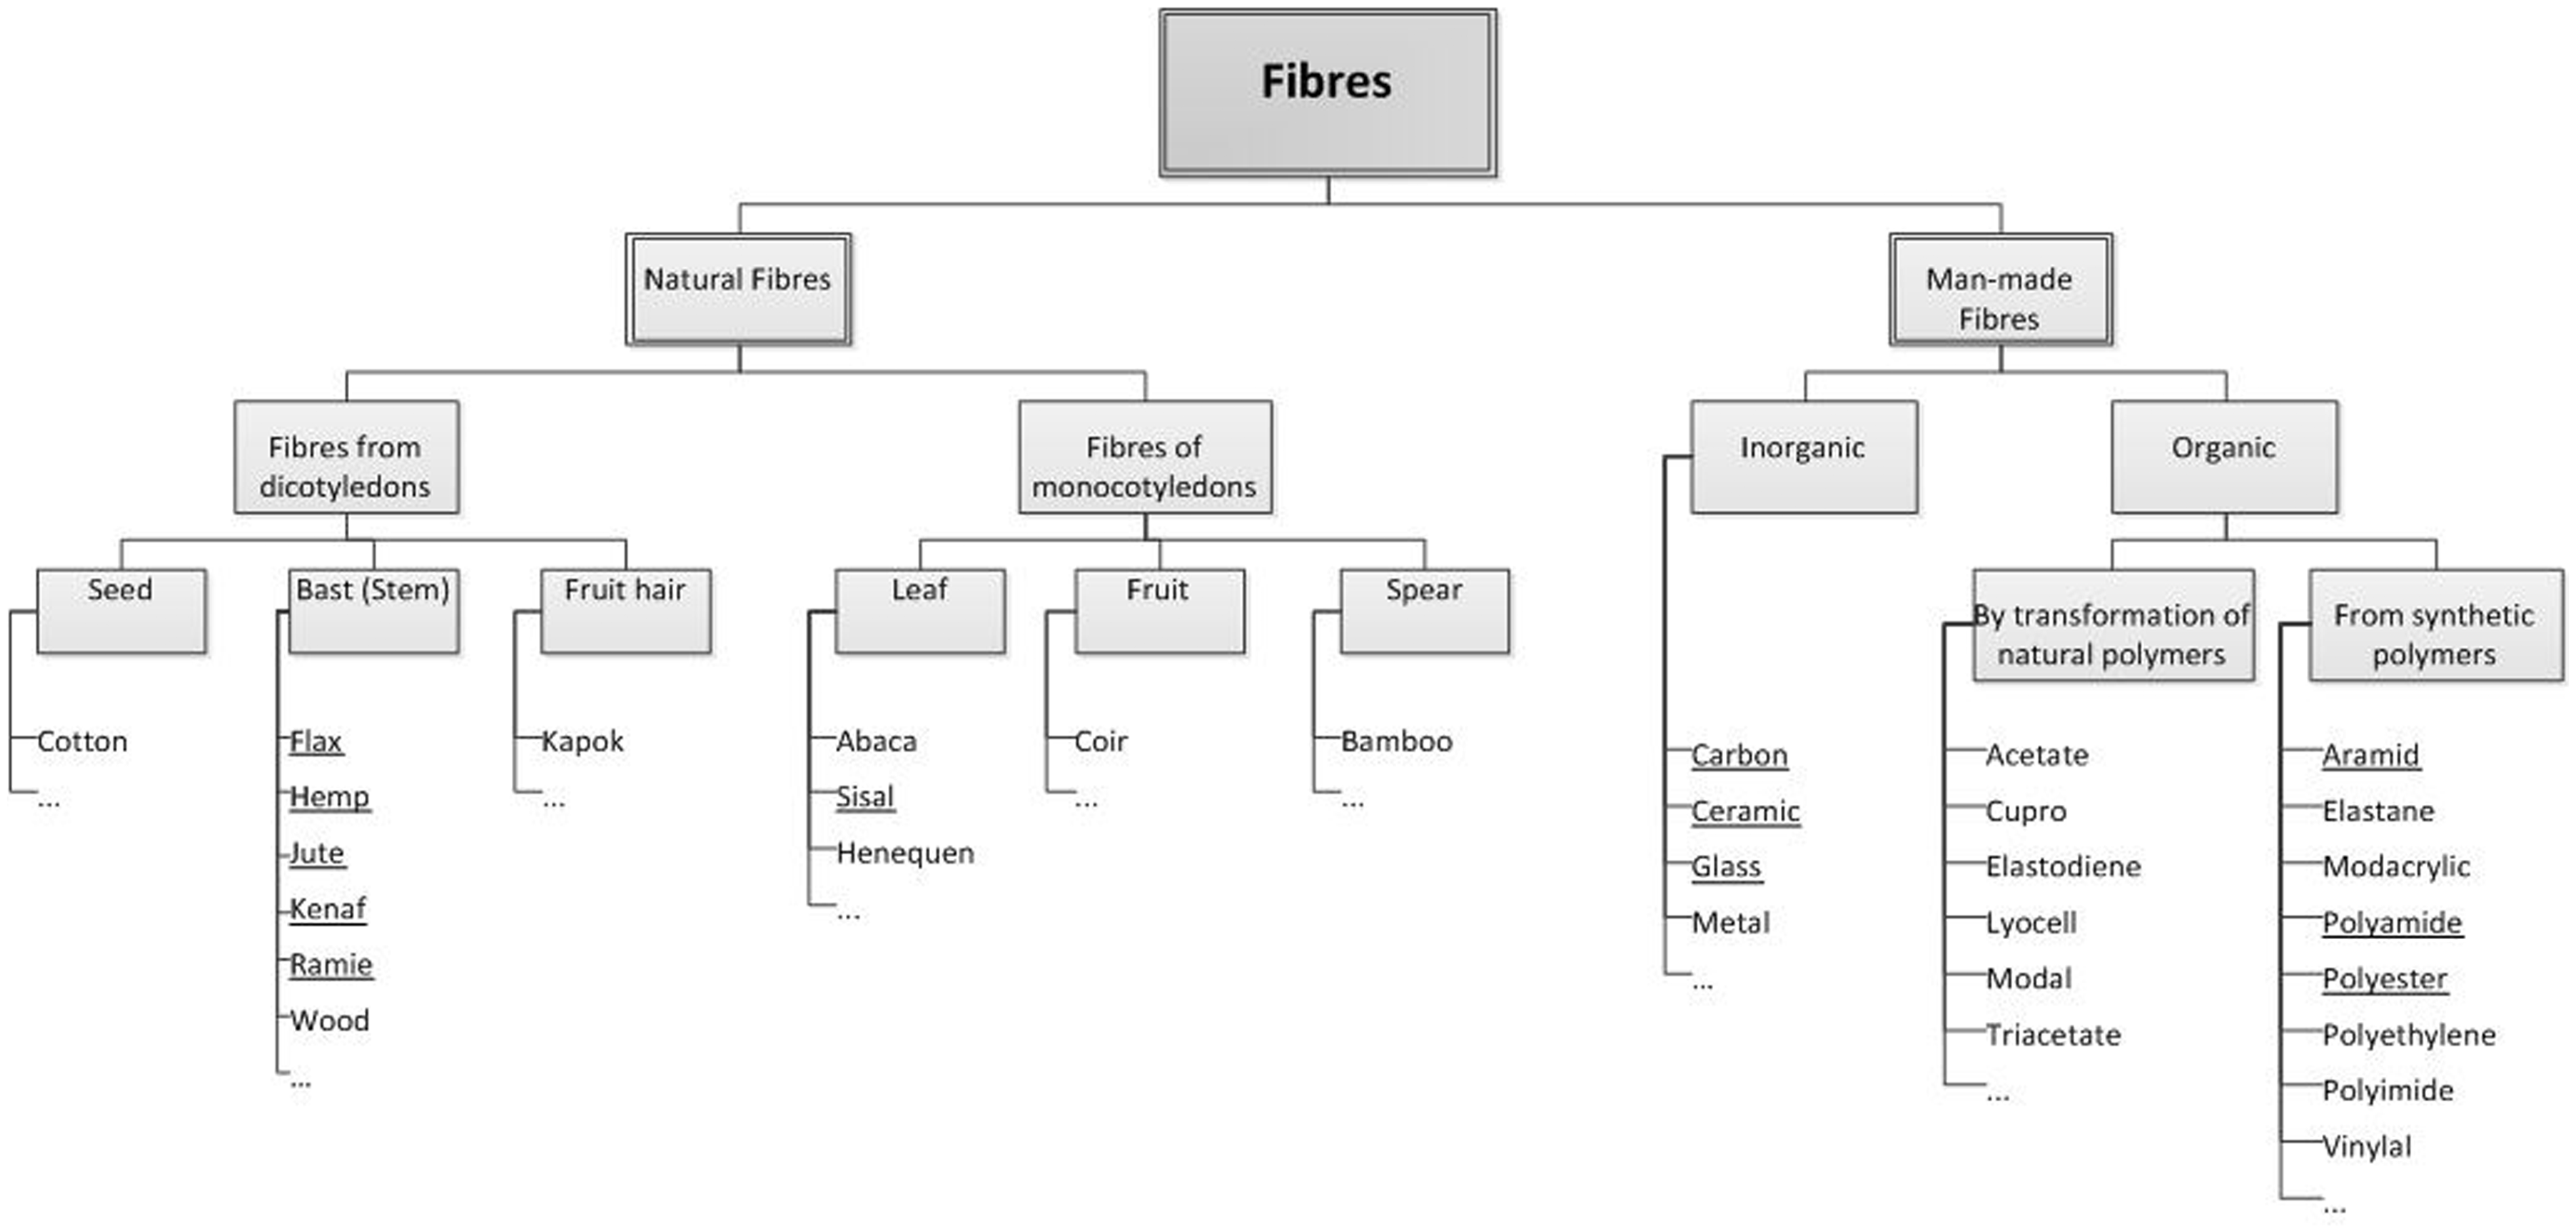
A study by Smeder and Liljedahl 22 identified important flax fibre properties in different application fields. Fibre properties of primary interest were fibre dimensions (density and l/d ratio), fibre strength and fibre chemistry. As the collected fibre types, mostly are man-made fibres that can be produced endlessly, the fibre length is less interesting, the l/d ratio is also mostly used for natural fibres due to the fact that these fibres cannot be produced endlessly. For the present multiple regression model, five technical properties were used as explanatory variables: tensile strength (MPa), modulus of elasticity (GPa), density (g/cm3), elongation at break (%) and fibre fineness (tex). The explained variable is value (US $/kg). The mentioned technical properties were selected for two main reasons. First, the technical properties used were abundant for all fibres – it was impossible for all fibre types to collect other properties of interest such as resistance to water, chemicals and heat. The second reason is that especially modulus of elasticity (GPa), tensile strength (MPa) and density (g/cm3) are important properties for reinforcement fibres, as stated by e.g. Smeder and Liljedahl. 22
Data collection
An iterative research design was chosen starting with data collection and followed by calculation of explanatory power and adjustment of variables. A schematic illustration of the iterative process is shown in Figure 2.
Schematic illustration of the research design.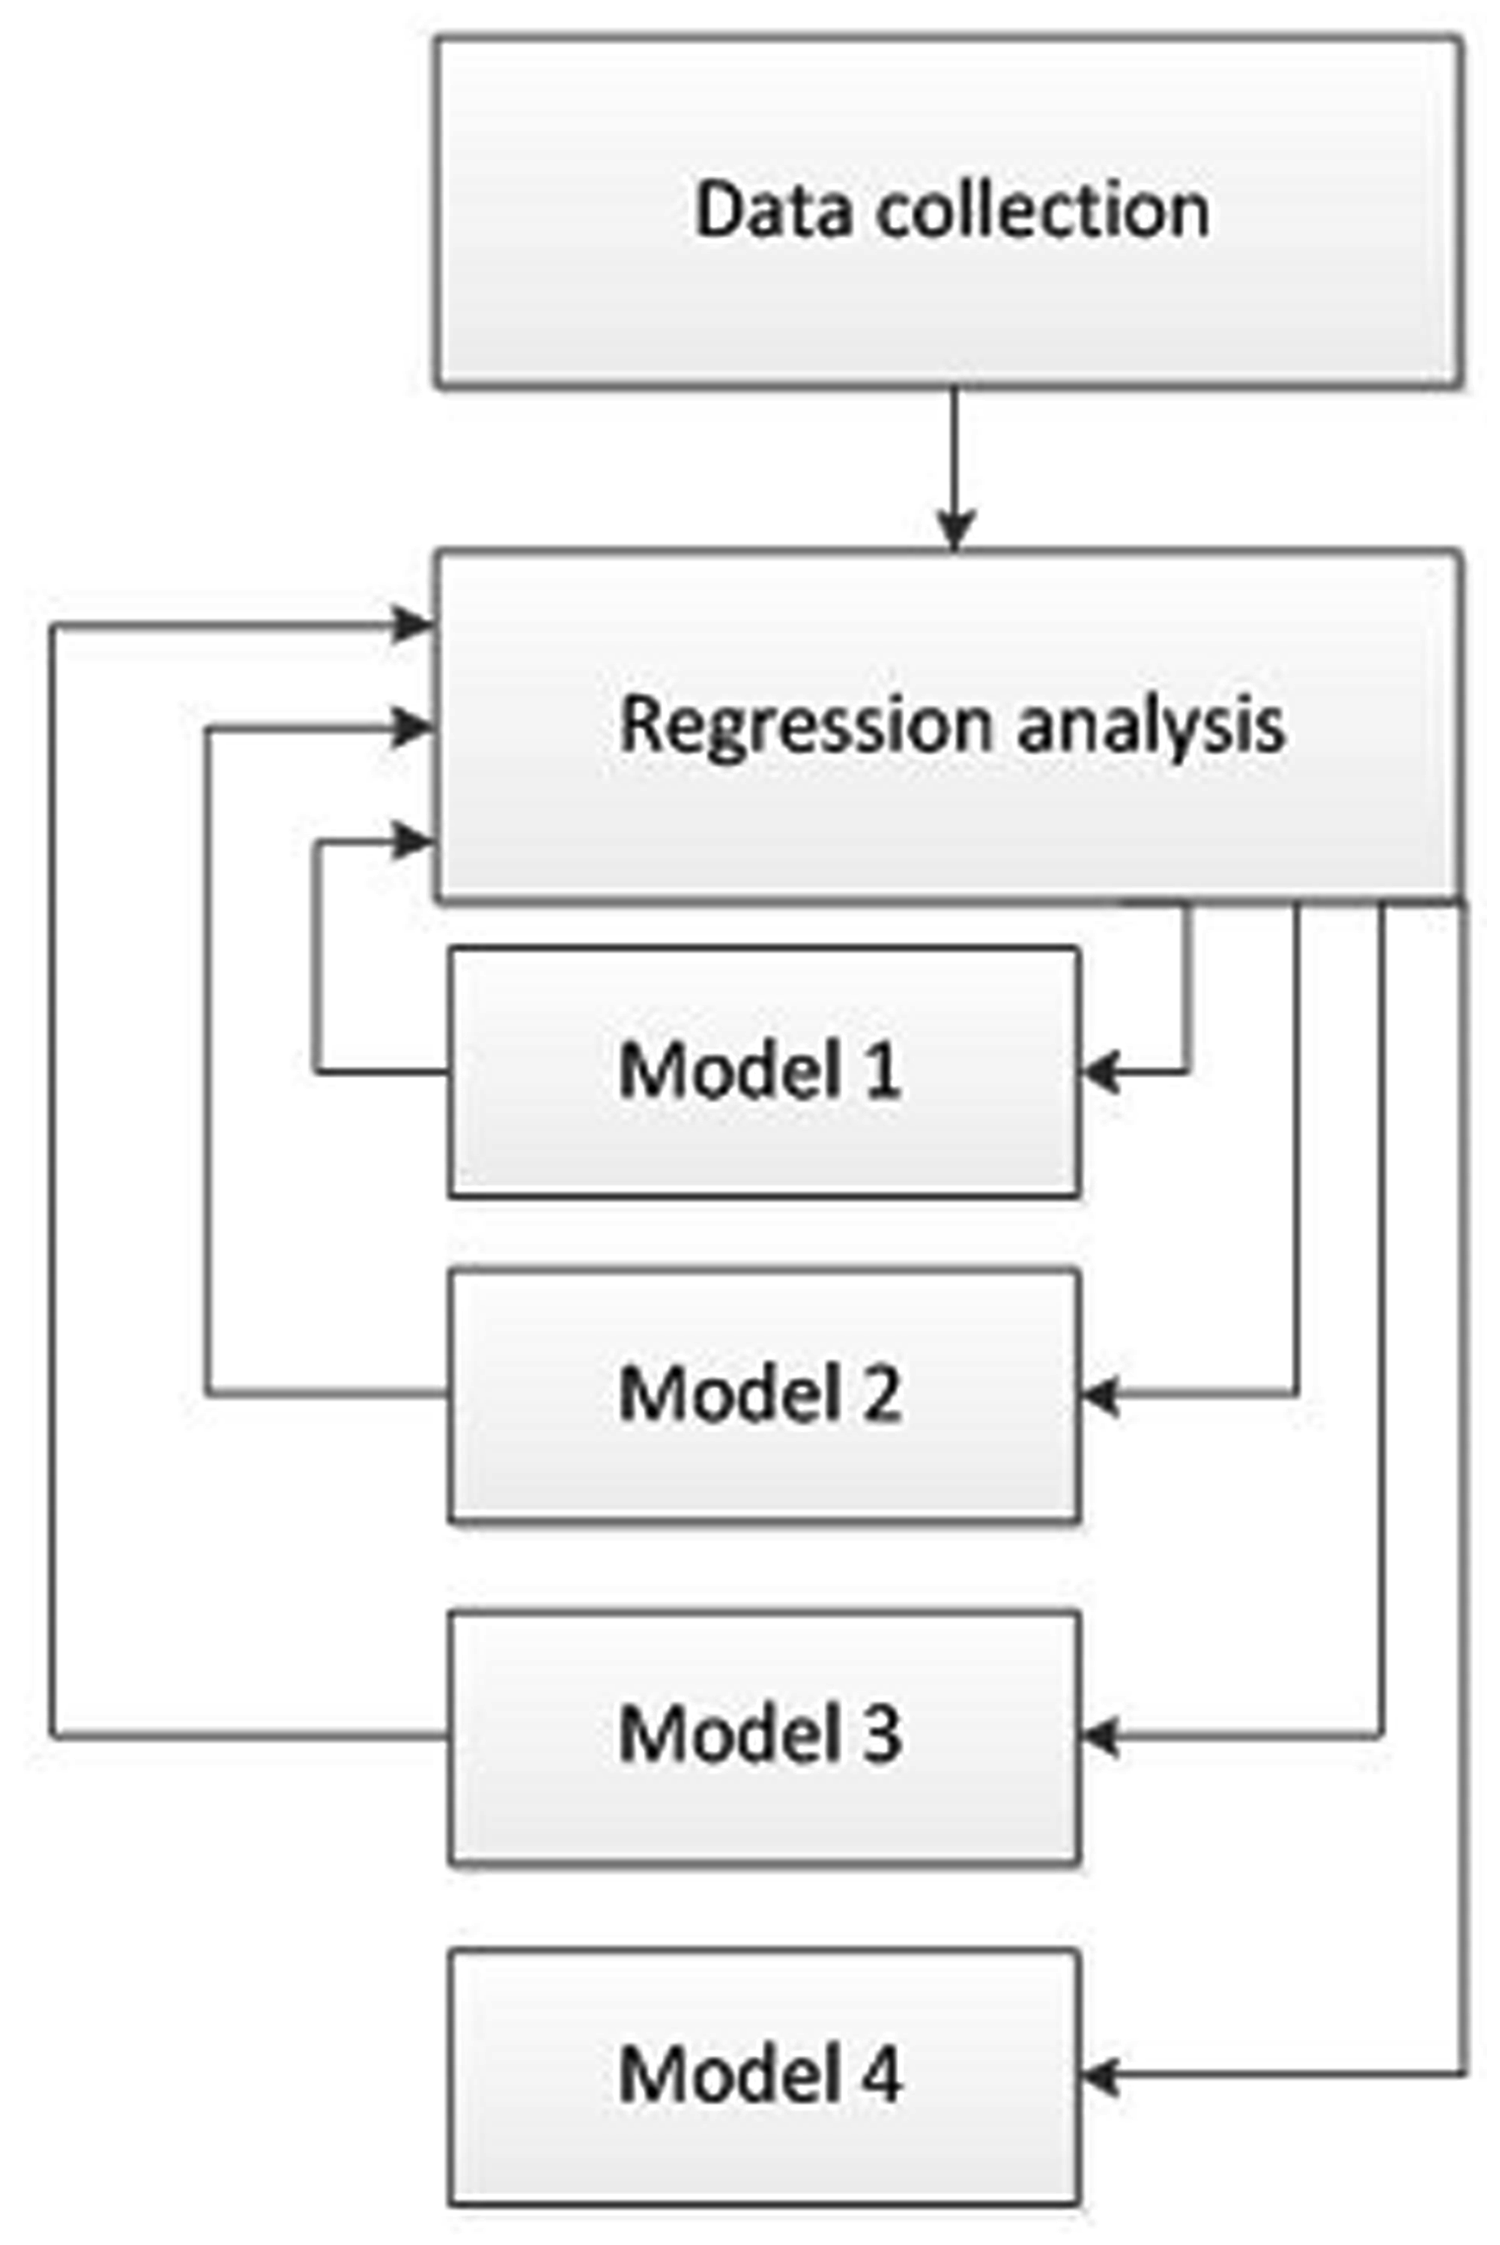
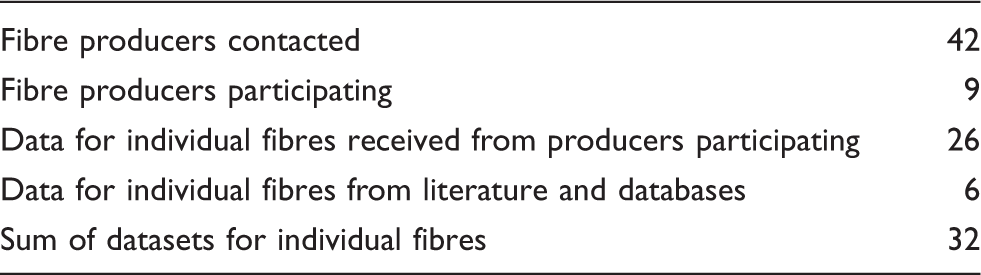
The first step in the process of fibre collecting was to build up a list of fibre producers and their products. Five groups of fibre producers were separated: carbon fibre producers, glass fibre producers, polymer fibre producers, natural fibre producers and metallic and ceramic fibre producers; all together, about 53 producers were identified. In a first step, five producers of each group were contacted by e-mail. In a second round, another 17 companies were contacted. The remaining 11 fibre producers were not contacted, because their products did not match the object of investigation. Fibre producers were informed about the scope of the thesis and asked to provide data on selected fibres, mostly three to five different products. Data requested were the tensile strength in megapascals (MPa), modulus of elasticity in gigapascals (GPa), density in gram per cubic centimetre, elongation at break in percentage, fibre fineness in tex and the price in US$ for 50 kg without any taxes or shipment.
Only nine of the contacted companies gave information on their products, none being a producer or processor of natural fibres. So, price data for natural fibres were collected using United Nations Commodity Trade Statistics Database. Data for the years 2002 to 2006 were used in the classification H2 being the 2002 revision of the so-called Harmonized System that is used for reporting import and export data on commodities. The value of the fibres was gained through the division of export values by the export quantities. The fibre values were weighted, and then the arithmetic mean was used as a proxy for the market value in the regression models. Technical properties of natural fibres were taken from literature. 23
With the exception of natural fibres being staple fibres, only artificial fibres that can be produced continuously were included in the model.
Data collection for the valuation of fibres.
Raw data used for the calculation of the regression models.
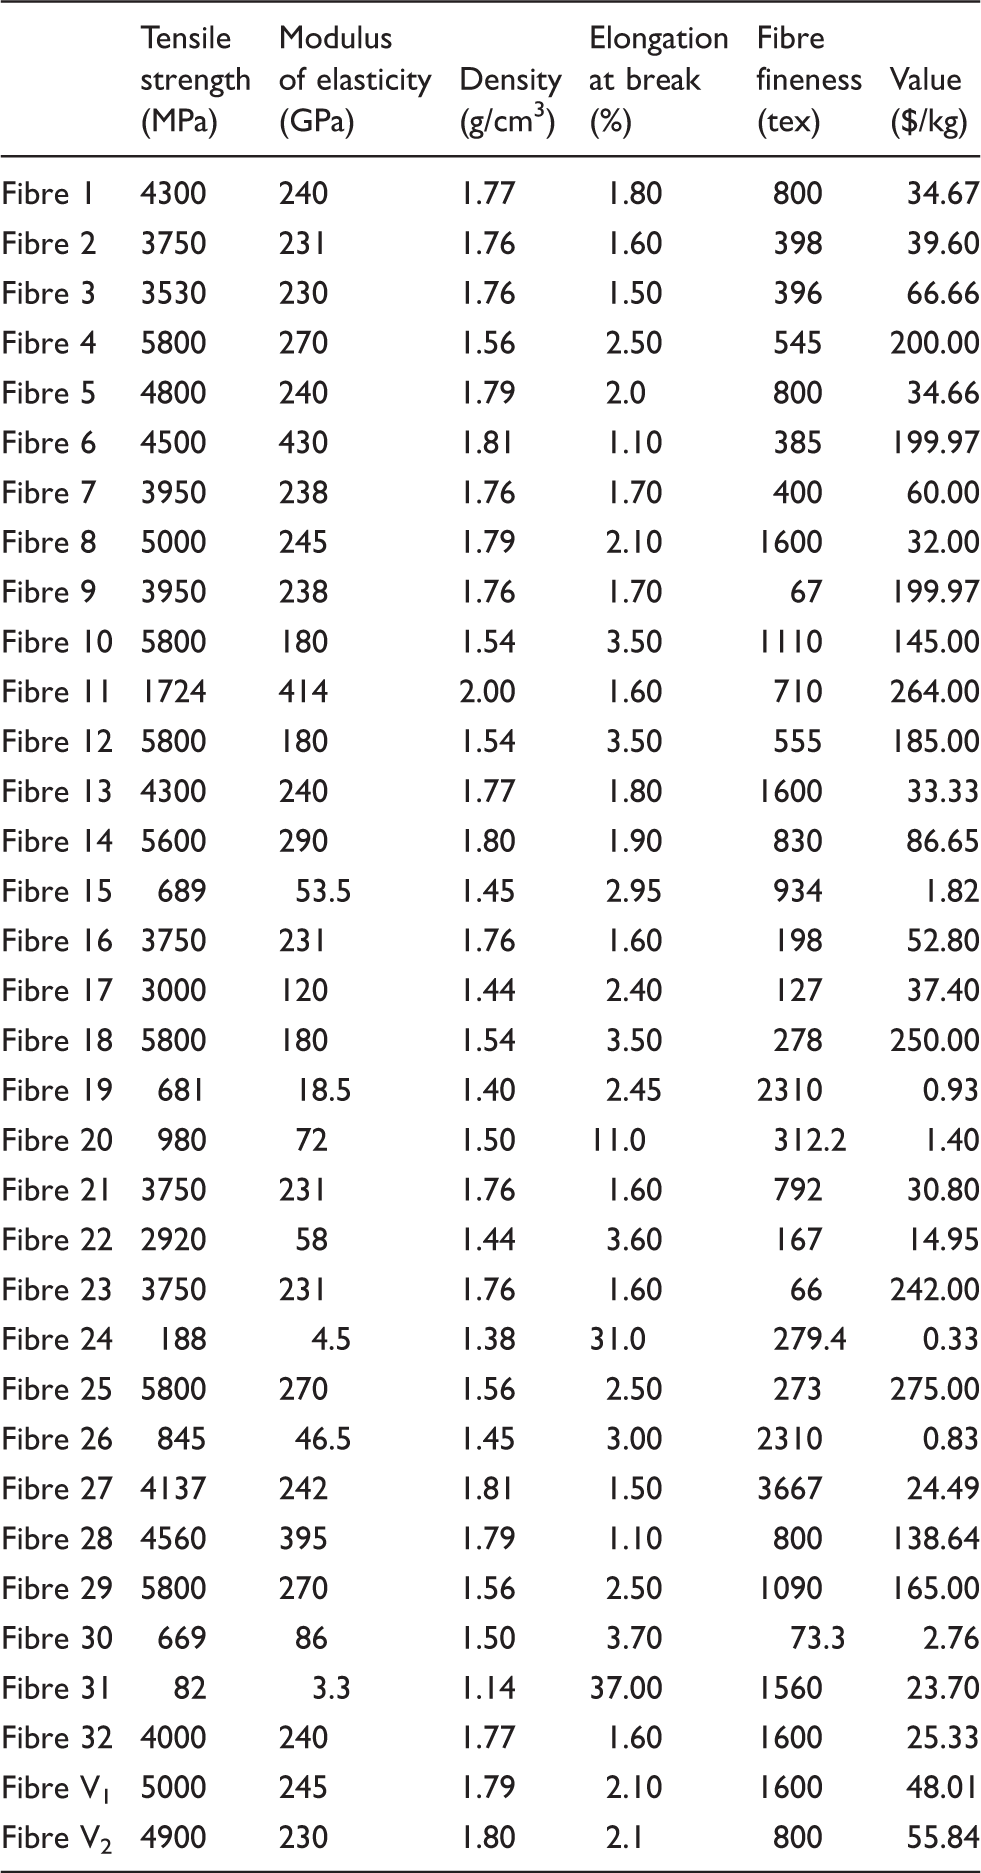
Considering the value column in Table 3, it is indicated that Fibre 24 is cheapest with 0.33 US $/kg while the most expensive fibre in the data set (Fibre 25) costs 275 US $/kg. Furthermore, Fibre 31 has a very low-tensile strength of 82 MPa, in contrast to Fibres 4, 10, 18, 25 and 29 with 5800 MPa. The range of modulus of elasticity is between 3.3 GPa (Fibre 31) and 430 GPa (Fibre 6). Density values lie between 1.14 g/cm3 (Fibre 31) and 2.00 g/cm3 (Fibre 11). Fibre 31 further spans the range for elongation at break with the highest value of 37% in contrast to 1.1% of Fibre 6. Considering the fineness, the values lie between 66 tex (Fibre 23) and 3667 tex (Fibre 27).
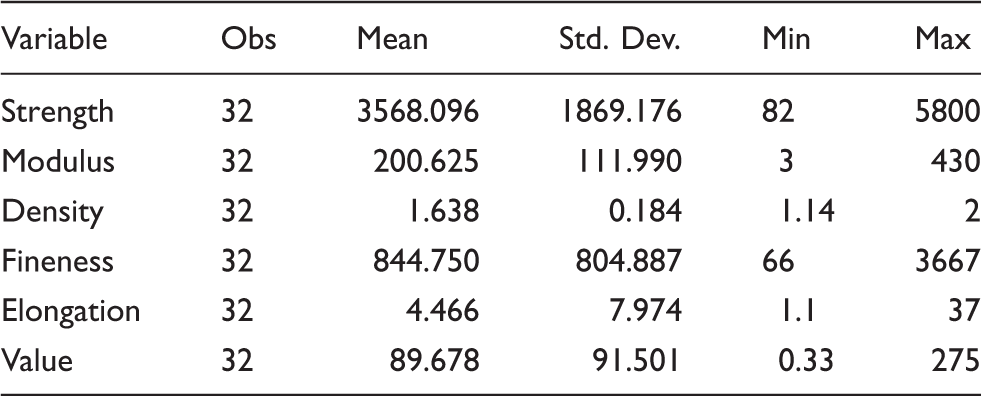
Descriptive statistics used in the regression models, n = 32.
Results
In order to identify the determinants of fibre value, an econometric approach was used in this study.
Summary of multiple regression parameters for the calculated regression models (n = 32).
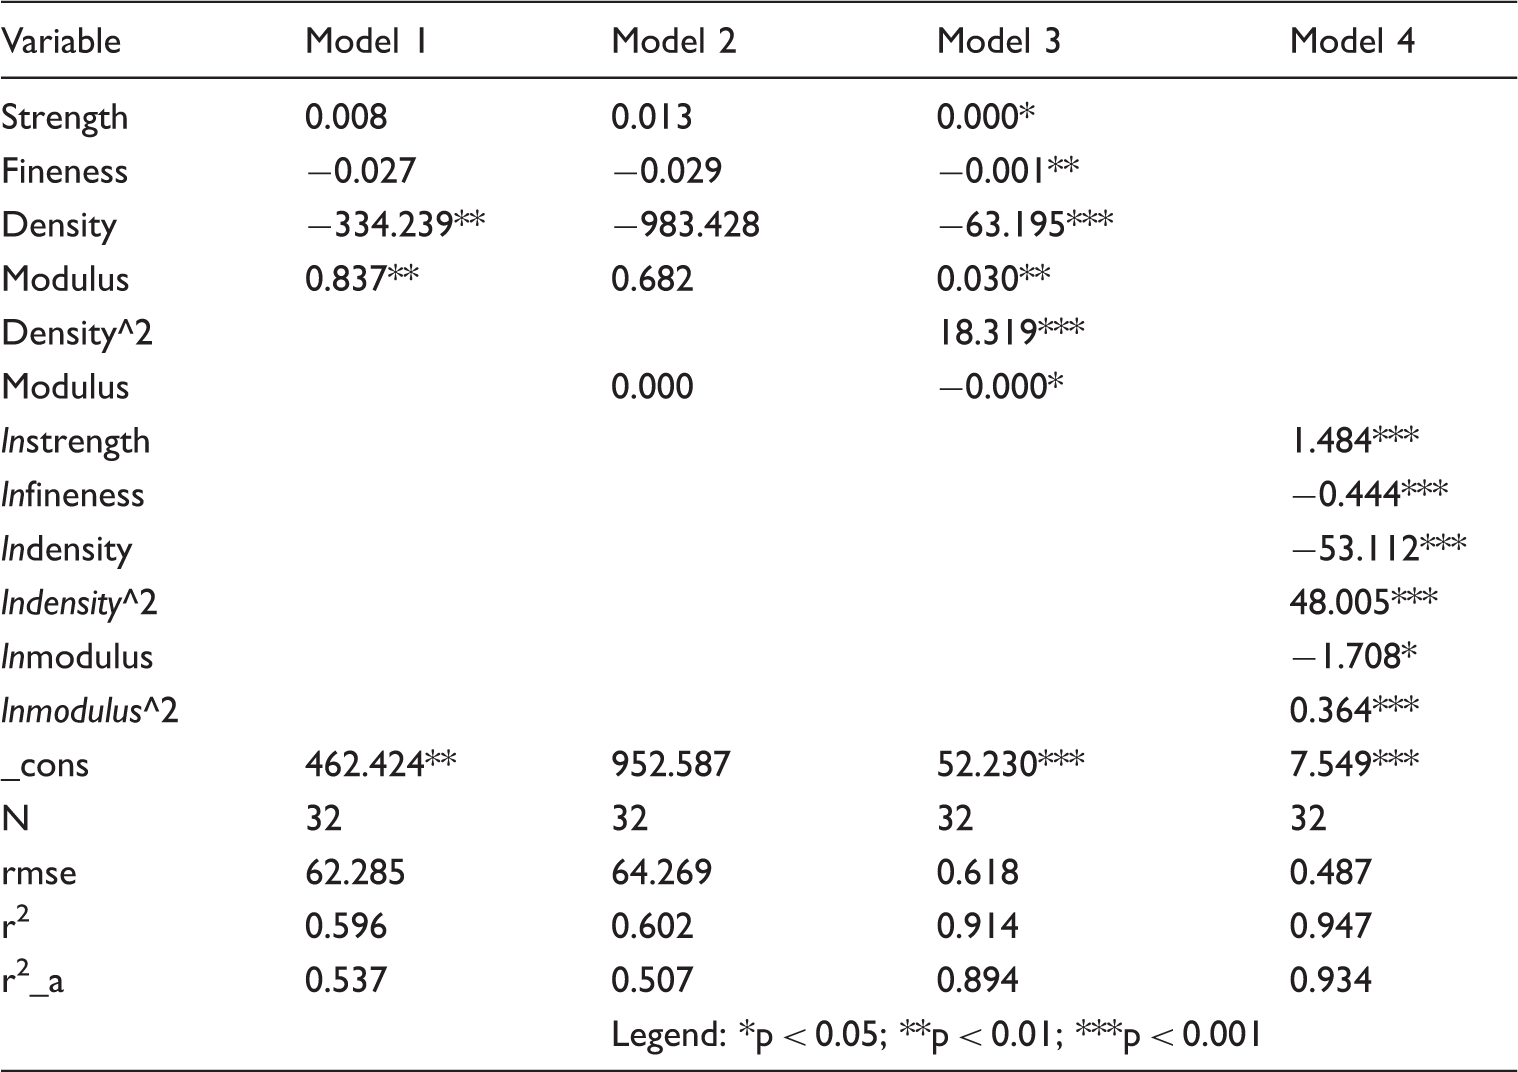
Taking logarithms of the dependent variables, ‘value’ (model 3) turns the coefficients of the explaining variables significant. Taking logarithms has the positive effect of transforming the skewed distribution of ‘value’ closer to a normal distribution, which has nicer properties within the linear regression framework.
Finally, in model 4 also, the independent variables were transformed by taking logarithms. The effect is an increase in the statistical significance of almost all variables, which might be traced back to the non-linearity of most of the original independent variables. Taking logarithms turns them into more linear variables.
Furthermore, variables in log-scale have the nice property that their coefficients can be interpreted in terms of elasticities.
When interpreting model 4, which performs best among those four models, the first comment is owed to the high-statistical significance of the coefficients with the exception of ‘lnmoe’, which is only significant at the 90%-level.
When it comes to interpreting the coefficients (from now on always with respect to model 4), a 10% increase in strength leads on average to a 14.8% increase in value. Also, the coefficient of fineness has the expected sign. A decrease in 10% of fineness (tex) increases the value of the fibre by 4.4%. The interpretation for modulus and density is not that straightforward since they are included in the regression two times: as first with their original value and then another time with squared values. Also note that the signs of the coefficients are of opposite direction. In order to understand the effect of a change in density on the value, both coefficients have to be combined. The result is best summarized in Figure 3. In this figure, we can see the non-linear nature of the value-density-relationship. The lower the unit of density, the higher is the effect of density on the overall value. This might at first seem rather confusing, but one has to consider the effect of density ceteris paribus, which means that everything else is kept unchanged. For instance, Figure 3 shows comprehensible, the change in value that is due to a decrease in density when keeping all other variables at their mean. This ceteris-paribus comparison usually works well around the mean of the variables in question. It however will lead to rather strange conclusions when looking at the extreme ends of the distribution.
Cet. par. effect of density (g/cm3) on value ($/kg).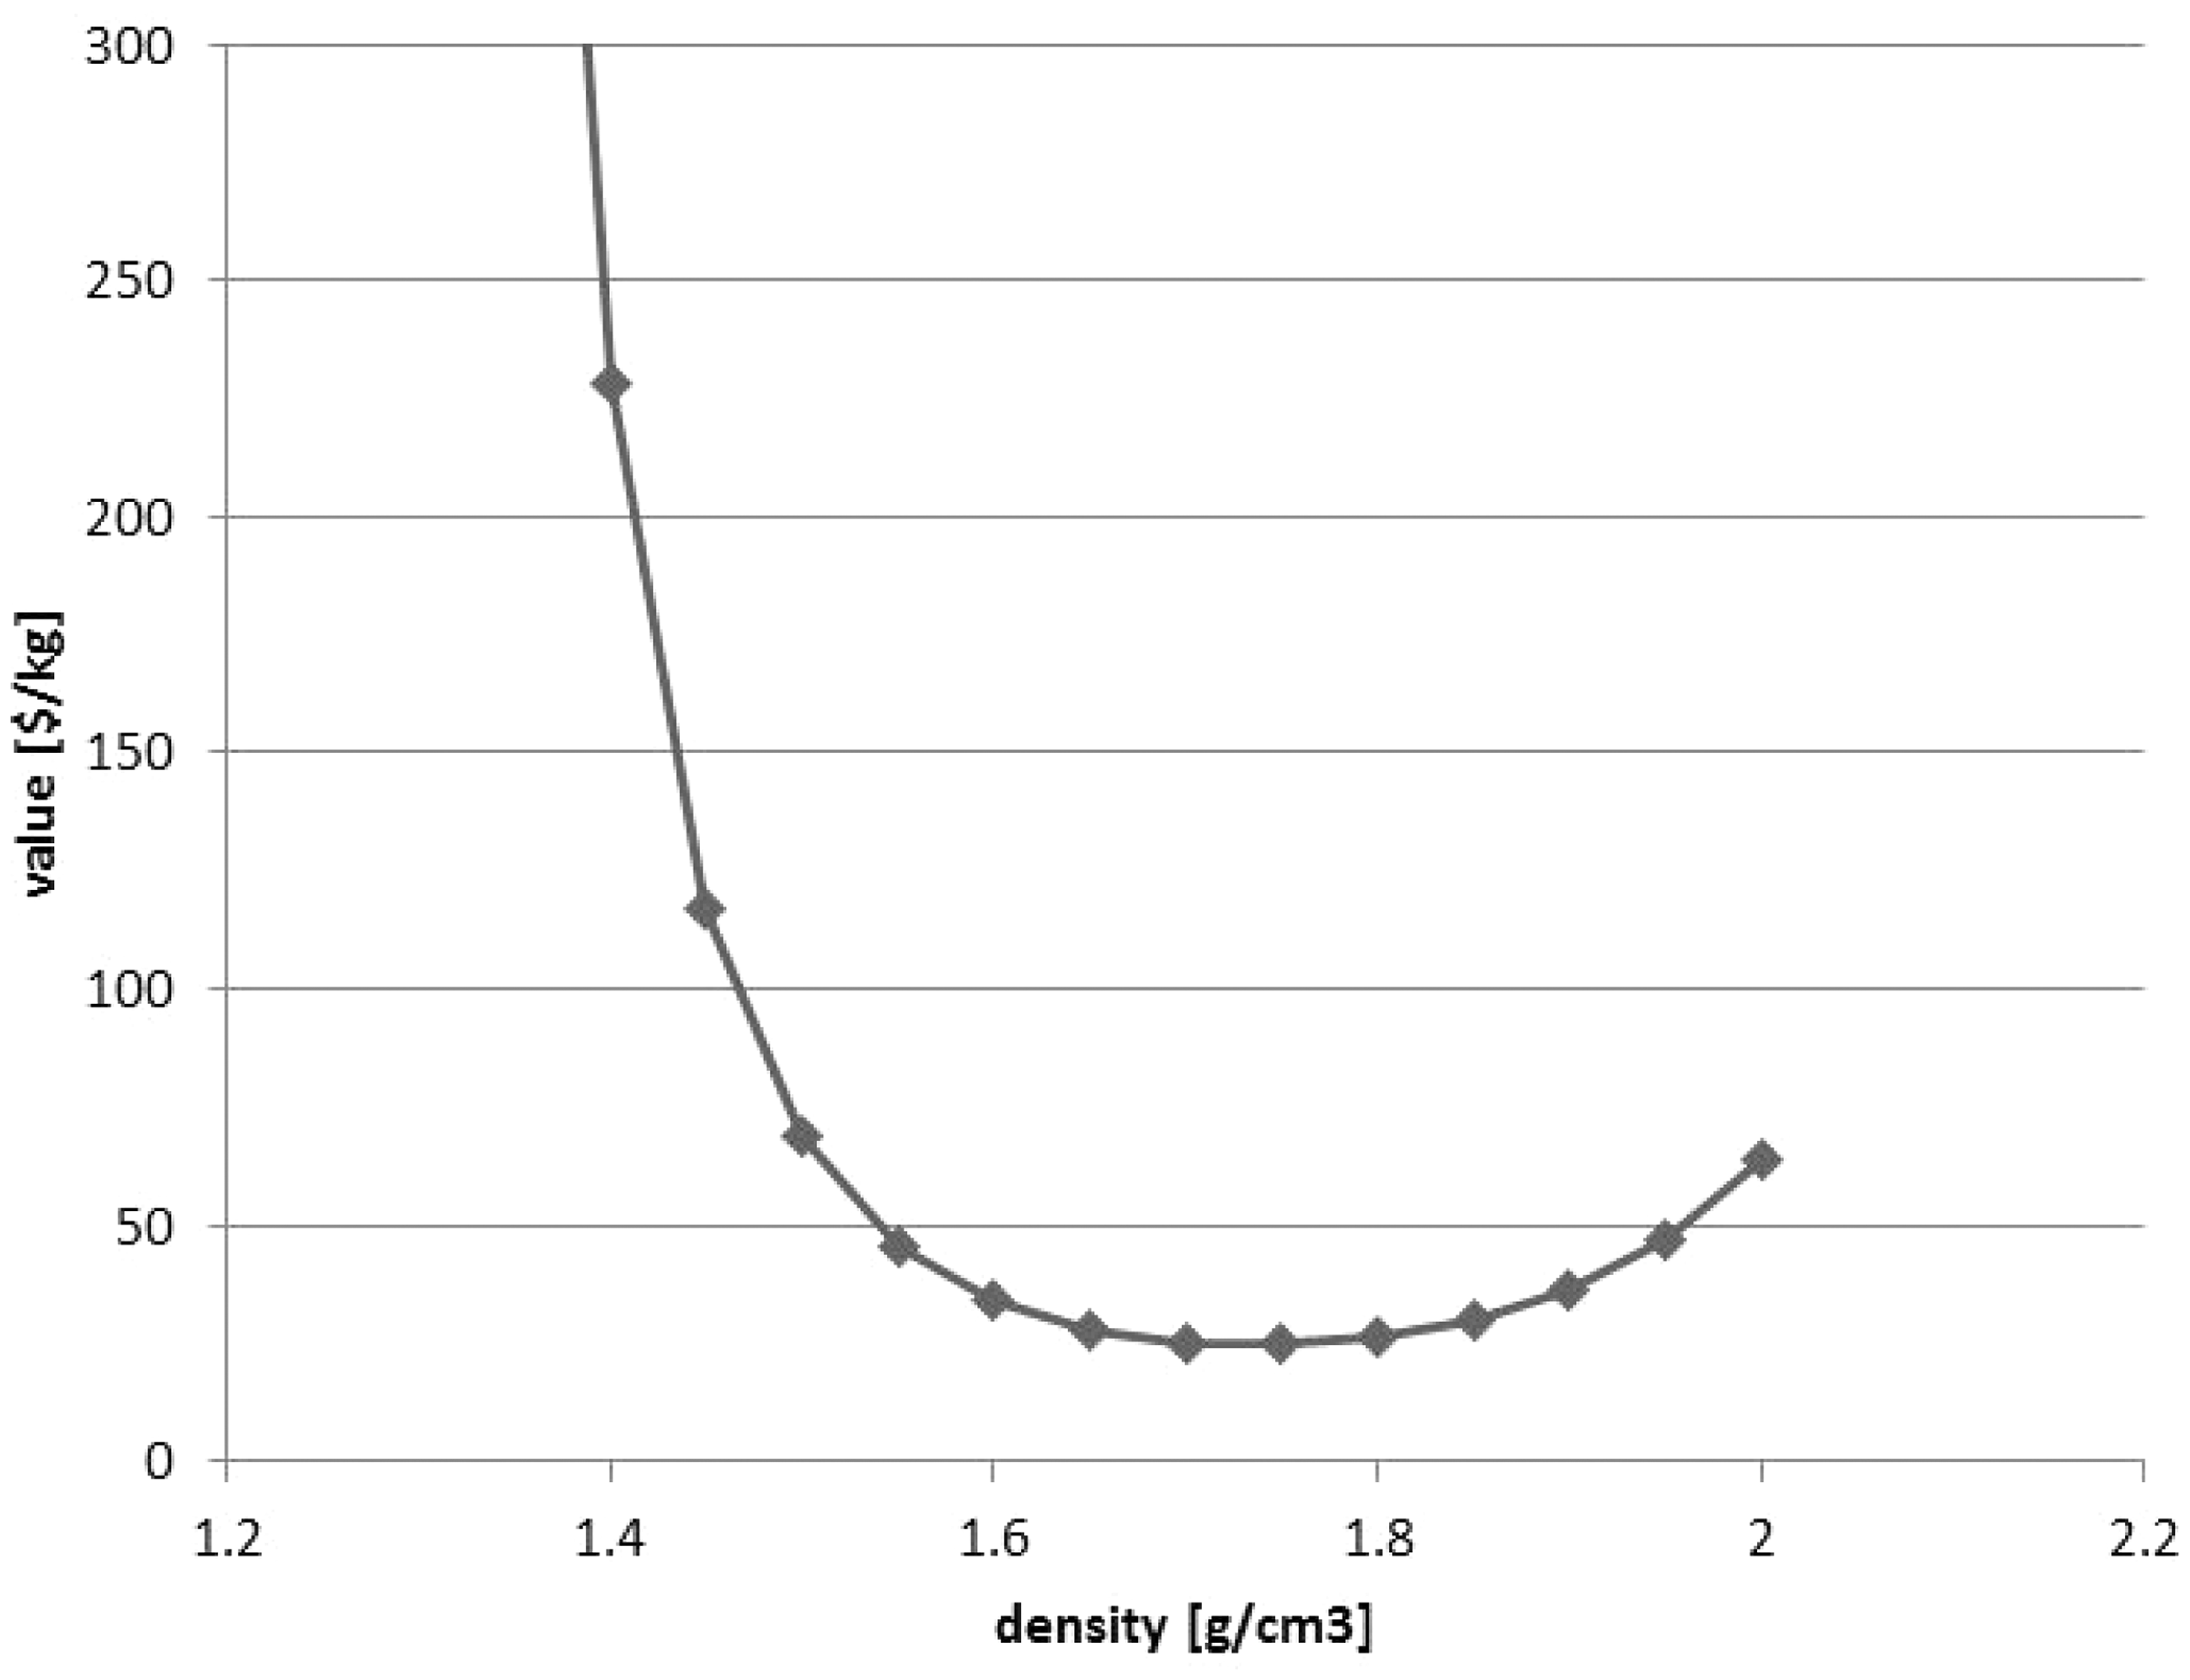
The lowest identified density in the data set is 1.14 g/cm3. Calculating the predicted value of this density while all other variables are kept at their mean would result – according to model 4 – in a price beyond one billion US $, which obviously does not make any sense. The mistake done here was to assume that there actually is a fibre with a very good density and average characteristics elsewhere, however, representing extreme values in strength, modulus of elasticity and elongation at break as shown in Table 3. Interaction effects were not separately investigated, since the different material properties often determine others (e.g. high strength goes along with high modulus of elasticity). As in many other disciplines, extremely good performance in one category comes with a trade-off, making it really bad in other categories. A good example that would illustrate such a situation is the comparison of a marathon runner, a sprinter and a decathlete. While the marathon runner is really good, in long distances, he is really bad on short distances. The opposite is true for the 100 -m sprinter. On the other hand, the decathlete will always lose against the marathon runner or the sprinter, but will still perform relatively well in both disciplines. In other words, there is always a trade-off between specialists and generalists, in sports as in fibres. Similar is true for modulus of elasticity as depicted in Figure 4.
Cet. par. effect of Moe (GPa) on value ($/kg).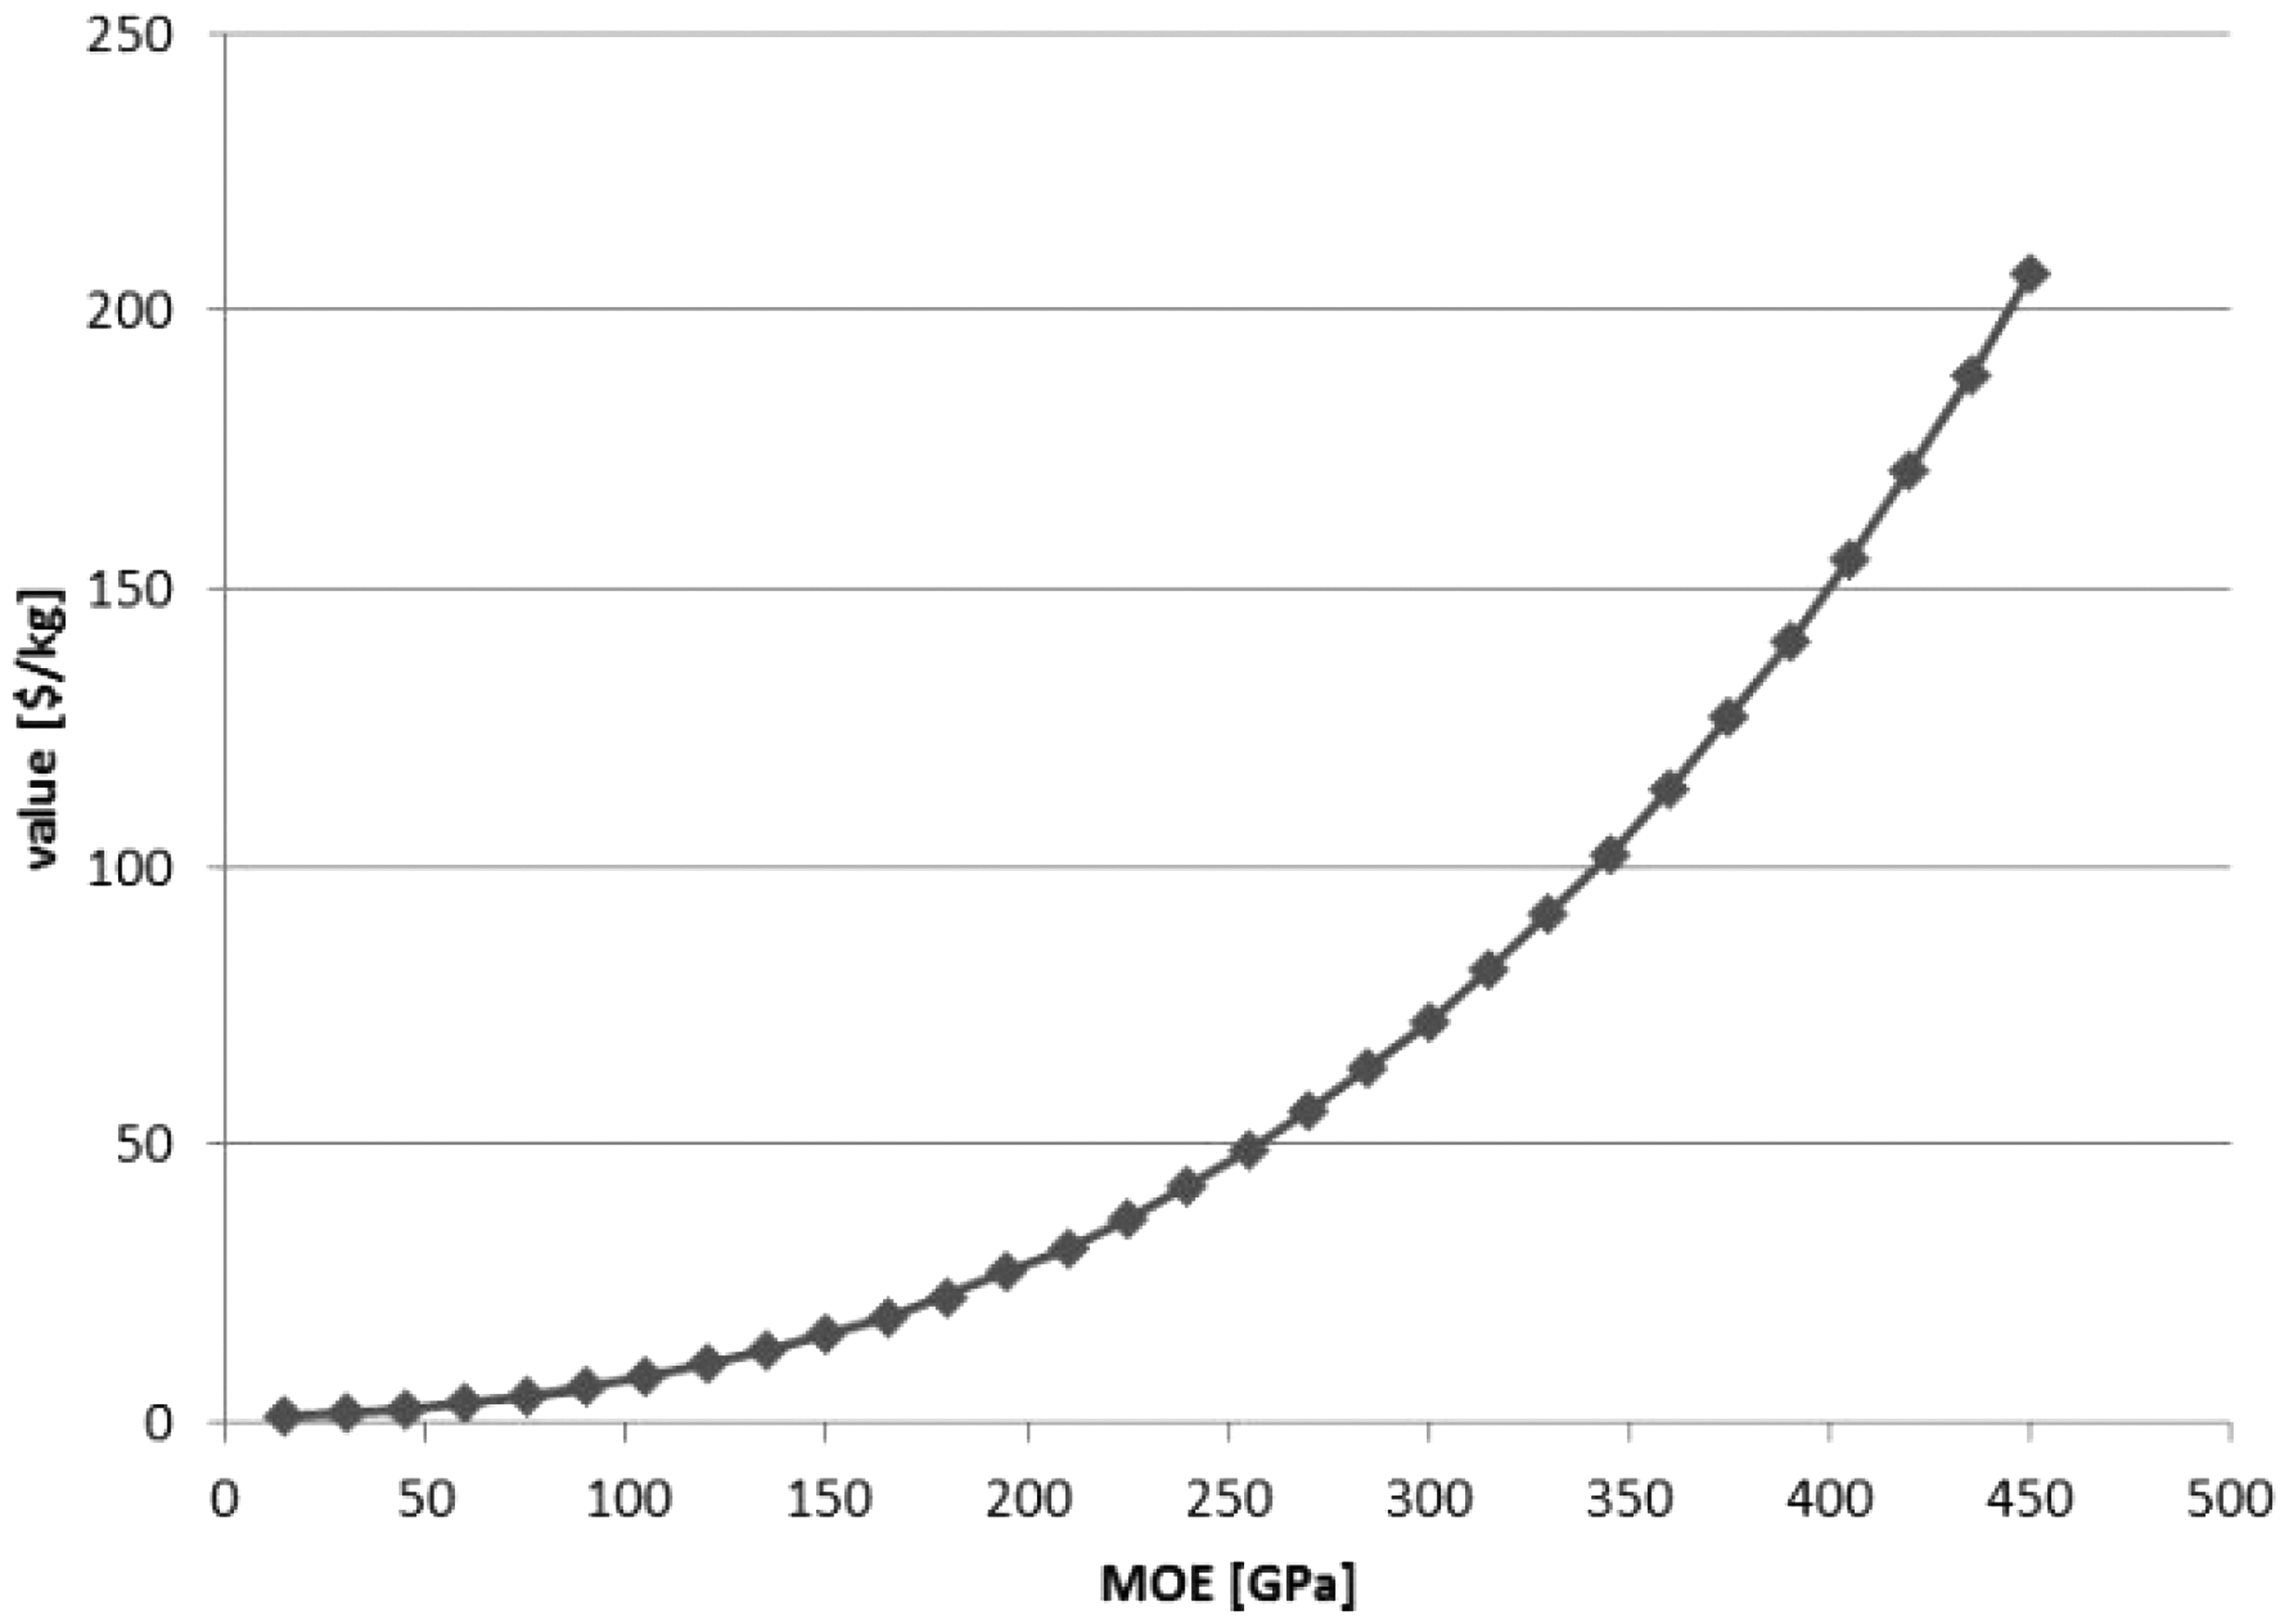
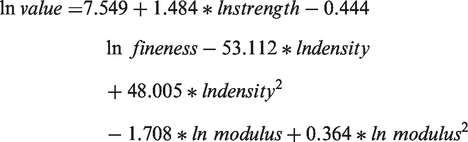
The parameters shown in Table 4, where the following equation is built, can be used to calculate the predicted value of a fibre by inserting the mechanical fibre properties
The fit of the models 1 to 4 is described by the R-squared, the adjusted R-squared and the root-mean-square error. The root-mean-square error is shown in Table 5 as rsme. It is a measure of the differences between values predicted by a model and the values actually observed. 24 The overall goodness of the model is evaluated by the adjusted R-squared, which is also given in Table 5 as r2_a. The R-squared is the ratio of variation explained through the model to total variation. 24 Thus, an adjusted R-squared of 0.95 is very high since 95% of the variations are explained by the model, here by model 4.
In order to valuate the model, the data sets Fibre V1 and Fibre V2 were used for the calculation of fibre value following the equation given above. The calculated results are 48.01 US $/kg and 55.84.01 US $/kg for Fibre V1 and Fibre V2. These values lay approximately 8% (Fibre V1) above and 5% (Fibre V2) below the given producer value at spot market price.
Discussion and conclusion
This work was an attempt to display the relationship between fibre value and technical properties of fibres. The work tried to give an example of how to generate a pricing decision in specialty markets by concentrating on the competitors and their market prices. It is shown that it is possible to evaluate the value of a reinforcement fibre by technical fibre properties. For this evaluation, multiple linear regression models were used. The models also give an impression of the weighting of the explanatory variables, but due to multicollinearity, the conclusion from this weighting is not sufficiently ensured. However, the positioning of the calculated values of the valuation data sets around their spot market prices gives reason for further investigation.
The presented model is clearly limited by the properties of the collected data sets. With that, the model is only applicable for fibres that lie within these property ranges. The problem with extreme values was illustrated with the unrealistic high price of a fibre with relatively extreme property values.
In order to develop a better model for the relationship between fibre value and fibre properties, other variables could be taken into account. Fibre properties like fibre chemistry have not been part of this study, given that they have not been available for all of the fibres. In order to make them available, it would be best to measure the fibre properties by oneself instead of being limited by information of technical sheets provided by fibre producers. With further research on this model, it could be an approach to also take changes over time into account by using time series data in order to analyse possible trends in the relationships described above.
The model approach in this paper can give valuable information for the development of new reinforcement fibres. Researchers can estimate the market value of a fibre and also generate information on the technical properties they should enhance for reaching a higher market value. The developed model design can be used to estimate the influence of certain mechanical properties to the fibre value.
In this work, only the properties of single fibres and yarn were studied. No composite properties were included in this work. The presented model takes only reinforcement fibres into account, and it is not usable for textile fibres in this form. In order to use the used approach for other fibres like textile fibres, other technical properties have to be investigated.
A similar approach could be applied to other cases of intermediates and industrial ingredients such as food additives, construction materials and chemical substances.
Footnotes
Funding
The research leading to these results has received funding from the European Community's Seventh Framework Programme FP7/2007–2013 under grant agreement no. CP-IP 228589-2 AFORE and the Austrian Federal Ministry of Science and Research under grant agreement no. 651.432/0001-II/2/2009.
Conflict of interest
None declared.