
Abstract
The effect of Weibull distribution-based stochastic fiber/matrix interface strength on the transverse tensile strength and failure process of long fiber reinforced composites was numerically investigated in represent volume elements. The transverse tensile strength and failure strain of the stochastic interface strength models are much lower than the identical interface strength cases, indicating that transverse tensile strength calculated from the identical interface strength model will lead to an overestimation. In the stochastic interface strength model, failure path goes along interfaces of lower strength but not always the lowest strength, and variation of fiber location distribution will lead to a different failure process. Influence of the two Weibull parameters on the transverse tensile strength was also investigated. The transverse tensile strength improves with the increase of Weibull scale parameter and shape parameter. A small value of shape parameter will lead to a scattered interface strength distribution and much lower transverse tensile strength.
Introduction
Long fiber reinforced polymer (FRP) composites have been widely used in aviation, automobile, and other industries on account of their excellent mechanical property in fiber direction due to the reinforcement effect. Compared with longitudinal failure, transverse damage tends to occur earlier in the loading history.1,2 However, transverse characterization is subjected to more uncertainties, such as the fiber/matrix interface.
In unidirectional FRP (UD-FRP) composites, interface is regarded as the third phase and plays an important role in the transverse property. 3 Many researchers have numerically investigated the interface effect (stiffness, strength, and toughness) on the transverse property, where interface is modeled with cohesive behavior of traction–separation law in micromechanical finite element method (FEM) model.4–12 Interface strength tests are often influenced by the experiment methods and the results are scattering. 4 The interface strength of each fiber in resin matrix composites has been proved to follow the Weibull distribution by single fiber push-out test, 13 however, numerical models usually consider the interfaces with uniform mechanical parameters for simplicity.6–12
Micro damage initiation and propagation are often influenced by the local microstructure. Failure process of materials with stochastic local property is significantly different from that of identical cases. Ashcroft et al.14–17 investigated the random fracture toughness effect on the delamination process of a double cantilever beam (DCB) specimen with stochastic cohesive element and concluded that the microstructural randomness could significantly affect the macroscopic delamination process of composites.
Microstructural randomness in the cross-section of UD-FRP composites, which may influence the transverse failure process of materials, can be related to the irregular fiber arrangement and stochastic fiber/matrix interface strength. The former effect has been confirmed to influence the microscopic stress distribution and damage evolution due to the local stress concentration,18–20 but the later one is usually ignored and rarely reported. Ashouri Vajari et al. 5 modeled the transverse failure of UD-FRP composites with represent volume element (RVE) containing two fibers of uneven interfacial strengths, which showed a significant different failure response with cases of identical interface strength. However, the irregular fiber arrangement effect was not considered in the model, and an RVE of two fibers might not be large enough to model the transverse failure response accurately.
In the present work, we focus on the effect of stochastic fiber/matrix interface strength on the transverse tensile response of long UD-FRP composites, with special attention to the macroscopic transverse tensile strength and microscopic failure process. The interface was modeled with cohesive behavior and interface strength of fibers in an RVE followed the Weibull distribution. The effects of stochastic interface strength (SIS) on the transverse tensile strength as well as failure process were analyzed and compared in models of both regular and irregular fiber arrangement. Moreover, influence of the two Weibull parameters on the transverse tensile strength was discussed.
FEM model
Model development
The material investigated is carbon fiber/epoxy HTA/6376 with fiber volume fraction of 59.2% and average fiber diameter of 6.6 µm. 21 2D plane strain RVE is widely used for modeling transverse failure of UD-FRP composites in FEM analysis.9–12 An RVE containing 30 fibers has been proved to be large enough for representing the macroscopic material.12,22 In the present study, the 2D plane strain RVE size is 52.5 µm × 52.5 µm, containing 49 fibers with diameter of 6.6 µm (the fiber volume fraction is 60.82%).
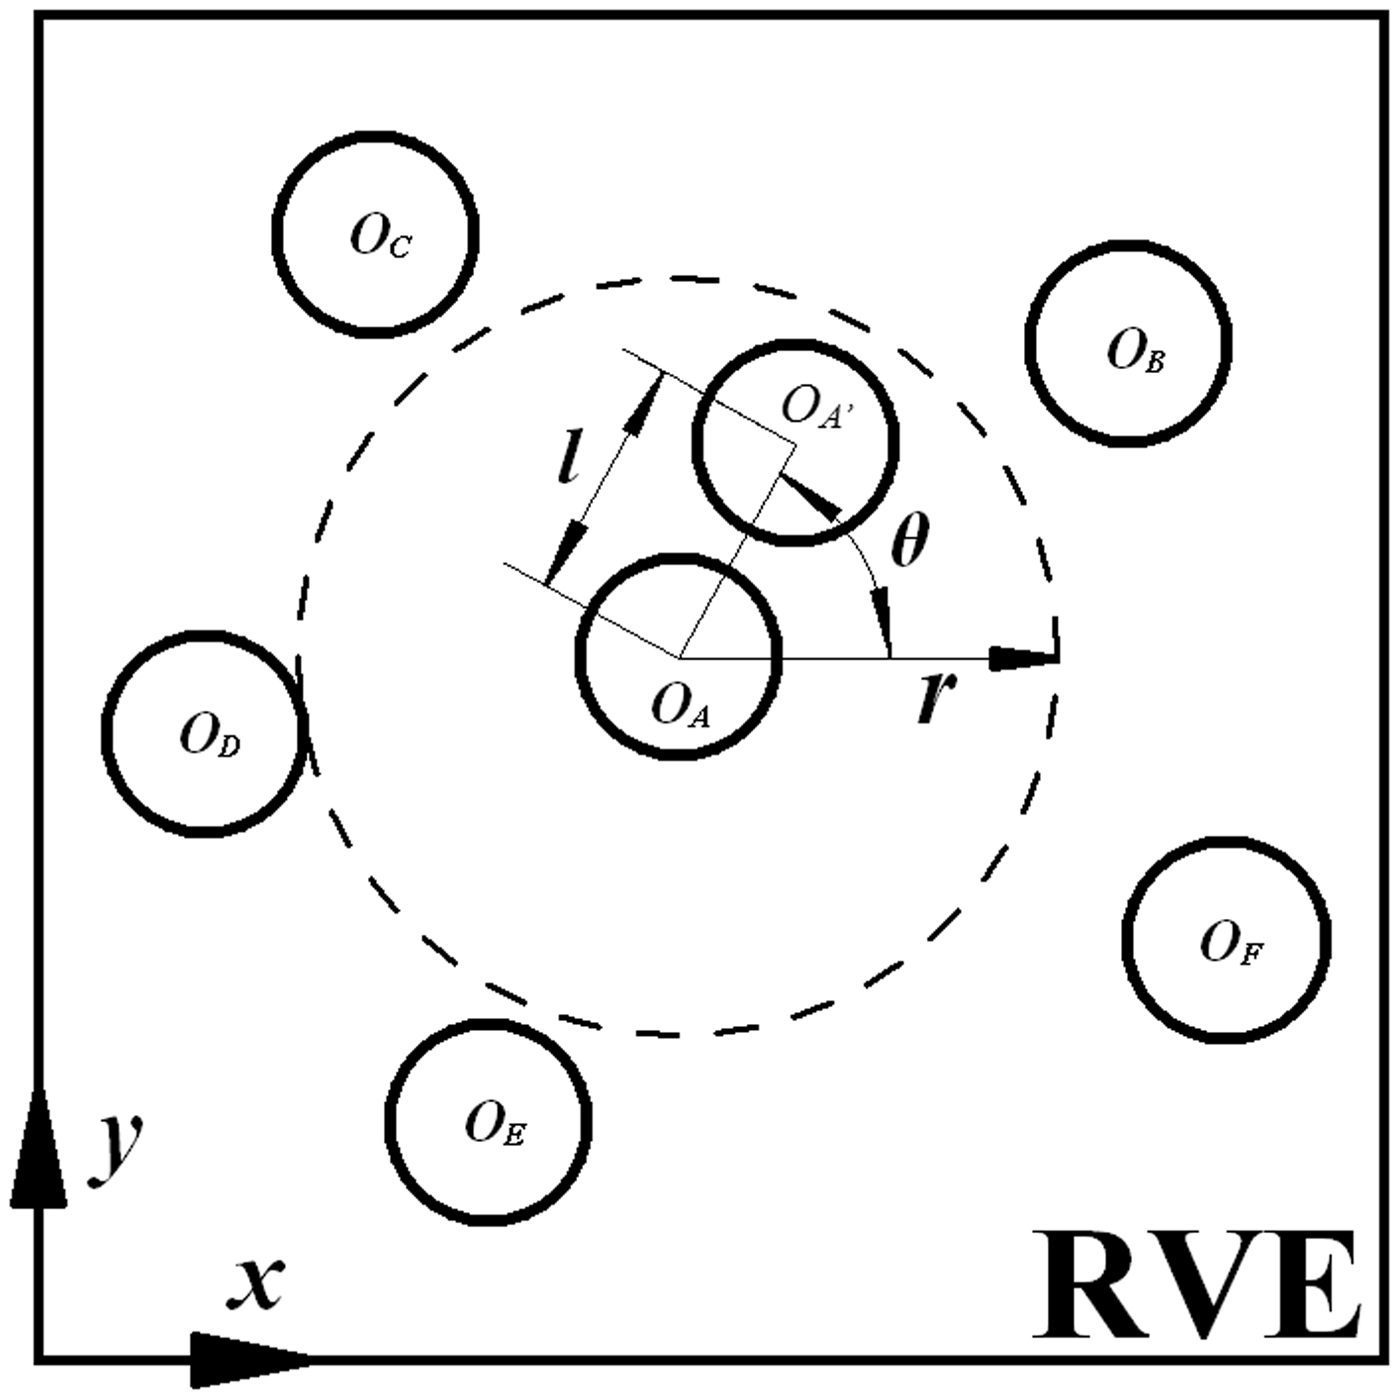
Two kinds of RVE models were investigated in the present work: regular and irregular fiber arrangement. The general regular fiber arrangements widely used in numerical models are square and hexagonal packing.23,24 In the present work, the former one was adopted and the generated RVE is shown in Figure 1(a). The RVE of irregular fiber arrangement was generated by disturbing fibers from their initially square arrangement with the methods from the literature.11,25 Details of the disturbing procedure can be illustrated as: (i) find the nearest surrounding fiber of fiber A which is to be moved, i.e. fiber D in Figure 2, distance between the two fiber centers is r + R (R is the fiber radius); (ii) move fiber A to the new position with movement distance l = η(r–R) and direction of shifting angle θ from x- axis (Figure 2), where 0 ≤ η < 1 and 0° ≤ θ < 360° are generated random values; (iii) move each fiber in the RVE one by one with the procedure (i–ii); (iv) repeat the procedure (i–iii) for at least three times to generate an absolute irregular fiber arrangement. The generated RVE of irregular fiber arrangement is shown in Figure 1(b).
Fiber distribution in the generated RVE model. (a) Regular fiber arrangement, (b) irregular fiber arrangement. Schematic of local fiber disturbing.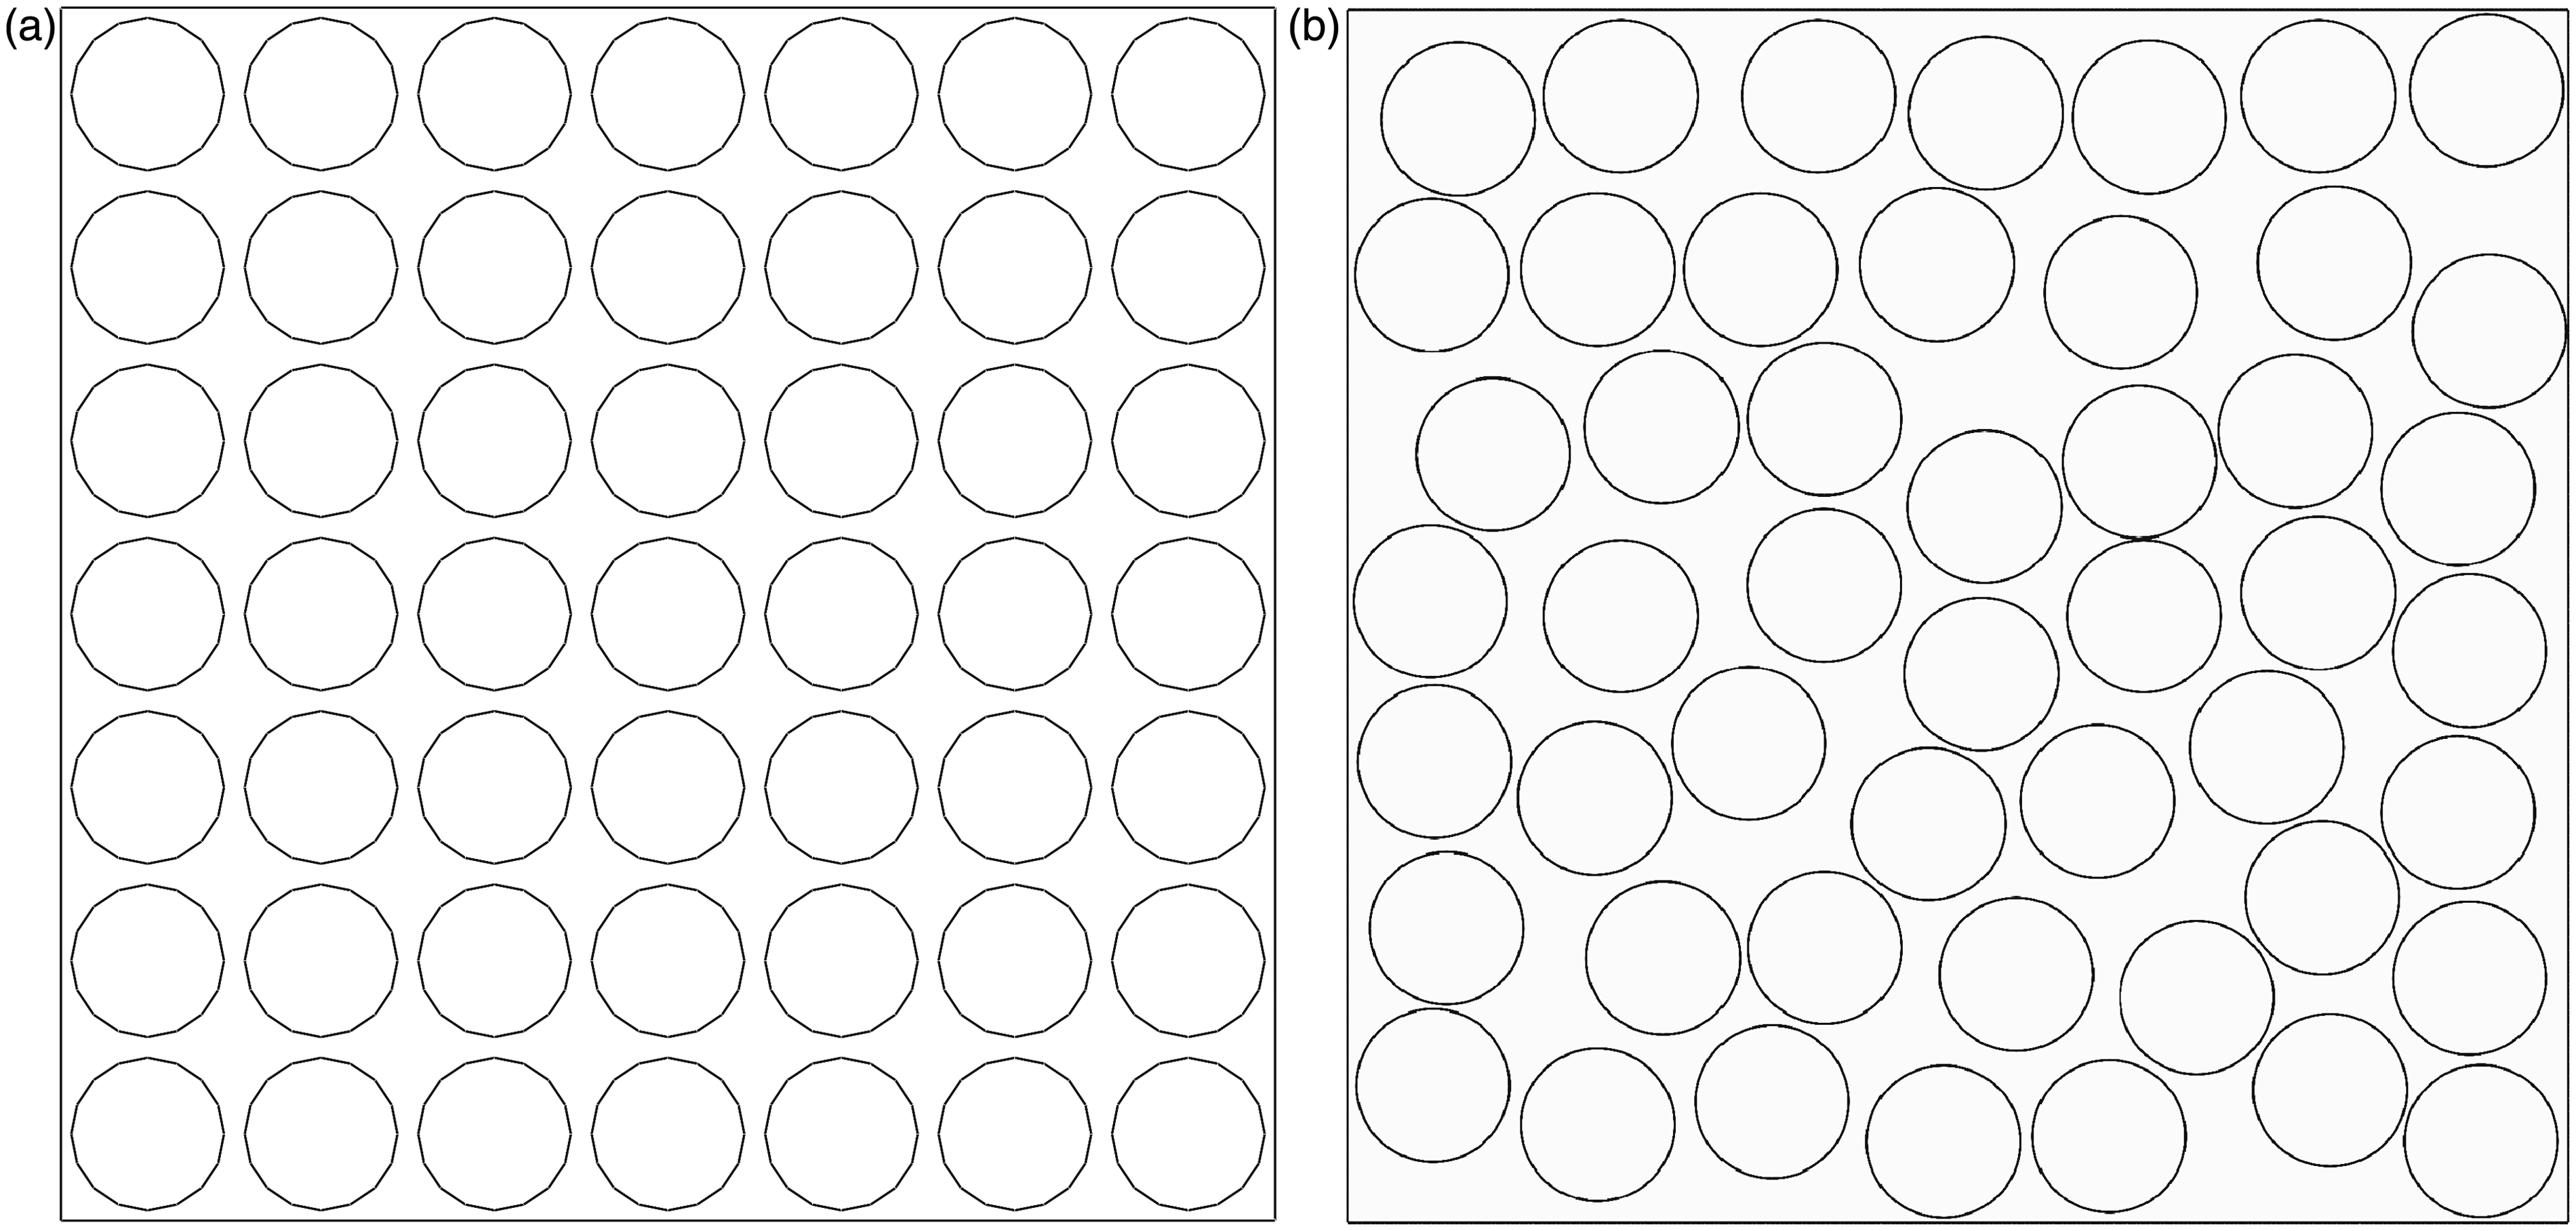
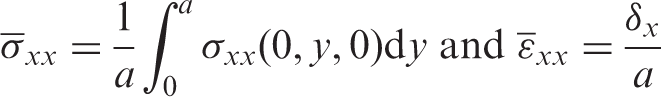
The FEM models were analyzed in plane strain state and the following boundary conditions26,27: the RVE cell is loaded by a uniform strain in the x-direction; the surfaces x = 0 and y = 0 are fixed in the x- and y-direction, respectively; the surfaces x = a and y = a are constrained to remain straight during deformation (see Figure 3). Actually, the boundary condition is not periodic boundary condition. But it has little influence on the transverse response according to our precalculated models. The models were meshed with three-node linear plane strain triangle (CPE3) element of 0.2 µm in size. The problem was solved in ABAQUS/Standard. The average transverse stress and strain in the x-direction of the FEM models were calculated as
8
Load and boundary condition of the RVE model.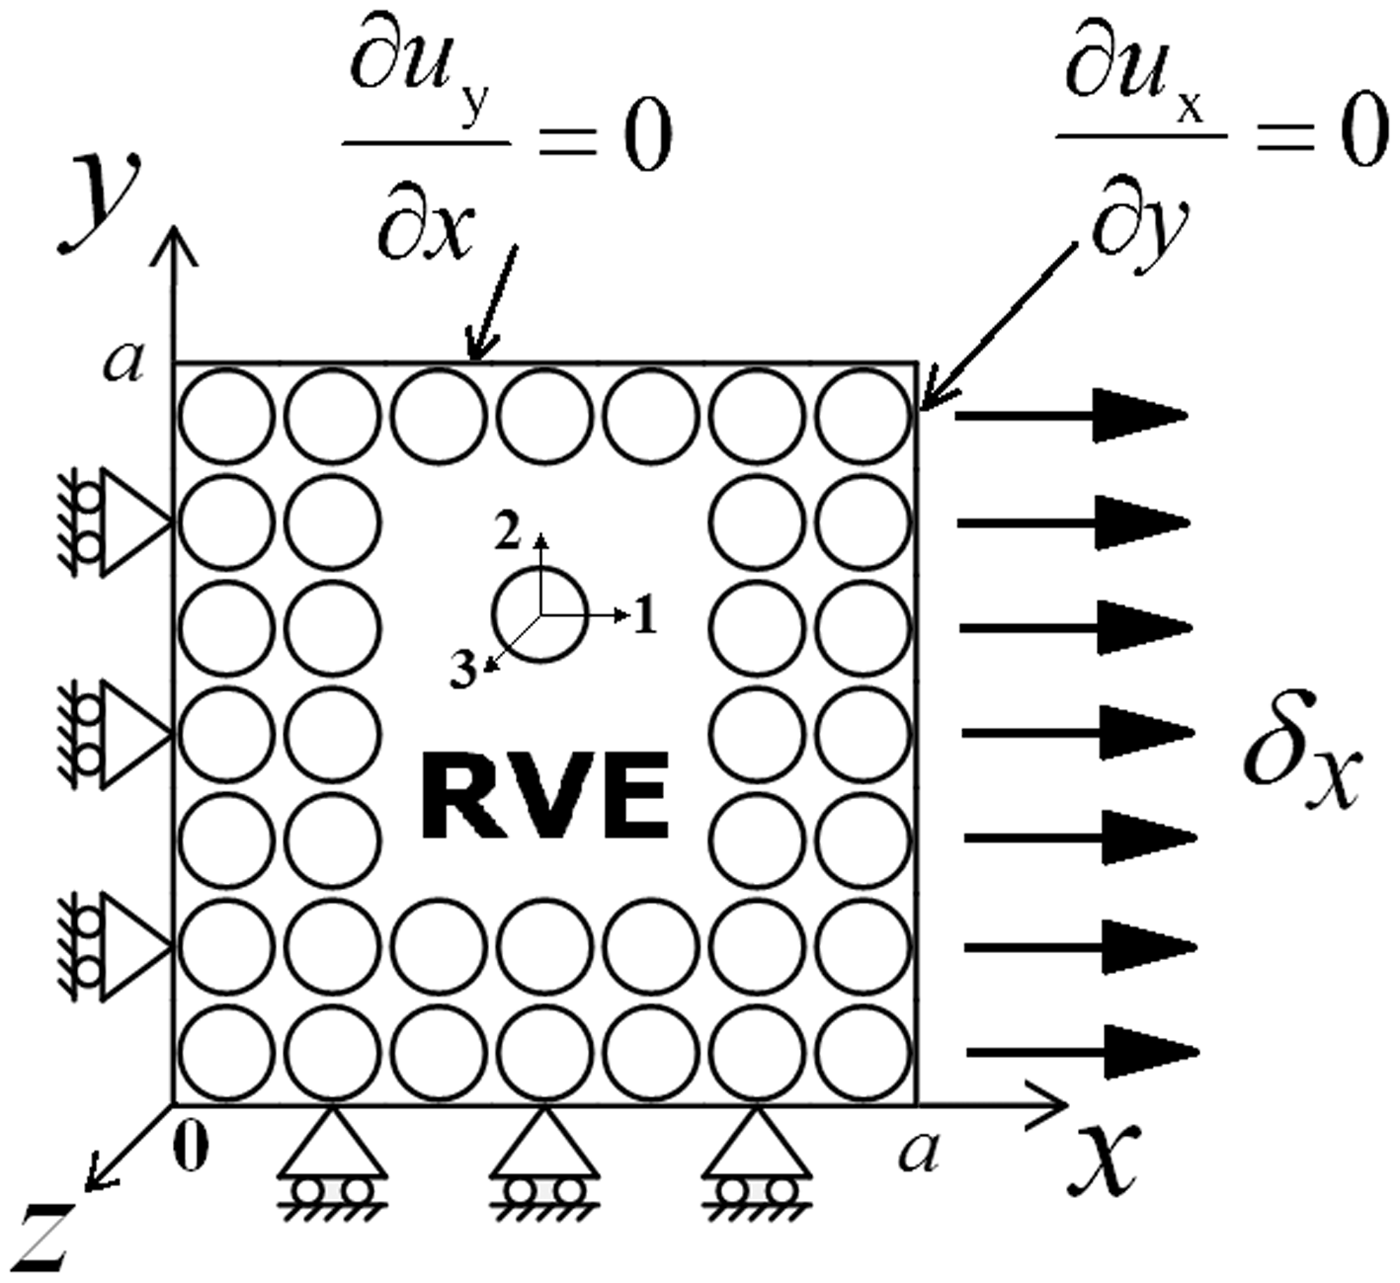
Material properties
HTA fibers
Elastic properties of fiber and matrix.
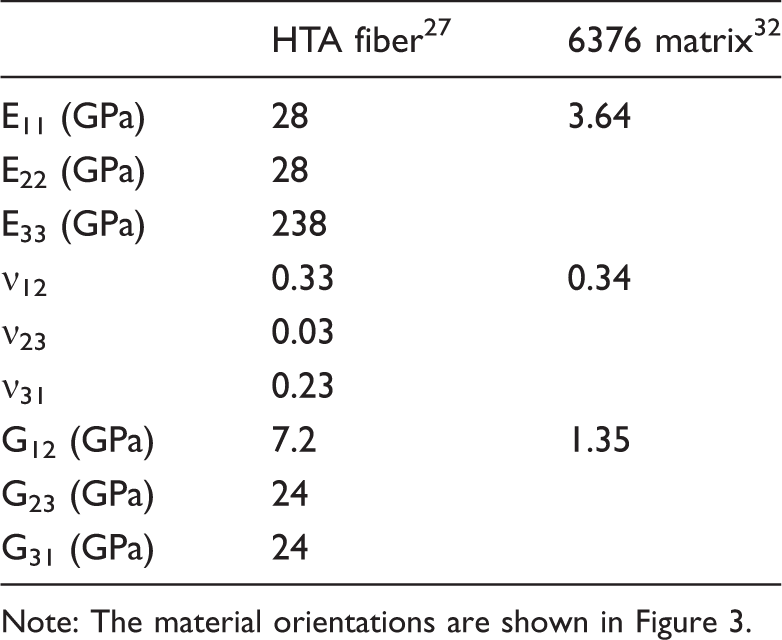
Note: The material orientations are shown in Figure 3.
6376 matrix
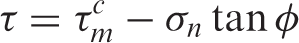
The yield behavior of polymer matrix is sensitive to hydrostatic stress.28,29 To capture this characteristic, the Mohr–Coulomb yield criterion9,10,22,30,31 defined as
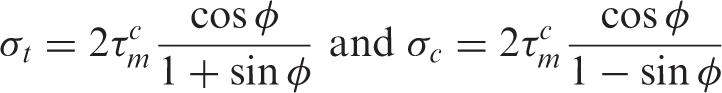
The tensile and compressive strength provided by Fiedler et al.
32
are
Fiber/matrix interface
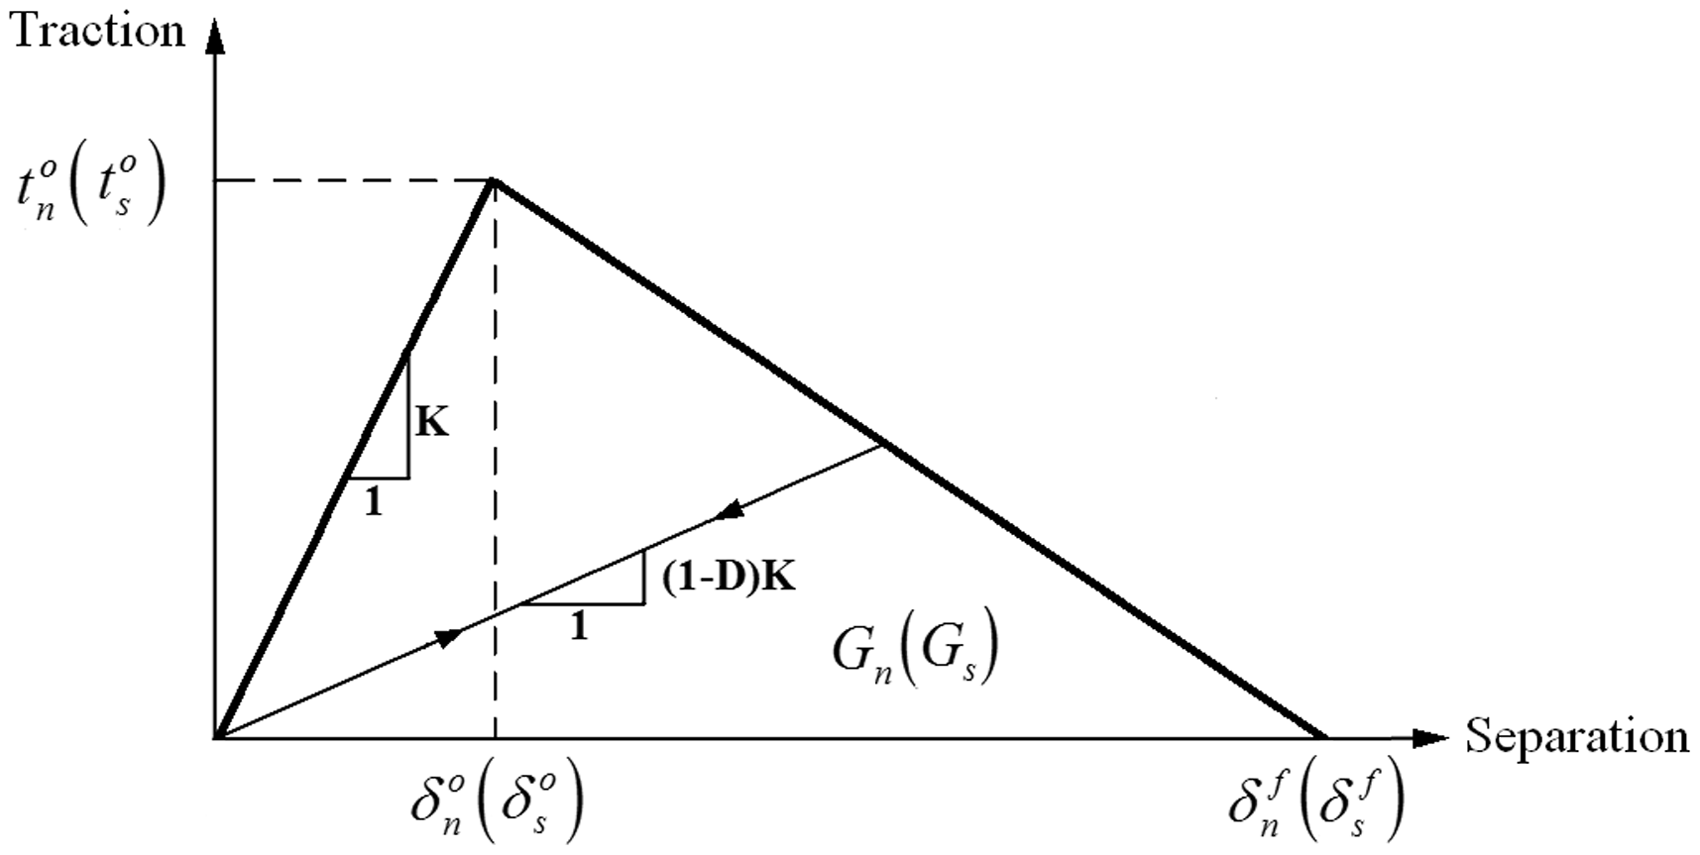
The interface was modeled as a cohesive region with friction. In our precalculated models, the friction coefficient was found to have a negligible effect on the transverse response, and a value of 0.1 was consequently used in the present paper. The widely used bi-linear traction–separation law (Figure 4) was employed to capture the interface debonding behavior. The initial linear response before damage initiation is
Bi-linear traction–separation law of the cohesive surface.
Compared with shear direction, interface parameters of normal direction play a dominant role in the transverse tensile failure of UD-FRP composites.
7
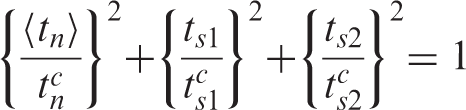
Therefore, similar with many other researchers’ work,9,10,12 parameters of shear and normal directions were assumed to be identical in the present work: initial stiffness before damage initiation Kn = Ks = K, critical traction for damage initiation
The “interface strength” is referred to the critical traction for damage initiation in the present paper. When investigating the stochastic fracture toughness effect on the delamination process of a DCB specimen, Ashcroft et al. assumed the initial stiffness and fracture toughness to be proportional to the interface strength.14–17 Similar approach was adopted in the present work (Figure 5), and the critical and failure separation of the cohesive interface were taken as δ0 = 10−9 m and δf = 2 × 10⁻⁷ m (the two values were chosen by consulting parameter dimension in the literatures7,9,10), respectively. To promote the solution convergence, a viscosity coefficient of 2 × 10⁻⁴ taken from O’Dwyer et al.
7
was used.
Bi-linear traction–separation law of different interface strengths.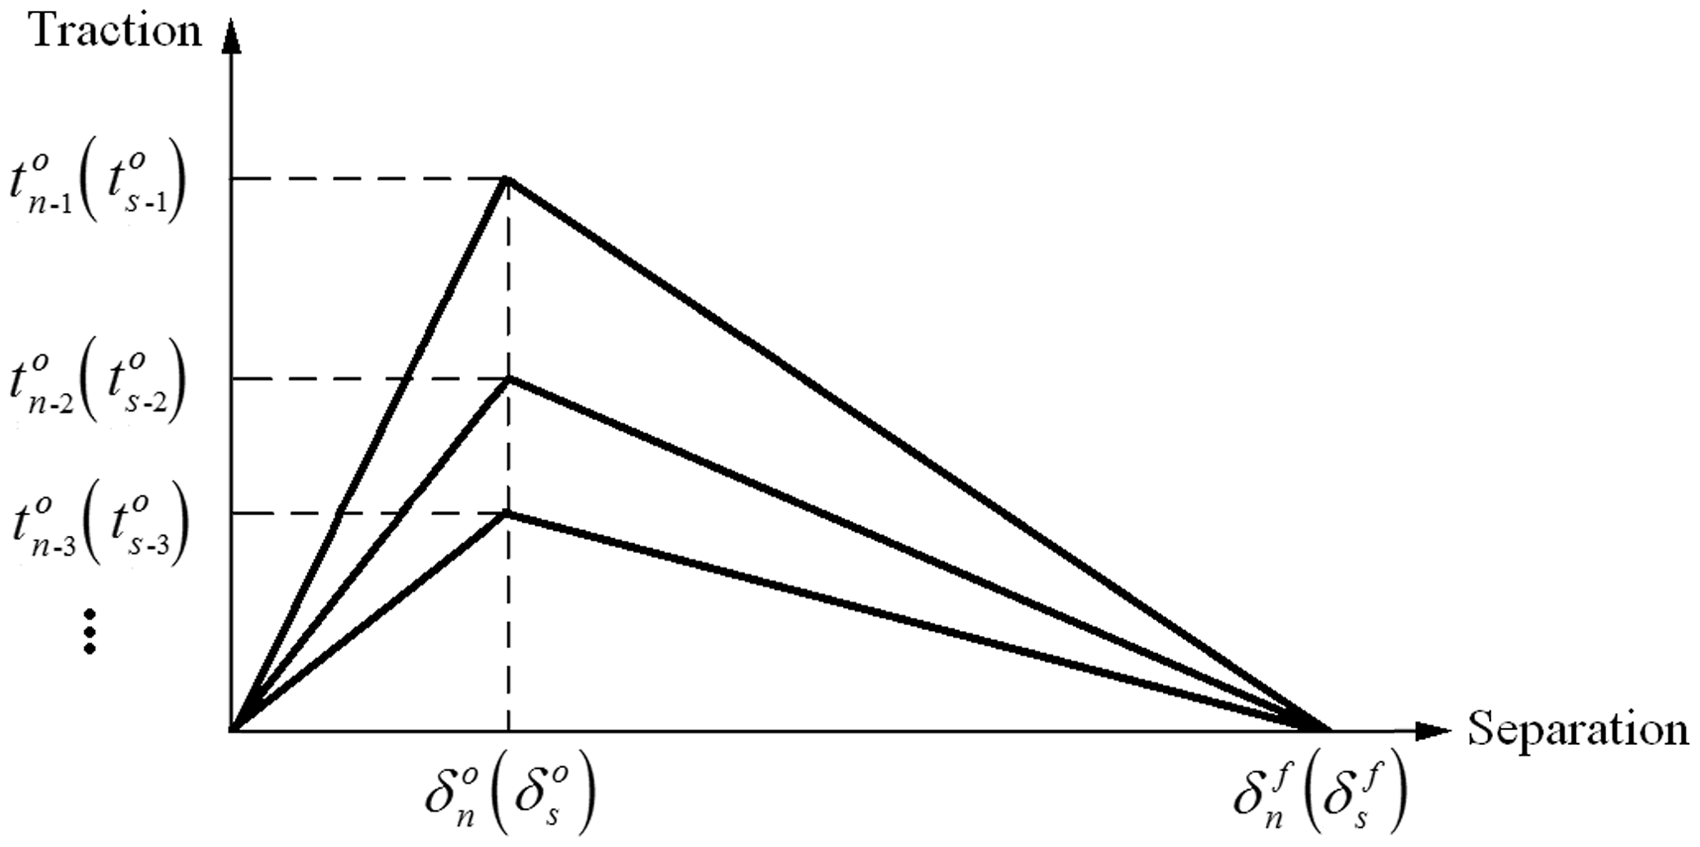
Weibull distribution of interface strength
Interface strength usually follows the two-parameter Weibull distribution in carbon fiber/resin matrix composites.
13
In the present work, the SIS follows the two-parameter Weibull distribution function
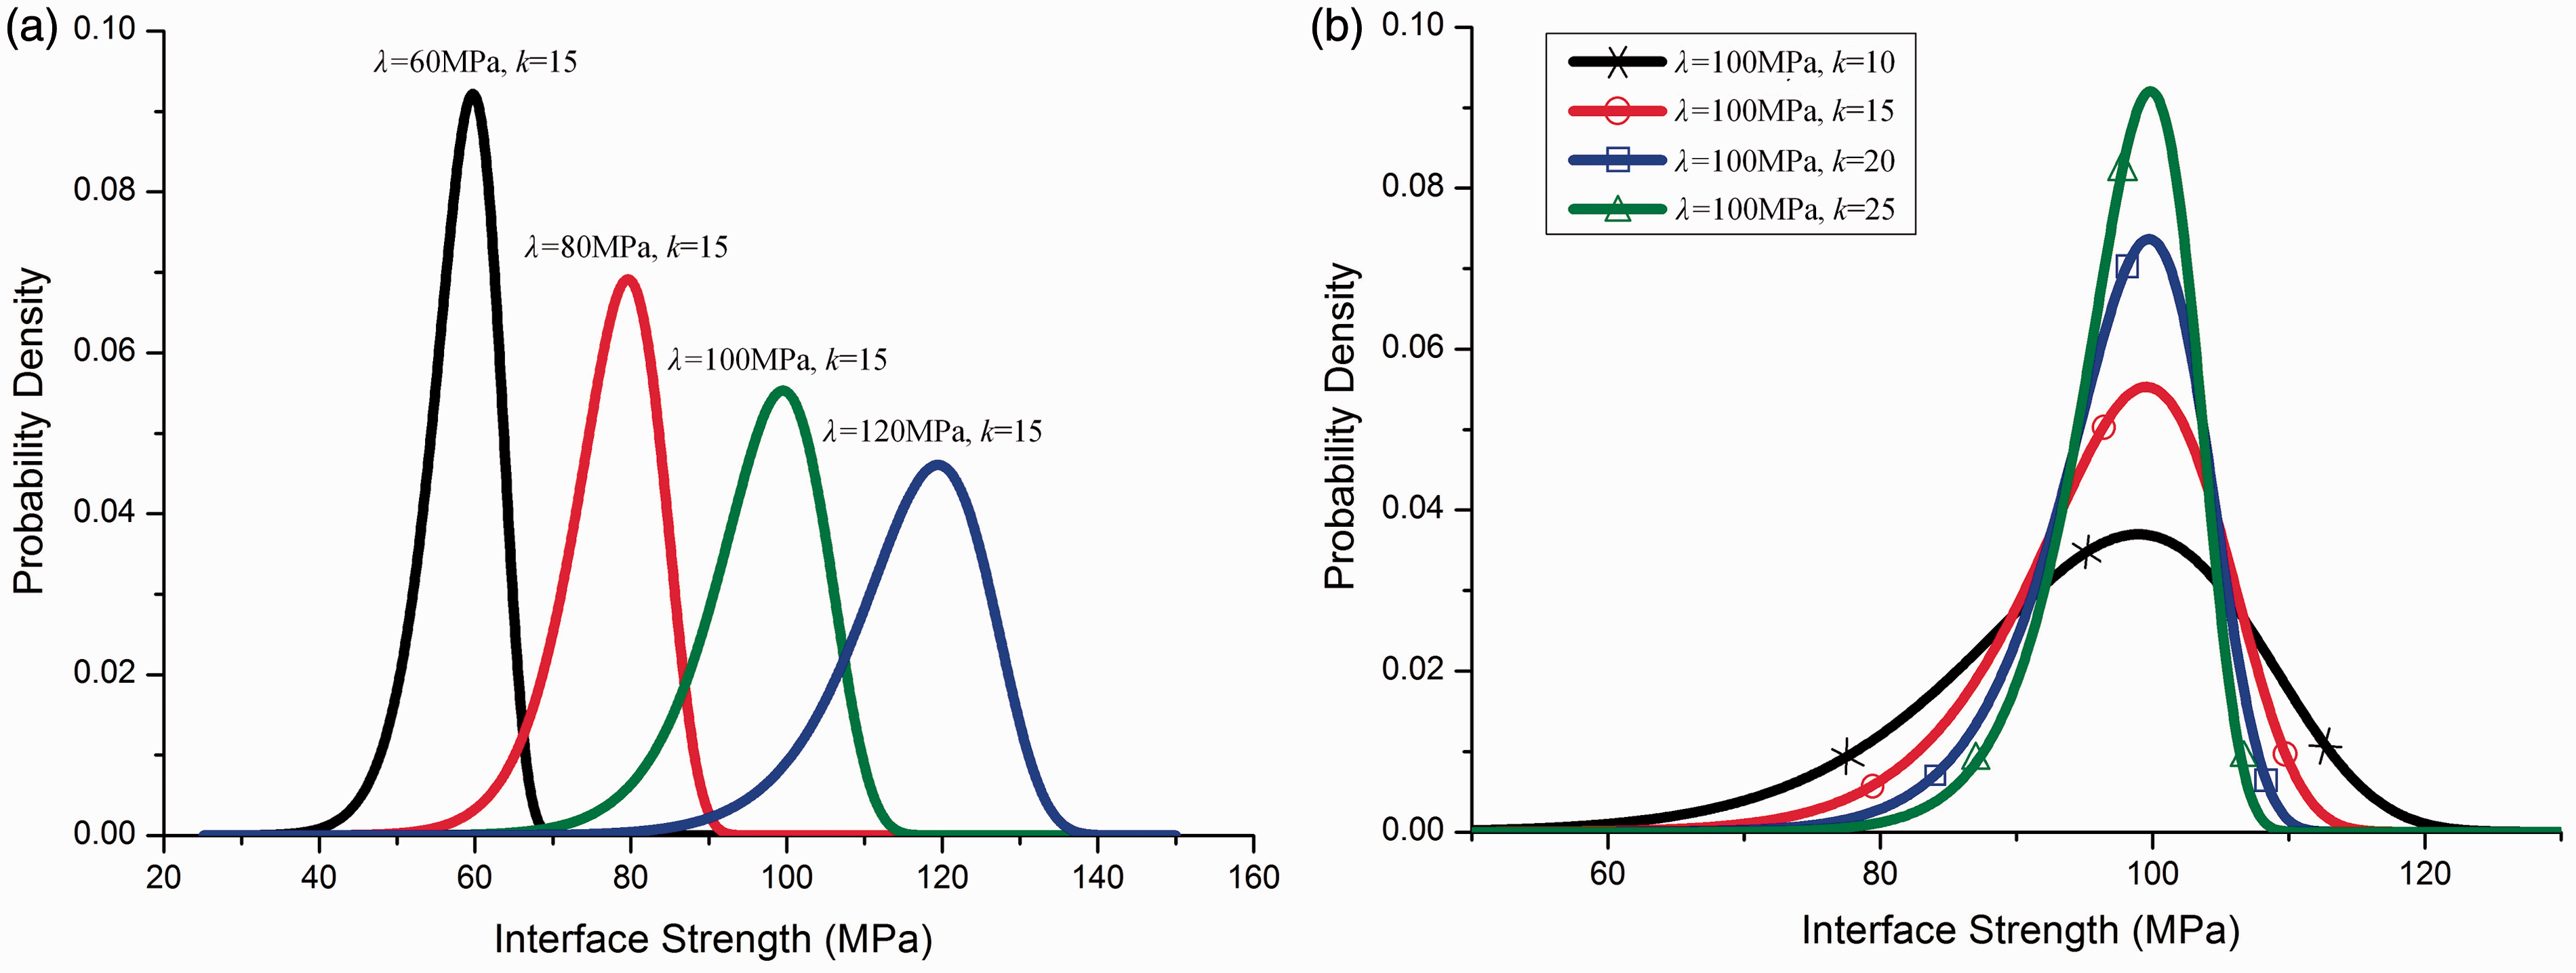
Weibull distribution of interface strength for different (a) scale parameter λ and (b) shape parameter k.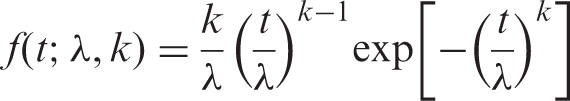
Results and analysis
Effect of SIS on the transverse tensile strength
In this section, the effect of Weibull distribution-based SIS on the transverse tensile strength will be discussed. The Weibull parameters are chosen as λ = 100 MPa and k = 5, a medium value taken from O’Dwyer et al.
7
and Sha et al.,
13
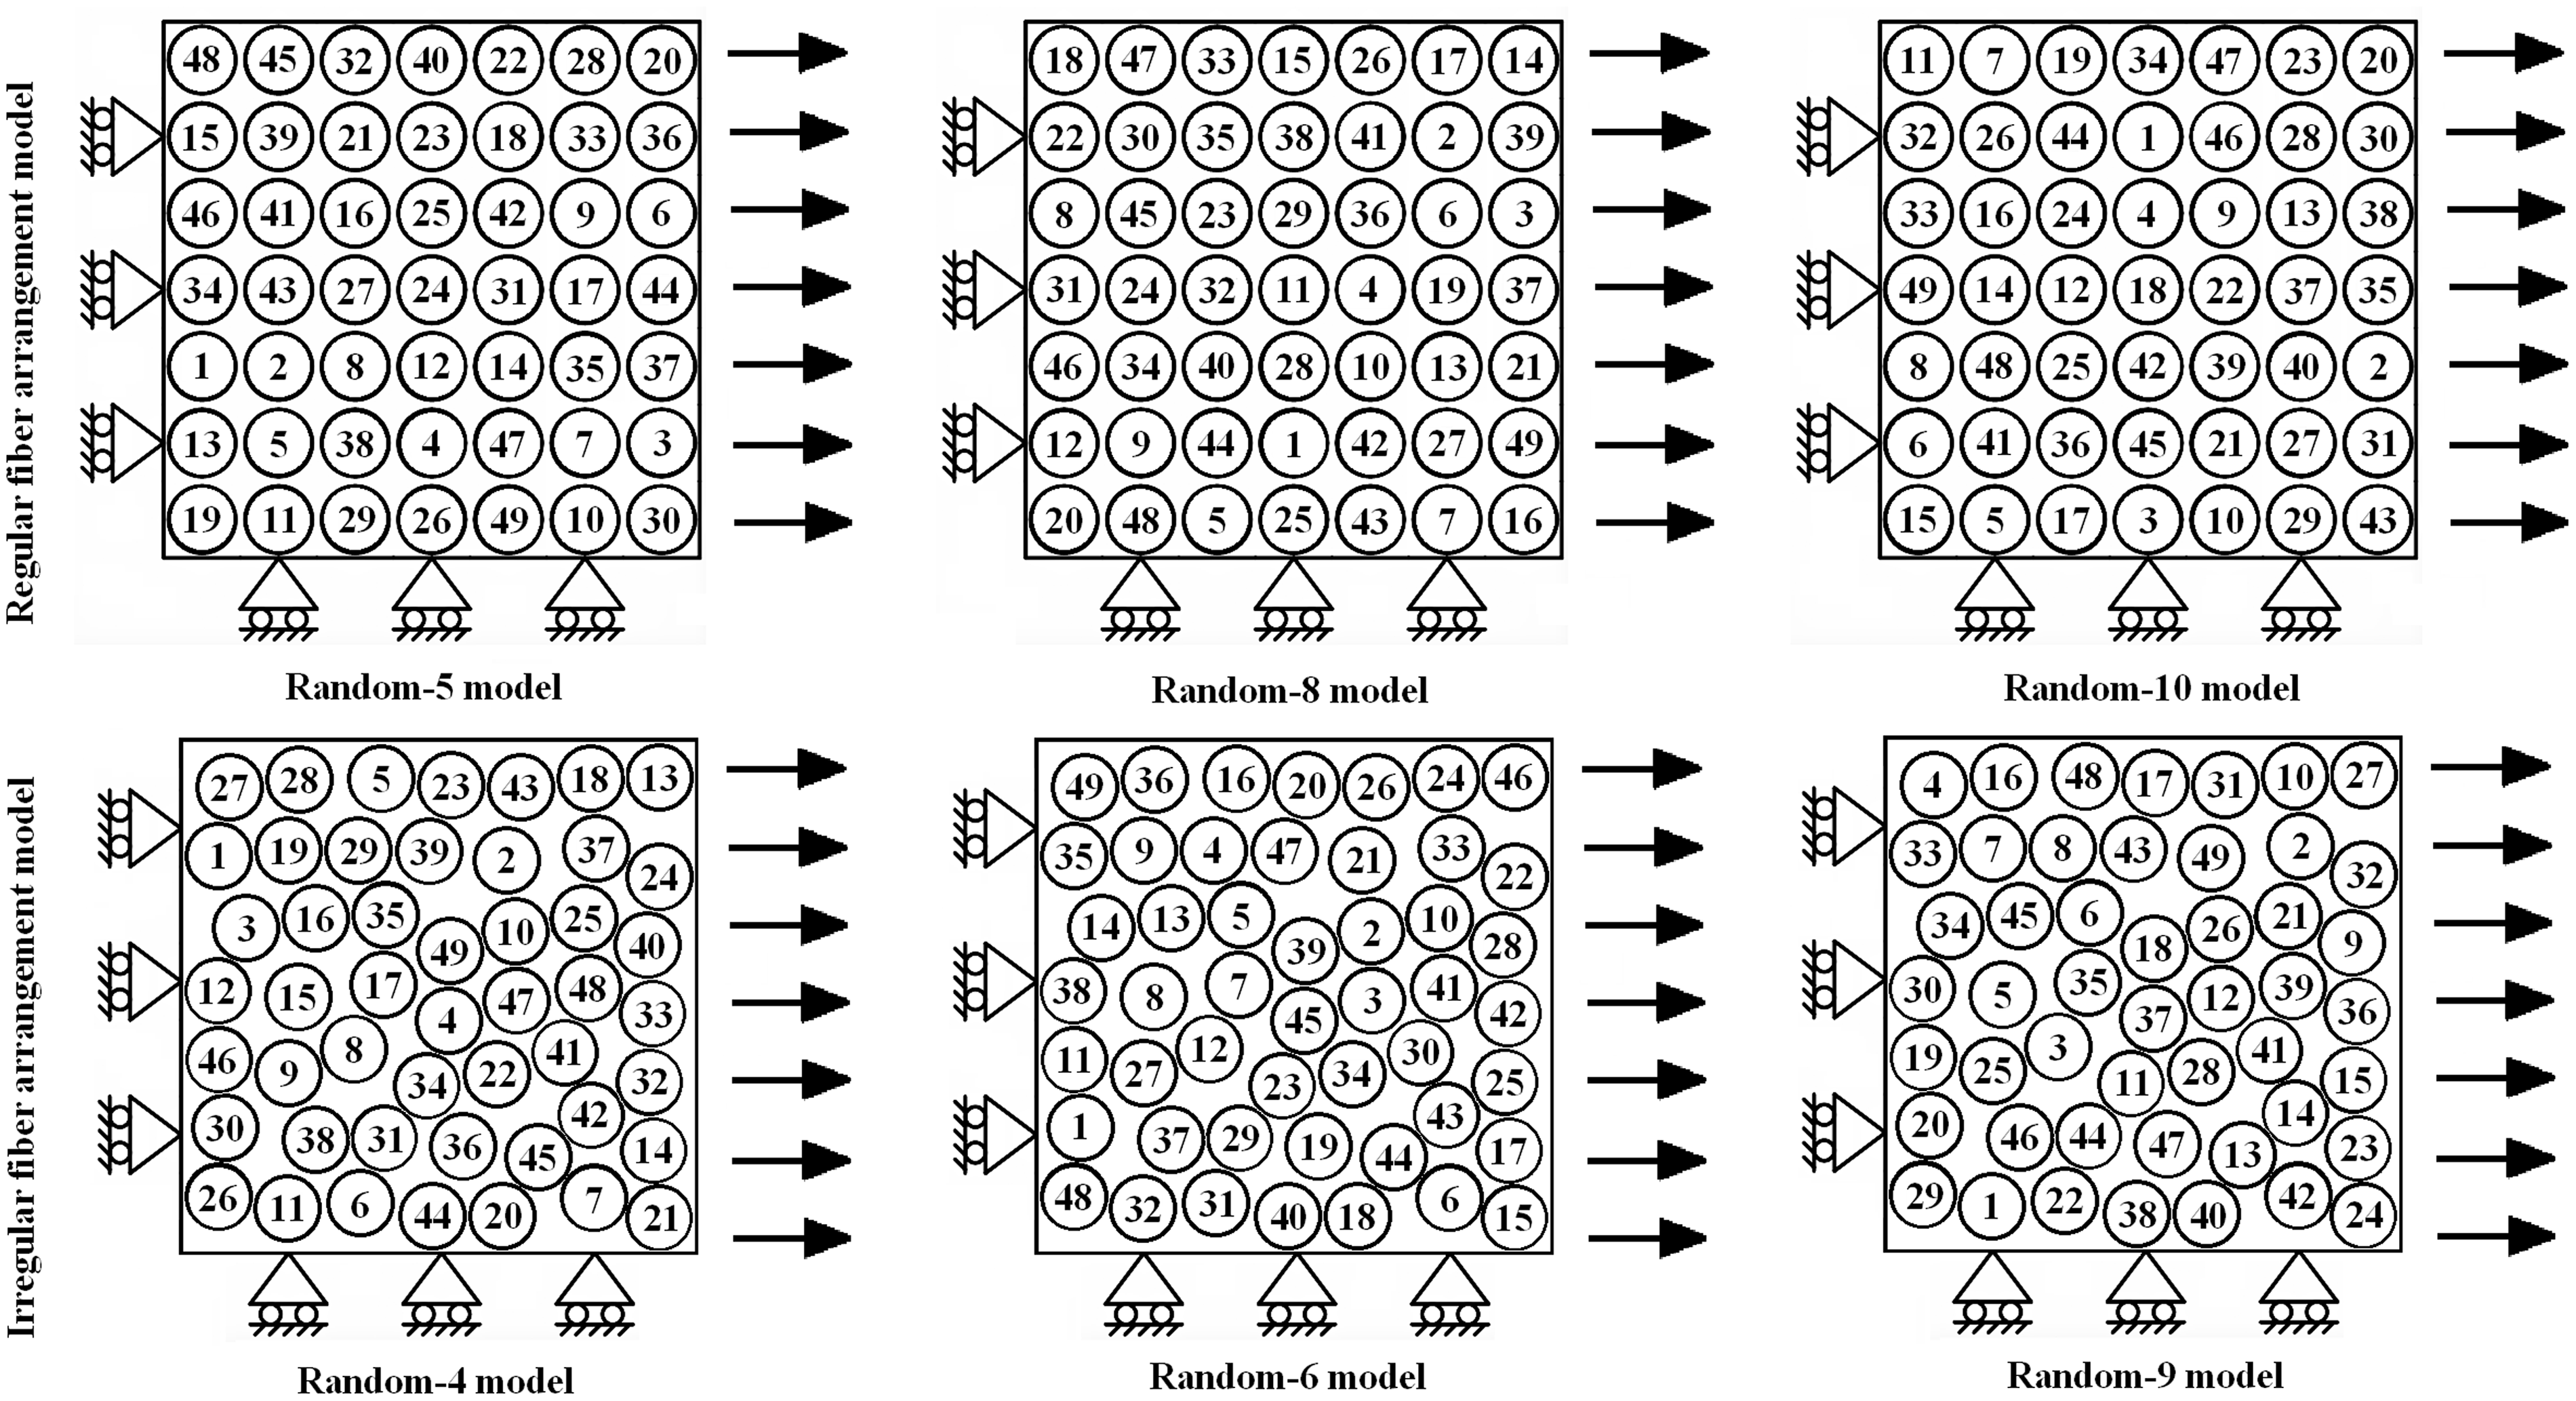
respectively. The SIS distribution and the corresponding fiber number are shown in Figure 7. In general, both the fiber position coordinates and distribution of fibers with SIS are random located in the cross-section plane of UD-FRP composites. In the present work, we mainly focus on the SIS effect, and the fiber position coordinates are fixed as shown in Figure 1. To capture the characteristic of random location distribution of fibers with SIS, 10 models of different fiber location distribution generated by a random permutation algorithm were calculated for both regular and irregular fiber arrangement. Figure 8 shows the fiber location distribution of several models.
Weibull distribution-based SIS and the corresponding fiber number used in FEM model. Generated fiber location distributions of several RVE models.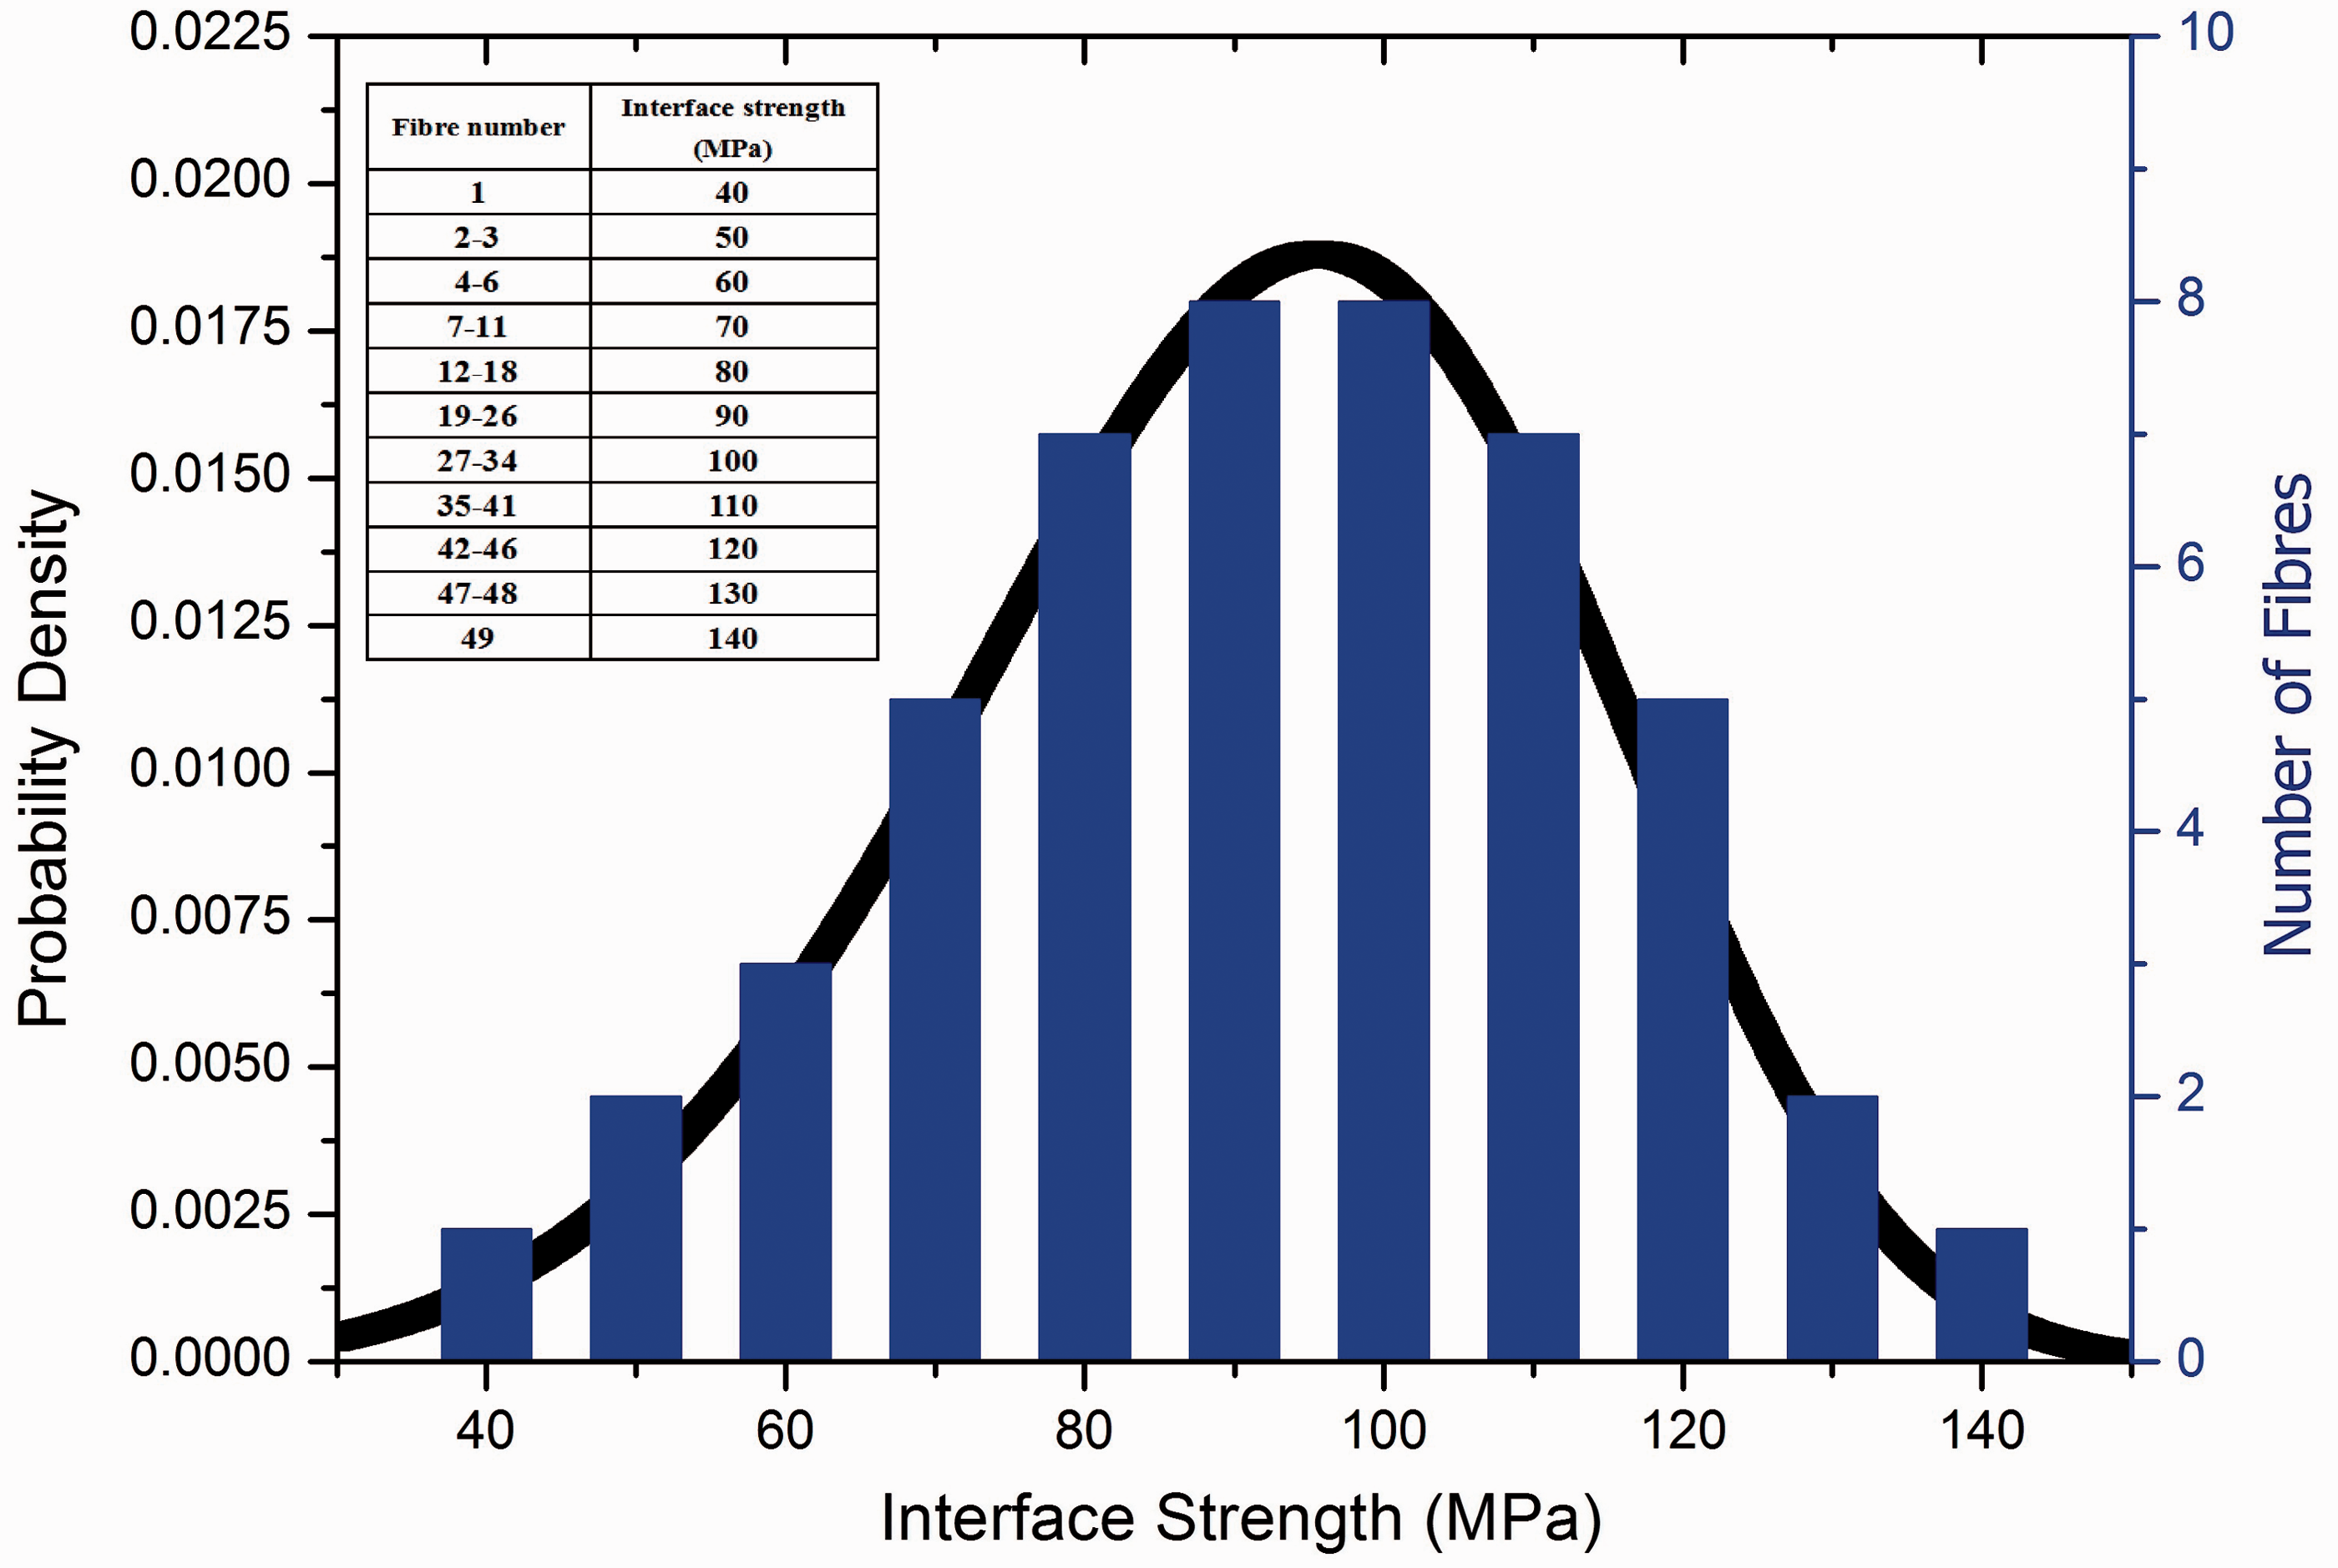
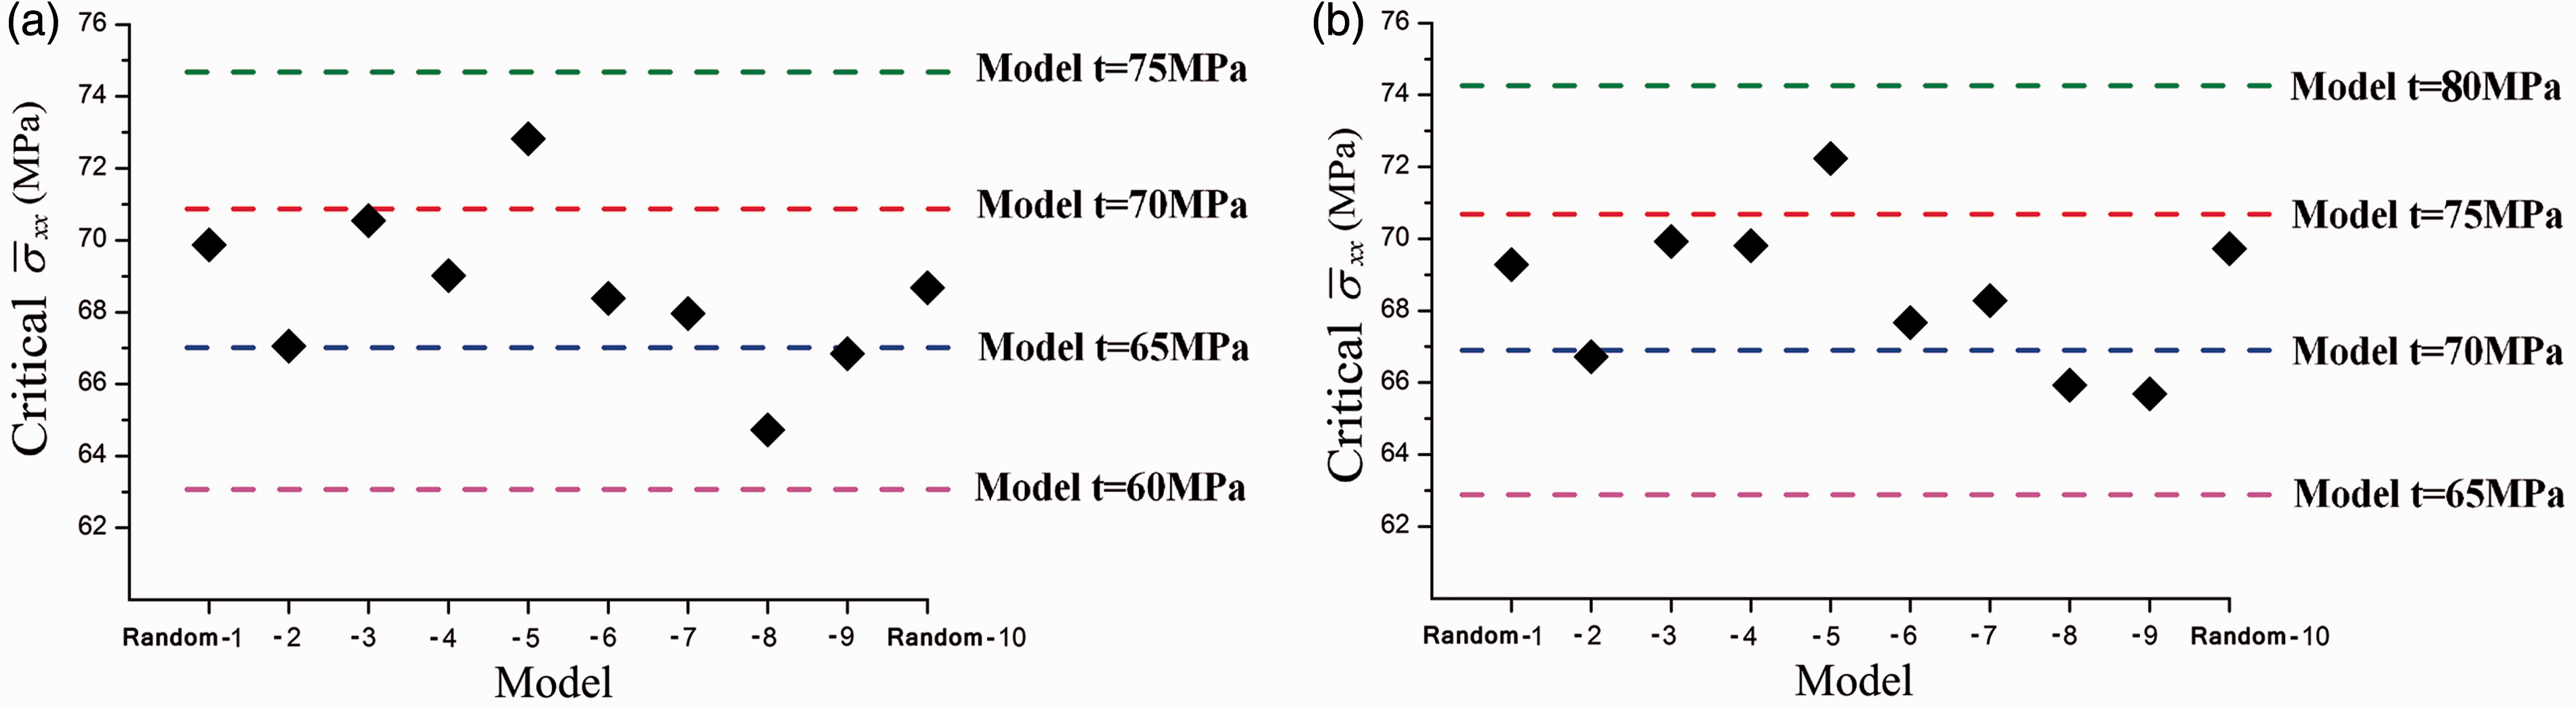
The transverse tensile response and critical strength of each SIS model are shown in Figures 9 and 10, respectively. Cases of identical interface strengths t = 65, 70 MPa, etc. are also illustrated as a comparison. The transverse tensile responses of the 10 SIS models are significantly different due to the various fiber location distributions, both for regular and irregular fiber arrangement models. The transverse tensile strength of SIS models is in the range 63–75 MPa, transverse strength of models with identical interface strength t = 60–75 MPa for regular fiber arrangement and t = 65–80 MPa for irregular fiber arrangement, which is much lower than cases of identical interface strength t = λ = 100 MPa. k = 5 is an objective and acceptable value for carbon fiber reinforced resin matrix composites.
13
However, interface strength distribution of k = 5 is scattering (Figure 7). Transverse tensile strength calculated by the identical interface strength t = λ model will lead to a significant overestimation.
Transverse tensile response of different SIS models with (a) regular and (b) irregular fiber arrangement. Critical transverse tensile strength of different SIS models with (a) regular and (b) irregular fiber arrangement.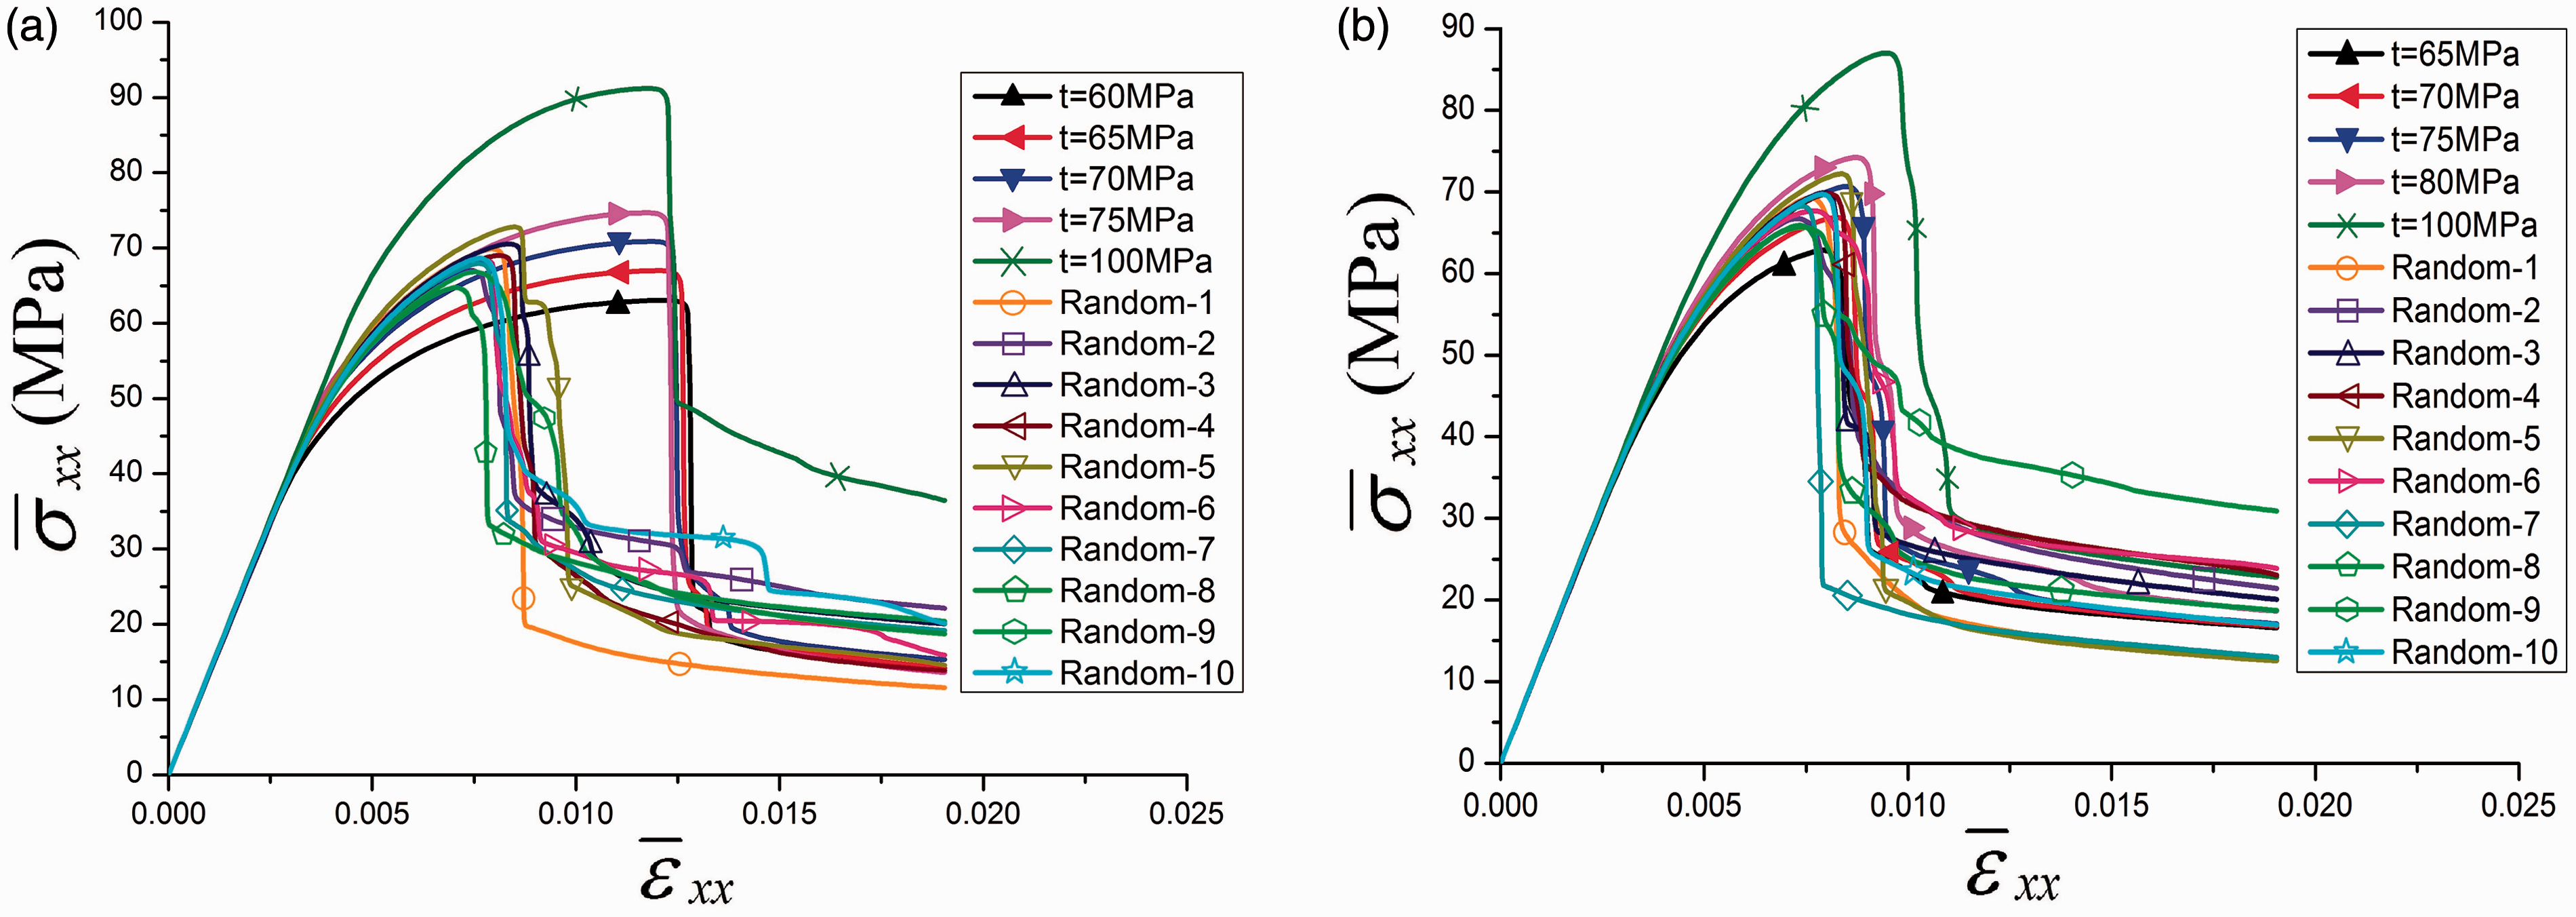
Transverse failure of UD-FRP composites can be related to the matrix yielding and interface debonding. In cases of identical interface strength, debonding of interfaces where stress concentrates occur almost simultaneously due to the identical interface strength. In contrast, debonding tends to occur from interfaces of lower strength in SIS cases, which helps reduce the net section for load bearing and thus leads to a lower transverse strength.
The failure strain of SIS models with regular fiber arrangement is much lower than that of identical interface strength (Figure 9(a)). Because failure path usually goes along interfaces of lower strength transverse to the loading direction, which helps reduce the critical failure strain and makes it much easier to form the failure path. However, the failure strain of SIS models with irregular fiber arrangement is not significantly different from that of identical interface strength (Figure 9(b)). This can be attributed to the random distributed fiber grids, which makes the failure path more tortuous and failure process more complex.
Effect of SIS on the failure process
In this section, the effect of Weibull distribution-based SIS on the transverse tensile failure process will be discussed. The scale parameter is λ = 100 MPa. A narrow Weibull distribution is more persuasive for illustrating the SIS effect on the failure process. Therefore, a larger shape parameter k = 15 is used here. The SIS distribution and the corresponding fiber number are shown in Figure 11.
Weibull distribution-based SIS and the corresponding fiber number used in FEM model.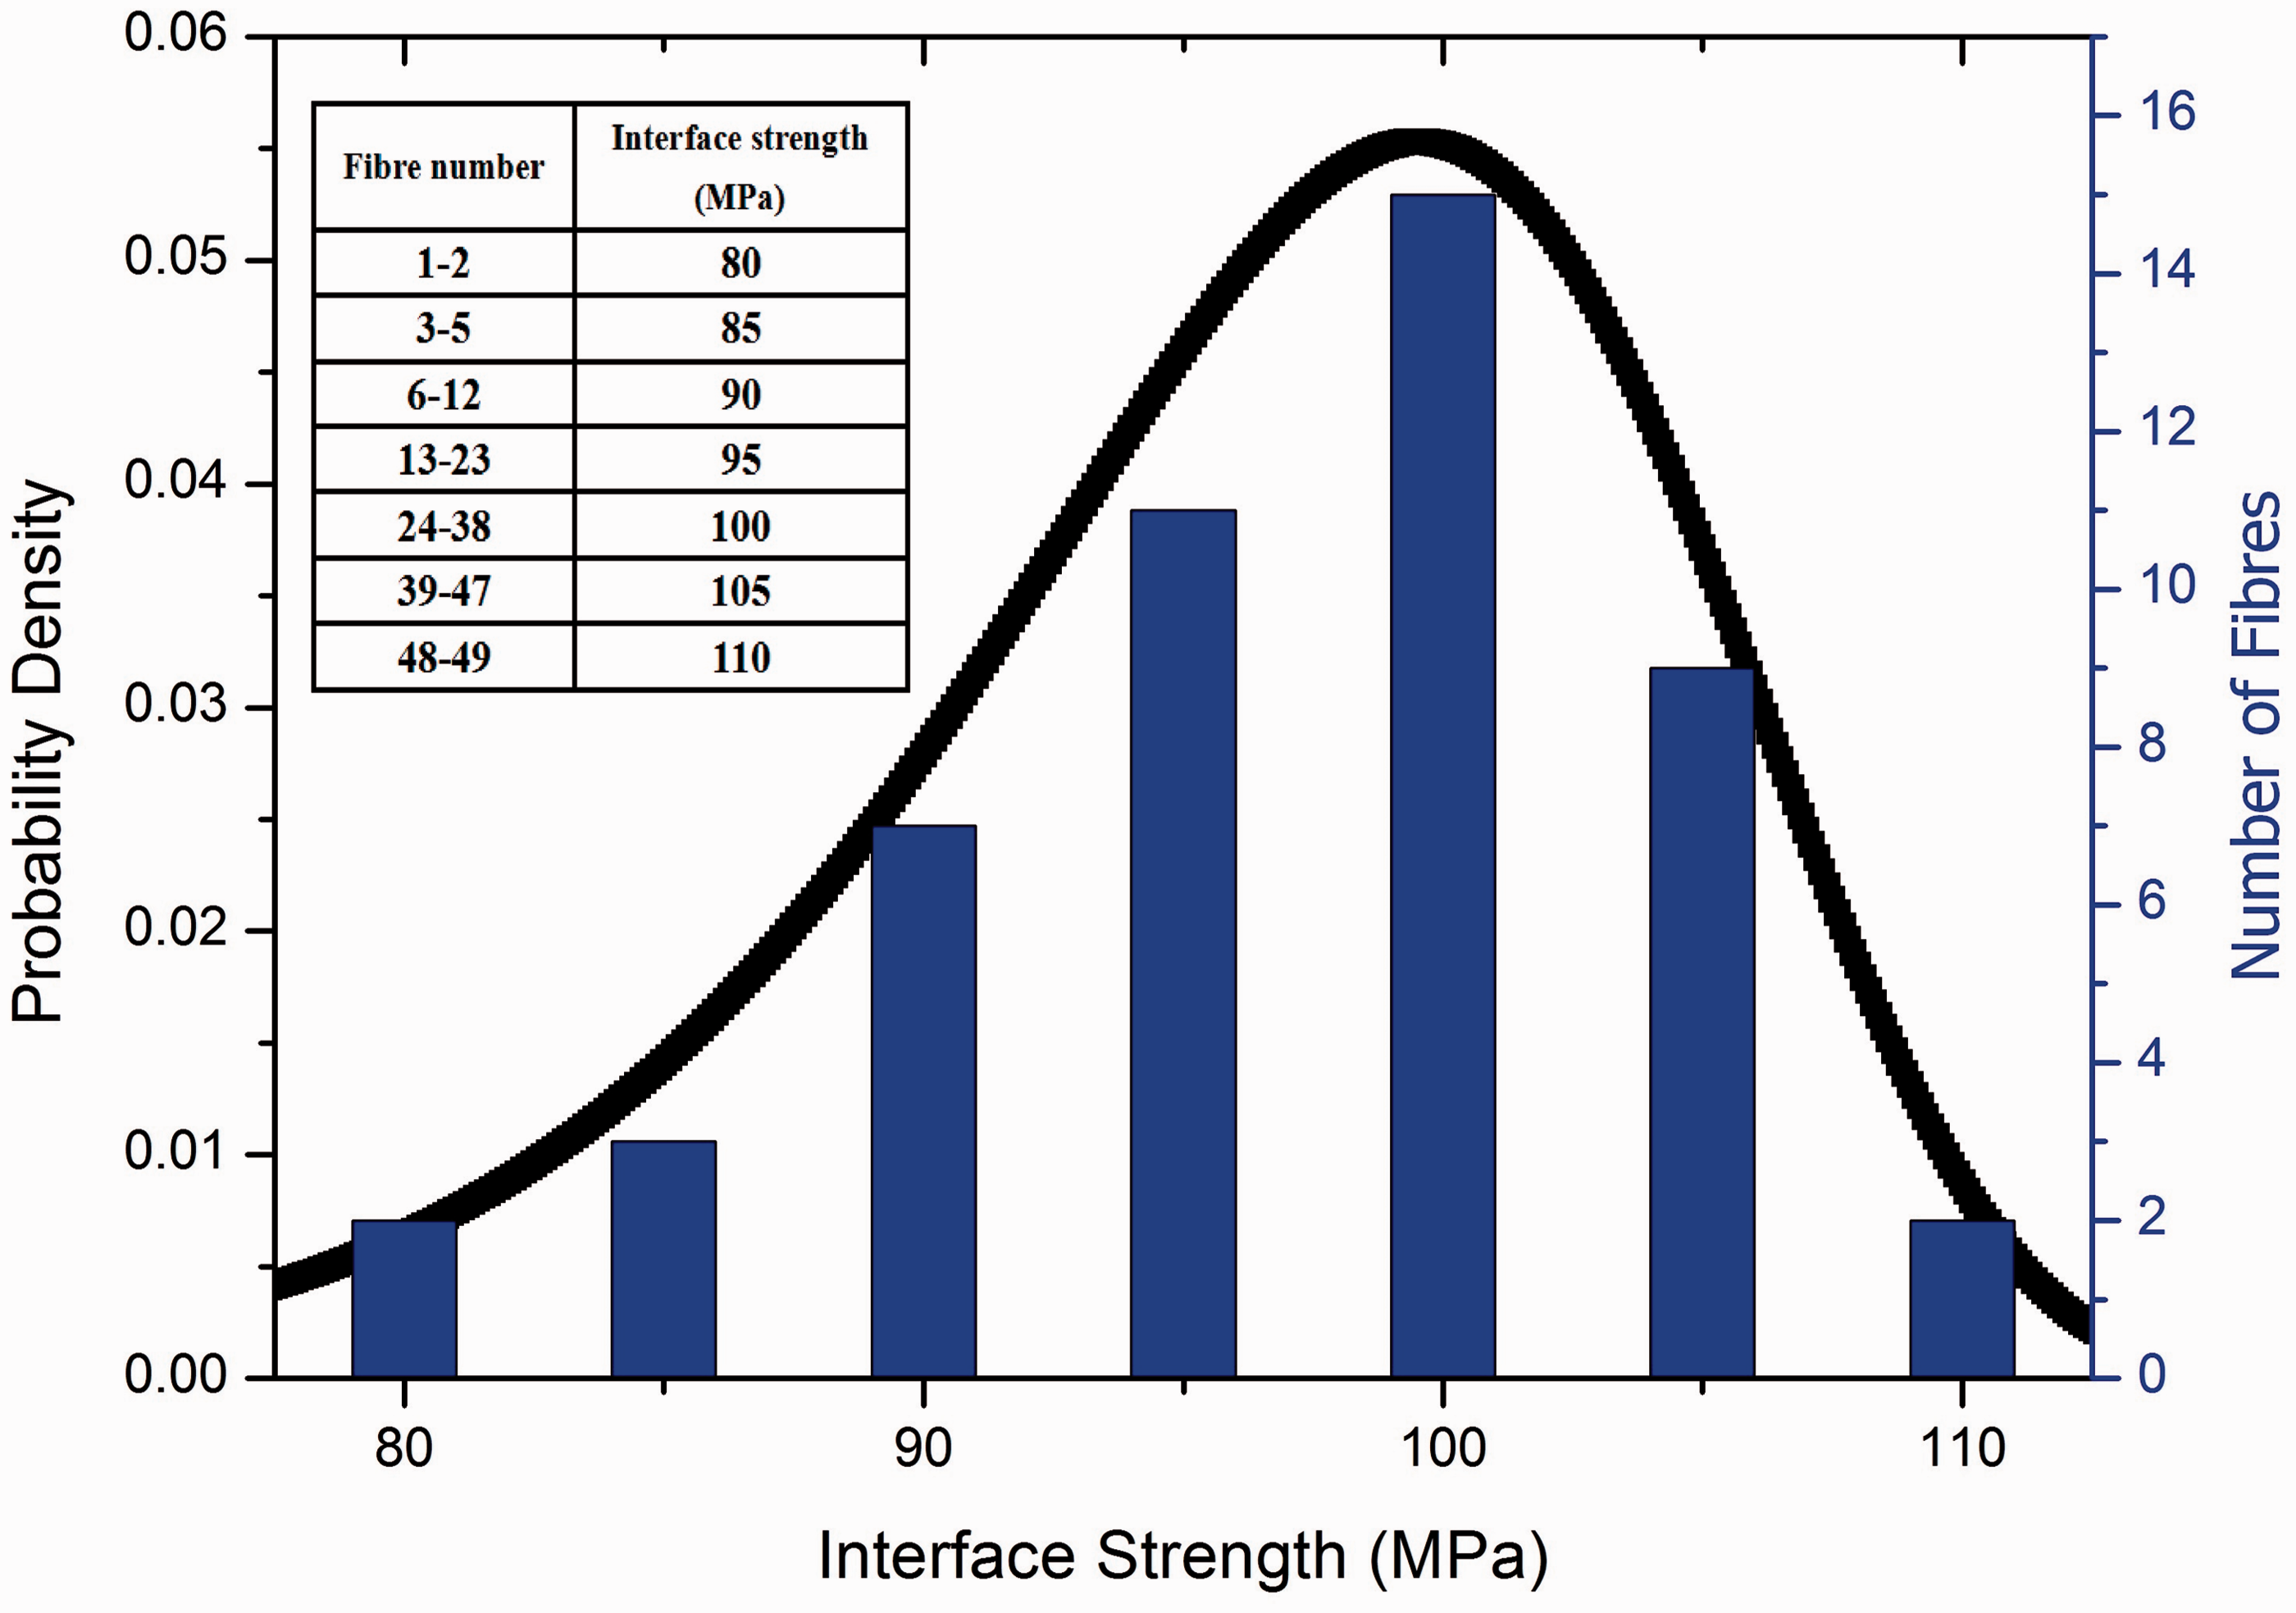
The fiber location distribution generated by the random permutation algorithm is shown in Figure 12(a) and (f). Debonding tends to occur from interfaces of fiber No. 1 and No. 2 due to their lowest strength (see Figure 11). To investigate the fiber location effect on the failure process, RVEs of various distances between fiber No. 1 and No. 2 in the loading direction were generated and illustrated in Figure 12(b) to (e) and (g) to (j). The difference between Figure 12(b) to (e) and (a) (or Figure 12(g) to (j) and (f)) is the location exchange of fiber No. 2 with fiber No. 14, No. 25, No. 19, and No. 4, respectively.
Fiber location distribution of each RVE model. (a–e) regular and (f–j) irregular fiber arrangement.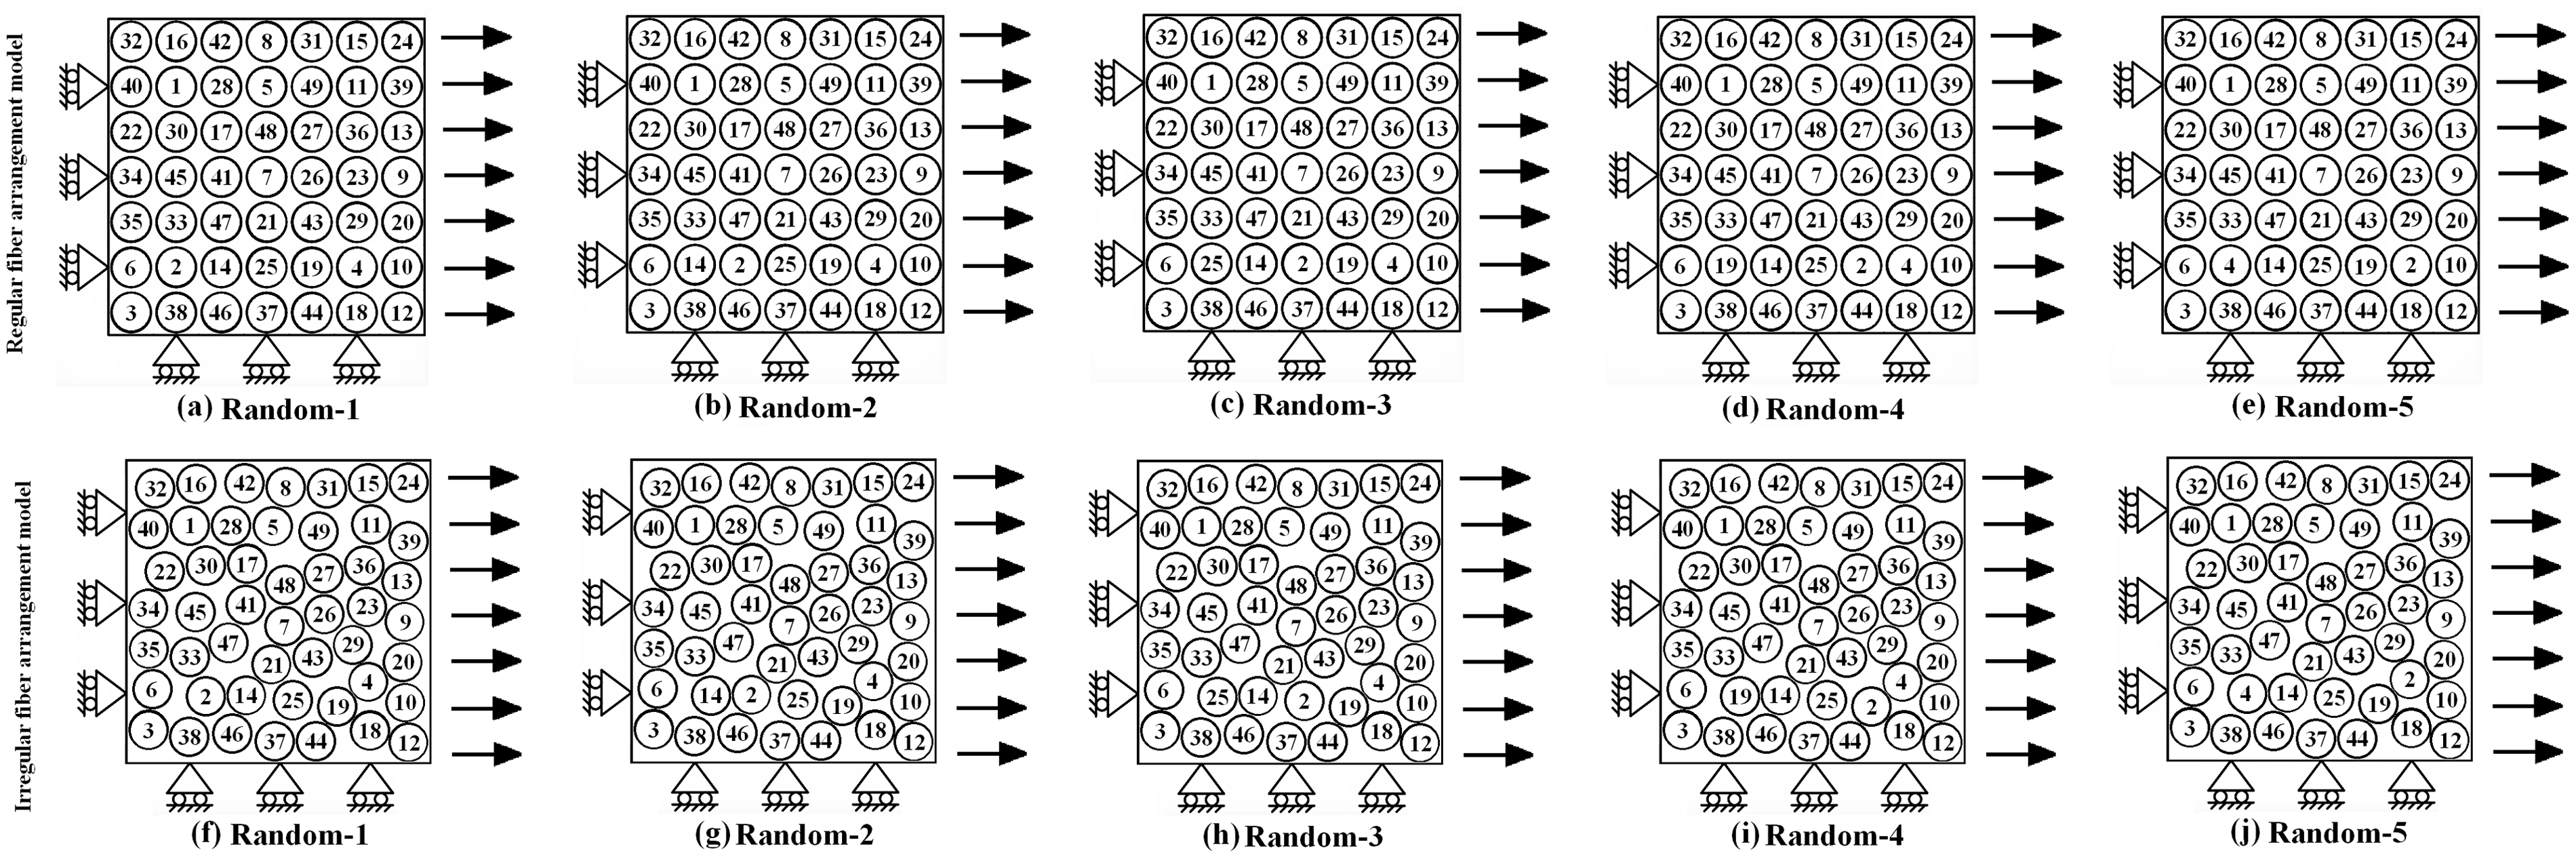
The transverse tensile response of each SIS model is shown in Figure 13. Due to the nearly same fiber location distribution, the transverse tensile responses of the five SIS models are almost identical, both for regular and irregular fiber arrangement. However, the failure path of each model is significantly different (Figure 14).
Transverse tensile responses of different SIS models. Failure paths of SIS models with (a–e) regular and (f–j) irregular fiber arrangement (the deformation scale is 1.0).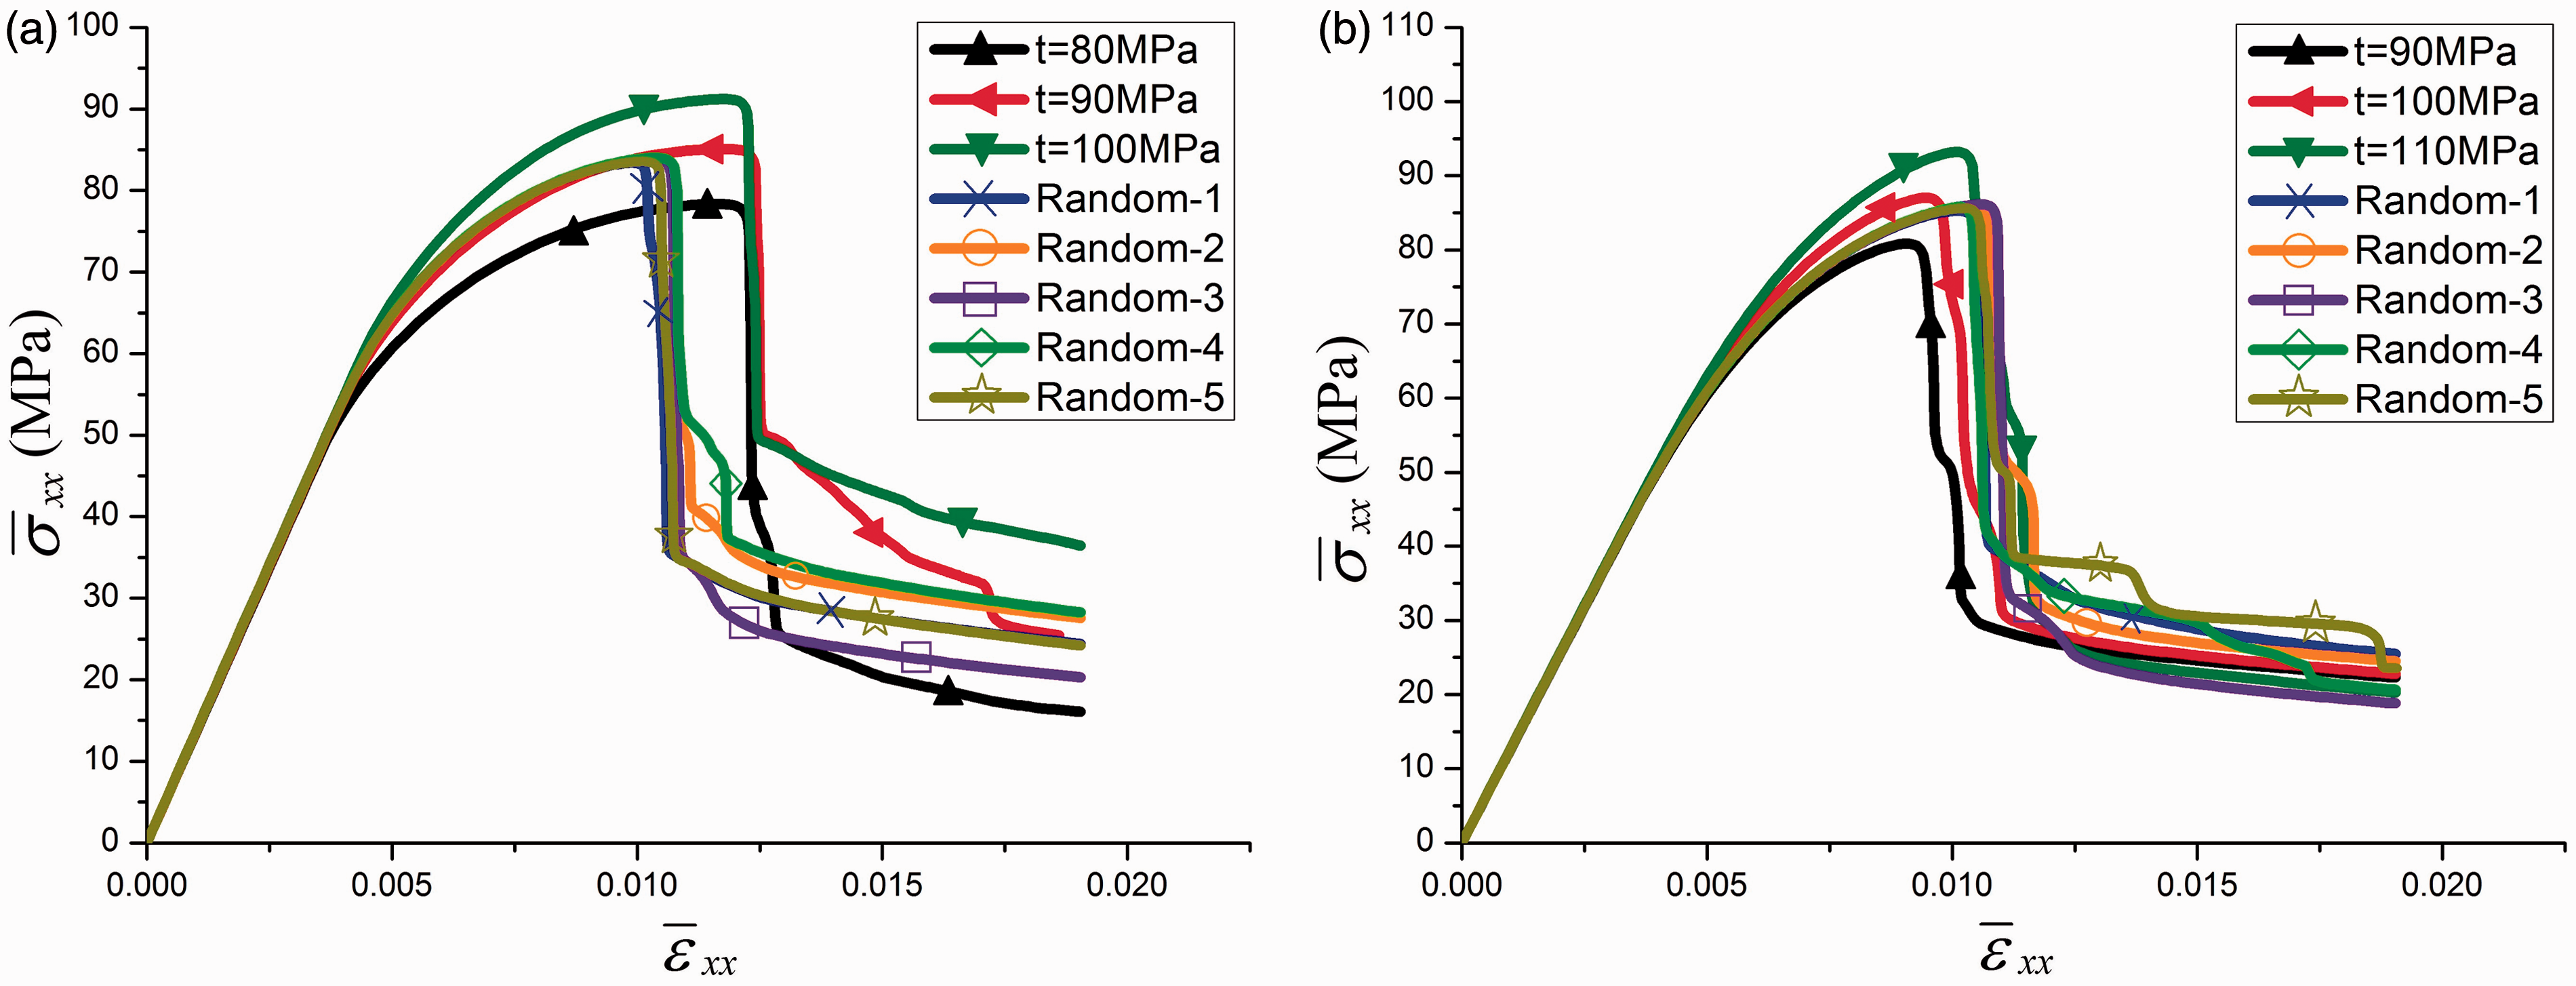
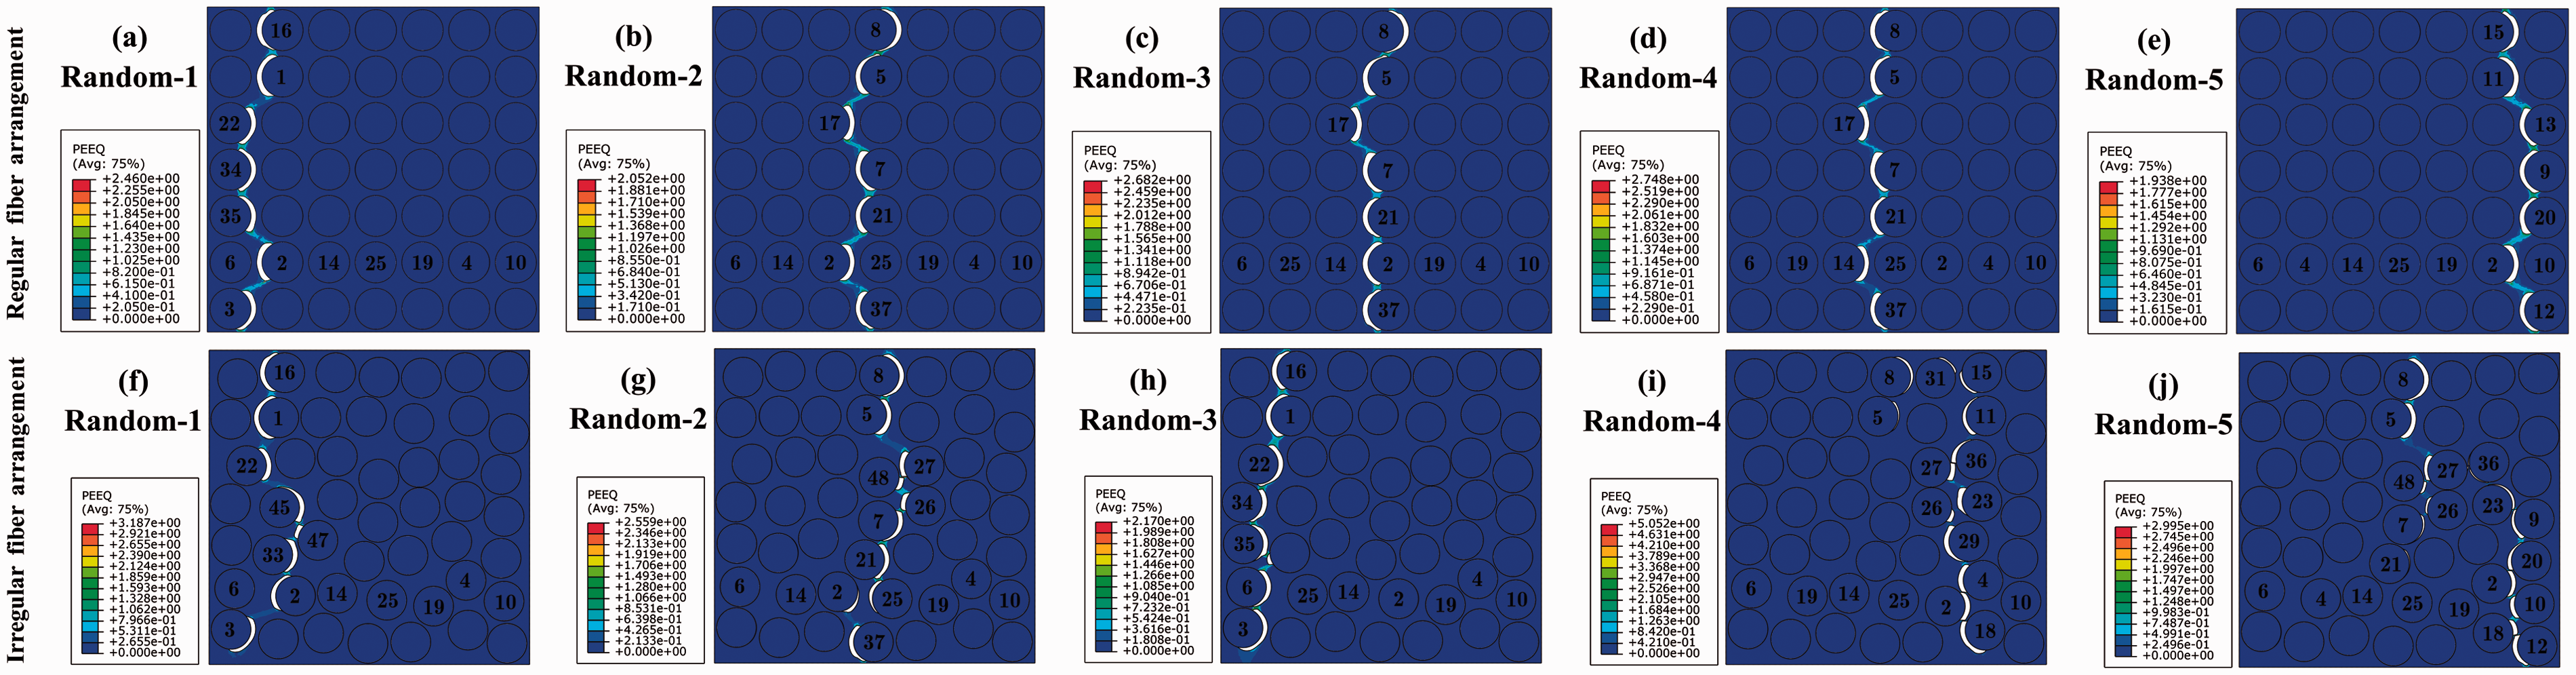
In regular fiber arrangement models, the failure paths are perpendicular to the loading direction but along different interfaces, despite the unique difference between each model is the location of fiber No. 2. Different with other models where the failure paths go along interfaces of fiber No. 1 or No. 2 of the lowest strength, failure path of Random 4 model goes along interfaces of fiber No. 5 and No. 7, neither fiber No. 1 nor No. 2. It can be concluded that failure path of SIS model usually goes along interfaces of lower strength but not always the lowest strength depending on the surrounding material properties.
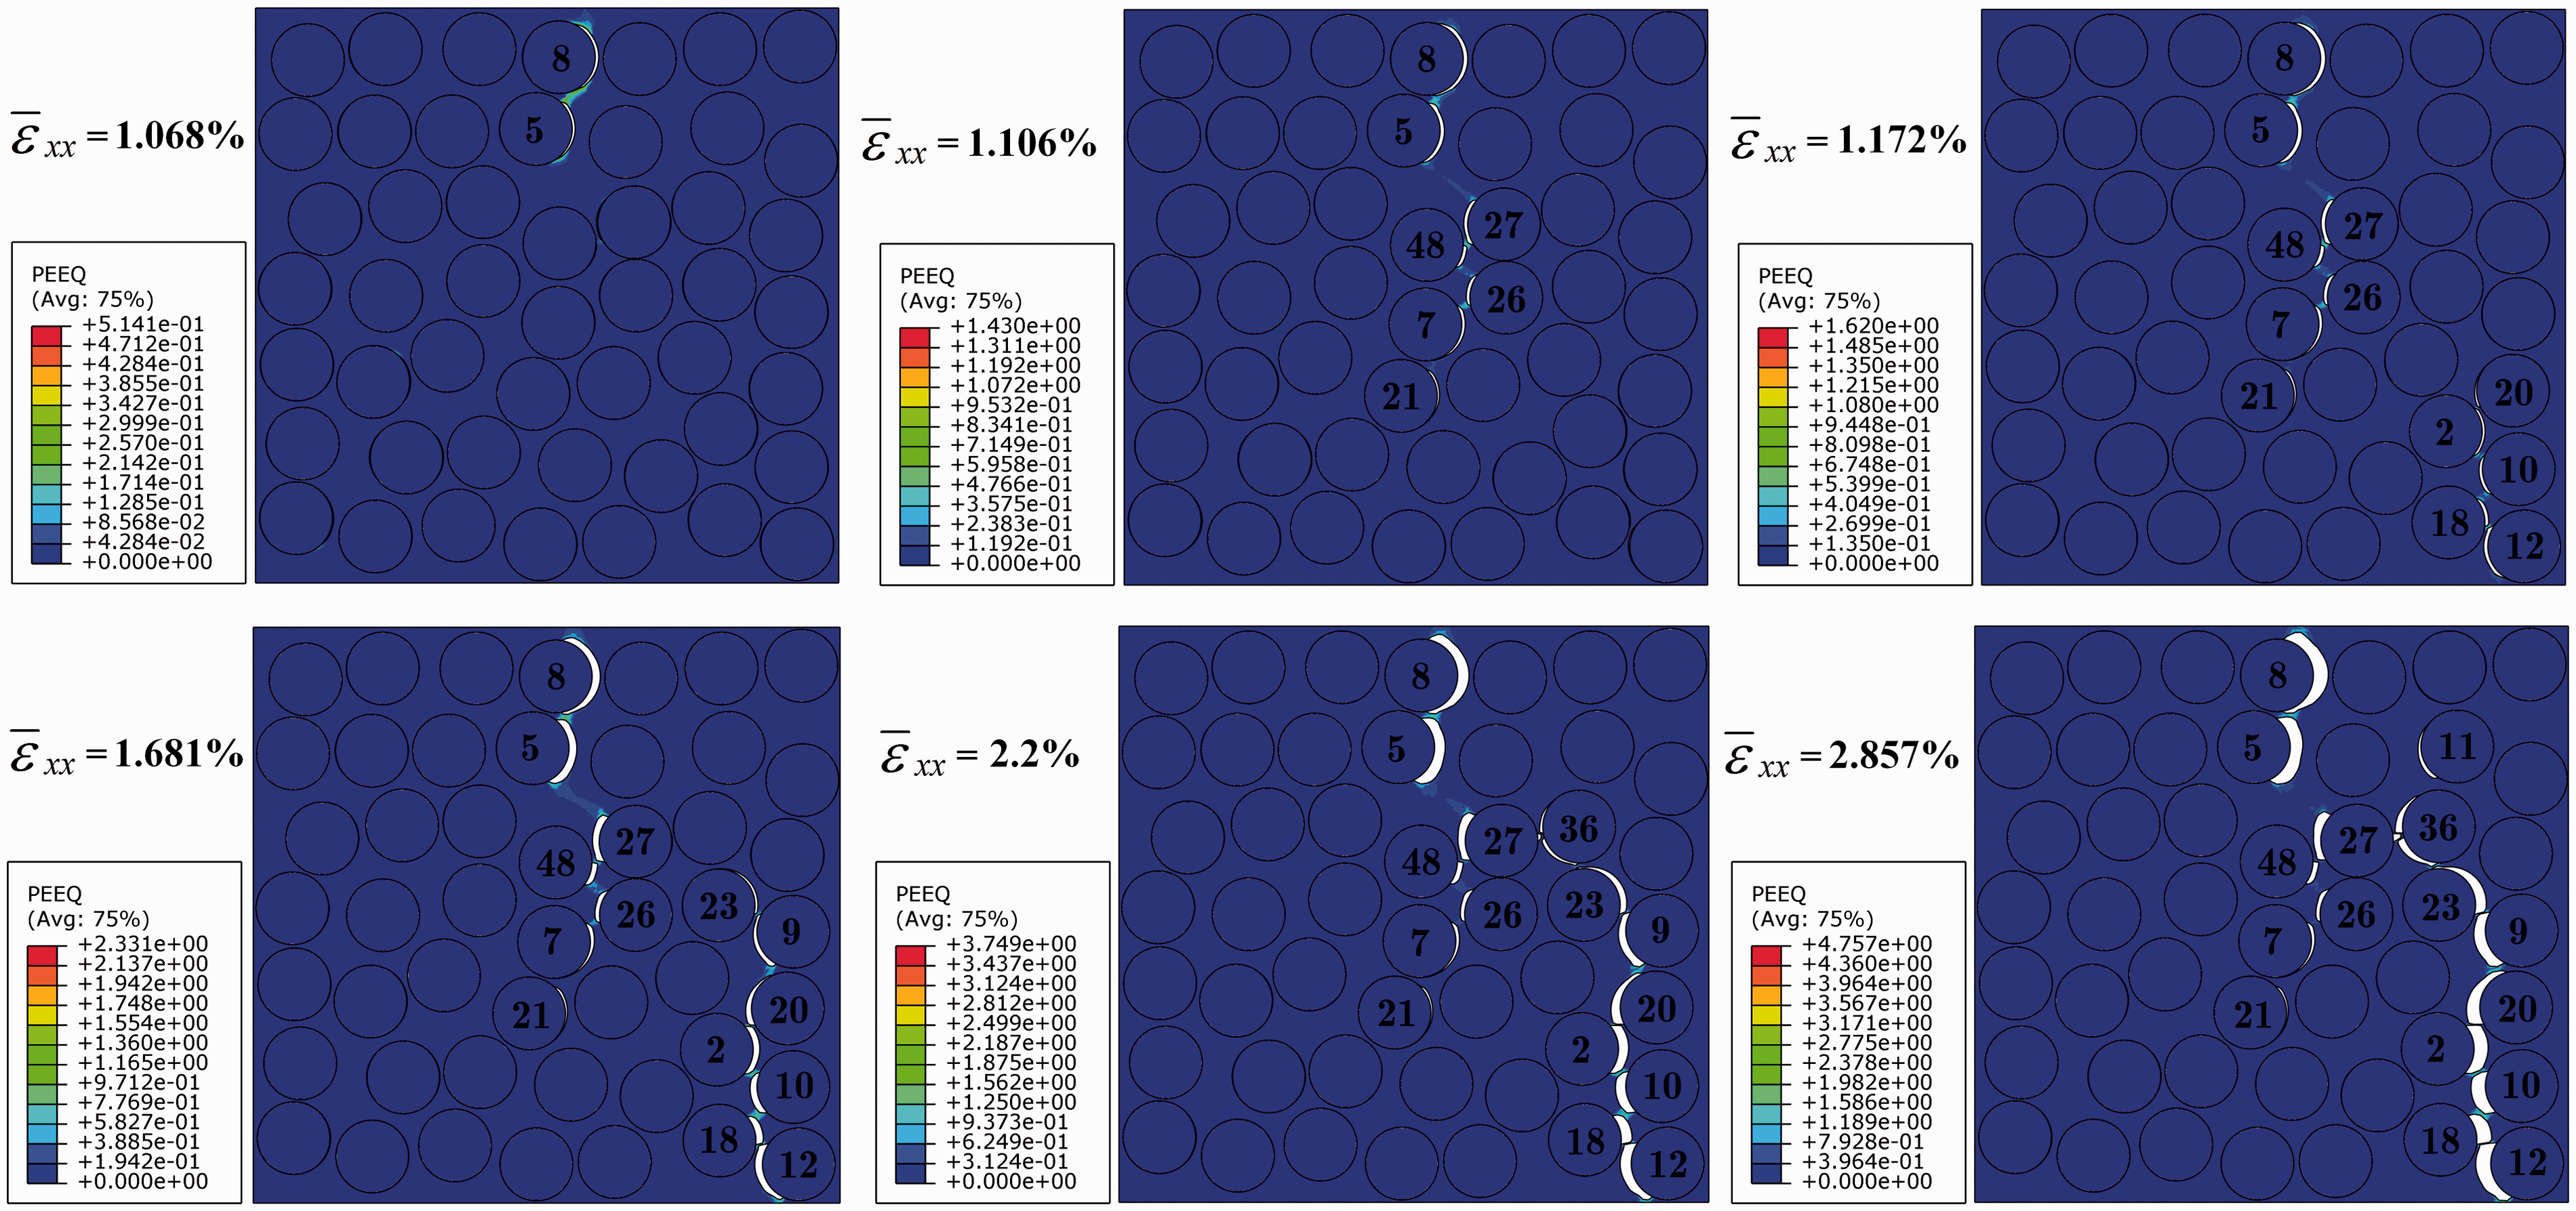
In irregular fiber arrangement models, the failure paths are more complicate and tortuous than regular fiber arrangement case on account of both SIS and irregular fiber arrangement effects. More than one crack initiate in Random 4 and Random 5 model, and the failure process of material depends on the competition of multicracks. In Random 4 model (Figure 15), the first crack initiates from fiber No. 2 interface ( Damage initiation and propagation in Random 4 model of irregular fiber arrangement (the deformation scale is 1.0). Damage initiation and propagation in Random 5 model of irregular fiber arrangement (the deformation scale is 1.0).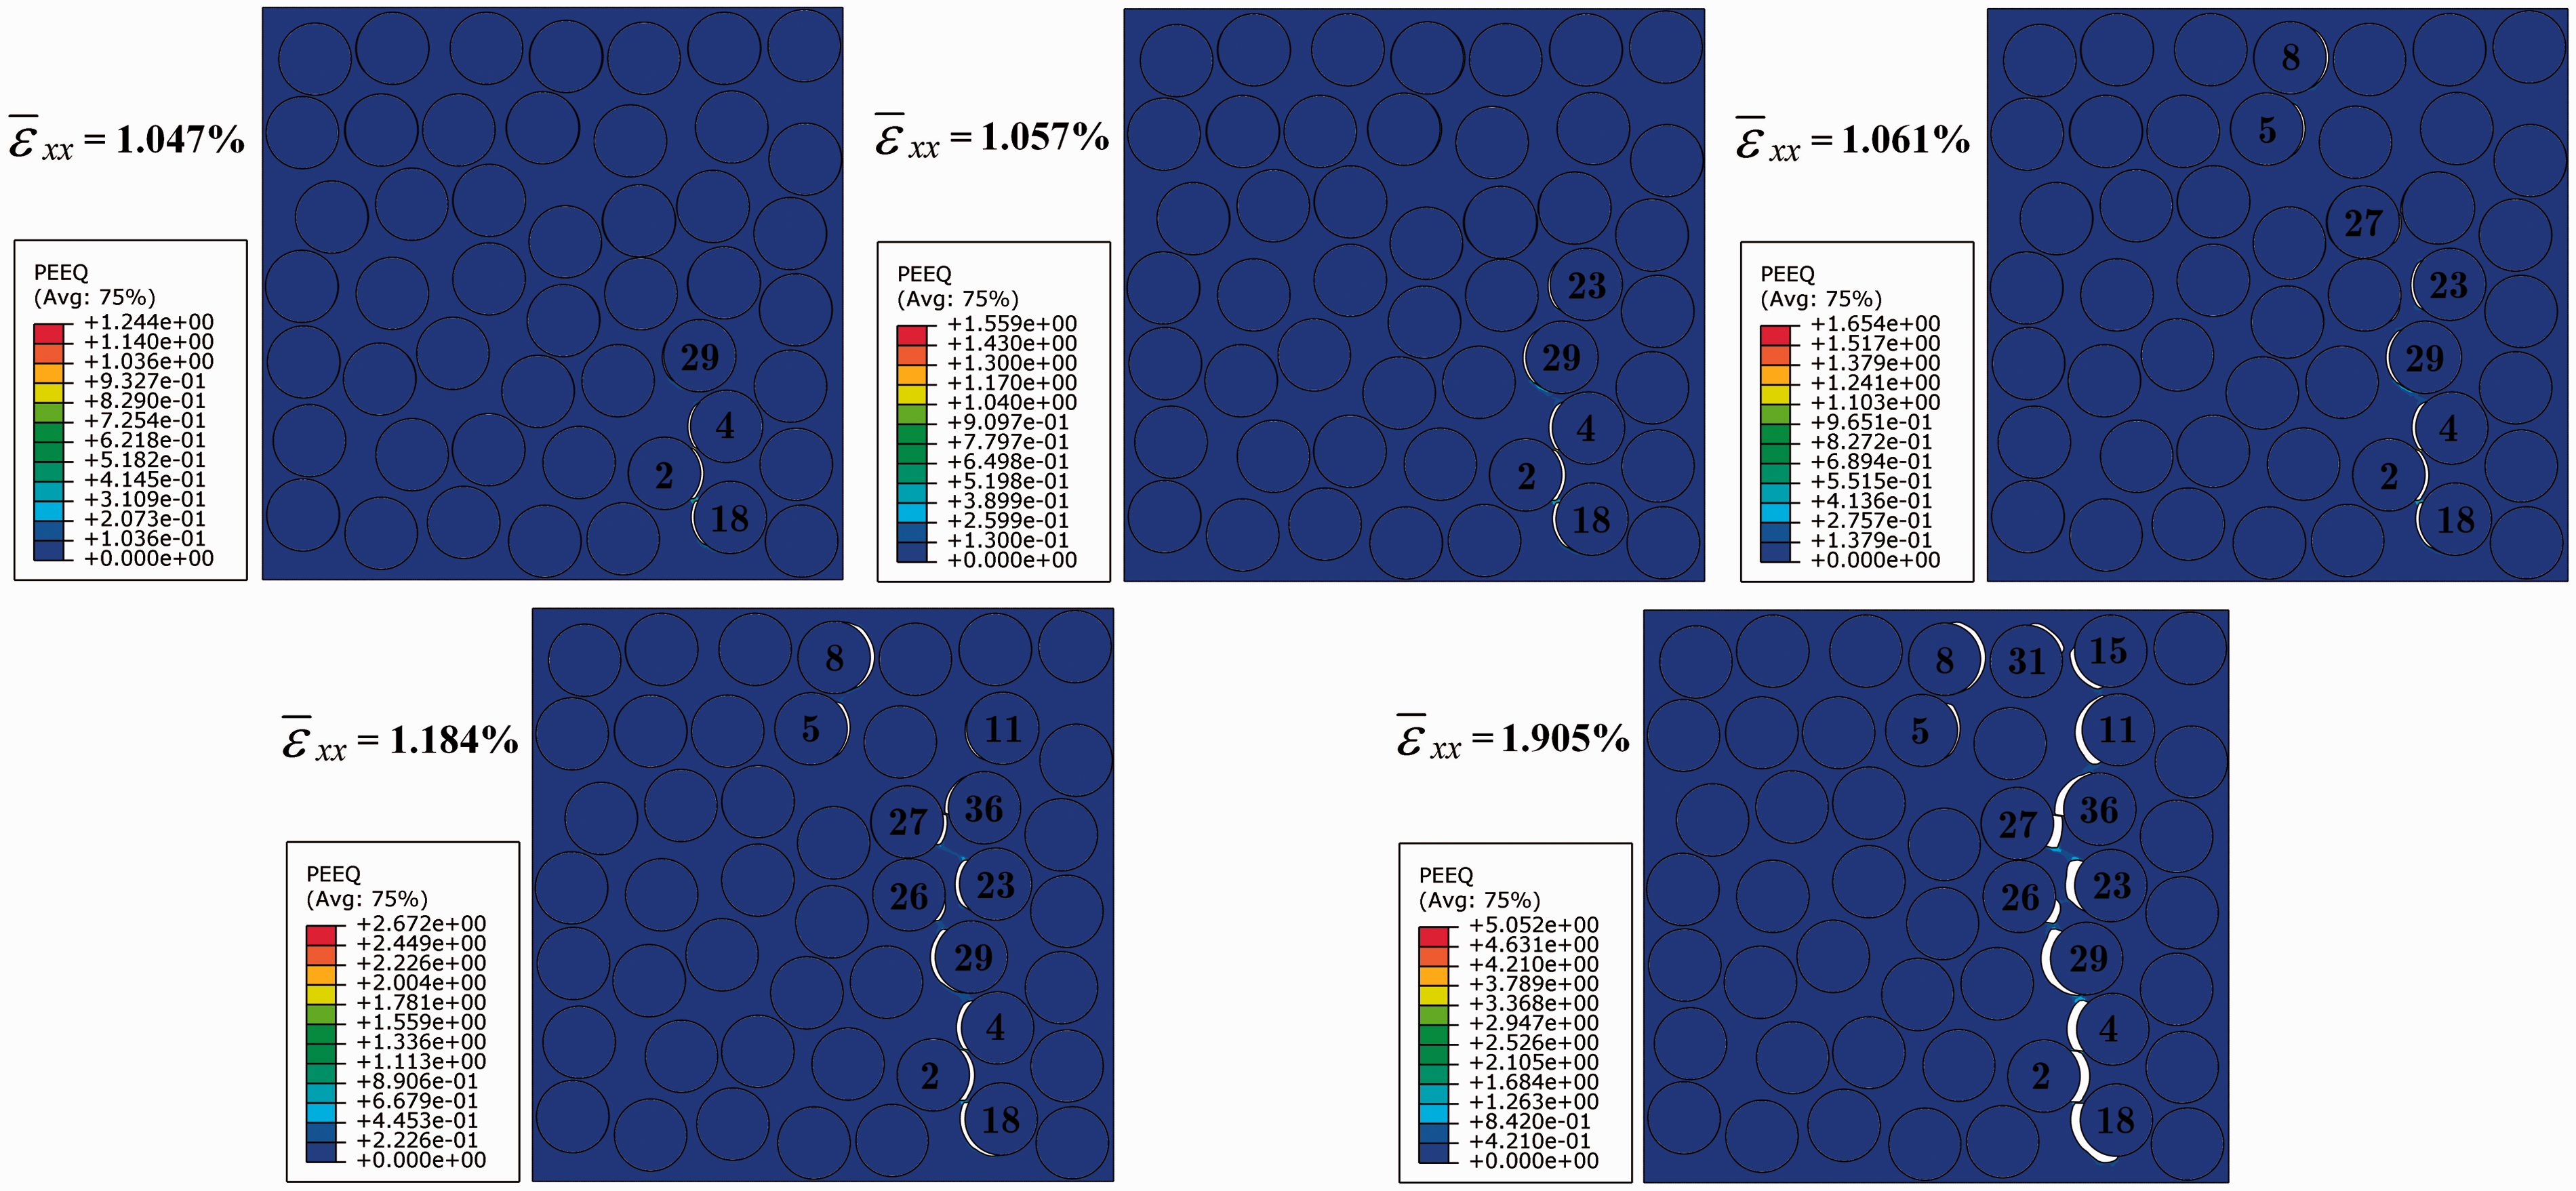
Weibull parameters study
Influence of scale parameter λ
λ is the scale parameter in Weibull distribution. In this section, transverse tensile strength of different λ will be investigated with shape parameter keeping constant as k = 15. The SIS distribution and corresponding fiber number used in FEM models of different λ are shown in Figure 17. The locations of each fiber in regular and irregular fiber arrangement models are shown in Figure 12(d) and (g), respectively.
Interface strength distribution and the corresponding fiber number used in each FEM model of different λ.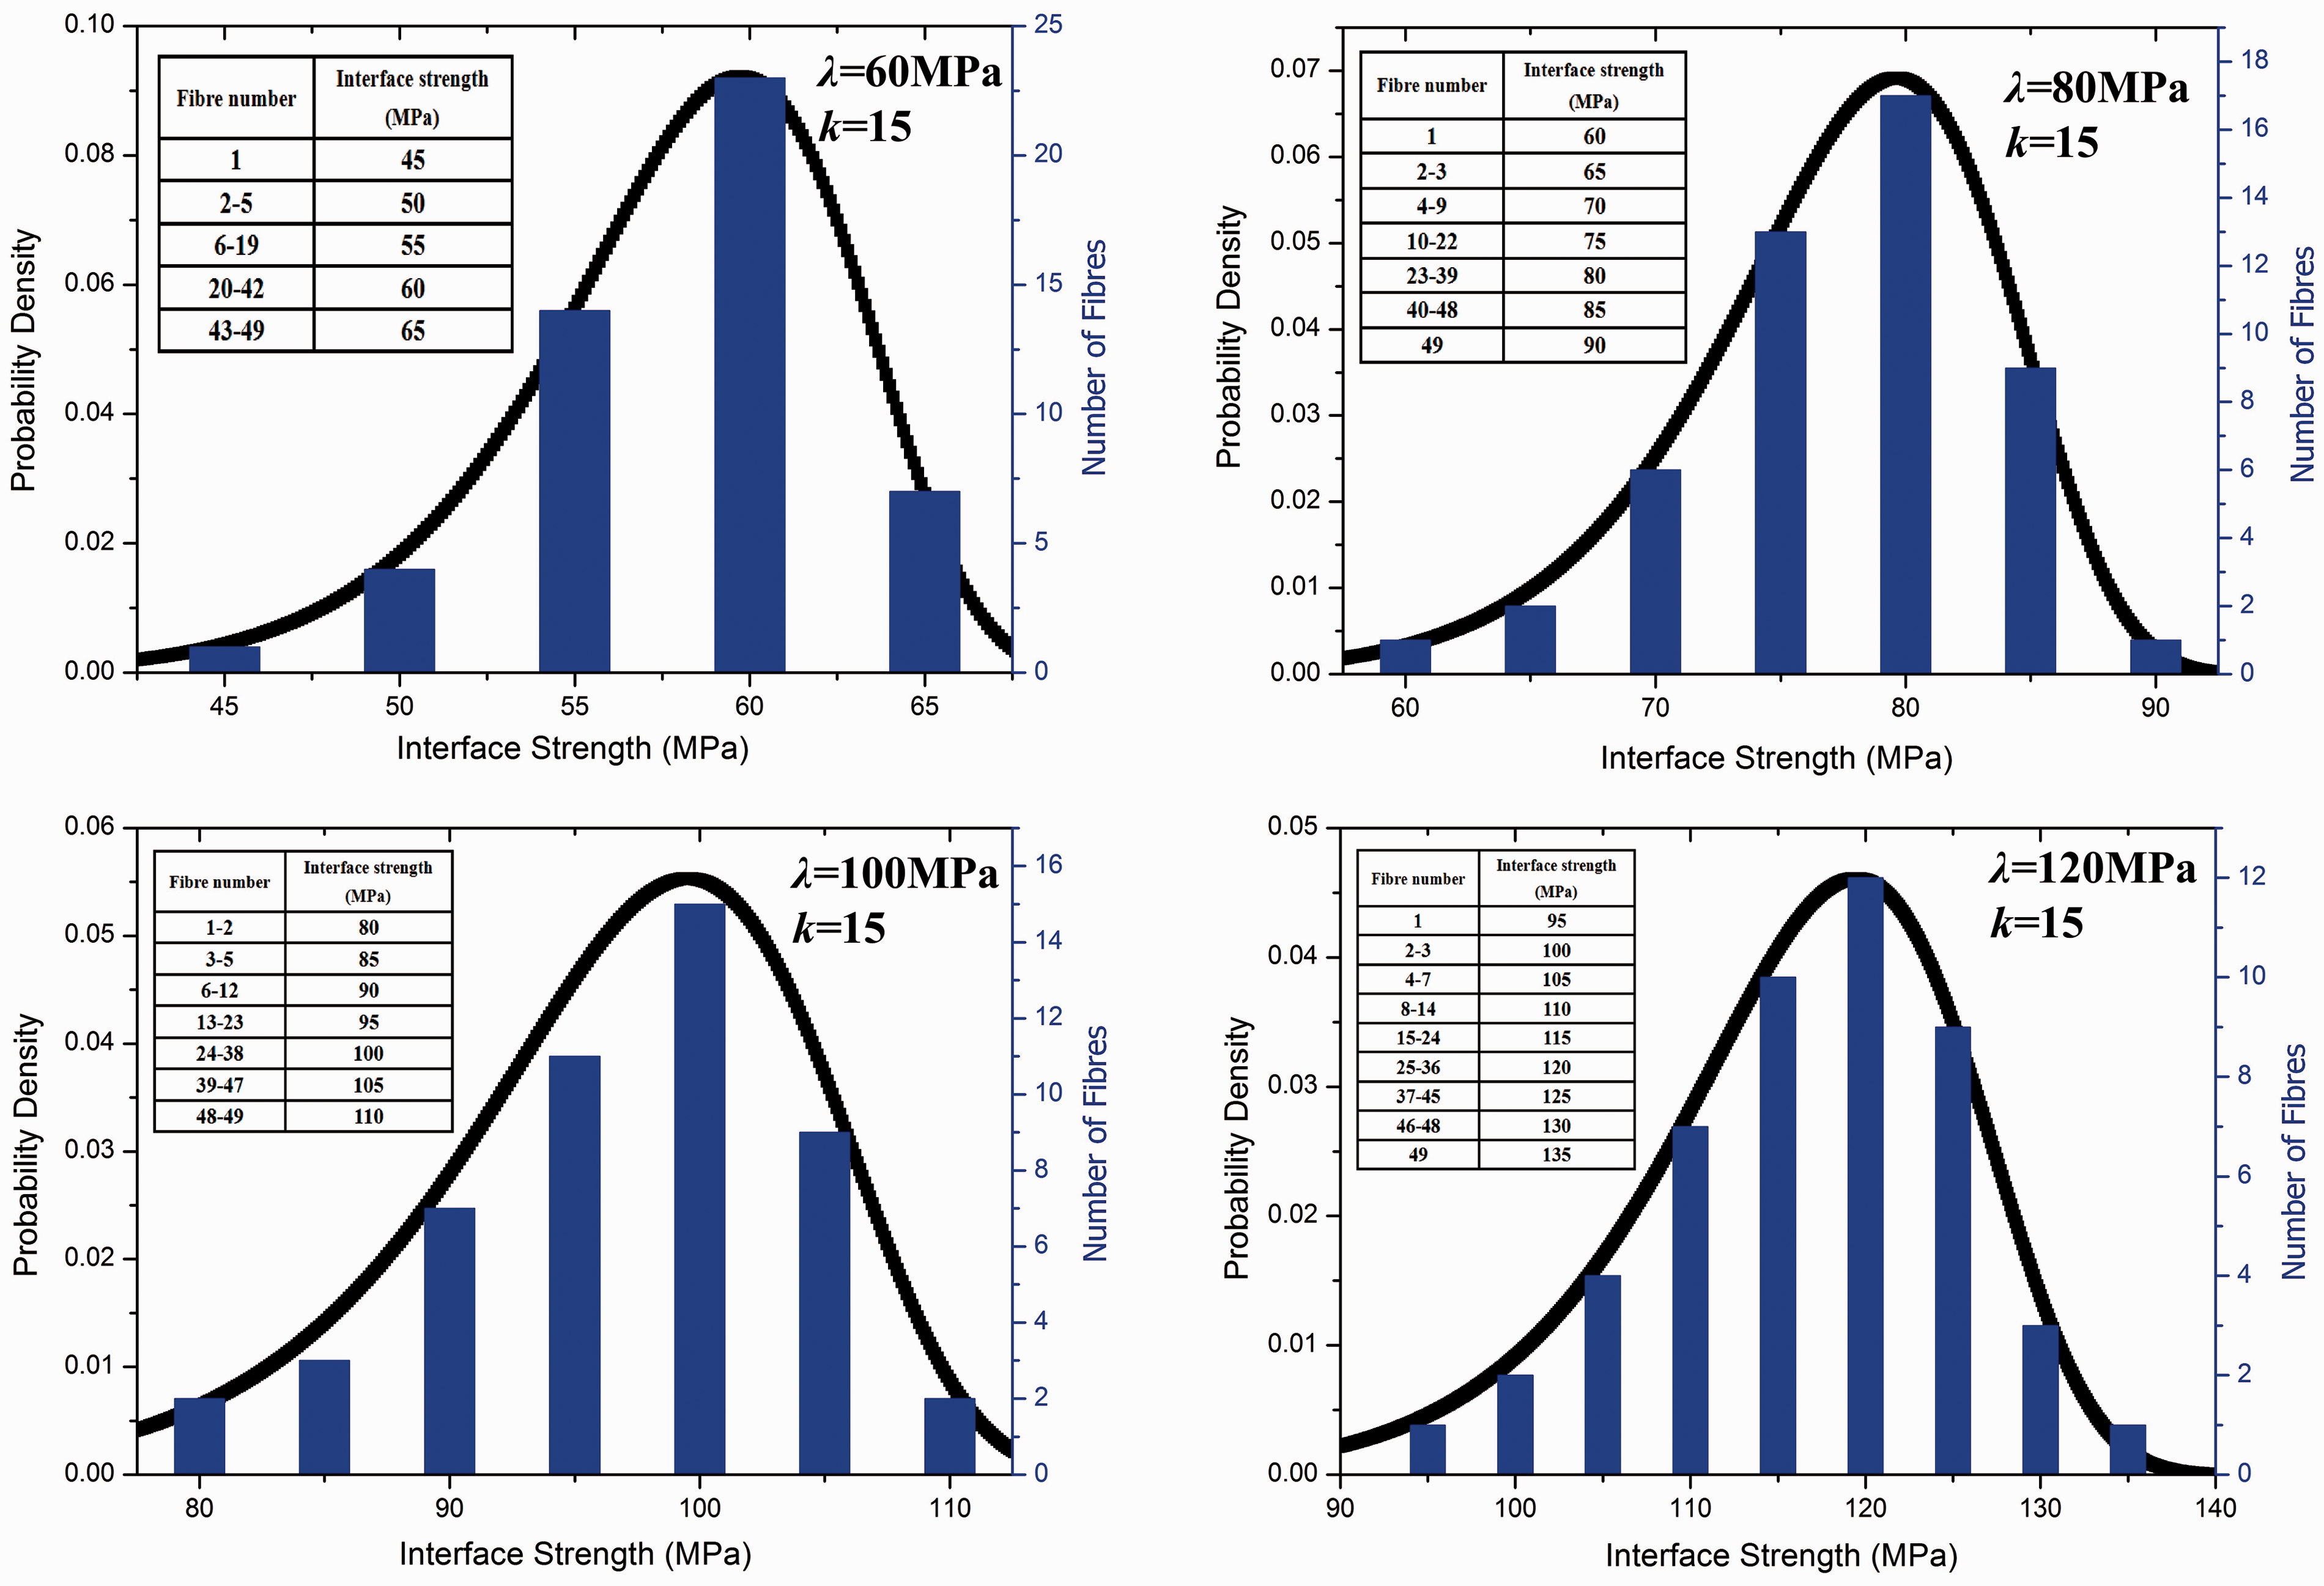
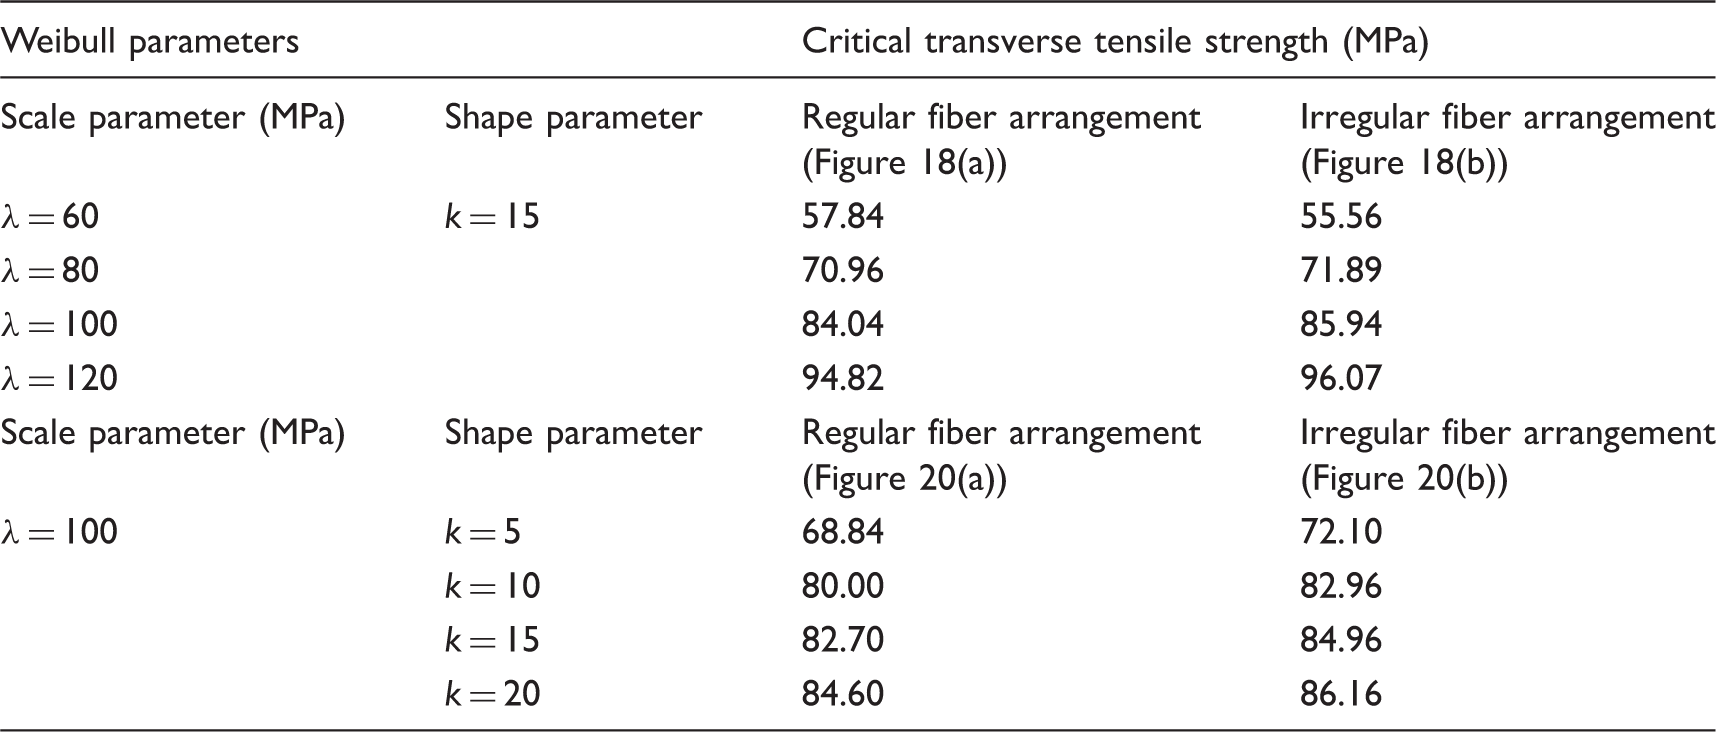
The transverse tensile responses of different λ are shown in Figure 18. The transverse tensile strength improves with the increase of λ. The main reason for this result is that larger λ corresponds to higher average interface strength in statistics, and increase of the interface strength can improve the material transverse tensile strength.
Transverse tensile responses for models of different λ. (a) Regular fiber arrangement, (b) irregular fiber arrangement.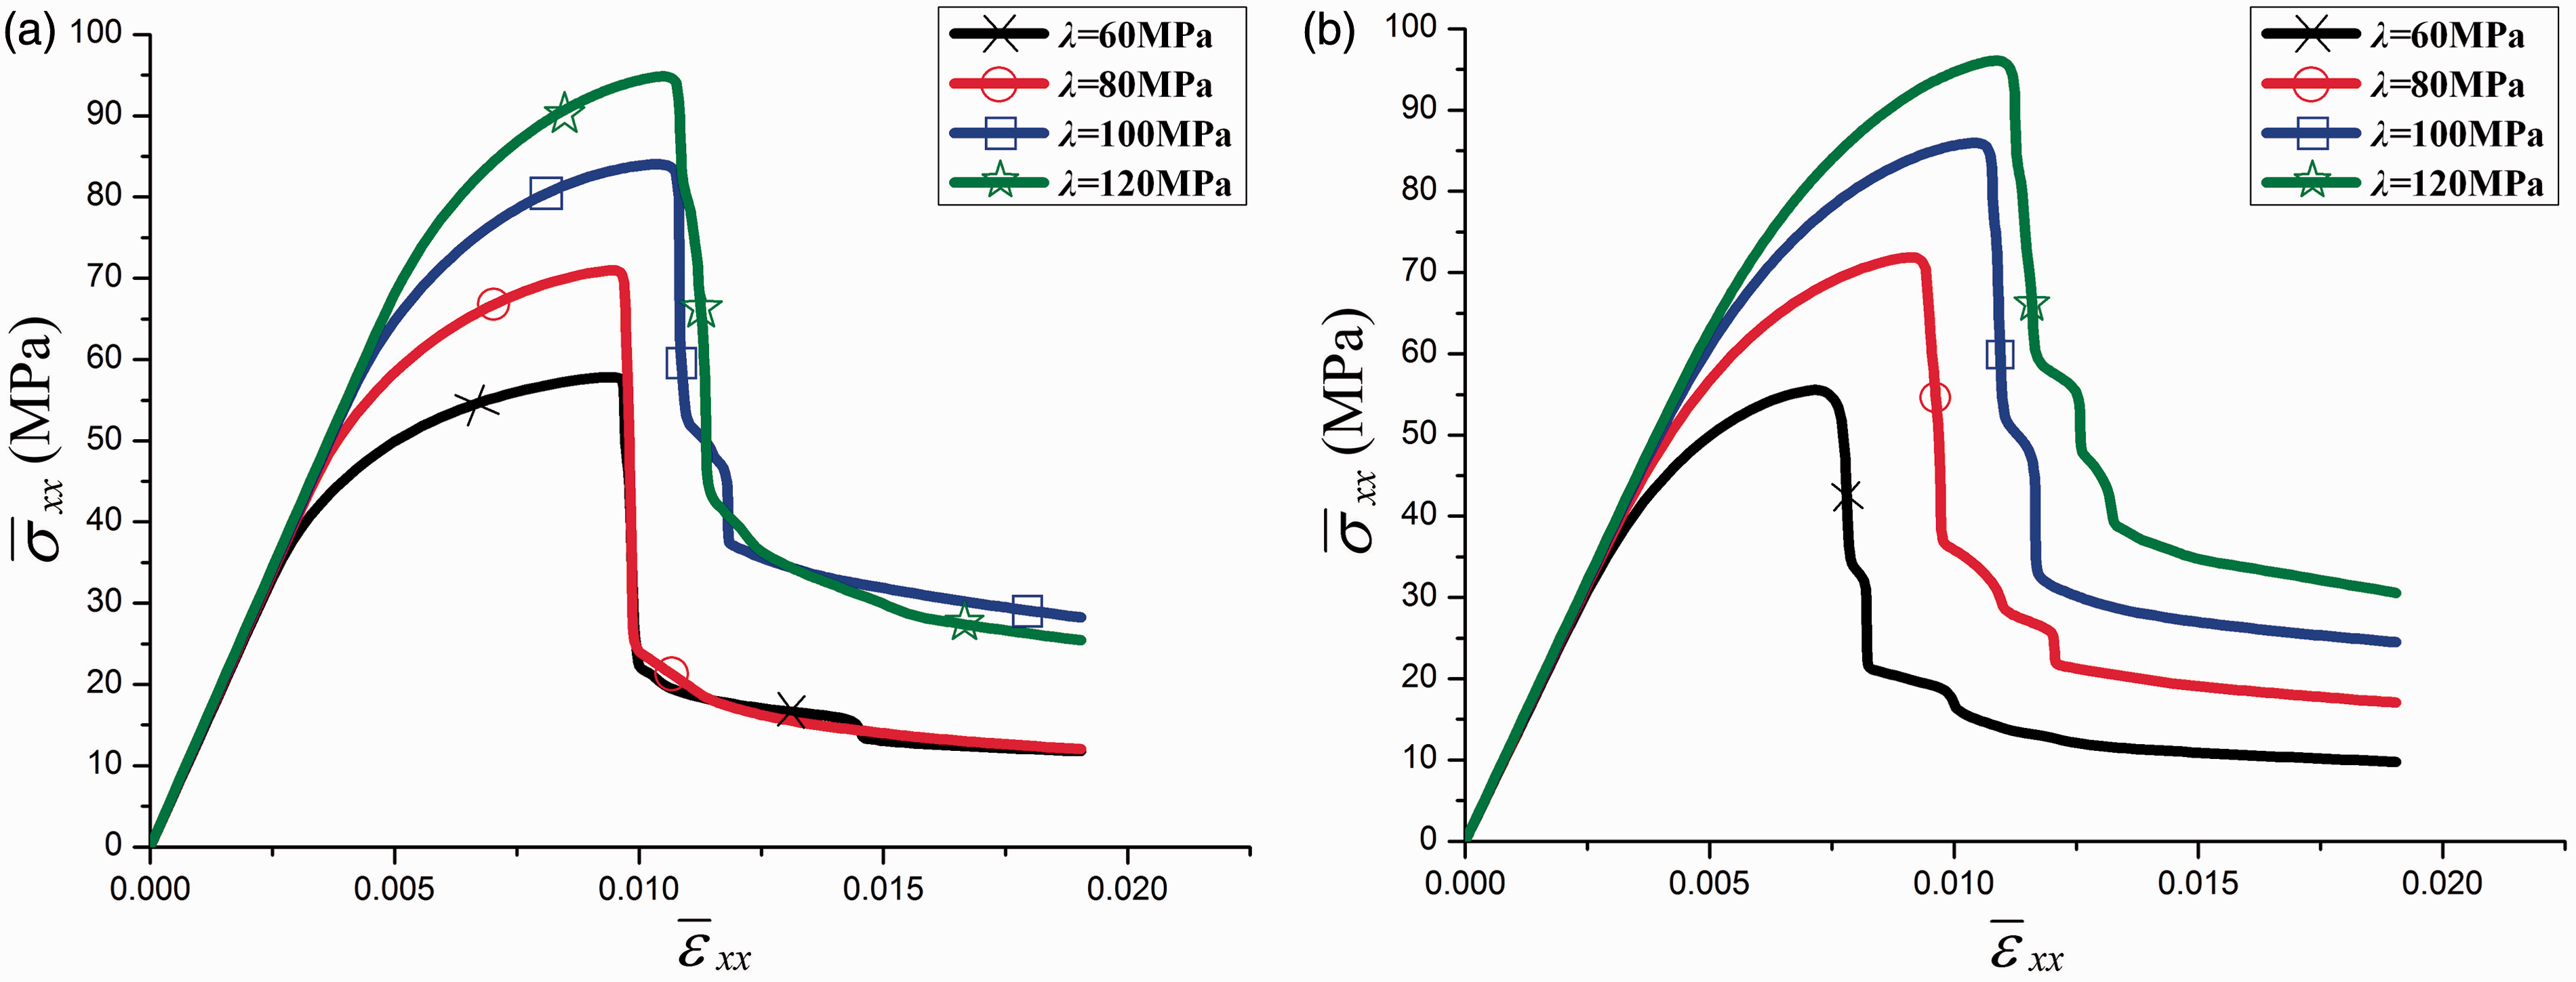
Influence of shape parameter k
k is the shape parameter (or Weibull modulus) in Weibull distribution. In this section, transverse tensile strength of different k will be investigated with scale parameter keeping constant as λ = 100 MPa. The SIS distribution and corresponding fiber number used in FEM models of different k are shown in Figure 19. The locations of each fiber in regular and irregular fiber arrangement models are shown in Figure 12(d) and (g), respectively.
Interface strength distribution and the corresponding fiber number used in each FEM model of different k.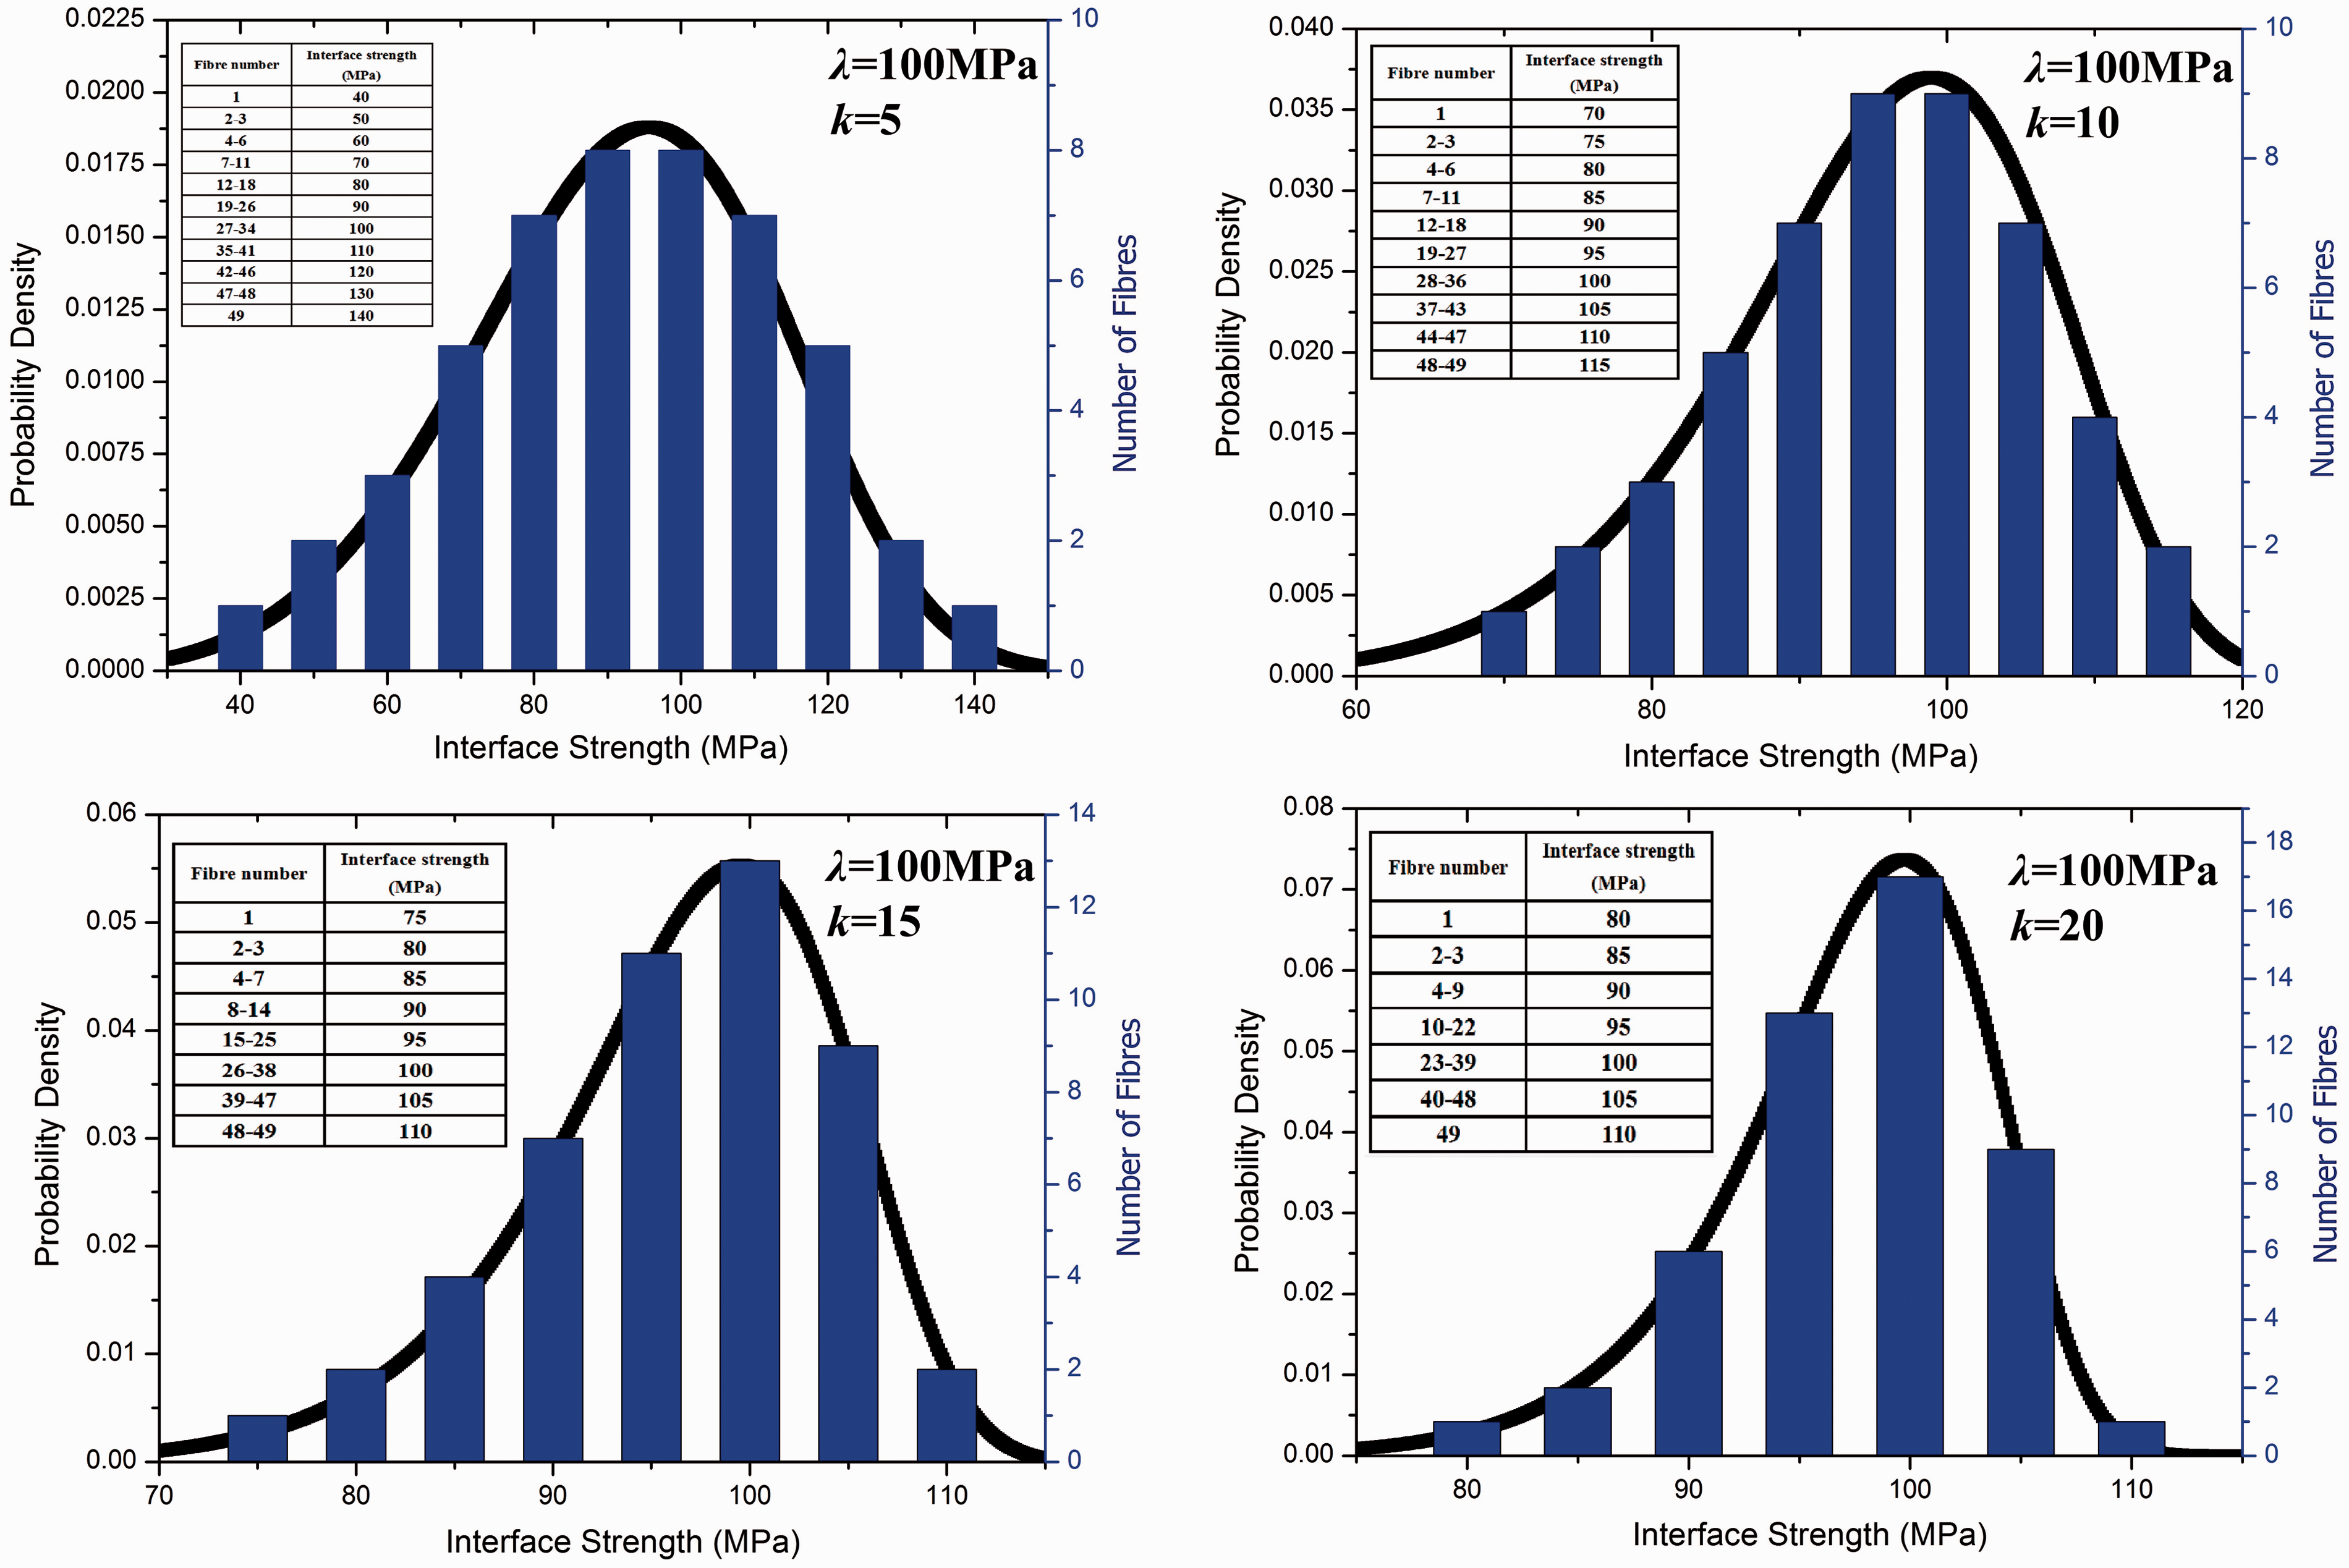
The transverse tensile responses of different k are shown in Figure 20. The transverse tensile strength improves with the increase of k. The main reason for this result is that larger k corresponds to less spread out of the interface strength distribution. Since failure of materials often occurs from the weakest link, the lowest interface strength among all the interfaces increases with the increase of k, leading to the improvement of transverse tensile strength. It should be noted that the transverse tensile strength of model k = 5 is much lower than case of k = 10 (Figure 20), indicating that tensile strength calculated from a scattered interface strength distribution model will lead to a much lower estimation.
Transverse tensile responses for models of different k. (a) Regular fiber arrangement, (b) irregular fiber arrangement.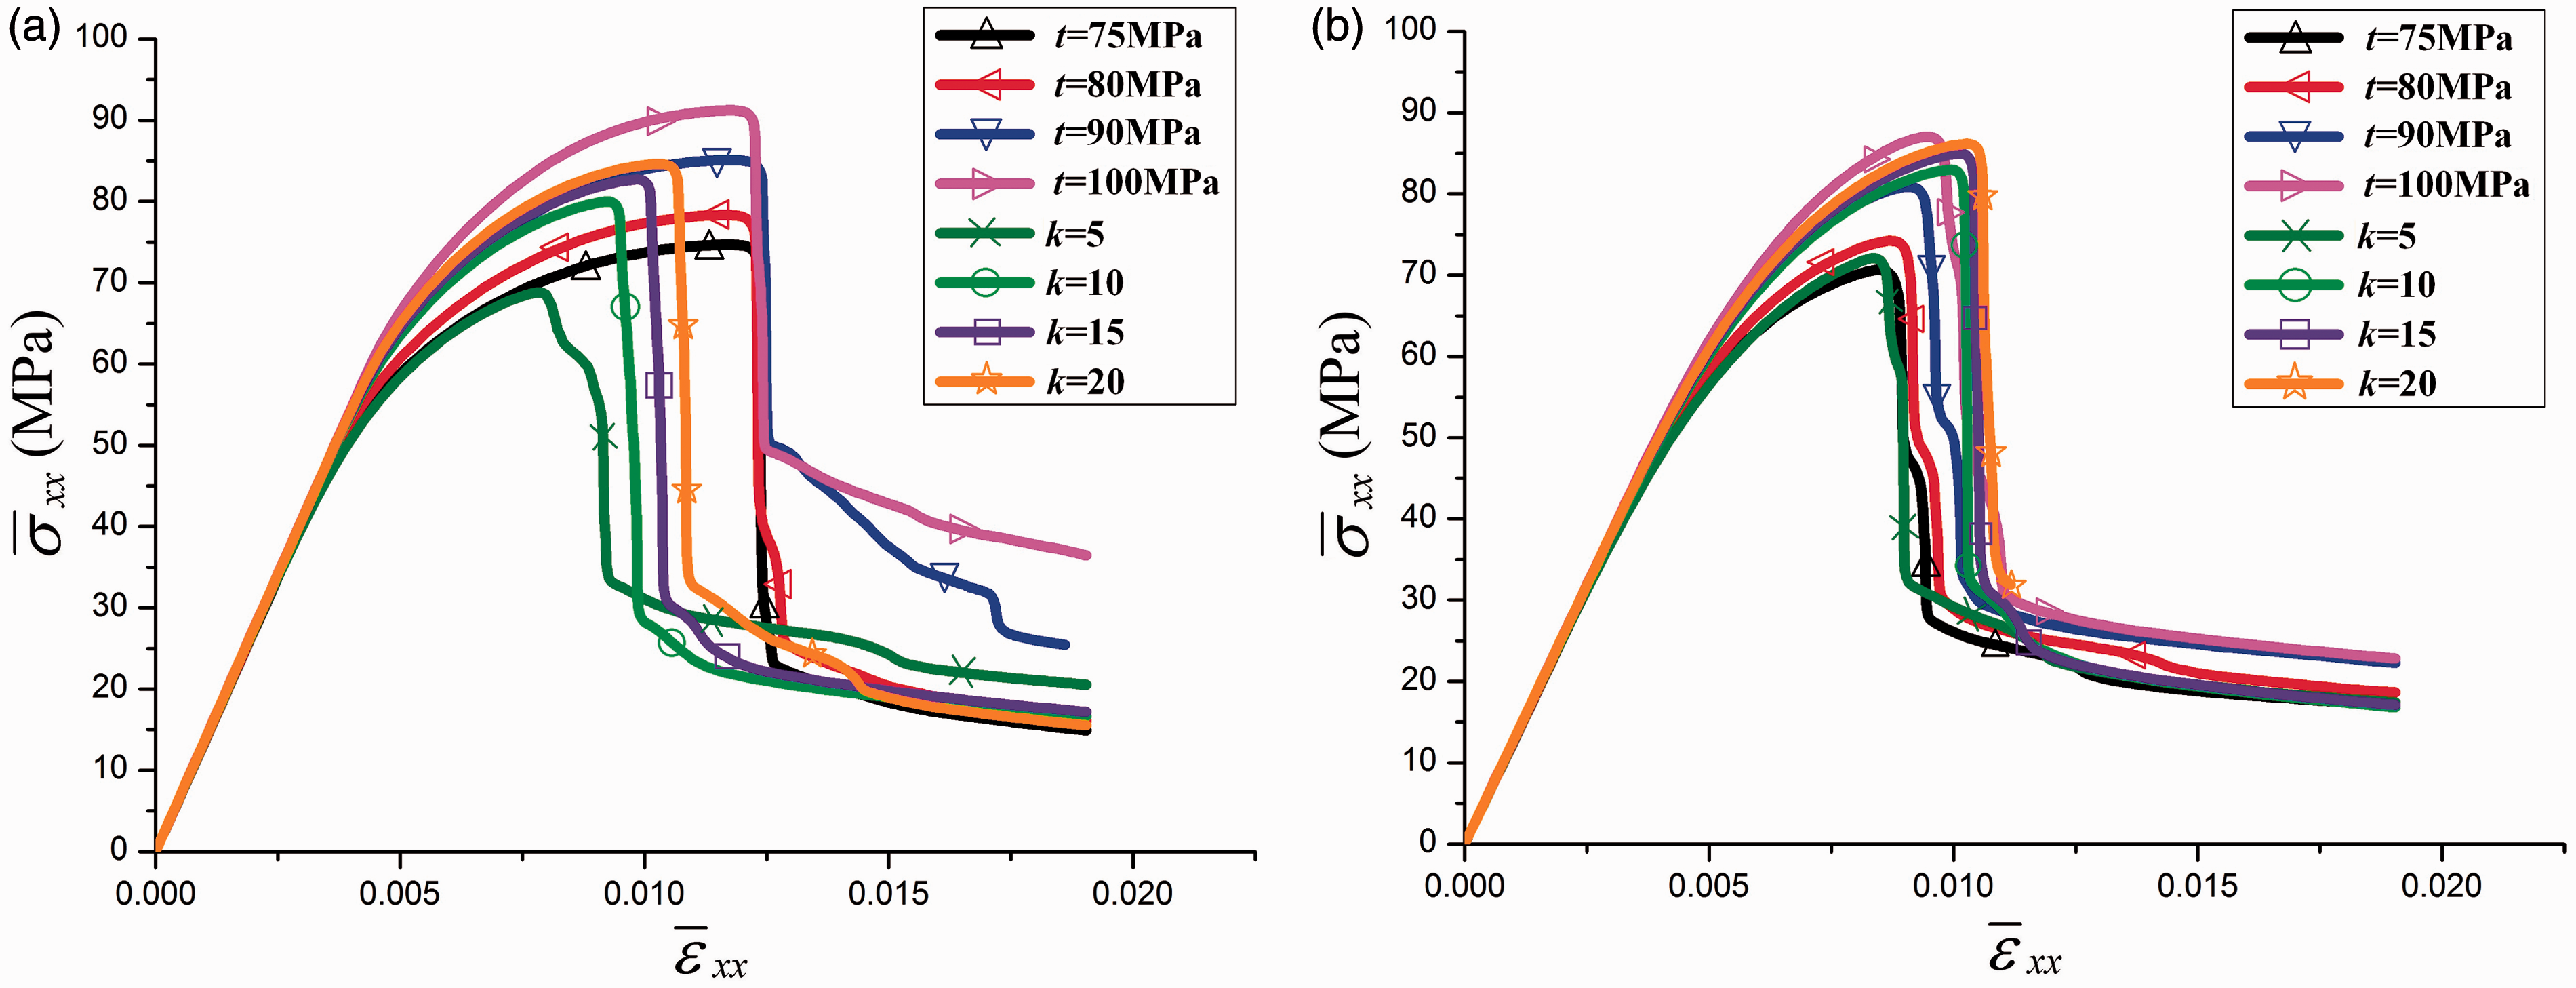
Critical transverse tensile strengths of SIS models with different Weibull parameters.
Conclusions
In the present work, the effect of Weibull distribution-based SIS on the transverse tensile strength and failure process of UD-FRP composites was analyzed and compared in both regular and irregular fiber arrangement models. Influence of the two Weibull parameters on the transverse tensile strength was also investigated. The following conclusions can be reached:
1. The transverse tensile strength and failure strain of SIS models are much lower than that of identical interface strength t = λ, indicating that transverse tensile strength calculated from the identical interface strength model will lead to an overestimation. 2. Variation of location distribution of fibers with SIS can result in different transverse tensile strengths and failure processes. 3. Failure paths of SIS models go along interfaces of lower strength but not always the lowest strength. Considering the irregular fiber arrangement effect, the failure paths of SIS models are tortuous due to the random distributed fiber grids and may result from competition of multicracks. 4. Transverse tensile strength improves with the increase of Weibull scale parameter λ and shape parameter k. A small value of k will lead to a scattered interface strength distribution and much lower transverse tensile strength.
In summary, the SIS of UD-FRP composites can significantly affect the transverse strength and failure process of materials and maybe a reason for dispersion of UD-FRP composites transverse strength. The effect of SIS should be taken into consideration in the transverse modeling, rather than the current approaches of deterministic analysis.
Footnotes
Conflict of interest
None declared.
Funding
This work was supported by National Natural Science Foundation of China (grant number 11372151).