
Abstract
This study explored the use of J-integral approach for characterizing mode I, mode II and mixed-mode I/II interlaminar fracture toughness of composites materials. Delamination tests were conducted to measure the fracture toughness and the resistance curve (R-curve) for double cantilever beam, end-notched flexure and mixed-mode bending specimens. The J-integral approach and the well-established ASTM standard methods based on LEFM were compared in this work. The results obtained from both methods are in very good agreement. However, the J-integral method has the advantages of being applicable to materials with large fracture process zone (e.g., composites with fiber bridging) and provides a simpler experimental procedure with fewer inputs. More importantly, the presented method avoids the ambiguity in visual measurements of delamination length required by the ASTM standard methods. In this study, an image-processing program based on Hough transform was developed to obtain the rotation angles of the specimen. The method provides good accuracy and has lower requirements for image resolution, light and material surface compared to previous methods.
Introduction
Fiber reinforced polymer composites are increasingly used in applications including the aerospace, marine and civil industries over the past several decades. The superior strength and stiffness to weight ratio of composites are highly desirable in structures where weight is critical. However, composite laminates generally have low interlaminar strength and are highly susceptible to delamination initiation and propagation. Therefore, delamination is one of the major concerns in the use of composite structures. The initial delaminations in composite laminates are commonly induced by manufacturing defects or low-velocity impacts in service. The existing delaminations may propagate and severely reduce the in-plane strength, stiffness and durability of the composite laminates.1–5
Consequently, the accurate measurement of interlaminar fracture toughness is of great importance in the design of composite structures, and it is critical to develop a reliable and practical characterization method. Standard test procedures have been well established for obtaining mode I, mode II and mixed-mode I/II interlaminar fracture toughness using the specimen configurations of double cantilever beam (DCB), end-notched flexure (ENF) and mixed-mode bending (MMB), respectively.6–8 The fracture toughness is measured as the critical strain energy release rate (Gc) at the crack tip based on the assumptions of linear elastic fracture mechanics (LEFM). However, the LEFM is not applicable to those specimens containing large fracture process zone around the delamination front (e.g. composites with strong fiber bridging, adhesively boned joints). The fracture toughness measured by the current standard tests is also easily affected by the visual observation of delamination length. The problems involve difficulties in defining crack tip, crack tunneling effect and costly experimental set-up (e.g. travelling microscope). 9 Alternatively, the J-integral-based approaches were proposed for characterizing interlaminar fracture toughness in recent years. The J-integral is a path independent integral proposed by Rice 10 to evaluate the non-linear strain energy release rate. With properly selected integration paths, the fracture toughness of the specimens can be directly related to the load applied and the angular rotations of the beam at the loading points. Therefore, the J-integral methods provide simpler experimental procedure and avoid the ambiguity of visual measurements for delamination length. In addition, they are applicable to a wider selection of materials without the restrictions of small Fracture Process Zone (FPZ) by LEFM. A closed form solution of J-integral for the DCB specimen was derived by Anthony and Paris 11 to evaluate the mode I interlaminar fracture toughness. Following this work, Gunderson et al. 9 performed the DCB tests on GFRP specimens using both the J-integral method and the ASTM standard procedure. A video camera and transducers were used to monitor the delamination length and record the beam angles at the loading points, respectively. Good agreements were found between the obtained GIC and JIC. Bradley et al. 12 and Nilsson 13 derived a more general form of J for the DCB test considering large displacement, mid-plane stretching and additional bending moment generated by the loading point offset from the mid-plane. The use of J-integral method for the mode II end-load-split and ENF tests were also investigated analytically and experimentally.12,14–16 Stigh et al. 15 designed an integration path for the ENF specimen, and the mode II interlaminar fracture toughness was calculated by the forces and the rotation angles at the loading points. In Stigh’s study, an image-processing system was developed to record the rotation angles every 5 s, which were indicated by painted ribs glued to the specimen. Recently, with a similar procedure, the J-integral approach was applied on the MMB configuration by Sarrado et al. 17 Good agreements were found between the results of ASTM standard and the J-integral method, and the latter showed a significant lower level of uncertainty. They also compared the use of the LEFM-based method and the J-integral method for analyzing adhesive joints under mode I and mode II loadings. The results showed that the LEFM-based method was not suitable for the analysis of adhesive joints fracture, as it depends heavily on the size of the FPZ. 18
This study systematically explored the use of J-integral approach for characterizing mode I, mode II and mixed-mode I/II interlaminar fracture toughness of composites materials. The test configurations were DCB for mode I, ENF for mode II and MMB for mixed-mode I/II, which were the same as those used in the ASTM standards for comparison. With the advantages of wider selection of materials, less requirements on material properties and easier data acquisition, the experimental procedure presented in this work is very attractive and can be used as an alternative testing method for the measurement of interlaminar fracture toughness.
Theory
The J-integral developed by Rice
10
is given as
Definition of (a) the integration path and the loadings and rotation angles for (b) DCB specimen (c) ENF specimen and (d) MMB specimen.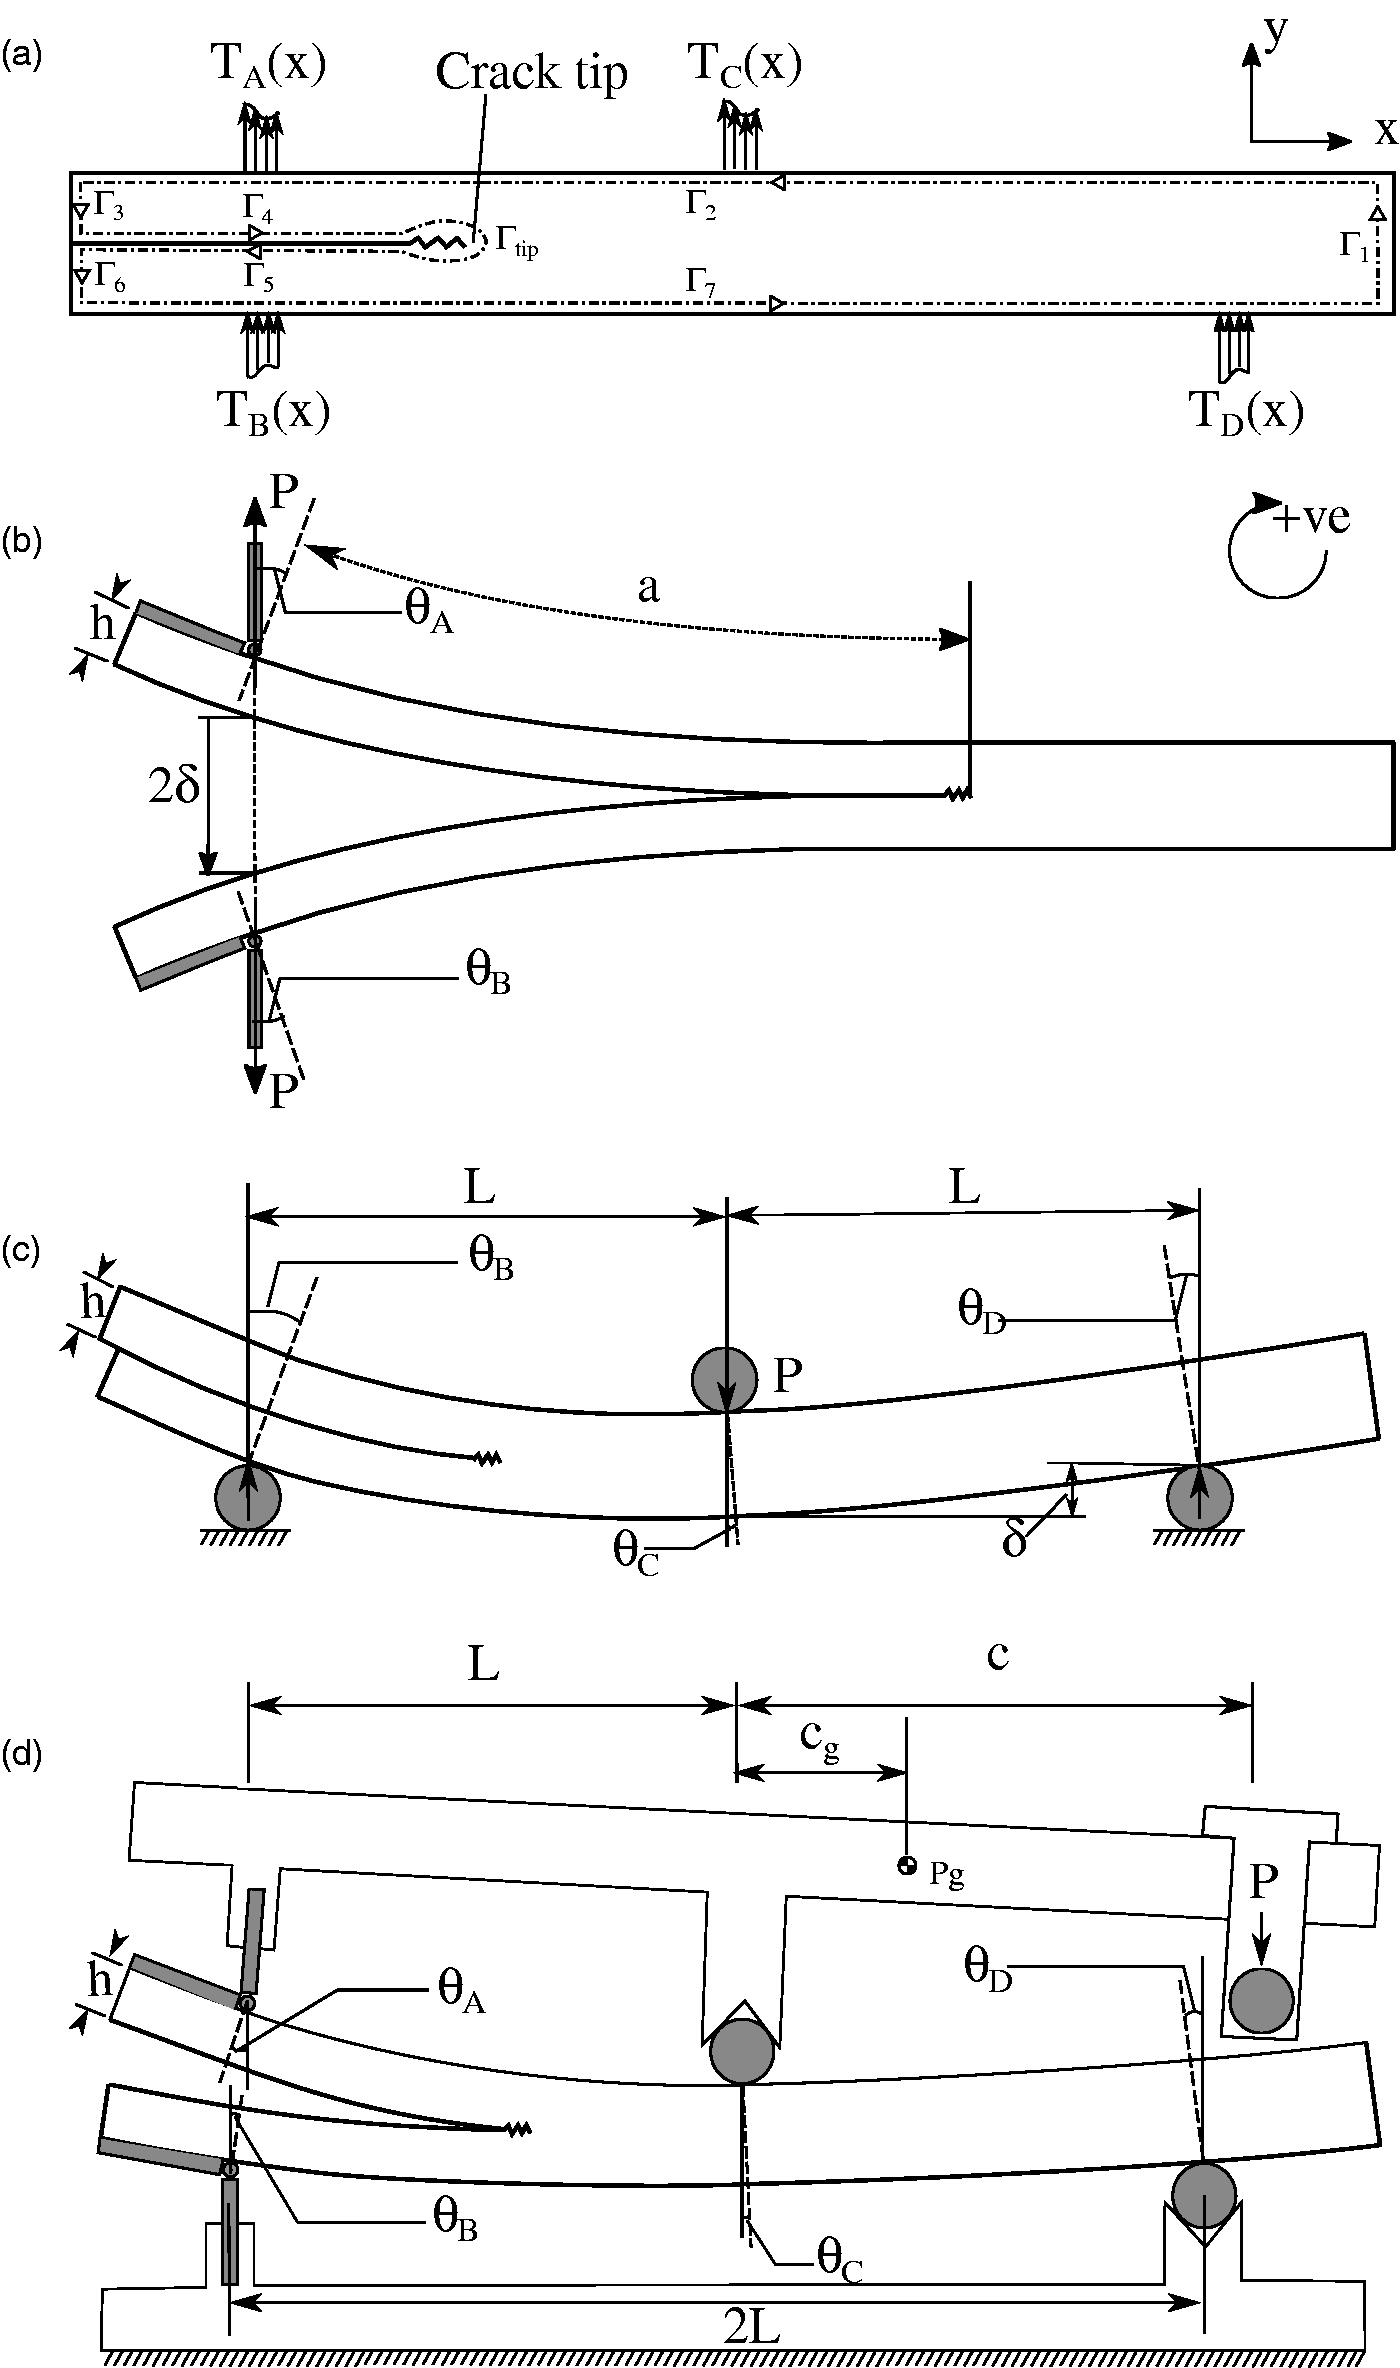


According to this general expression, the J-integrals are evaluated separately for the closed form solutions of DCB, ENF and MMB tests. For the DCB test shown in Figure 1(b), the

For the ENF test shown in Figure 1(c), the forces on the specimen can be expressed by the loading P on crosshead based on the static equilibrium of the experimental setup, and the

Similarly, the
As a result, the evaluation of interlaminar fracture toughness for mode I, mode II and mix-mode I/II only requires 2, 3 and 4 rotation angles values synchronized with the applied load, respectively. In this approach, inputs required by ASTM standards such as material elastic properties, specimen compliance and delamination length are not needed.
Specimens
The composite laminate used in this study was manufactured by the woven glass fiber-reinforced bismaleimide prepreg, Hexply F655. The fiberglass, HexForce 1581, is a weave type of 8-harness satin with a fabric weight of 298 g/m2. The laminate consisted 16 layers of prepregs, and a thin polymer release film was placed in the mid-plane (between layers 8/9) as the initial delamination. The laminate was cured in an autoclave according to the manufacturer’s recommended curing cycle followed by a 6-h post-cure process at 243℃. The fabricated laminate had an average thickness of 4 mm and an insert length of 65 mm. The laminate was cut into rectangular specimens by a diamond wafer cutter. The specimen has a dimension of 200 mm in length and 20 mm in width. The delamination tips on both sides of the specimen were marked using an optical microscope as shown in Figure 2. All the specimens were desiccated in a vacuum oven at 80℃ for two days and stored in a dry cabinet before testing.
Illustration of the insert and pre-crack on the side view of a specimen.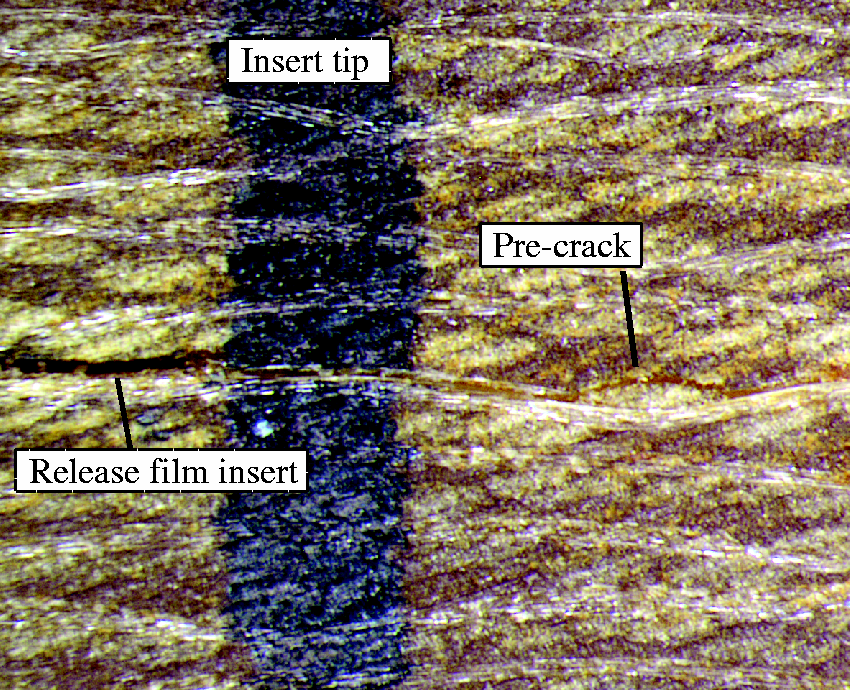
Experimental procedures
The interlaminar fracture toughness of mode I, mode II and mixed-mode I/II were measured using the standard methods and the J-integral approach, simultaneously. The mode I and mixed-mode tests were conducted on a Shimadzu universal testing machine, while the mode II tests were conducted on an Instron universal testing machine. Both machines had a load cell capacity of 10 kN. The experimental setups are summarized in Table 1. Both sides of the specimen were painted with thin layers of correction fluid from the delamination front as required by the ASTM standards to aid in visual detection of the delamination. A small paper ruler with an accuracy of 1 mm was pasted on the specimen below the mid-plane to indicate the delamination length. Rotation marks, made by thin aluminum plates, were attached on the specimen to indicate the rotation angles of the beams at loading points. A camera with 15 fps was set up to record the delamination length and the rotations of the marks during the test as shown in Figure 3(a). Pictures taken from the camera were able to capture the delamination front on the specimen with an accuracy of at least ±0.5 mm.
(a) Experimental setup and processed images taken from (b) DCB test (c) ENF test and (d) MMB test (red lines indicate the marks detected by the program). Test setup parameters. DCB: double cantilever beam; ENF: end-notched flexure; MMB: mixed-mode bending.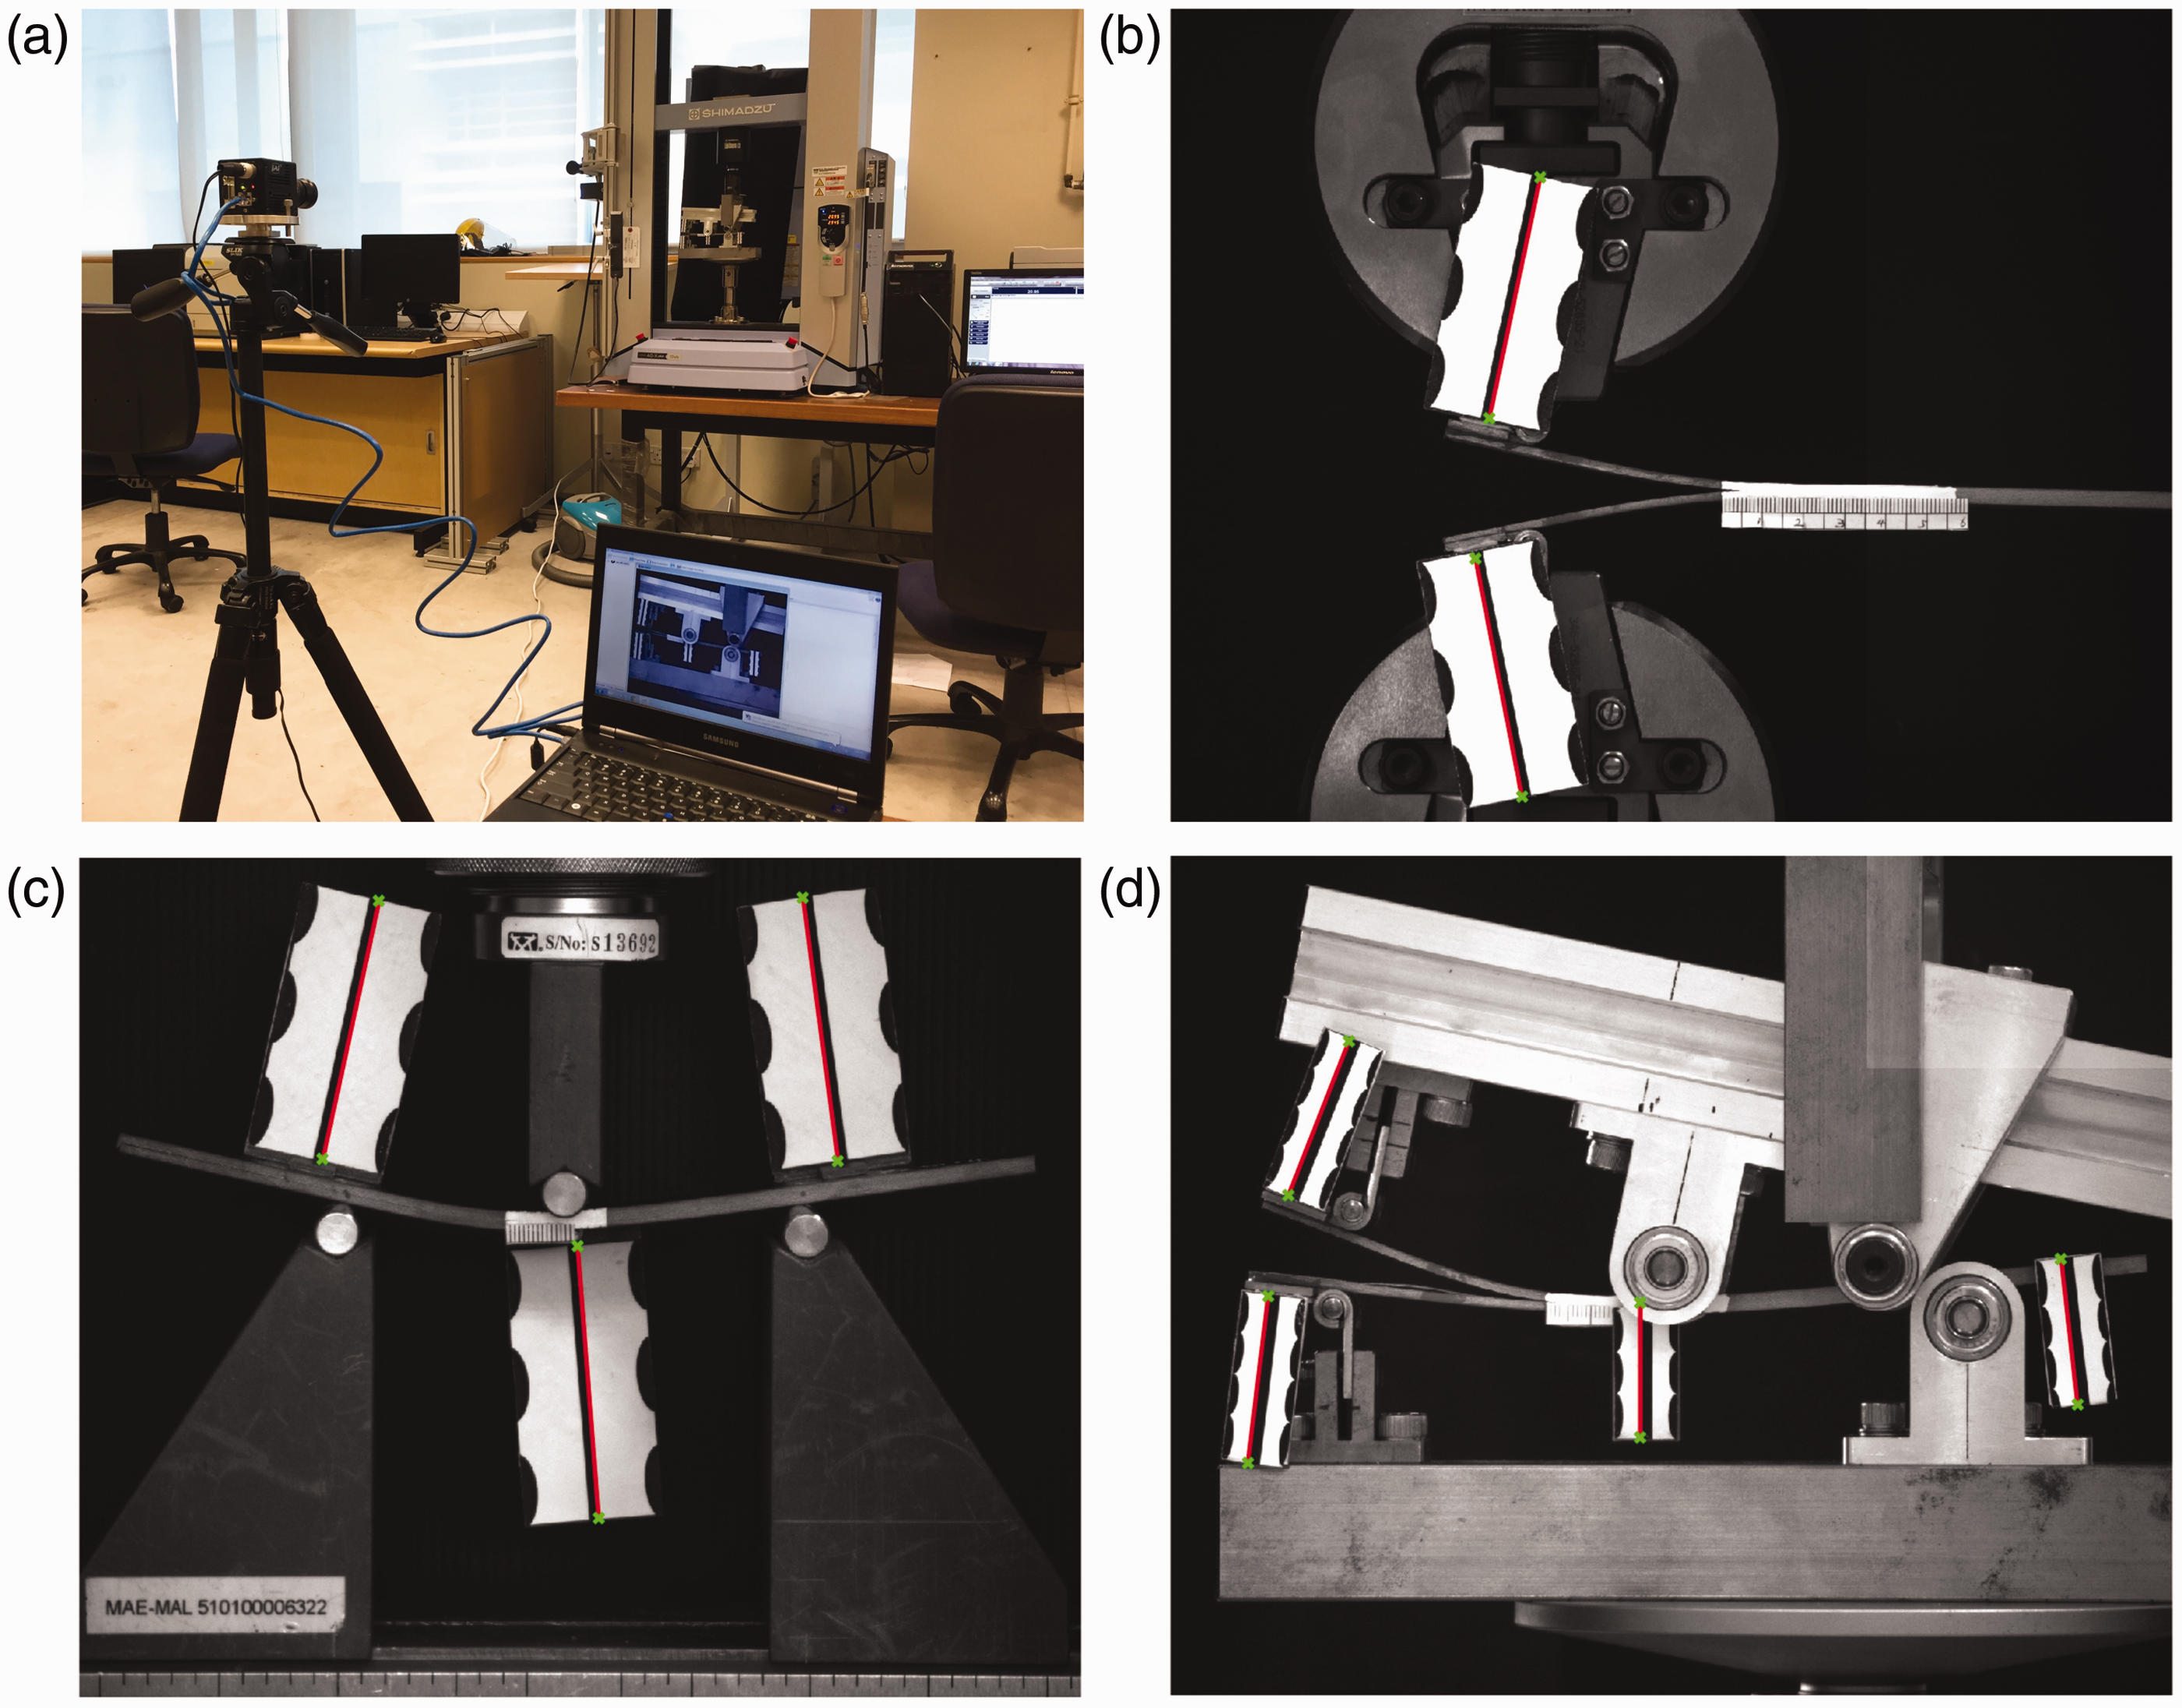
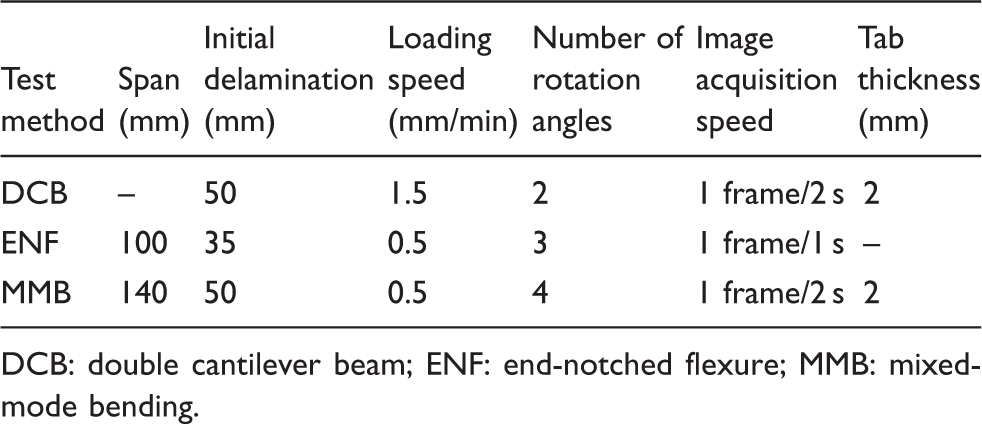
Image-processing algorithm
The image-processing method described in Walander
14
used different colors to distinguish the rotation of ribs glued to the specimen from the white background, which can be easily affected by aliasing and distortion of the image. Moreover, the method took only two mid-points from the ribs to calculate the rotation of the ribs. It also results in relatively long ribs to ensure the accuracy of the measurement. A simpler and more reliable image-processing program was developed using MATLAB in this study. Light rectangular marks printed with the pattern shown in Figure 3(b) to (d) were designed to indicate the rotation of the specimen. The program first captures all the boundaries of a greyscale image taken by the camera through detecting the discontinuities of brightness. All the straight lines of the edges are then extracted using Hough transform. Hough transform is a commonly used technique to find straight lines in a digital image by carrying out a voting procedure in the parameter space. Each point Validation test results of the image-processing program.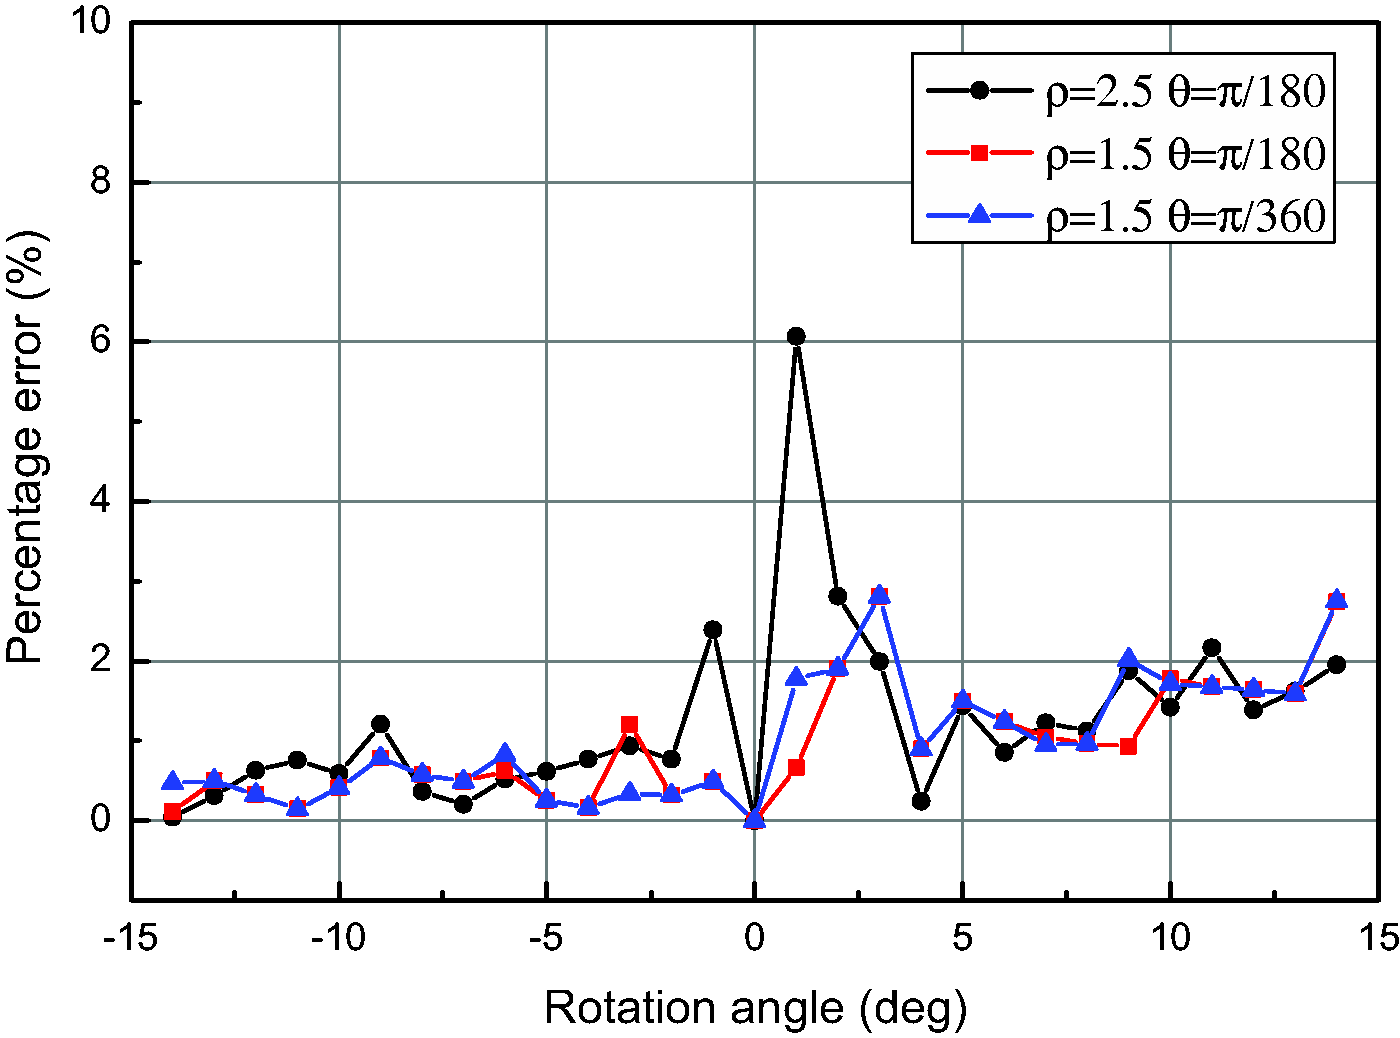
Mode I DCB test
The mode I energy release rate for DCB (GI) was measured using modified beam theory recommended by the ASTM standard 5528-13
7


Mode II ENF test
The ENF tests were conducted in accordance to the ASTM D7905/D7905M-14 to measure the mode II energy release rate (GII), and the JENF was calculated using equation (7). The compliance calibration (CC) method was performed to obtain the GIIC. A specimen was loaded at three different positions with delamination lengths of 40 mm, 20 mm and 30 mm, respectively. In the first two tests, the specimen was loaded up to 50% of its failure load while, in the third test, the specimen was loaded until failure to create a pre-crack (see Figure 2). The beam compliance (C) is linearly related with a3


The same procedure was performed on the specimen with 35 mm delamination including the pre-crack, and the GII is given as

Mixed-mode MMB test
The interlaminar fracture toughness (GT) at different mixed ratios was measured by MMB tests described by ASTM standard D6671/D6671M-13
8
and J-integral approach using equation (9). According to the standard, the GI, GII and GT can be calculated as


The artificial delamination length of the specimen was 45 mm and was extended using DCB test procedure for 5 mm prior to the MMB test to achieve a total length of approximately 50 mm including the pre-crack (see Figure 2).
Results and discussion
Summary of fracture toughness tests result.
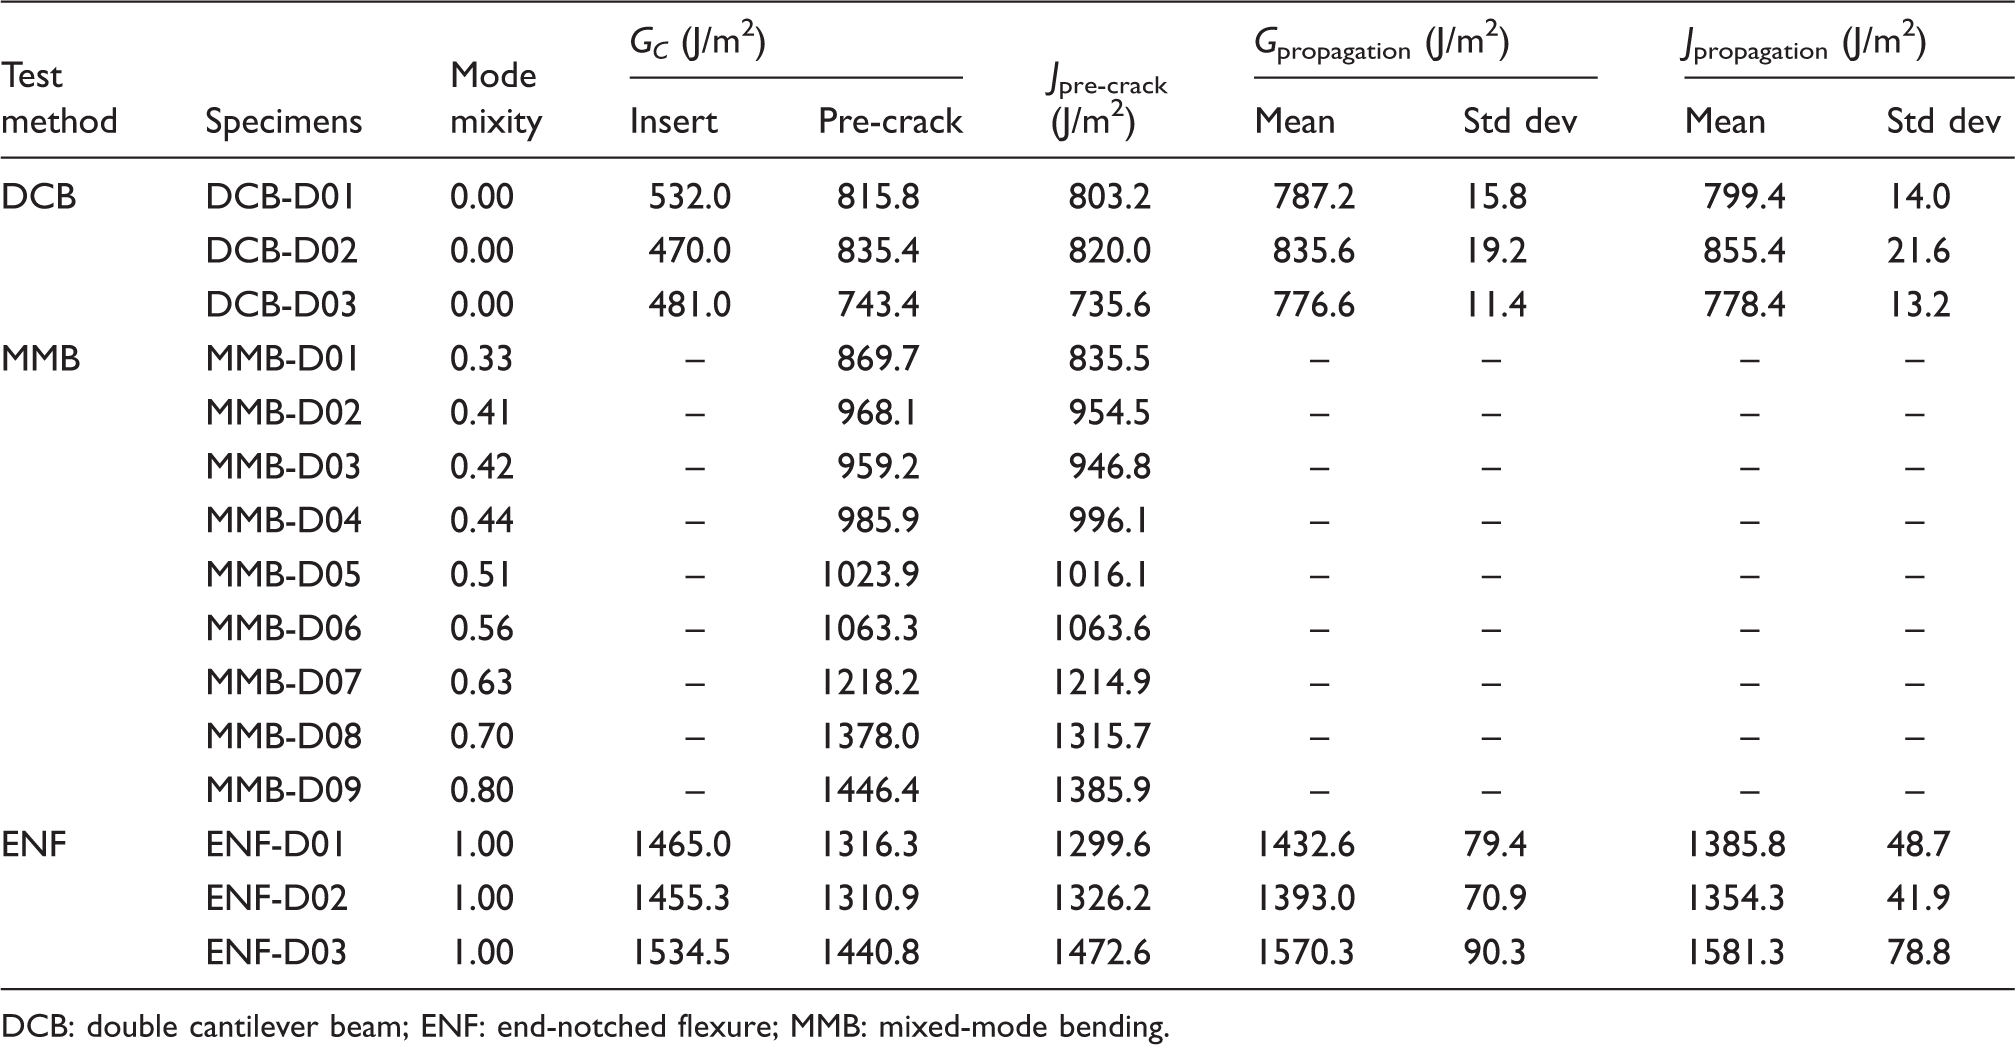
DCB: double cantilever beam; ENF: end-notched flexure; MMB: mixed-mode bending.
Mode I interlaminar fracture toughness
Figure 5(a) shows a typical applied load vs. load–point displacement curve of a specimen from the DCB tests. The analytical solution of the DCB test based on LEFM is given by Jacques et al.
19
(a) Load–displacement curves (b) rotation angles vs. crosshead displacement at loading point (c) Mode I interlaminar fracture toughness results and (d) observed and calculated delamination length.

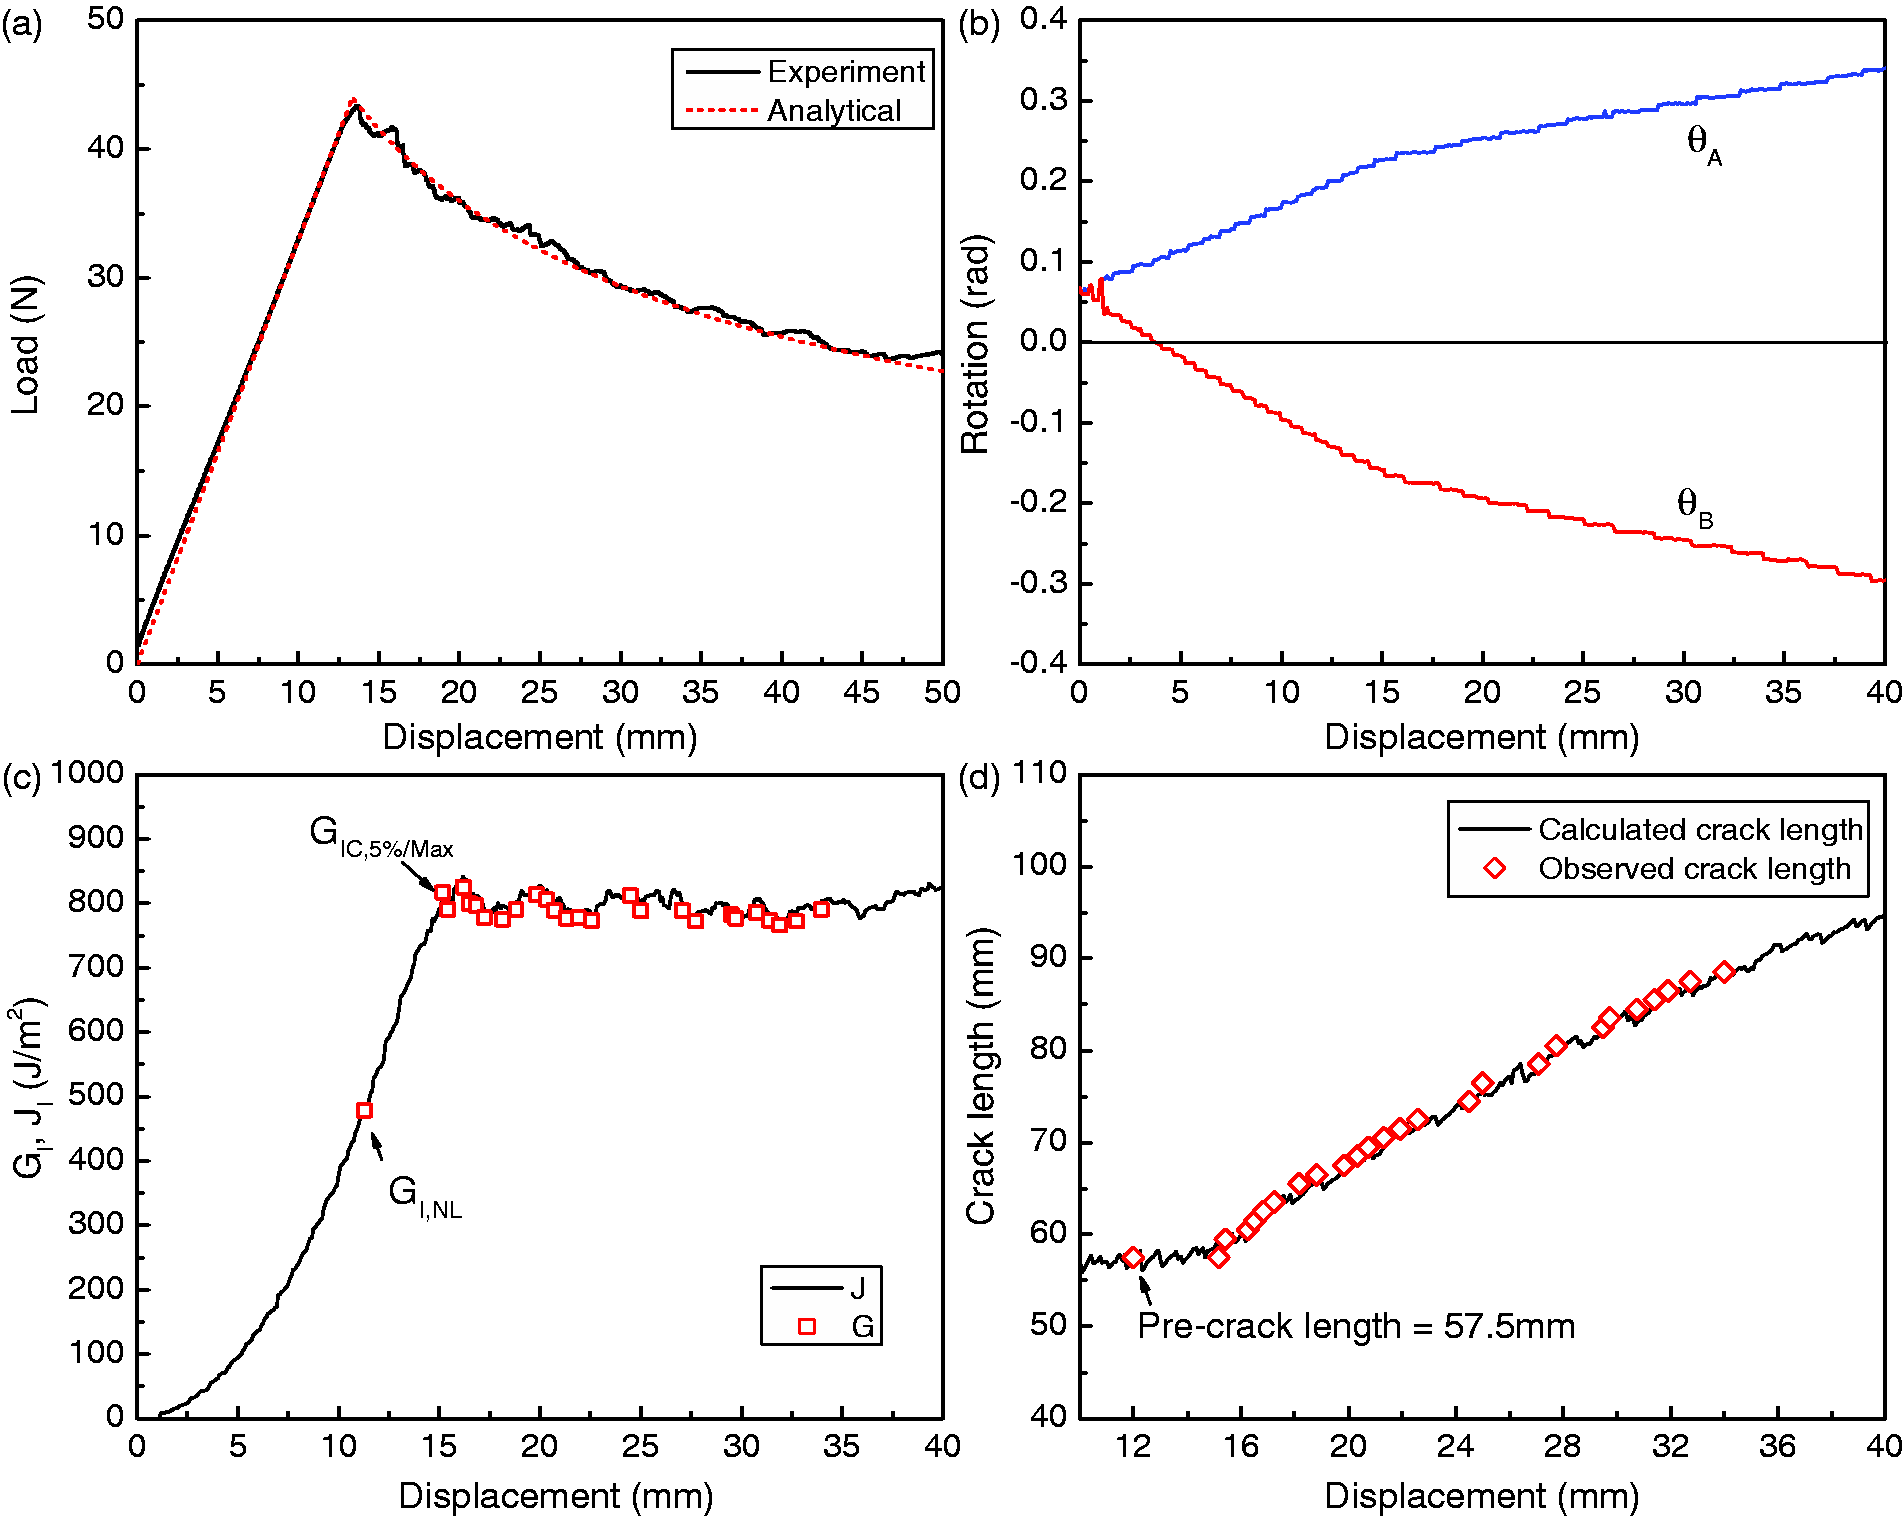
In Figure 5(d), the calculated delamination length is compared with that from visual observation, and the results are in excellent agreement. It is worth noting that the visually obtained delamination was corrected with
Mode II interlaminar fracture toughness
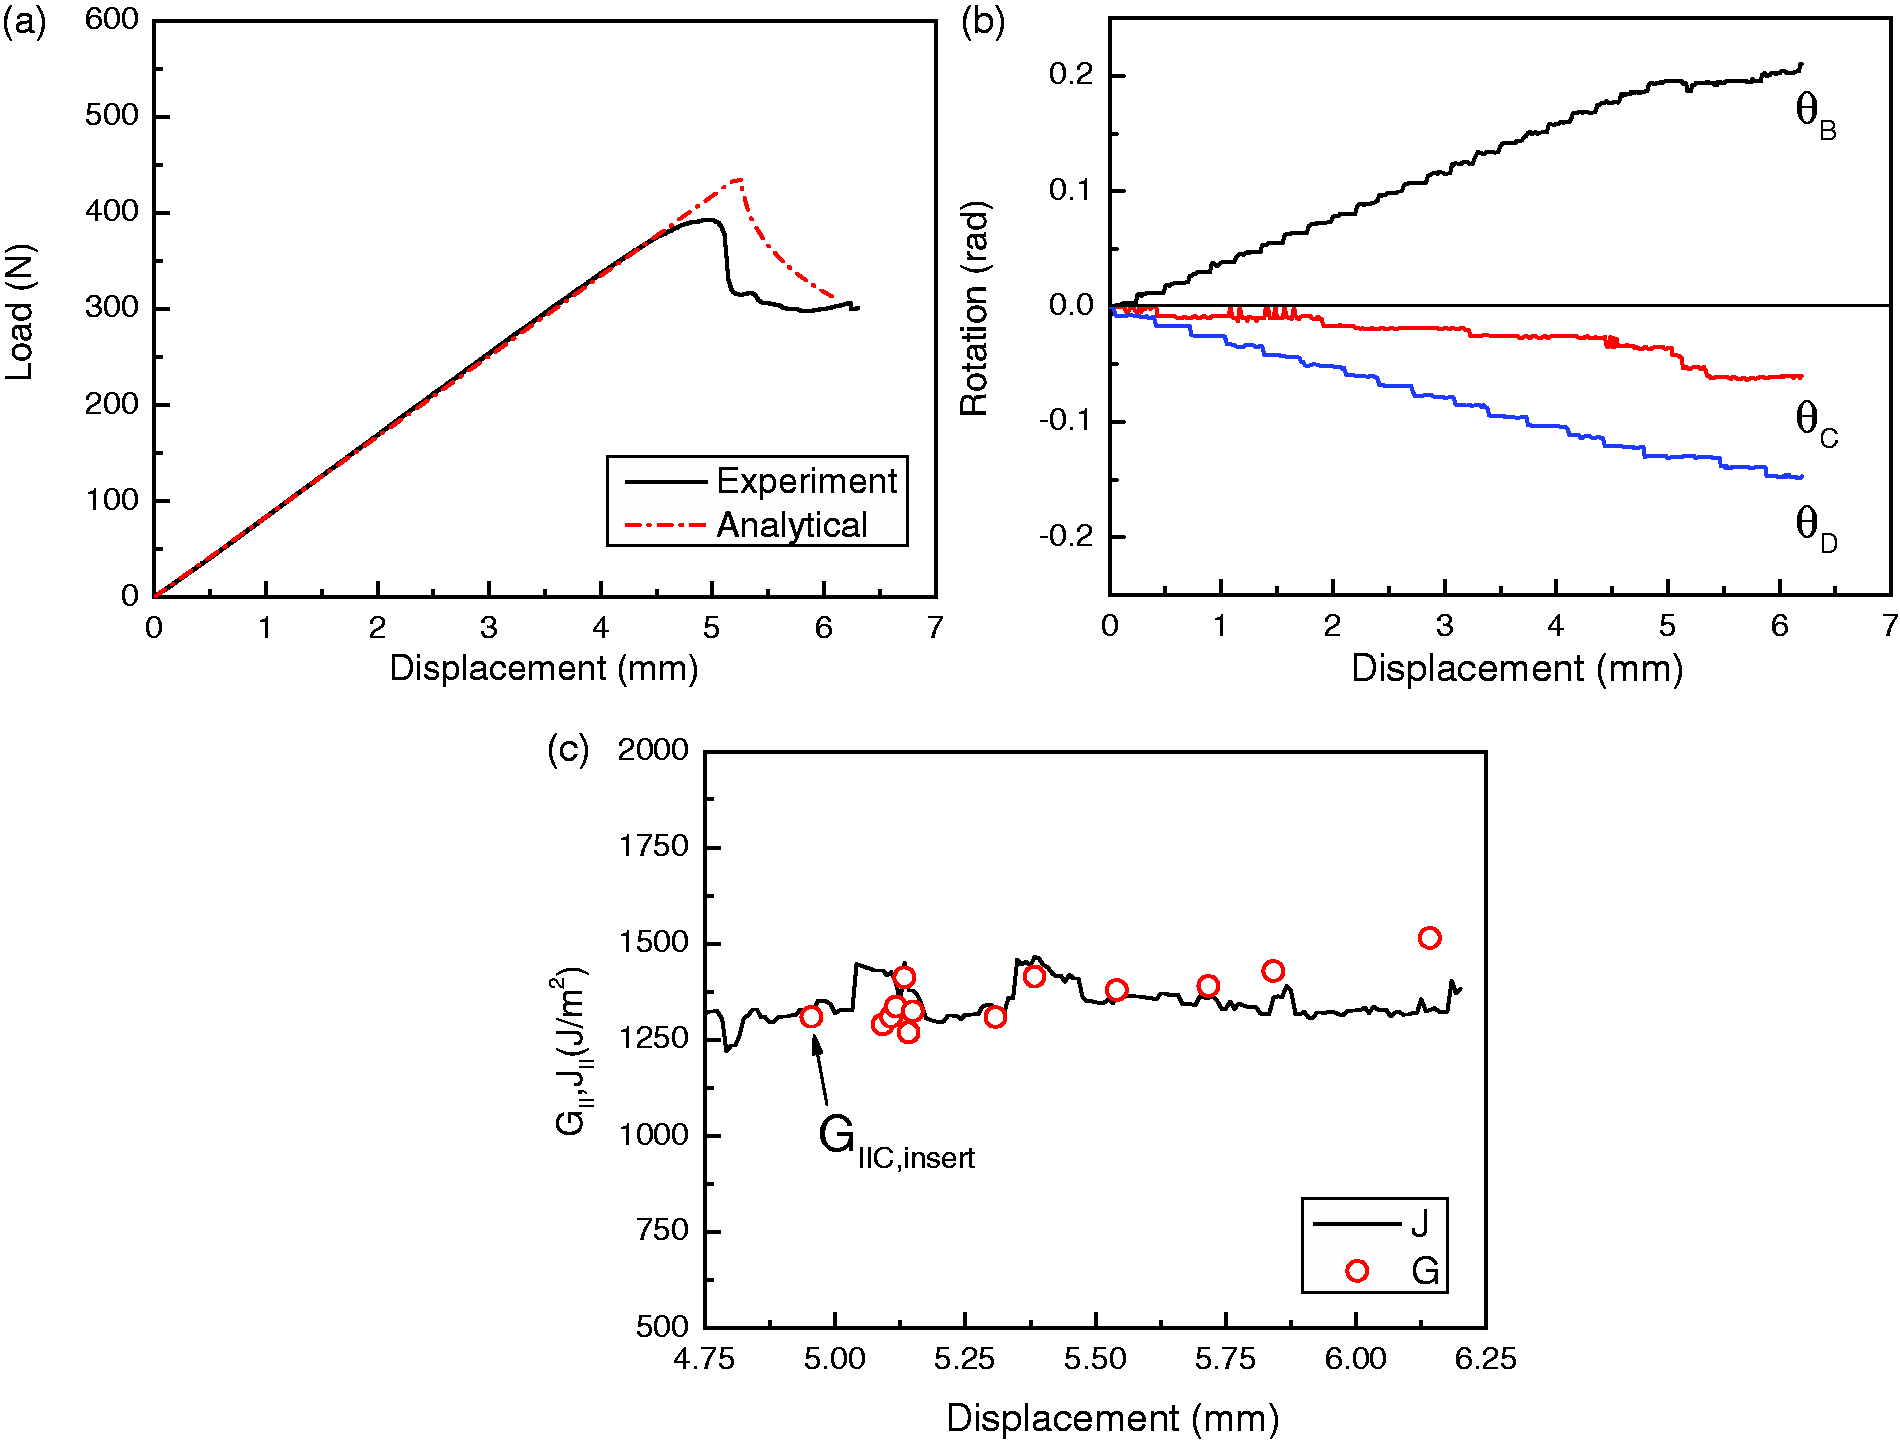
The load–displacement curve of an ENF test is given in Figure 6(a). The analytical solution of ENF is also presented in the figure for comparison, and it is given as
(a) Load–displacement curves (b) rotation angles vs. crosshead displacement at loading points and (c) Mode II interlaminar fracture toughness results.

Mixed-mode I/II interlaminar fracture toughness
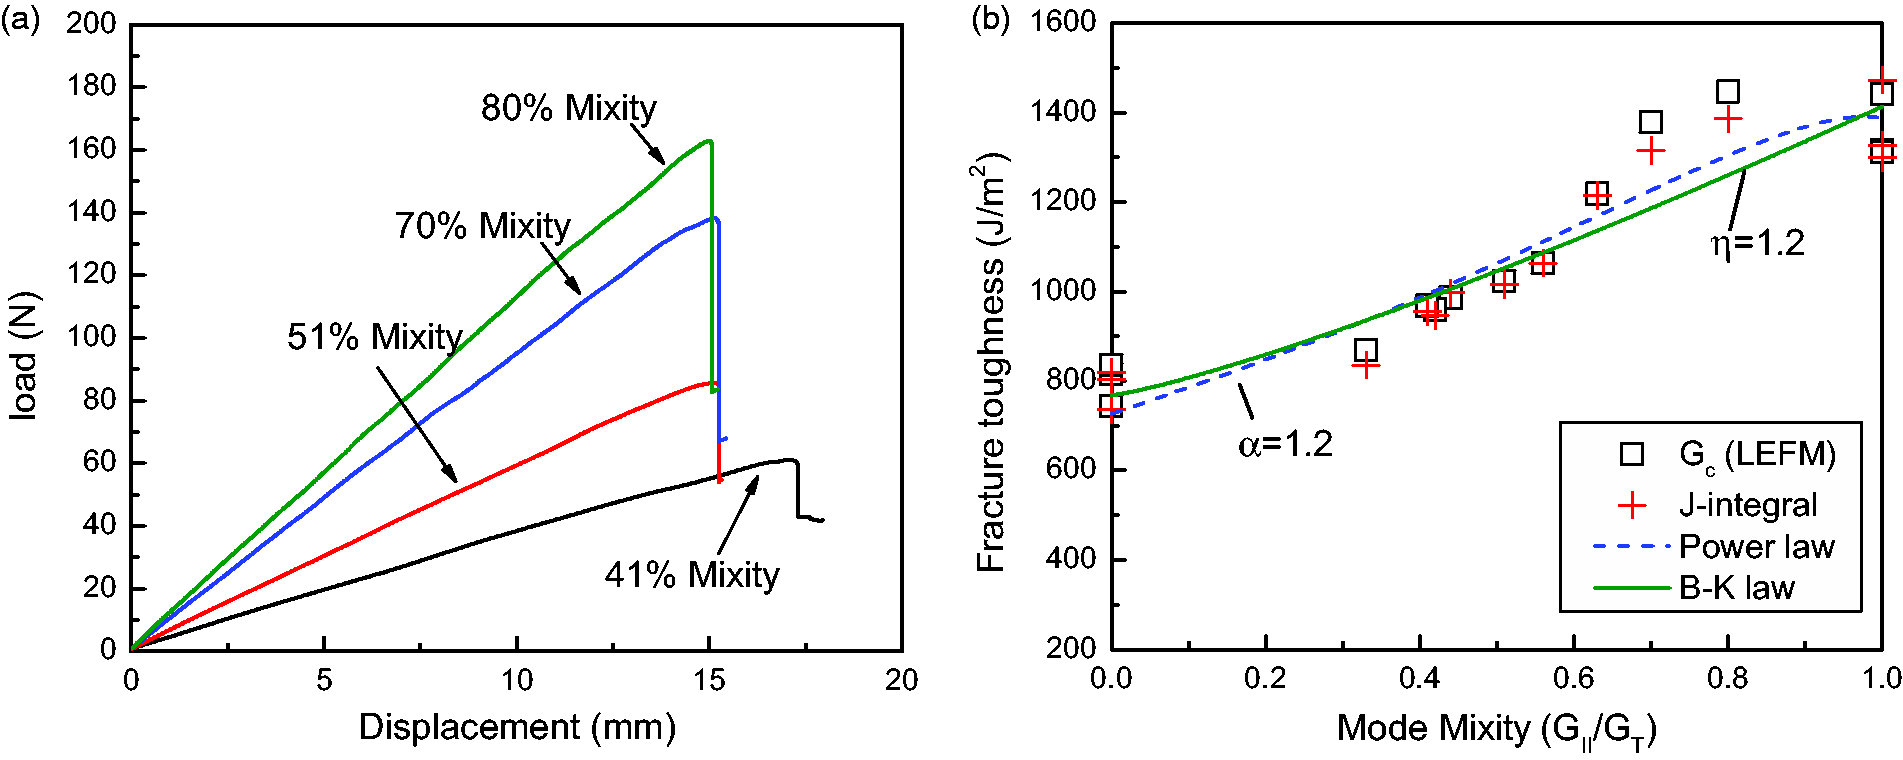
MMB tests with mode mixity ranging from 0.33 to 0.8 (see Table 2) were conducted to measure the interlaminar fracture toughness of the specimens. Typical applied load vs. crosshead displacement curves at four mode mixities are presented in Figure 7(a). Stable delamination growth was not achieved even at the 0.33 mode mixity and a slow crosshead speed of 0.5 mm/min. All the specimens experienced a sudden failure as the loading curves dropped abruptly after the peak values. The total energy release rate (GT) was calculated by equations (15), (16) and (17), and the ratio mixity given by equation (18). The JMMB was evaluated using equation (9). The values of mixed-mode interlaminar fracture toughness obtained from both methods are presented in Figure 7(b), and good agreement was found in all mode mixities. A power law criterion
20
is often used to predict the mixed-mode fracture toughness in terms of the interaction of its mode I and mode II energy release rate
(a) Load–displacement curves at various mode mixities and (b) total interlaminar fracture toughness vs. mode mixities.

Conclusions
This study explored the use of J-integral approach for characterizing interlaminar fracture toughness of composites materials under mode I, mode II and mixed-mode I/II loadings. The delaminations tests were conducted for evaluating interlaminar fracture toughness of DCB, ENF and MMB specimens. Fracture tests were conducted on DCB, ENF and MMB specimens to measure the interlaminar fracture toughness for initiation and propagation. The test results were obtained using the well-established ASTM methods and the J-integral method simultaneously for comparison, and the following conclusions can be drawn:
In the J-integral method, the fracture toughness of a specimen can be directly related to the applied load and the angular rotations of the beam at the loading points. Therefore, the experimental method allows the fracture toughness under mode I, mode II and mixed-mode I/II loading to be measured using a common and simple experimental procedure. The results obtained from the J-integral method showed very good agreement with those from standard method due to the small FPZ of the specimen used in this study. However, the ENF results of the J-integral method exhibited significant lower variances compared to the method described in the standard procedure. The main reason is that the visual determination of delamination length was avoided in J-integral method for the relatively unstable propagation. Without the restrictions of LEFM assumption, the J-integral method is applicable to more materials, especially for those with large FPZ and significant fiber bridging phenomenon. No elastic properties, system compliance and delamination length need to be measured, which reduces the sources of uncertainty. An image-processing program based on Hough transform is developed in this study to calculate the rotation angles, which allows the resistance curve to be measured in real time. The method has good accuracy and lower requirements for image resolution, light and material surface compared to the previous method.
Footnotes
Acknowledgments
The authors would like to thank Dr. Liu Wei, Software Engineer, from Microsoft for providing help in the image-processing program. The authors also acknowledge the support of the school of Mechanical and Aerospace engineering, Nanyang Technological University.
Declaration of Conflicting Interests
The author(s) declared no potential conflicts of interest with respect to the research, authorship and/or publication of this article.
Funding
The author(s) received no financial support for the research, authorship and/or publication of this article.