
Abstract
Nesting and compression processes of plain woven fabrics are the most important features in the composites manufacture of fiber-reinforced composite components, while their relationships are still not reported. Here, in this work, we clearly reveal nesting and compression characteristics of typical fabrics through systematical compression experiments. We present the theoretical expression of the nesting effects on the initial thickness h and experimentally demonstrate its effectiveness. We find that nesting decreases the h and the minimum h appears in the maximum nesting condition. Meanwhile, we experimentally demonstrate that for plain woven fabrics, nesting has relationships with the thickness in compression t, while it has no effects on the thickness deformation Δ in the whole compression processes. Thus, we reveal the relationships between the nesting and h, t, Δ in the compression processes. Moreover, the applicability of these results for other types of fiber is also illustrated by comprehensive analysis. These obtained results provide the references for thickness evolution rules, volume fraction, and molding process of the fiber-reinforced composite components.
Introduction
Fiber reinforcements polymer (FRP) composites, such as carbon fiber and E-glass fiber, have been used in the manufacture of composites parts for the difference applications in automotive body, marine, aerospace, and so on. Notably, the application of composite to the automotive body is a widely acknowledge approach to realize lightweight design.1,2On the other hand, resin transfer molding is the most common molding process for FRP composite components.3,4 It is widely known that increasing the fiber volume fraction can significantly improve the mechanical properties of the composites parts. Thus, in order to obtain a higher fiber volume fraction, the fabrics should be well compressed in the thickness direction in the composites manufacture. Meanwhile, the compression of the fabrics changes the internal structures of the fibers and the yarns configurations which have significant effects on the FRP composite permeability and molding processes.5,6 Therefore, it is quite important to explore the compressibility of the fabrics, which has a significant influence on the forming of the corresponding FRP components.
On one hand, the prediction of nesting and compression processes for the fabrics was studied through various theoretical analysis, experiments, and numerical simulation. For the theoretical analysis and experiments, the detailed micro-structural changes that take place under compression was presented.7–9 Some micromechanical models were established to investigate the structure of plain woven fabrics and the effects of structural elements at different levels.10,11 Nesting effects become more remarkable with the decrease in the fabric tightness and its effects on the compression of woven fabrics and the permeability of their laminates were also studied.12–14 On the other hand, numerical simulation provides enlightening insights into the compression of plain woven fabrics and gave impetus to the development of predictive models. Finite element models to predict nesting and the compression processes were established and experimentally verified.15,16 It should be noted that nesting and compression processes have significant effects on the preform process and the thickness of the FRP composite. However, the corresponding studies about the relationship between nesting and compression processes, the evolution of the nesting in compression deformation processes have never been reported. Meanwhile, the compressibility of natural fabric, carbon fabric, glass fabric, and other types have been studied separately.17–20 Most of researches only involved one type of fiber and the general applicability of conclusions for other types of fibers were not revealed. In addition, compression processes involve many uncertainties caused by fiber architecture variations and matrix material uncertainties, and some delicate features that conventionally neglected may have significant impacts on thickness and yarn crimp inside the composite.21,22 Compression processes, as important processes after lay-up, have significant effects on the fiber volume fraction. Meanwhile, nesting, especially for plain woven fabric, can reduce the thickness of layers during layer up. There must be connections between nesting and compression processes in composites manufacture. Therefore, it is of great significance to find the relationship between nesting and compression processes for generally used fabrics.
Thus, in this paper, the objective is to find the relationship between nesting and compression processes that include the initial thickness h, the thickness in compression t, and the thickness deformation Δ, for plain woven fabrics in various types of fibers. In “Experiments” section, systematical experiments of the initial thickness and compression for three carbon fiber fabrics and two kinds of E-glass fiber fabrics were presented. A unit cell for plain woven fabric was established for theoretical analysis of initial thickness and nesting conditions. In “Results and discussion” section, we conducted a detailed study on the compression processes by analyzing compression curves and the influences of nesting on h, t, and Δ were discussed. Meanwhile, the relationships between nesting and compression processes were revealed and the applicability of the obtained conclusions for other types of fibers were demonstrated. Finally, conclusions were summarized in “Conclusion” section.
Experiments
Fabrics
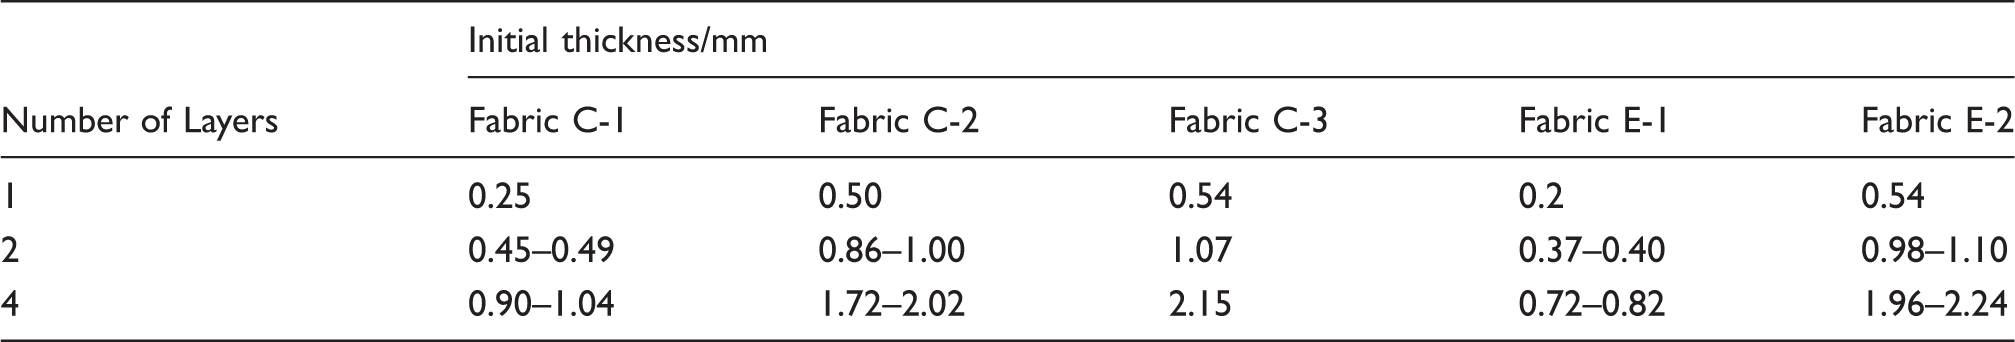
Carbon fiber fabrics and E-glass fiber fabrics are the most common fiber-reinforced fabrics in the FRP composites. Thus, as shown in Figure 1, in this work, we selected three kinds of carbon fiber fabrics: CC-P200-3 (fabric C-1), CC-P400-12 (fabric C-2), and C-LT400-12 (fabric C-3) and two E-glass fiber fabrics E-G0601(fabric E-1) and E-D1301(fabric E-2). Fabrics C-1, C-2, E-1, and E-2 are plain woven fabrics, while fabric C-3 is non-crimp fabric(NCF). As NCF of E-glass has the same compression properties with carbon fiber, it is not mentioned in this paper for reducing duplication of work. The corresponding parameters are listed in Table 1. There are significant differences among these fabrics in yarns specifications and weaving methods. Yarns of fabric C-1 and E-1 have a fiber count of 3 k, while yarns of fabric C-2, E-2, and C-3 are 12 k. Moreover, these fabrics are woven in different ways. Fabric C-3 is NCF and the axial angles are 0° and 90°, while the others are in the way of plain woven. Non-crimp is easy to meet the paving layer of the direction and order requirements, while plain woven fabric has better surface. Both of them are widely used in composite components.
Photographs of fabrics: (a) plain woven fabric C-1 (3 k), (b) plain woven fabric C-2 (12 k), (c) non-crimp fabric C-3 (12 k), (d) plain woven fabric E-1 (3 k), and (e) plain woven fabric E-2 (12 k). Parameters including fiber type and weave of the fabrics (200 tex = 3 k, 800 tex = 12 k).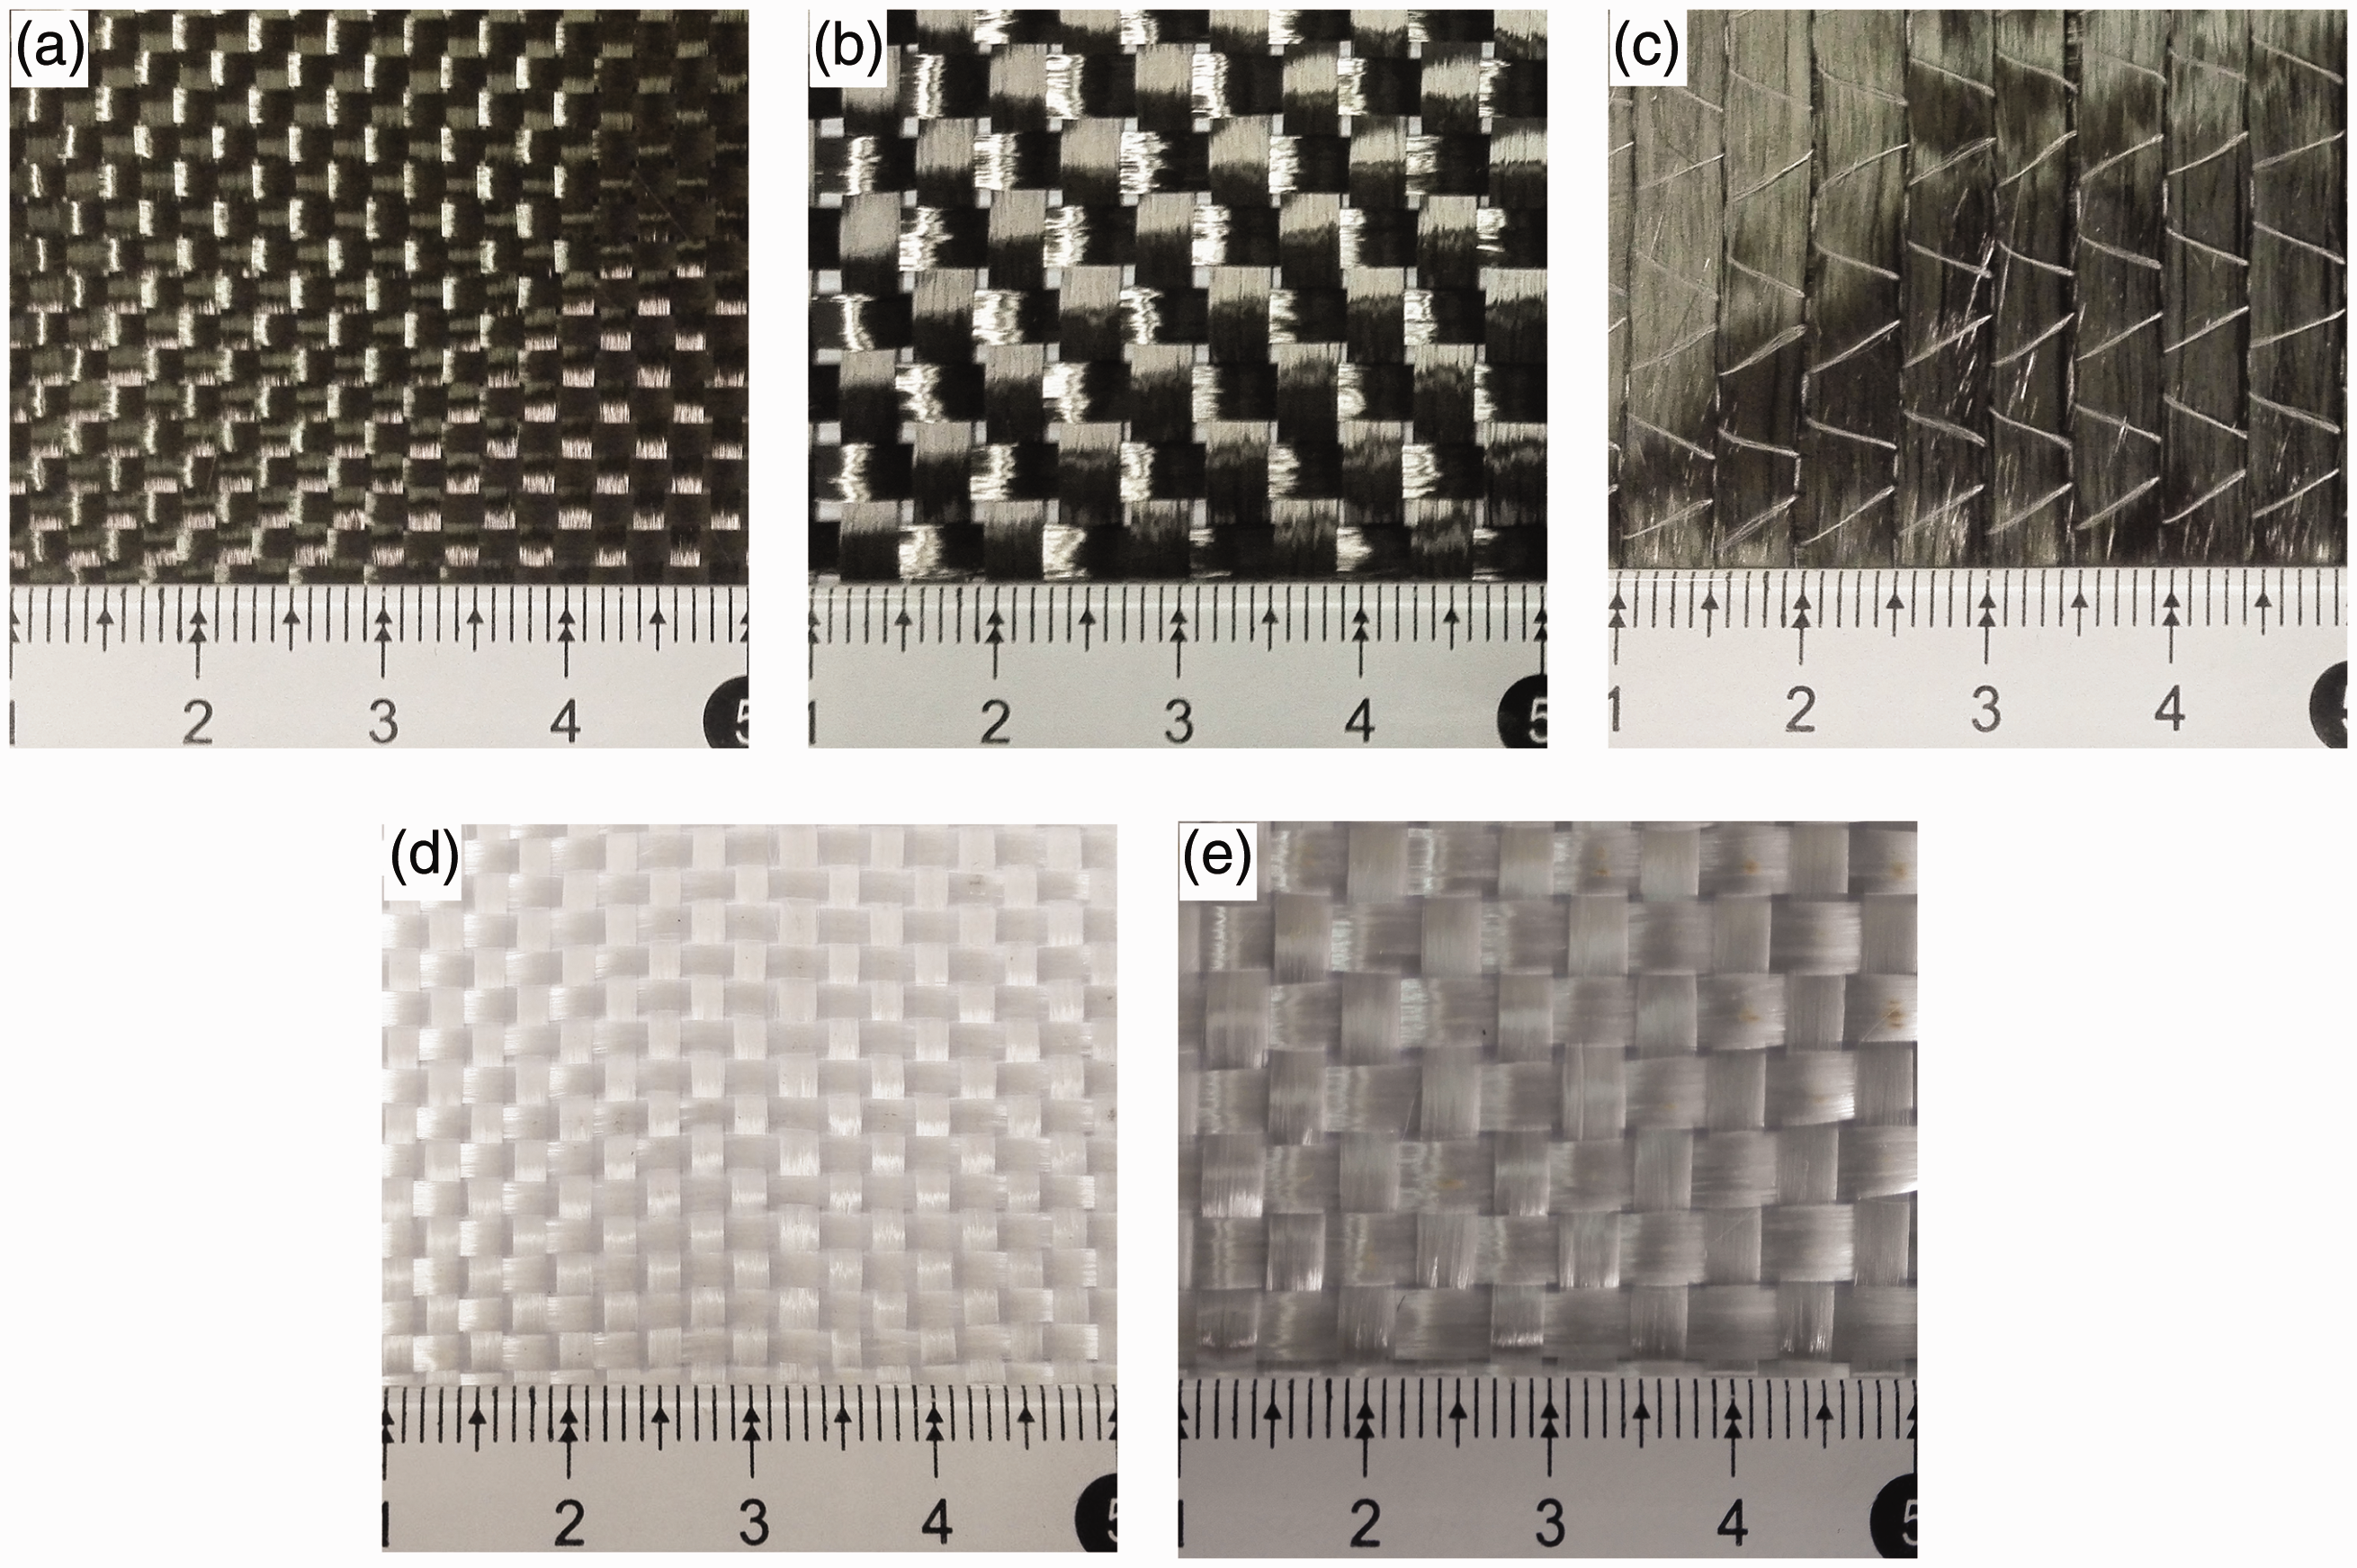
Initial thickness tests
The initial thickness of these five kinds of fabrics were tested according to the standard ASTM D1777 23 for thickness measurement of fabrics and the loading pressure was 4.14 ± 0.21 kPa. The specimen is placed on the base of a thickness gage and a weighted presser foot with the diameter 28.7 ± 0.02 mm lowered. The displacement between the base and the presser foot is measured as the thickness of the specimen. In the experiments, the fabrics were cut into 100 × 100 mm, which were in accordance with the size of bottom plate. In order to prevent the edge of the fabrics from shedding which can have negative effects on testing processes and results, two or three yarns, which located at the ends of the fabrics, were removed before tests. Actually, the effective size of the specimen must be less than 100 × 100 mm. Typically, the effective size of the fabric C-2, C-3, and E-2 is about 80 × 80 mm, the effective size of the fabric C-1 and E-1 is about 90 × 90 mm. All fabrics were compacted with the layer number n of 1, 2, and 4. Particularly, the layer angles of the fabric C-3 were [0/90]n. Nesting is a common phenomenon for plain woven fabrics expected for NCFs, thus, experiments for fabric C-3 were treated as calibration tests to make the results more reasonable in this work. Nesting can affect the initial thickness for plain woven fabrics.24–26 So, it is necessary to test the initial thickness of layers in certain nesting conditions. These nesting conditions will be illustrated in “ Nesting” section.
Compression experiments
Compression experiments for the fabrics were systematically conducted. As shown in Figure 2, the fabrics were positioned on the bottom plate with a diameter of 100 mm, and the top plate is a 50 mm diameter steel plate. The top plate covers enough unit cells, which can reflect the compressibility of specimen and the effective area is the surface of top plate in each experiment. Therefore, the size of the top plate can be smaller than the specimen and the bottom plate. Before compression experiments, a constant 4.14 kPa pressure was applied to ensure the initial thickness as well as the sufficient contact between top plate and the fabrics. During compression experiments, the loading speed of the top plate was 0.5 mm/min and each experiment was repeated 3 times. Relationships between the pressure P and the distance s of the top plate were recorded. The thickness t can be calculated as follows:
Compression experiments for fabrics: (a) experimental setup and (b) schematic diagram.
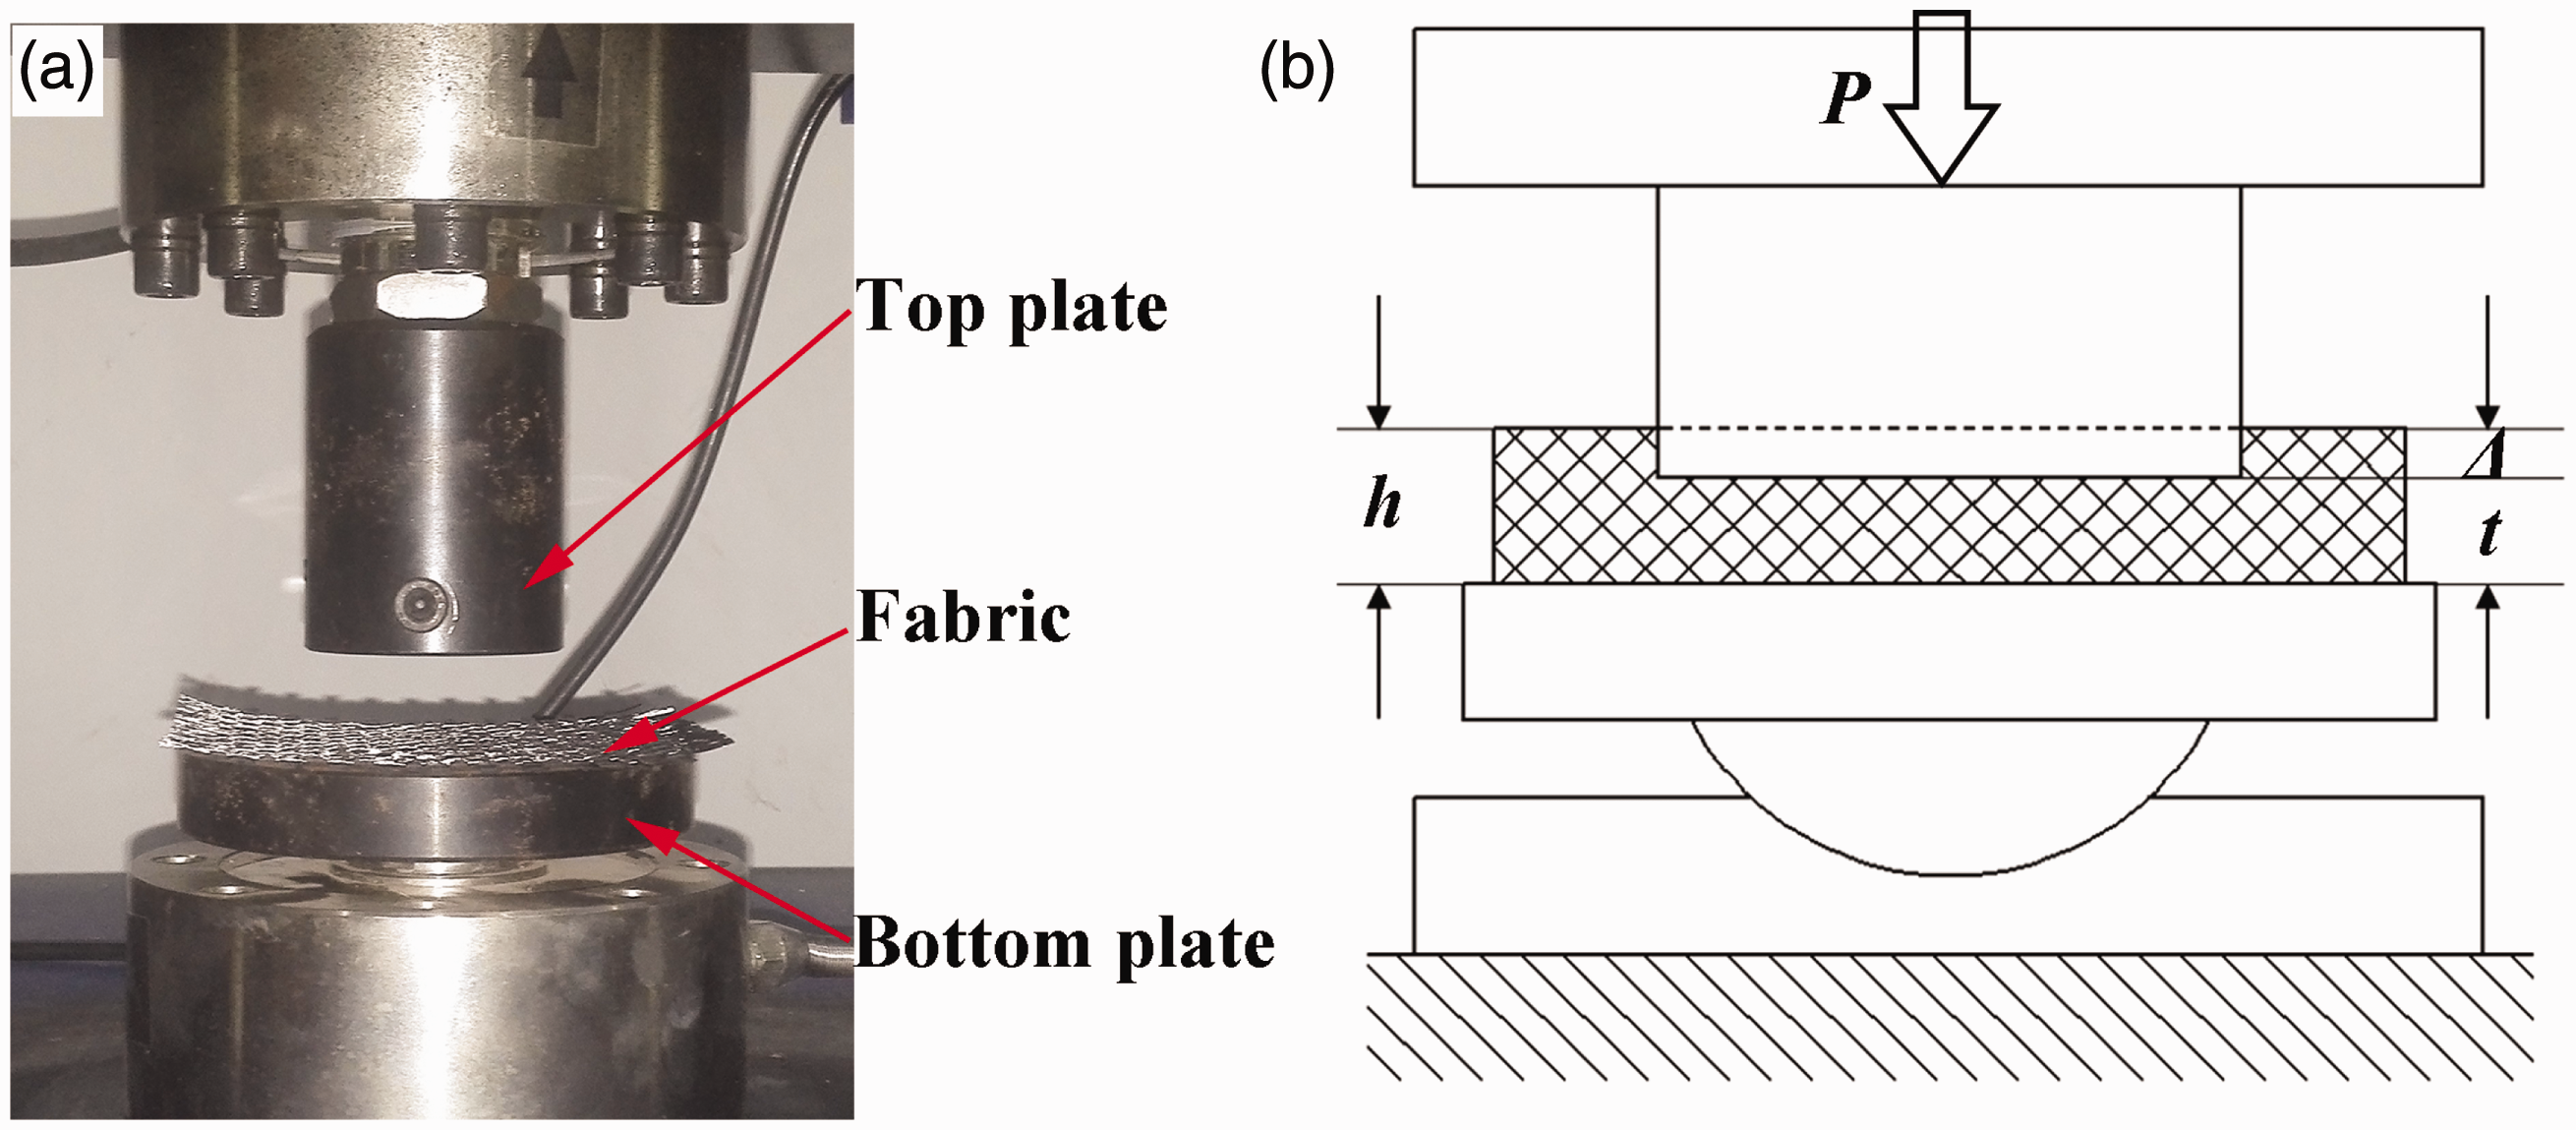
where t is the thickness in compression, h is the initial thickness, and Δ is the thickness deformation. Here, h and Δ are directly measured on the experiments. The initial thickness h was tested according to the standard ASTM D1777 in “Initial thickness tests” section. As the top plate is sufficient contact to the fabric before the compression experiments, the top plate moves downward in the compression experiments, and the distance s of top plate is the thickness deformation Δ of specimen. Thus, Δ can be directly measured in the compression processes. In order to make the obtained results more clearly, the above parameters are divided by the number of layers n, and the corresponding expressions of per layer are presented as:

Nesting
Here, a mesoscopic model for predicting the initial thickness of plain woven fabrics was established. Figure 3(b) shows a cross-sectional view of the unit cell of plain woven fabric with single layer. In the theoretical analysis, the unit cell repeats in the plane of fabric, and the cross section of yarns is regarded as ellipse and no gaps exit between the contact surface of the yarn. H and L represent the thickness and length of the unit cell, respectively. 2a and 2b are the lengths of the long axis and short axis of the ellipse cross section of the yarn.
Unit cell of plain woven fabric: (a) plain woven fabric and (b) unit cell.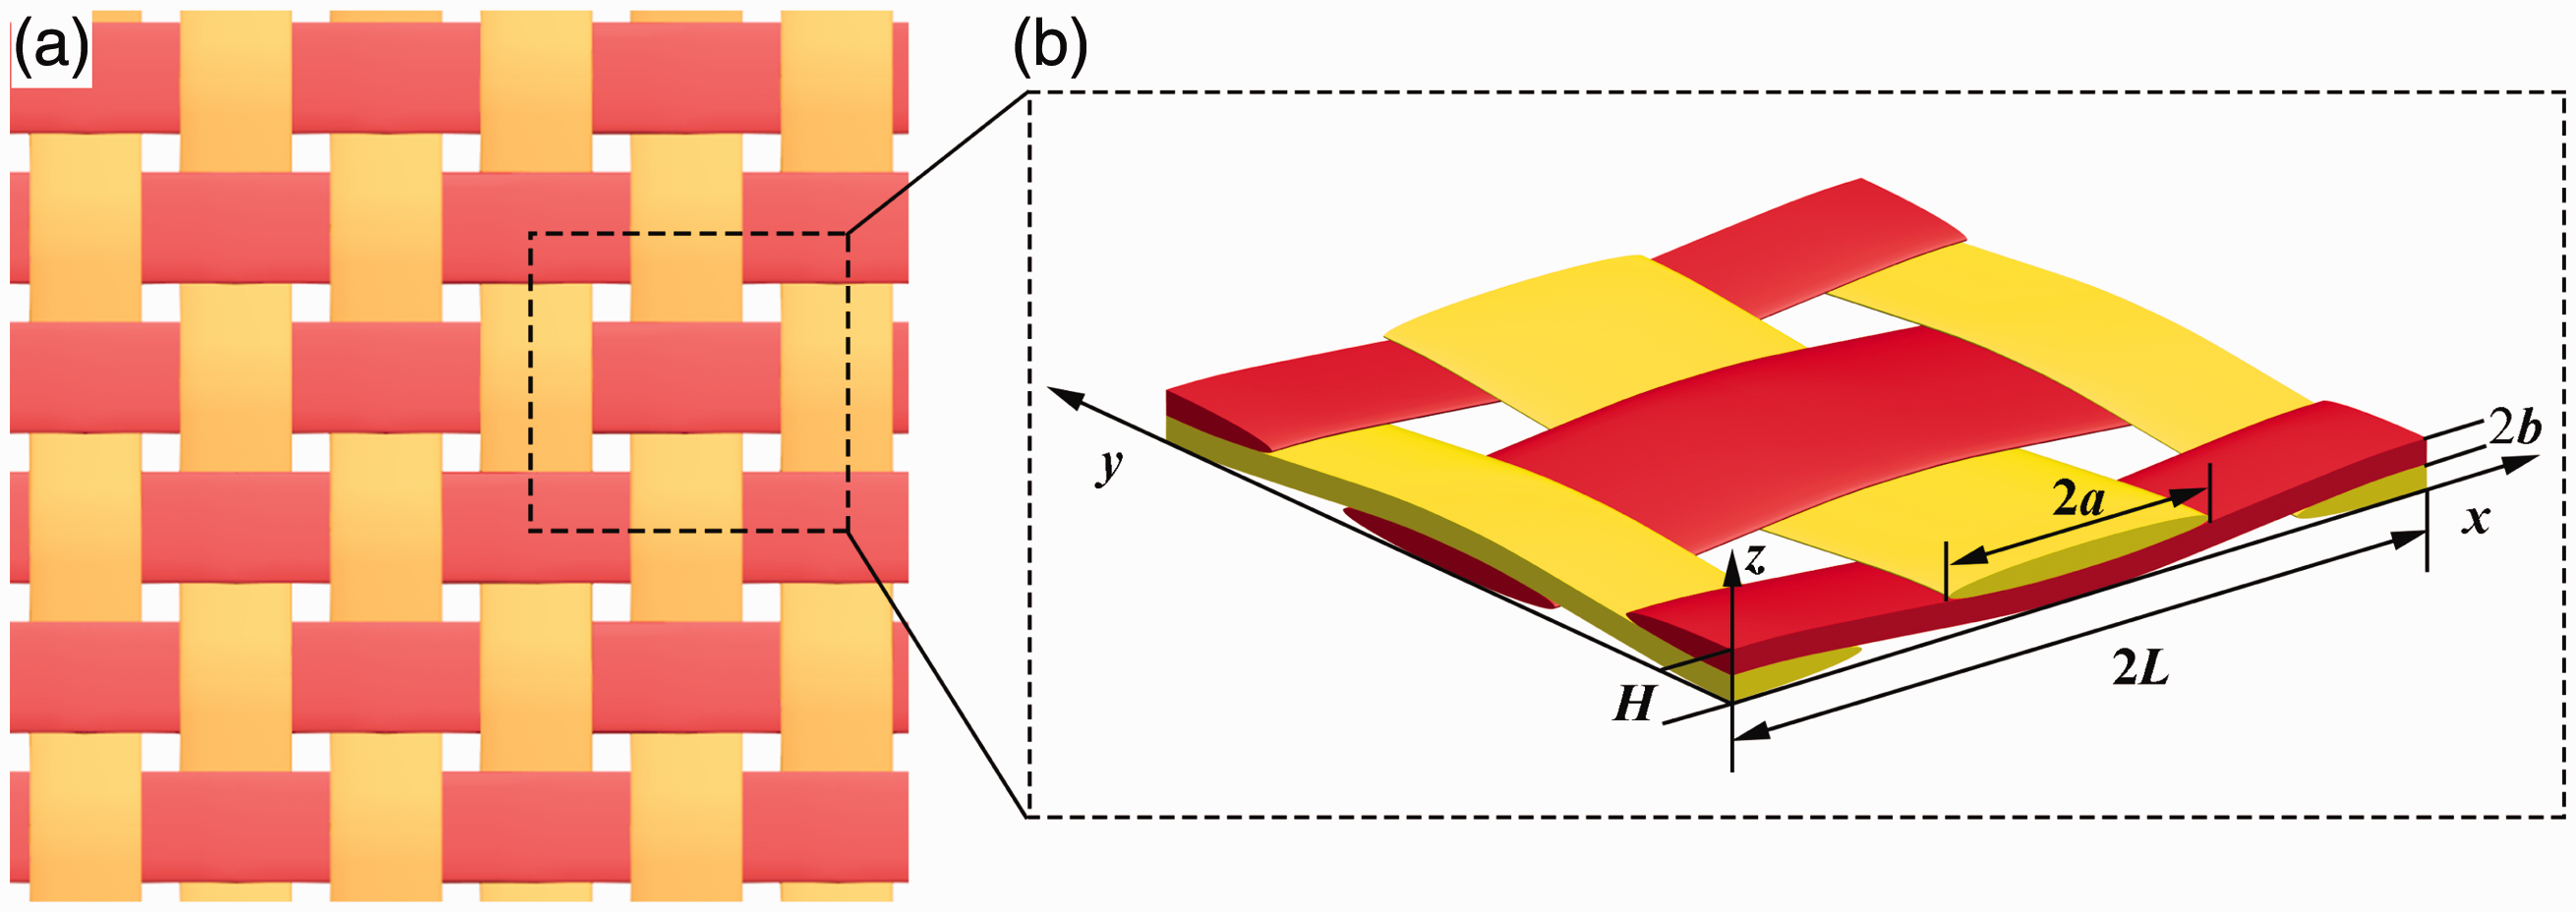
To illustrate the nesting as shown in Figure 4, the edge of one yarn is measured with respect to the edge of one yarn of the next layer. According to the shift Sx in x direction of two adjacent layers, nesting can be classified into three cases. When Sx = L/2 as shown in Figure 4(a), this is the maximum nesting. When 0 < Sx < L/2 or L/2 < Sx < L as shown in Figure 4(b), this is the random nesting. When Sx = 0 as shown in Figure 4(c), this is the minimum nesting. The effects of nesting on the initial thickness of per layer hp, the thickness in compression of per layer tp, and the thickness deformation of per layer Δp will be discussed in “Nesting and initial thickness,” “Nesting and thickness in compression,” and “Nesting and thickness deformation” sections.
Illustration of nesting between two layers: (a) maximum nesting, (b) random nesting, and (c) minimum nesting.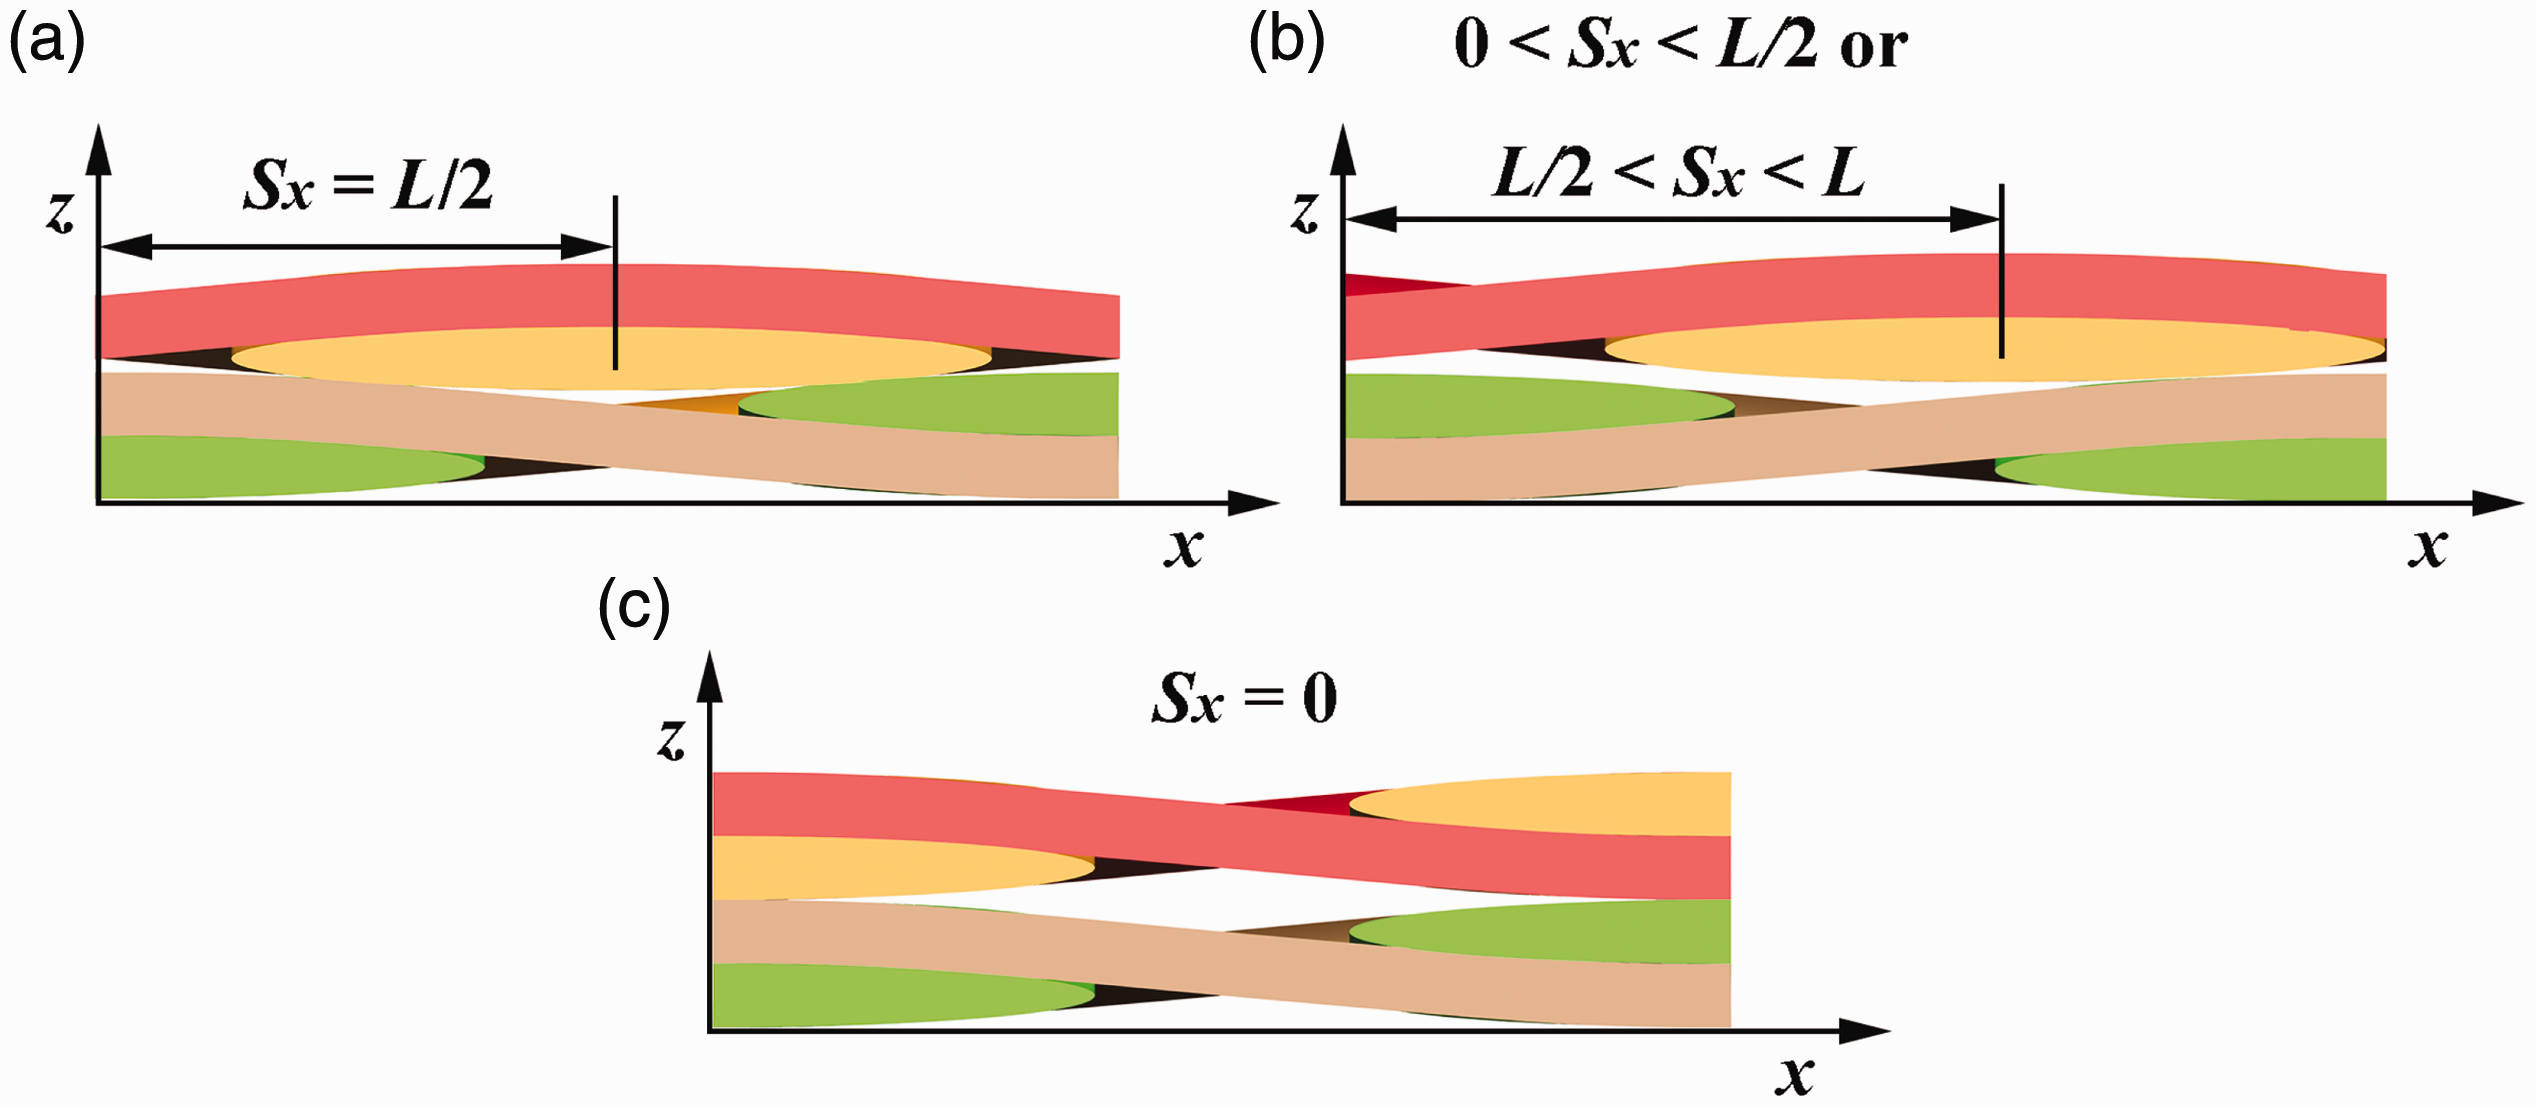
Compression processes
The characteristics of a typical compression curve of fabric are shown in Figure 5(a).15,26 The compression processes can be divided into three typical stages. Stage 1: the linear stage, stage 2: the experiential stage, and stage 3: the linear stage. The main changes of the fabrics in the compression processes are as follows:27,28 In the stage 1 of the compression, as shown in Figure 5(b), stage 1, the gap l caused by the warping of the fabrics reduces to zero rapidly, and this leads to a corresponding decrease in the thickness in compression t. During the stage 2, the main characteristics are the changes in yarns cross section. The fibers begin to move toward the voids formed by the fabric structure and the yarns become thinner, this is the main stage of the thickness deformation as shown in Figure 5(b), stage 2. As the compressive force increases to the stage 3, the fiber starts resisting the external pressure and begin to bear the compression as shown in Figure 5(b), stage 3.
A typical compression processes: (a) a representative compression curve and (b) the main changes of the fabrics.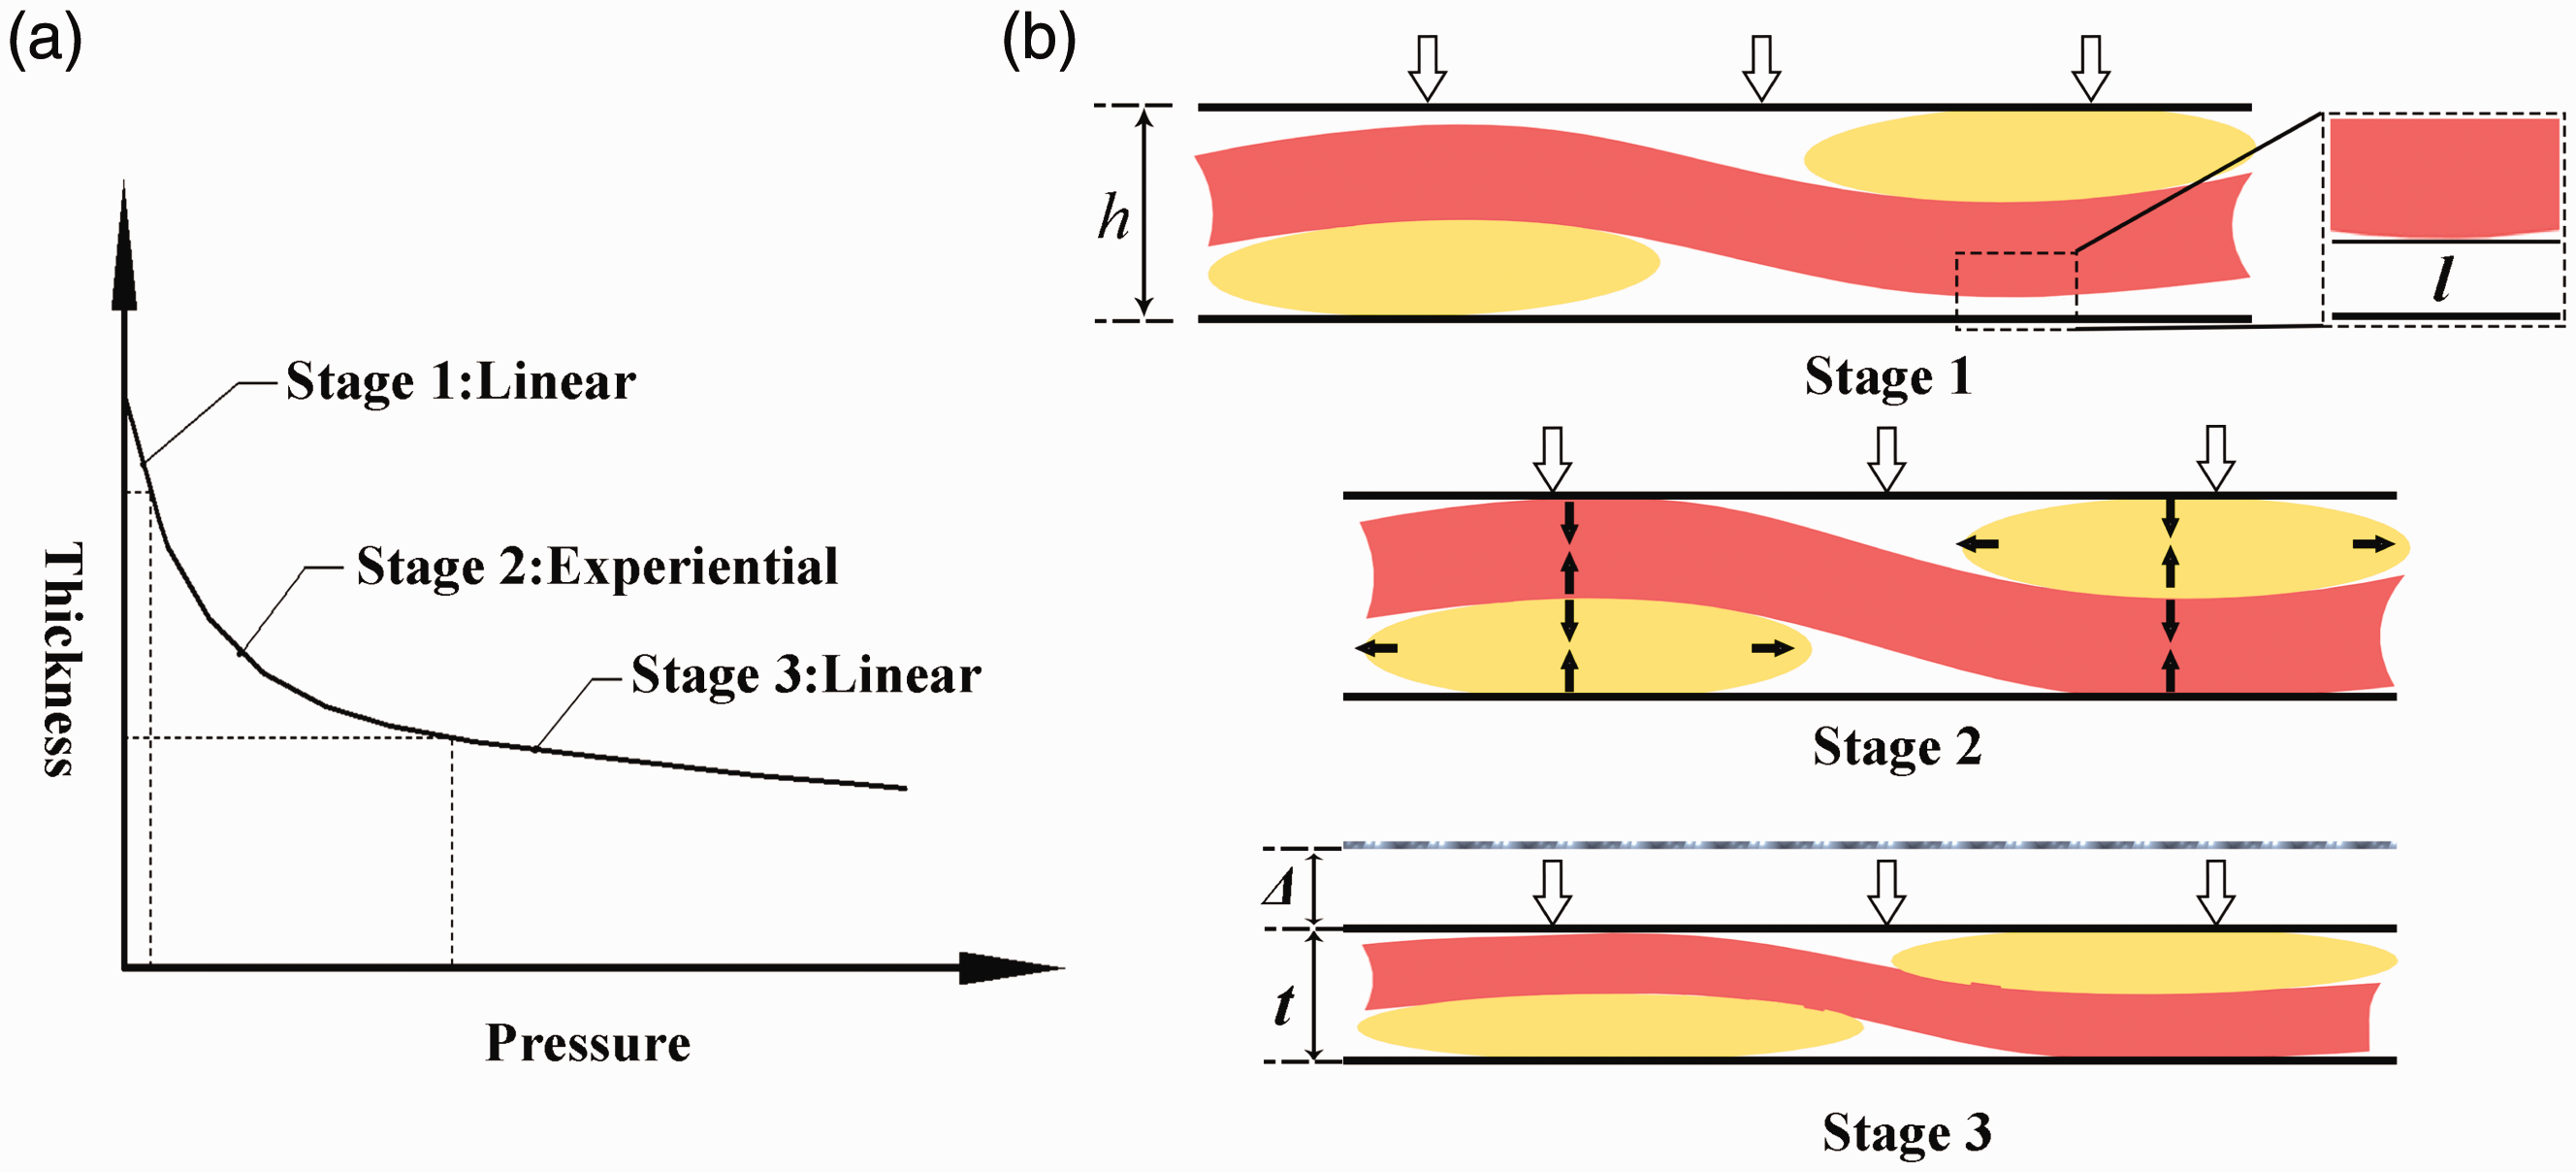
Results and discussion
Compression processes
Figure 6 shows compression curves for carbon fiber and E-glass fiber fabrics with four layers. The variation characters of these curves agree well with the typical stages as mentioned in Figure 5, demonstrating the effectiveness of our experimental procedure. In stage 1, yarns offer limited resistance to the compression through bending deformation at the low pressure and that can be negligible. As the pressure increases, the deformation comes into stage 2. The curves are no longer linear as the geometric shapes of the yarns change significantly, leading to obvious reduction in the thickness of fabrics. In stage 3, the compression curves become linear again. The voids between yarns reach its limit and the fibers begin to bear the compression. In this work, we mainly focus on the compression processes of multilayer fabrics.
Compression curves in minimum nesting (the layers are four): (a) carbon fiber fabrics and (b) E-glass fiber fabrics.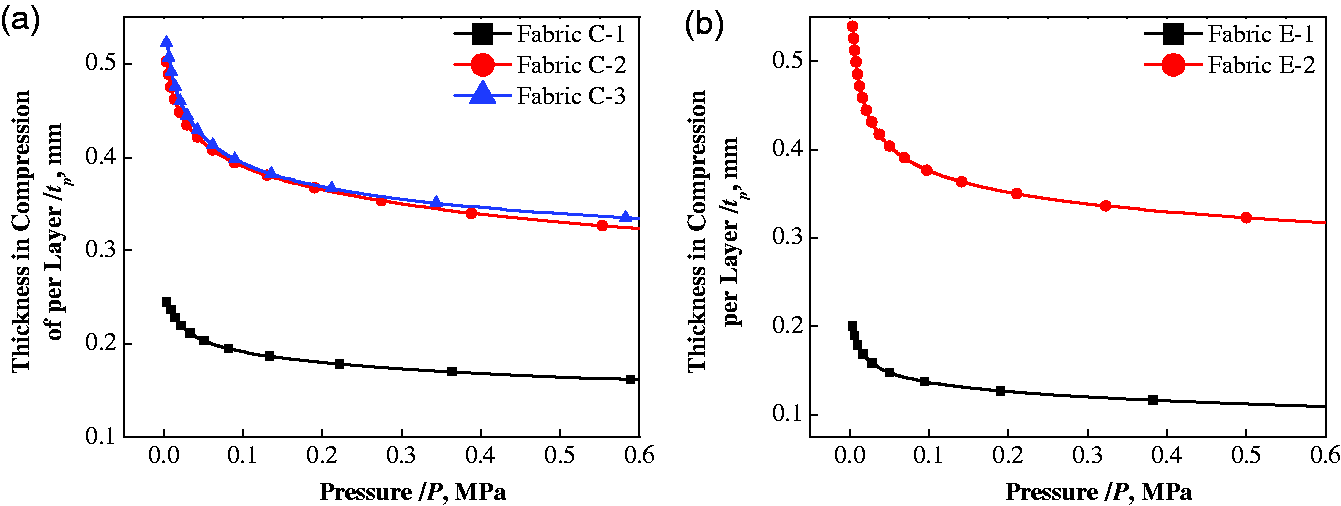
Nesting and initial thickness
Nesting has an effect on the initial thickness h of the layers. For multilayer fabrics, the initial thickness of the fabric is


Similarly, the top and bottom layers are the same as those inner layers and thus:

Substitute equations (6) and (7) into equation (3), the initial thickness of the fabric with the mentioned two nesting conditions can be expressed:


The initial thickness of fabrics with various layers.
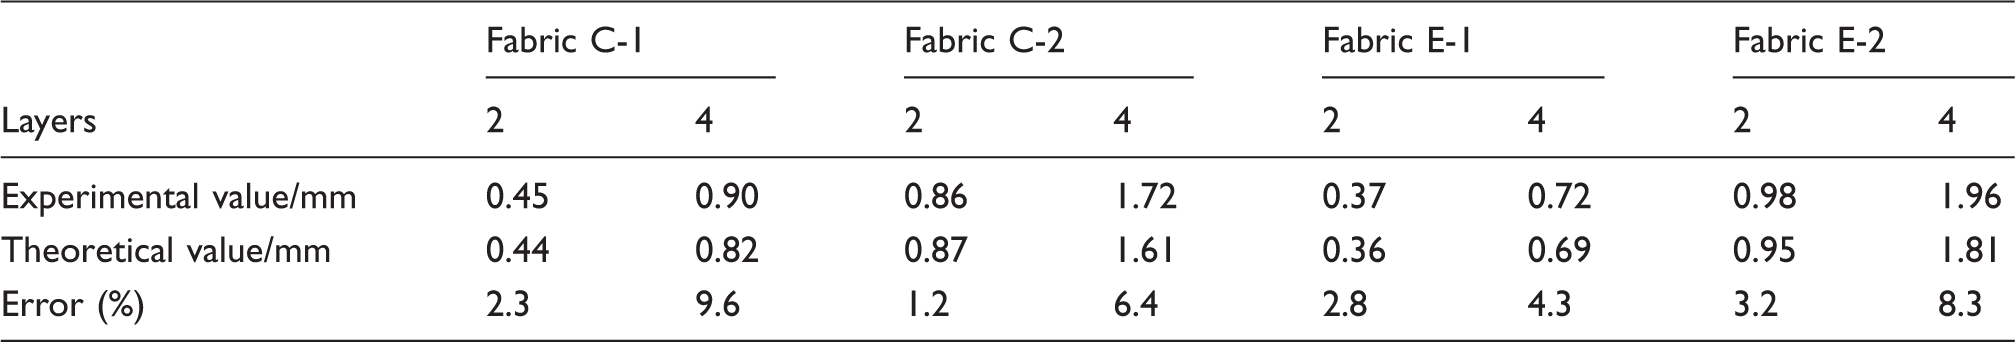
The experimental and theoretical values of initial thickness of plain-woven fabrics (with maximum nesting).
Nesting and thickness in compression
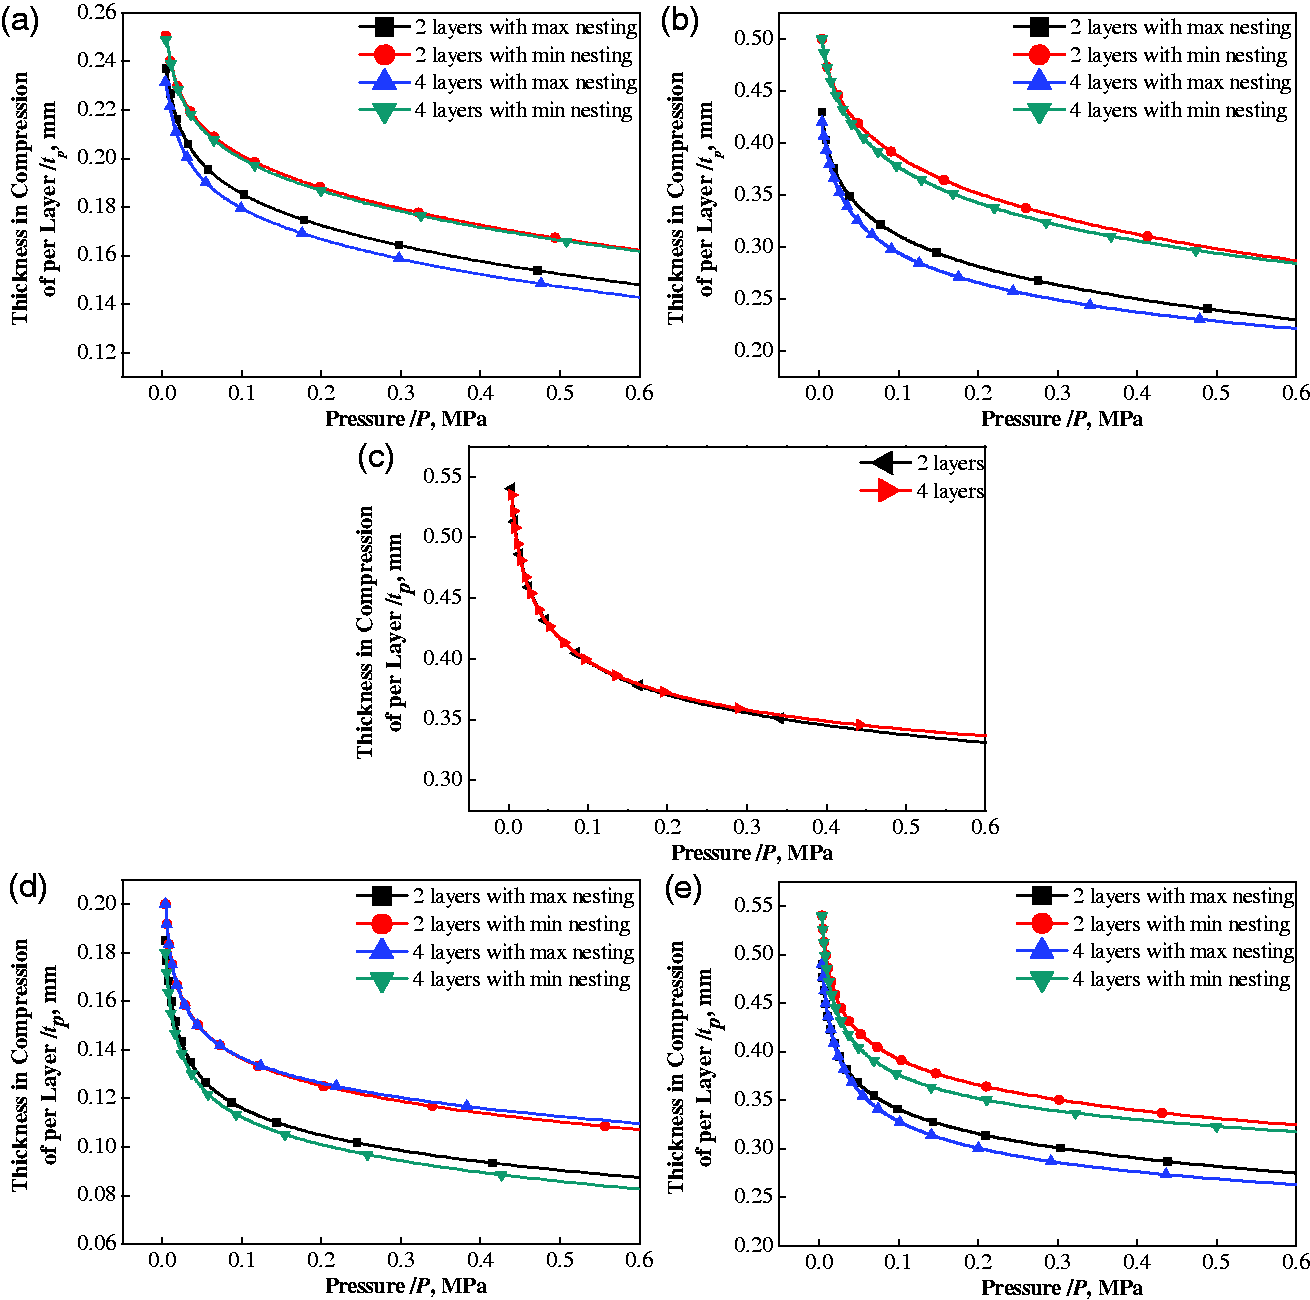
The thickness in compression of per layer tp is affected by the initial thickness of per layer hp that has relationship with nesting conditions. Figure 7 shows compression curves of all the tested fabrics with maximum and minimum nesting, and the numbers of the layers are two and four. It is not mentioned the compression curves of single layer. Firstly, the compression curves of three typical of carbon fiber fabrics were analyzed. With the same number of the layers, the compression curves are quite different in these two nesting cases. For example, In Figure 7(b), when the number of the layers is four, hp of fabric C-2 are 0.42 and 0.50 mm for the maximum and minimum nesting, respectively. When the pressure reaches up to 0.15 MPa, tp is compressed to 0.28 and 0.35 mm, respectively. This result clearly reveals that under these two different nesting conditions, tp is different at a given pressure. However, there is no difference in tp for different layers with no nesting. For instance, as shown in Figure 7(c), the compression curves almost coincide with each other, as there is no nesting exists. Therefore, these results present that hp is affected by the nesting, which further influences the compression curves. Meanwhile, as the different of hp, which has illustrated in equation (9) in maximum nesting, the tp of two layers is higher than that of four layers as shown in Figure 7(a) and (b). Obviously, it is sure that the above conclusions about the relationship between hp and tp are also applicable to the evolutions of the E-glass fiber fabrics as shown in Figure 7(d) and (e). For illustrating the relationship between hp and tp, it can be expressed by the following relation:
Compression curves with maximum and minimum nesting: (a) fabric C-1, (b) fabric C-2, (c) fabric C-3, (d) fabric E-1, and (e) fabric E-2.
Nesting and thickness deformation
In order to explore the influence of nesting on the thickness deformation of per layer Δp and exclude the influence of the initial thickness of per layer hp, the thickness deformation curves about Δp are discussed here. As the compression curves with different number of layers are the same as mentioned in “Nesting and thickness in compression” section, the following analysis of thickness deformation curves are for the four layers. Figure 8 shows the thickness deformation curves of all fabrics with maximum and minimum nesting conditions. Figure 8(a) and (b) is for carbon fiber fabrics and Figure 8(c) and (d) is for E-glass fabrics. Compared the curves in Figure 8(a) and (b), it is known that nesting has no influence on Δp in compression processes. For example, in Figure 8(a), the curves of thickness deformation are the same in maximum and minimum nesting cases. This conclusion can be also found in Figure 8(b) for fabric C-2 with different nesting conditions. For E-glass fiber fabrics, we have the same conclusion that nesting has no effect on Δp in compression processes. Moreover, the way of weaving also has no influence on Δp of the fabrics with same yarns specification for carbon fiber. As shown in Figure 8(b), fabric C-2 is plain woven fabric and C-3 is NCF as mentioned in “Fabrics” section, and their thickness deformation curves show no difference. Thus, these two comparisons conclude that nesting and weaving models show little effects on Δp for fabrics. On the other hand, the specification of the yarns has a significant effect on the thickness deformation of the fabrics. At a given pressure P, Δp of different yarns specification are not the same. For instances, Δp of fabric C-1 and C-2 is 0.06 and 0.14 mm at 0.15 MPa, and when the pressure reach to 0.6 MPa, Δp is 0.09 and 0.20 mm, respectively. Thus, it can be concluded that Δp has nothing to do with nesting and weaving methods except for yarns specification in compression processes. Furthermore, whether for the E-glass fiber or the carbon fiber, nesting is a common phenomenon that occurs in the lay-up and Δp is essentially reflects the fabric compression processes. Lay-up and compression processes are two different parameters of the fabric, there is no inner relationship between them.
Thickness deformation curves: (a) fabric C-1, (b) fabric C-2 and C-3, (c) fabric E-1, and (d) fabric E-2.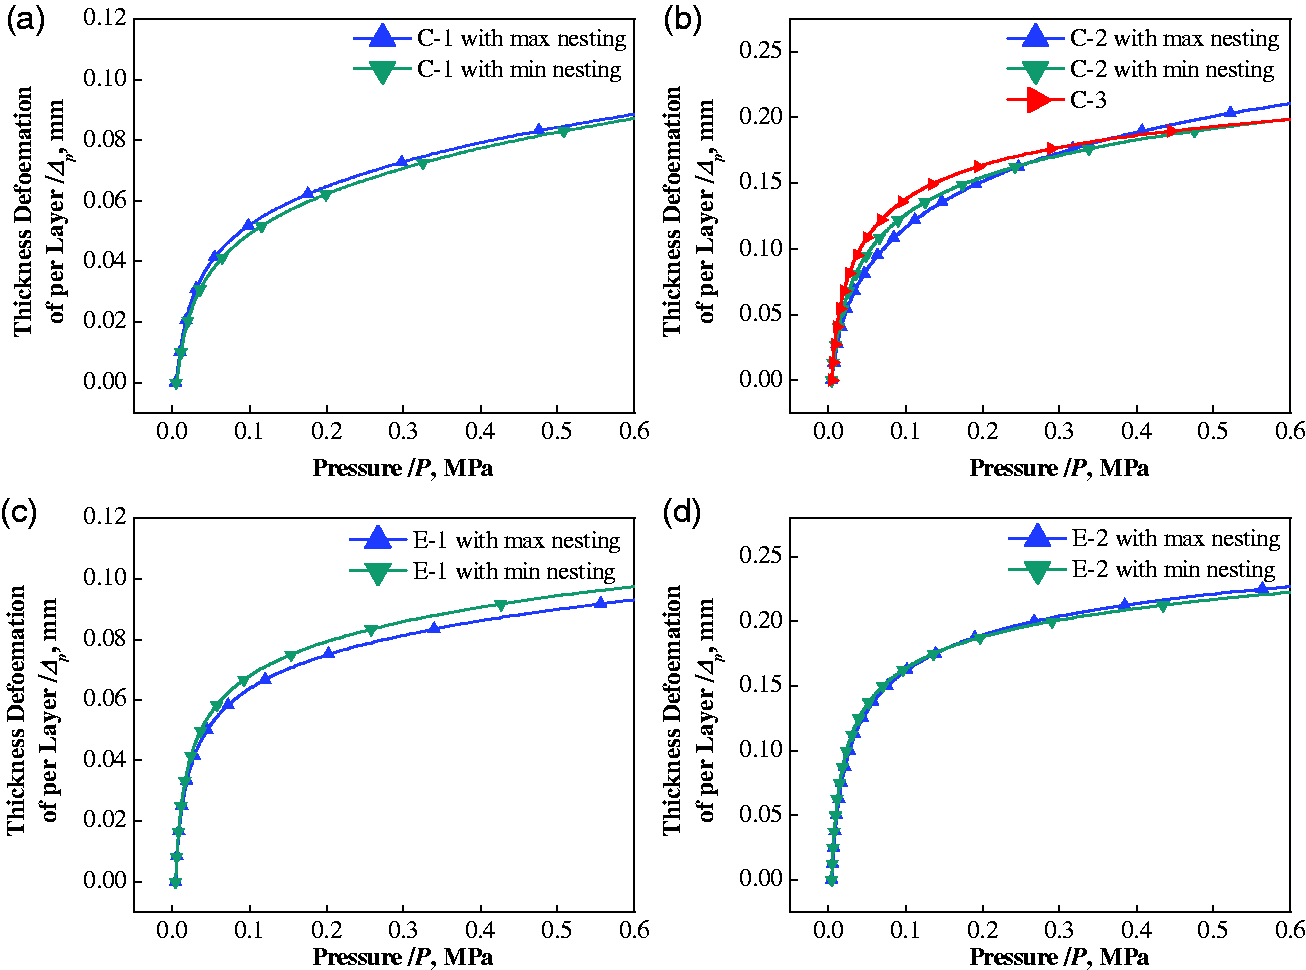
Effects of fiber types
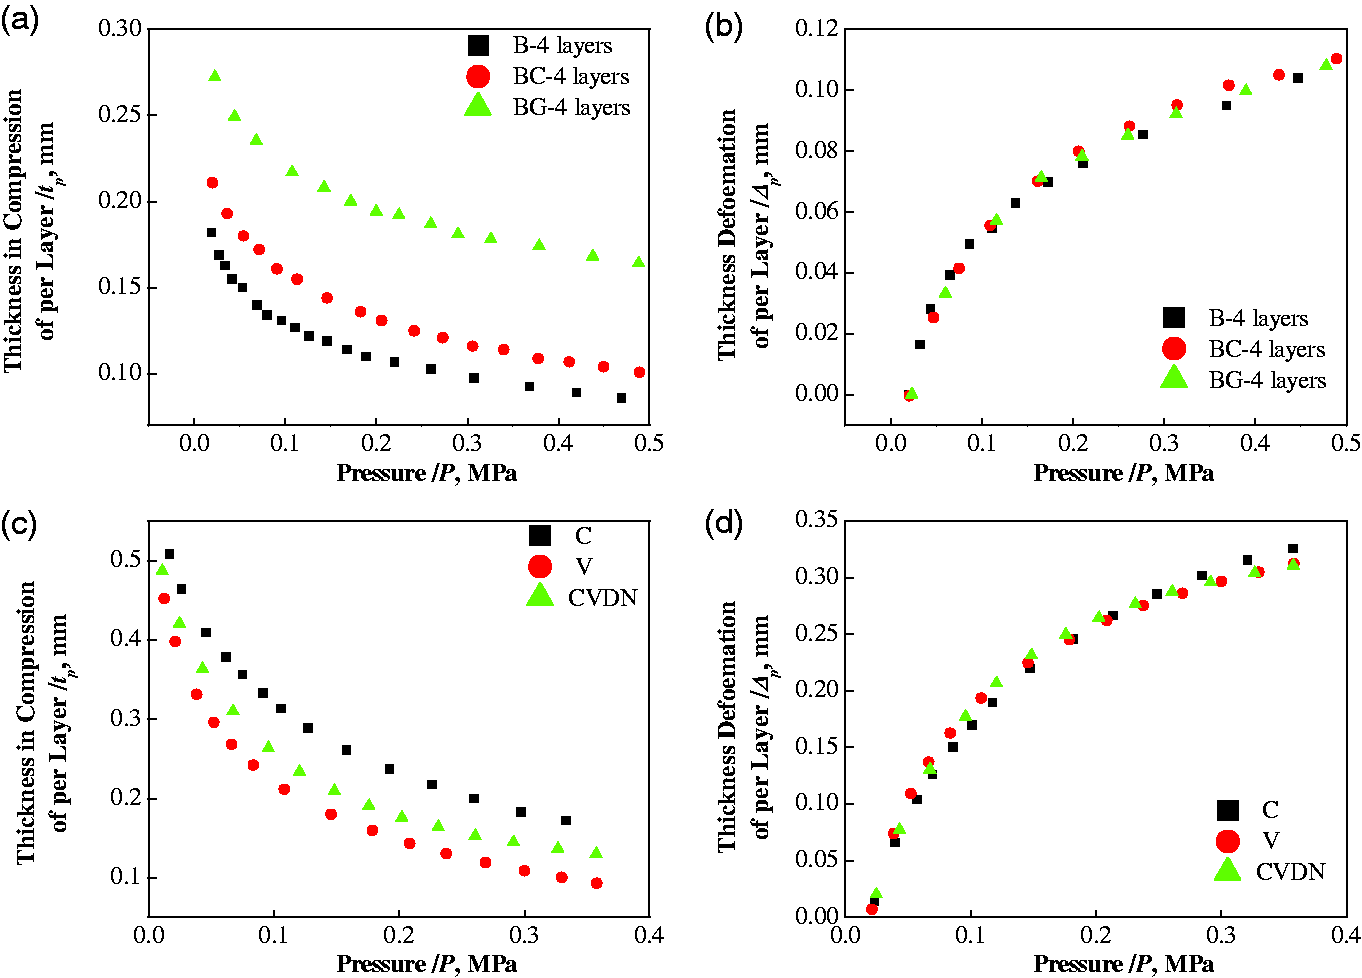
According to the above discussion, the type of different fibers, namely whether carbon or glass fiber, has no effect on the relationship between nesting and compression process. To further verify this conclusion about the effects of nesting on tp and Δp, as shown in Figure 9, the curves of compression experiments for other types of fibers are discussed here. Figure 9(a) and (b) presents the results of compression for carbon nanotube plain woven fabric reported in the study by Stepan et al.
29
It contains three random nesting conditions, which are B, BC, and BG. The values of the nesting coefficients of B, BC, and BG are 16.2%, 13.4%, and 9.6%, respectively. Figure 9(c) and (d) illustrate the results of compression for nanofiber-grafted alumina fabric reported in the study by Lomov et al.,
30
which also contains three random nesting cases: C, V, and CVDN. The values of the nesting coefficients of C, V, and CVDN are 10%, 15%, and 13%, respectively. Carbon nanotube fabric and nanofiber-grafted alumina fabric are two fibers which have differences with carbon and glass fibers investigated in this work. In Figure 9(a), compression curves of different nesting cases are not the same. At a given pressure, tp of these nesting cases are not equal, which means nesting has an effect on tp. While, as shown in Figure 9(b), the thickness deformation curves are the same, which clearly demonstrates that nesting has no effect on the thickness deformation of per layer Δp. Moreover, Figure 9(c) and (d) provide further evidences for these two conclusions. Thus, Figure 9 demonstrates the effectiveness of the conclusions that nesting affects the thickness in compression of per layer tp but has no effect on the thickness deformation of per layer Δp, and also definitely illustrate the applicability of these conclusions for plain woven fabrics with different fibers including carbon, glass, carbon nanotube, and nanofiber-grafted alumina fibers.
Conclusions
In this work, we conducted studies for plain woven fabrics on nesting and compression processes through systematic experiments and detailed analysis. The relationship between nesting and the initial thickness h, the thickness in compression t, and the thickness deformation Δ were respectively revealed. The general applicability of these relationships for different types of fibers were fully demonstrated. The main conclusions are summarized as follows:
A unit cell of plain woven fabric was established, the theoretical expressions of nesting effects on the initial thickness h were presented. The correctness and effectiveness have been demonstrated. We find that nesting will decrease the initial thickness and the minimum initial thickness appears in the maximum nesting condition. For carbon fiber or E-glass fiber, we experimentally figure out that nesting has no effect on the Δ in the whole compression processes. Thus, for plain fabric, even with different initial thicknesses caused by nesting, the thickness deformations are kept the same at given pressures. The thickness in compression t of minimum nesting is higher than that of maximum nesting at the same layers, exhibiting the same interrelation as that between nesting and h. As nesting has no effect on the Δ, at a given pressure, the relationship between nesting and t can be precisely described as the relationship between nesting and h. The conclusions of nesting and compression processes drawn from carbon fiber and E-glass fiber are also applicable to other types of fibers, such as carbon nanotube and nanofiber-grafted alumina fibers. Generally, nesting reduces the t through the h but has no effect on Δ.
Footnotes
Declaration of conflicting interests
The author(s) declared no potential conflicts of interest with respect to the research, authorship, and/or publication of this article.
Funding
The author(s) disclosed receipt of the following financial support for the research, authorship, and/or publication of this article: The authors are grateful for the support by National Natural Science Foundation of China under grants #11602081, #51405150. This work is also supported by the fundamental research funds for the central universities under grants #531107040934.