
Abstract
An experimental study was conducted to investigate the electro-flexure response of conductive natural fiber hybrid laminate composites. The composites were composed of laminates of jute and flax fibers, and the composites were subjected to flexural loading for the electrical and bending response. Multi-walled carbon nanotubes were shear mixed and ultrasonicated into the epoxy matrix. Short carbon fibers were reinforced in-between the laminates using “wet flocking” technique. To measure the electrical response under flexural loading, a four-point circumferential probe method was used. A parametric study was conducted to investigate flexural performance and damage sensing by varying carbon fiber lengths (150 and 350 µm) and the carbon fiber densities (500, 1000, 1500, and 2000 fibers/mm2). The addition of carbon fibers decreased the flexural strength for most of the cases, however increased the flexural strain at break for all composites of carbon fiber length of 150 µm. During the nonlinear deformation, the composites of carbon fiber length of 150 µm demonstrated a linear increase in resistance; however, that of carbon fiber length of 350 µm showed increasing slope of resistance. Overall, the composites of carbon fiber length of 350 µm showed lower resistance change at break compared to that of carbon fiber length of 150 µm.
Keywords
Introduction
Natural fiber composites (NFCs) have gained attention in the recent past due to the advantages the NFCs have over traditional materials. The most notable advantages were ease of production, reduced cost of materials, and sustainability. They are beneficial to reduce pollutant emissions, greenhouse gas emissions, and overall reducing the carbon footprint in production.1,2 NFCs also offer benefits such as higher durability, lighter weight, as well as fire and corrosion resistance. 3 They offer a reduction in density compared to glass fibers but maintain comparable specific properties. The mechanical properties are enhanced by incorporating fillers and fibers to accommodate for high strength needs. 4 A drawback of NFCs is the water absorption of these cellulose contained natural fibers. 5 To resolve this issue, chemical treatments are applied to the natural fibers to reduce their water absorptivity, namely alkaline and silane treatments. Rokbi et al. 6 applied an alkali treatment to Alfa fibers, and the composites made of the treated fibers were found to have improved bending behavior under flexural loading than those using untreated fibers. The flexural strength and modulus both improved from the treatment. Silane has been used as a coupling agent in glass fibers and is also being used for natural fiber composites. 7 NFCs have been used in the automotive industry for door panels, dashboards, and several interior parts. This makes vehicles more lightweight, reduces costs, and reduces carbon dioxide in production. Additionally, the vehicles conform to some countries’ requirements that over 80% of vehicles must be reused or recycled. 8
Many studies have been performed to determine the mechanical characteristics of NFCs. A study was performed on the mechanical properties of polypropylene composites reinforced with cotton and wood fiber, separately. Maleic anhydride grafted polypropylene was used to increase interactions on the interface of the composite. Tensile and flexural testing were performed on the composites. It was determined that the grafted polypropylene increased the tensile and flexural strength of the composites by increasing the interactions between the fibers and the matrix in both composites. 9 Another group investigated the mechanical properties of natural fiber reinforced composites using plant oil-based resin. The fibers used for reinforcement were flax, cellulose, pulp, and hemp. Recycled papers or newspapers were used as natural fiber reinforcements as a cheap method of introducing cellulose fibers into the polymer matrix. Dynamic mechanical analysis testing was performed on the composites along with flexural testing to determine their mechanical properties. The composites with the recycled paper were found to have a storage modulus five times greater than the soybean oil resin alone. These composites were found to have mechanical properties suitable for automotive and housing applications. 10 Another study has been conducted on the tensile and flexural properties of NFCs, but with snake grass/isophthalic polyester reinforced composites. It was found that the flexural strength of the composites increased with increasing volume fractions of the fibers beyond 20%, until it reaches 25% when the flexural strength decreases with increasing volume fraction of fibers. A 25% volume fraction was found to be the optimal value for the greatest flexural strength. 11 Shibata et al. 12 studied the effects of volume fraction and fiber length of natural fibers on the flexural properties of biodegradable composites. Kenaf and bagasse fibers were used in press forming with corn-starch biodegradable resin to create composite samples for flexural analysis. It was concluded that bagasse was more compressible than kenaf due to the structural differences in the cross section of the composites. The flexural modulus of the composites increased with higher fiber volume fraction until 60% fiber volume fraction for kenaf and 66% for bagasse. At this point, the flexural modulus decreased due to an insufficient amount of resin. The increase in lengths of kenaf and bagasse did not change the flexural modulus, but below 2.8 mm length of kenaf and 3.2 mm of bagasse, the flexural modulus decreased.
With the development of the mechanics of NFCs, there has been much effort involved in developing multi-functional NFCs. Much research has been done to incorporate carbon nanotubes (CNTs) to reinforce composites and make them electrically conductive. The high strength and high electrical conductivity of the CNTs combined with low density provide useful properties to utilize in reinforcing NFCs. 13 Zhuang et al. 14 studied incorporating multi-walled carbon nanotubes (MWCNTs) into jute fibers by means of dip coating to create an electrical network within the fibers. This gave the fibers damage-sensing abilities that could be used in composites. Jute/epoxy interphases with a high concentration of MWCNTs formed as a result. The dielectric properties of the MWCNT coated jute and epoxy composites improved and had sensing capabilities of temperature, relative humidity, stress, and strain from its surrounding environment. In addition to making the NFCs multi-functional, CNTs also improve the mechanical properties of the composites. A study has been conducted on the effects of carboxyl-functionalized carbon nanotubes coated onto flax fibers and made into reinforced composites. Double cantilever beam fracture tests were employed to test the change in mechanical properties of the composites The CNT reinforcement improved interfacial shear strength by 26%, mode I interlaminar fracture toughness by 31%, and interlaminar shear strength by 20%. 15 Another study examined load and health monitoring in glass fiber composites using epoxy resin reinforced by two different types of carbon nanotubes with carbon black. Changes in the resistance could be measured to detect damage occurring from microscale damage, including inter-fiber failure. 16 Gao et al. 17 studied in situ sensing of impact damage in glass fiber/epoxy composites reinforced with percolating carbon nanotube networks. The results showed that the resistance permanently increases with repeating impacts (over 120% change after 11 impacts), and that this decrease recovers by 10% during unloading due to the closure of some cracks. Many recent studies have used MWCNTs and short carbon fibers to detect damage in composites.18–22 A recent study examined the electro-bending behavior of curved jute/epoxy resin laminated composites reinforced with MWCNTs and short carbon fibers. Using a pre-crack in a curved specimen, the major crack did not propagate; instead, lateral cracks formed around the crack tip in the tension zone which led to fracture in the composite. The carbon fibers productively diverted the main crack’s growth. 23
The studies mentioned previously deployed CNTs in natural fiber composites to detect damage under mechanical loading. No studies reported on the electrical response of hybrid natural fiber composites under flexure loading. Hence, in this study, the electrical response of hybrid jute/flax composites embedded with CNTs and reinforced on the z-axis with short carbon fibers was investigated. The well-dispersed CNTs in the matrix along with CF reinforcement on the laminates create a well-defined electrical network. The effect of length and amount of carbon fibers on flexural strength and electrical response of the hybrid flax and jute composites was investigated. To apply flexural loading onto samples, ASTM Standard D790-17 24 was utilized and a four circumferential probe system was used to record electrical measurements during loading.
Experimental details
Materials
Woven linen fabrics (flax fiber) were supplied by Joann Fabrics, North Dartmouth, MA and used as the first laminate of choice. Woven jute fiber fabrics were donated by Stuart C. Hurlbert & Co. Inc, Framingham, MA and used as the other laminate of the composite. For the matrix of the composites, Epothin 2 epoxy resin (bisphenol-A epoxy resin) and Epothin 2 epoxy hardener supplied by Buehler were chosen. The ratio of resin to hardener is 100:45 parts by weight. MWCNTs were supplied by Cheap Tubes Inc., Cambridgeport, VT with a length of 1–12 µm, a diameter of 13–18 nm, and a purity greater than 95%. They were used along with carbon fibers to create an electrical network in the composites. Two weight percentages of CNTs were introduced into the epoxy of the composites, those being 0.1% for composites with CF reinforcement and 0.3% for composites without carbon fibers. PAN-based carbon fibers were used for z-axis reinforcement between the jute and linen laminates. Short 150 ± 50 µm length carbon fibers were supplied by Asbury Graphite Mills, Inc., NJ and longer 350 ± 100 µm length carbon fibers were supplied by E&L Enterprises Inc., LA. Both carbon fibers had a mass density of 1.8 g/cc with 99% carbon content. Highly conductive silver paint from SPI Supplies, West Chester, PA was used to paint a four circumferential probe system onto the composites.
Fabrication
Fabrics and CNT mixture
The jute and flax fabrics were cut into 229 × 178 mm2 sheets to provide adequate space to fabricate the desired size of the composites. Before they were cut, the fabrics were thoroughly investigated to ensure that they were consistent in terms of weave pattern and fiber quality. Then, the jute and flax fabrics underwent a fiber treatment to achieve hydrophobic effect for preventing moisture absorption to have a longer service life of the composites. To accomplish this, the fabrics were given an alkali treatment, followed by a silane treatment. The process and its effectiveness have been well documented in the recent work.25,26 After these treatments, the fabrics were stored in sealed zip-lock bags to ensure they were not exposed to moisture and other outside factors that may have affected the fabrics. Since agglomeration is a major issue when CNTs are introduced into epoxy, 23 a homogeneous dispersion is achieved by combining shear mixing and ultrasonication. The desired amount of CNTs is added to epoxy into mixing container and hand mixed for initial dispersion. The mixing container was placed in an ice bath to maintain a low temperature to avoid decomposition of the epoxy resin. 27 Then, the mixture was shear mixed using a shear mixer (IKA RW 16 basic overhead stirrer) at 600 r/min and ultrasonicated (Cole Parmer CP 750) using a pulse mode of 4 s on and 10 s off. The shear mixer provided macro dispersion of the CNTs, while the ultrasonicator provided microdispersion of the CNTs. Once the mixture was mixed for 1 h, the mixture is degassed in a vacuum chamber to remove trapped air bubbles.
Electro-flocking
Once the mixture was fully degassed, one-fourth of the mixture was poured into a separate mixing container. It was weighed, and hardener was added using the 100:45 ratio of resin to hardener by weight. This portion of the epoxy was used in the University of Massachusetts Dartmouth’s patented “wet flocking” process. 28 This process is shown in Figure 1. The CNTs embedded epoxy mix was used to coat the laminates which were taped onto a metal plate. This metal plate was placed in a flocking chamber with the laminates facing down. On the bottom plate, the carbon fibers were evenly spread through sifting. After these two plates were positioned properly, a high voltage difference (30–80 kV) was induced between the conductive plates. Due to the natural poles of the carbon fibers, they align perpendicular to the epoxy-coated laminates and rise to the laminates where they remained suspended in the epoxy. This process is completed for four of the five laminates to provide z-axis carbon fiber reinforcement between all laminates. Nearly 40% of the carbon fibers were aligned vertically on the laminates as a result. Standard vacuum infusion process 27 was employed using two layers of flax fabric and three layers of jute fabric stacked as shown in Figure 2. The remaining CNTs embedded epoxy mix was infused into the mold. The mold was left for 24 h to cure at room temperature.
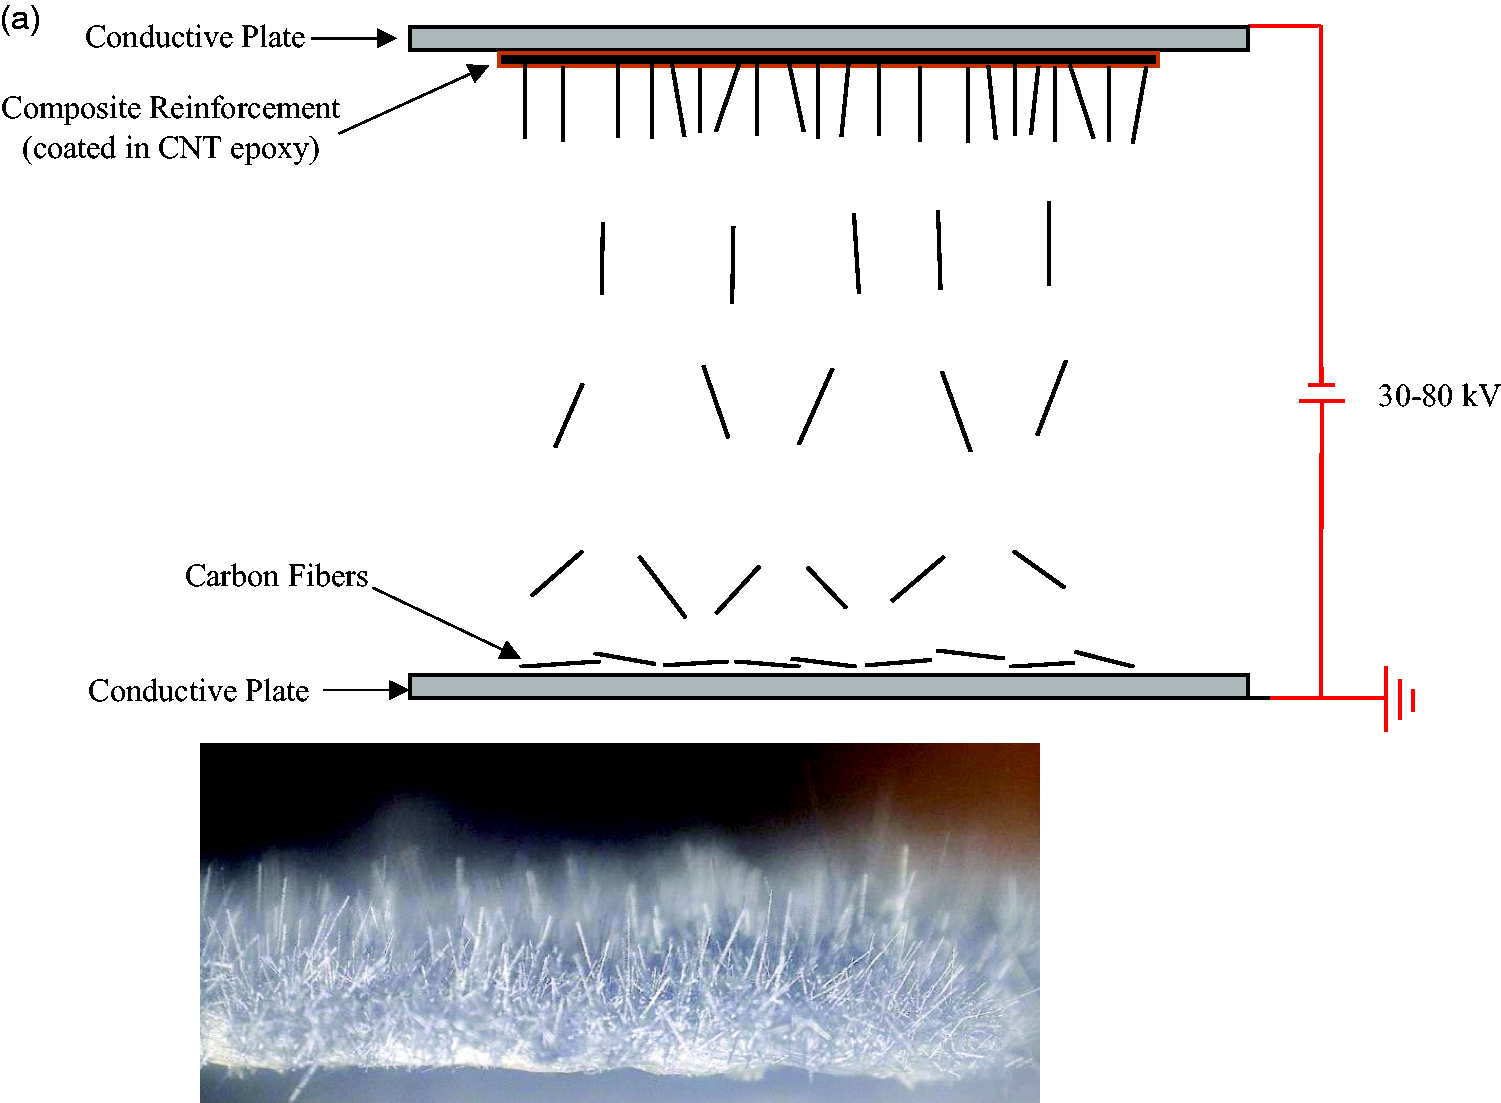
(a) The schematic representing the electro-flocking process and (b) an optical photograph of flocked linen fabric with 350 µm carbon fibers with a density of 1000 fibers/mm2.
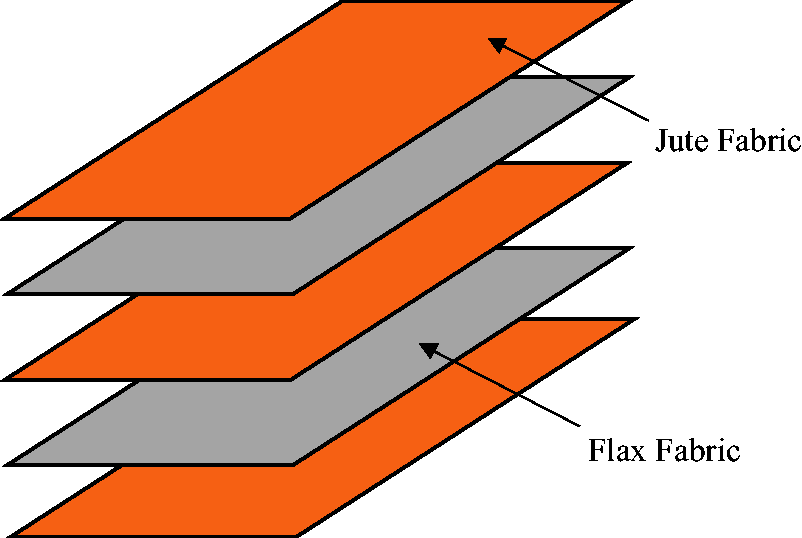
The stacking sequence of the hybrid composites.
Specimen details
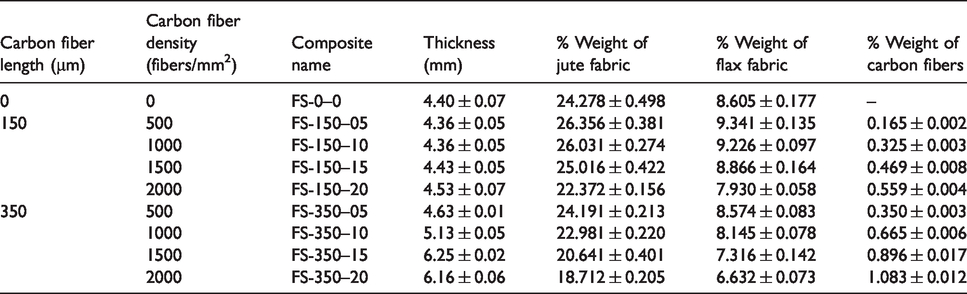
Before being cut, the fabricated composite was sanded until it was smooth. Each fabricated composite was cut into dimensions specified by the ASTM D790-17 test method for materials 1.6 mm or greater in thickness. Specimens had a width of 12.7 mm, a length of 139.7 mm, and varying thicknesses dependent on the carbon fiber reinforcement. Deflection of specimens is measured using crosshead motion of the loading device. A schematic of the specimen is shown in Figure 3. Additionally, a four-circumferential probe system is employed to provide electrical measurements of the specimens. SPI-Paint 05001-AB silver paint is used to paint four circumferential rings around the specimen. The inner two rings are 38.1 mm apart, and the outer rings are each 6.35 mm away from their respective inner ring. A minimum of 10 samples were tested for each case to have statistical significance. The experimental parameters and their values, as well as the weight fractions of the fabrics and carbon fibers are shown in Table 1. With the given error bars, the thickness variation among FS-150–05, FS-150–10, and FS-0–0 is very minimal. For all other cases, the thickness values indeed vary with the addition of short carbon fibers.
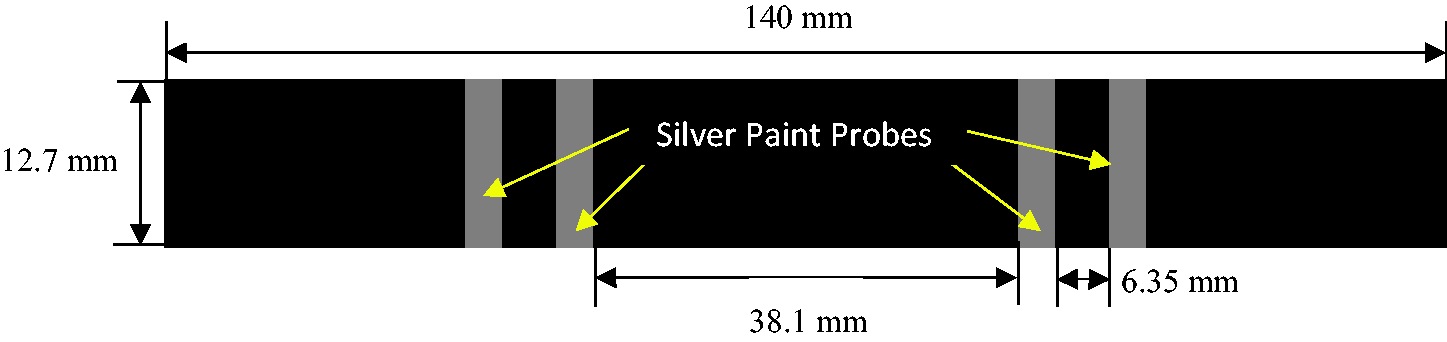
The schematic and dimensions of the specimen for flexural loading.
The experimental parameters, composite names, thickness values, and weight percentages of each composite constituent.
Testing conditions and electrical measurement system
A support span of 16 ± 1 times the depth of the specimen is used for flexural testing as recommended by the ASTM D790-17 test method. The flexural loading is employed by an Instron® universal testing machine with a load cell capacity of 50 kN. As per the standard, the displacement rate varies with the test specimen thickness and the corresponding span of the loading fixture. It varies from 2.0 mm/min to 2.5 mm/min. Real-time tests are captured using a MicroCapture® Pro digital microscope. Bluehill® software for the Instron testing machine is used to capture the load and displacement data. Flexural stress is calculated using the following equation provided by the standard

The four circumferential probe system was used to measure specimen electrical resistance under load. Figure 4 shows a schematic of the system. The outer ring probes were used to supply a constant current source through the specimen. This DC current was supplied by a Keithley 6620 current source. The inner ring probes were used to measure the voltage across the zone of interest (in the center where damage occurs) in the composite. Electrometers were used from a Keithley 6514 and connect to each probe for two voltage measurements. A Keithley 2000 multimeter was used to measure the difference voltage between the electrometer measurements. LabVIEW was used to record and capture the voltage data. Before testing the samples, insulating tape was applied to the loading noses to ensure no current leakage into the loading fixture. The initial resistance of composites was calculated using Ohm’s law.
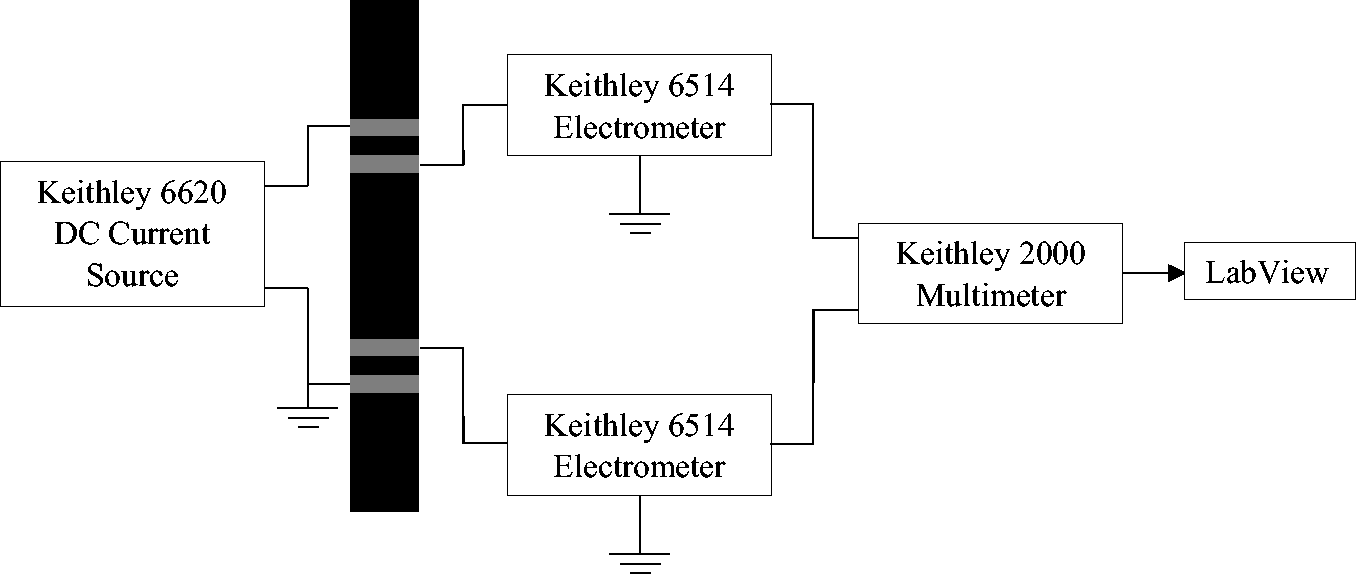
The configuration of the four circumferential probe measurement system.
Using the initial resistance of the composite and its resistance detected while loading, the percent change in resistance was calculated using the following formula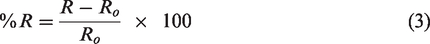
Results and discussion
Flexural force–displacement diagrams
The characteristic force–displacement curve for each composite parameter under flexural loading is presented in Figure 5. Upon reaching the peak load for all composite types, the load dropped instantaneously because the test specimens were failed or broken into two pieces. The initial slope of force displacement diagrams of all composite types was similar to that of FS-0–0 (without carbon fibers). For the FS-150-XX series, only FS-150–20 resulted in a higher slope value for most of the force–displacement curve compared FS-0–0. As for the FS-350-XX series, every composite type resulted in higher slope values than FS-0–0. The shorter carbon fibers were not as effective at stiffening the composites as the longer carbon fibers were. The maximum carbon fiber density, 2000 fibers/mm2, is required to increase stiffness of the composite for the 150 µm carbon fiber reinforcement. This is because the shorter carbon fibers do not take up as much space as the 350 µm carbon fibers, requiring a higher carbon fiber density to obtain the same results as the FS-350-XX composites. The longer fibers take up more space and require more epoxy in the composites, resulting in thicker composites as seen in Table 1. The increase of thickness plays a major role of increasing the stiffness. 23 Every composite type aside from FS-350–05 resulted in an increase in displacement at break in comparison with FS-0–0. This is because the addition of carbon fibers effectively blocks crack growth in the composite and deflects the damage to allow for greater displacements before break. FS-350–05 has a reduction in deflection compared to FS-0–0 because carbon fiber is more brittle than epoxy, and the carbon fibers introduce more epoxy to the composite. The addition of fibers at this density does not provide enough blockage of crack growth to mitigate this effect. For larger fiber densities, the blockage of crack growth is more prevalent, which dominates the brittle effects of adding the fibers, allowing for greater deflections to be reached despite the composite being more brittle.
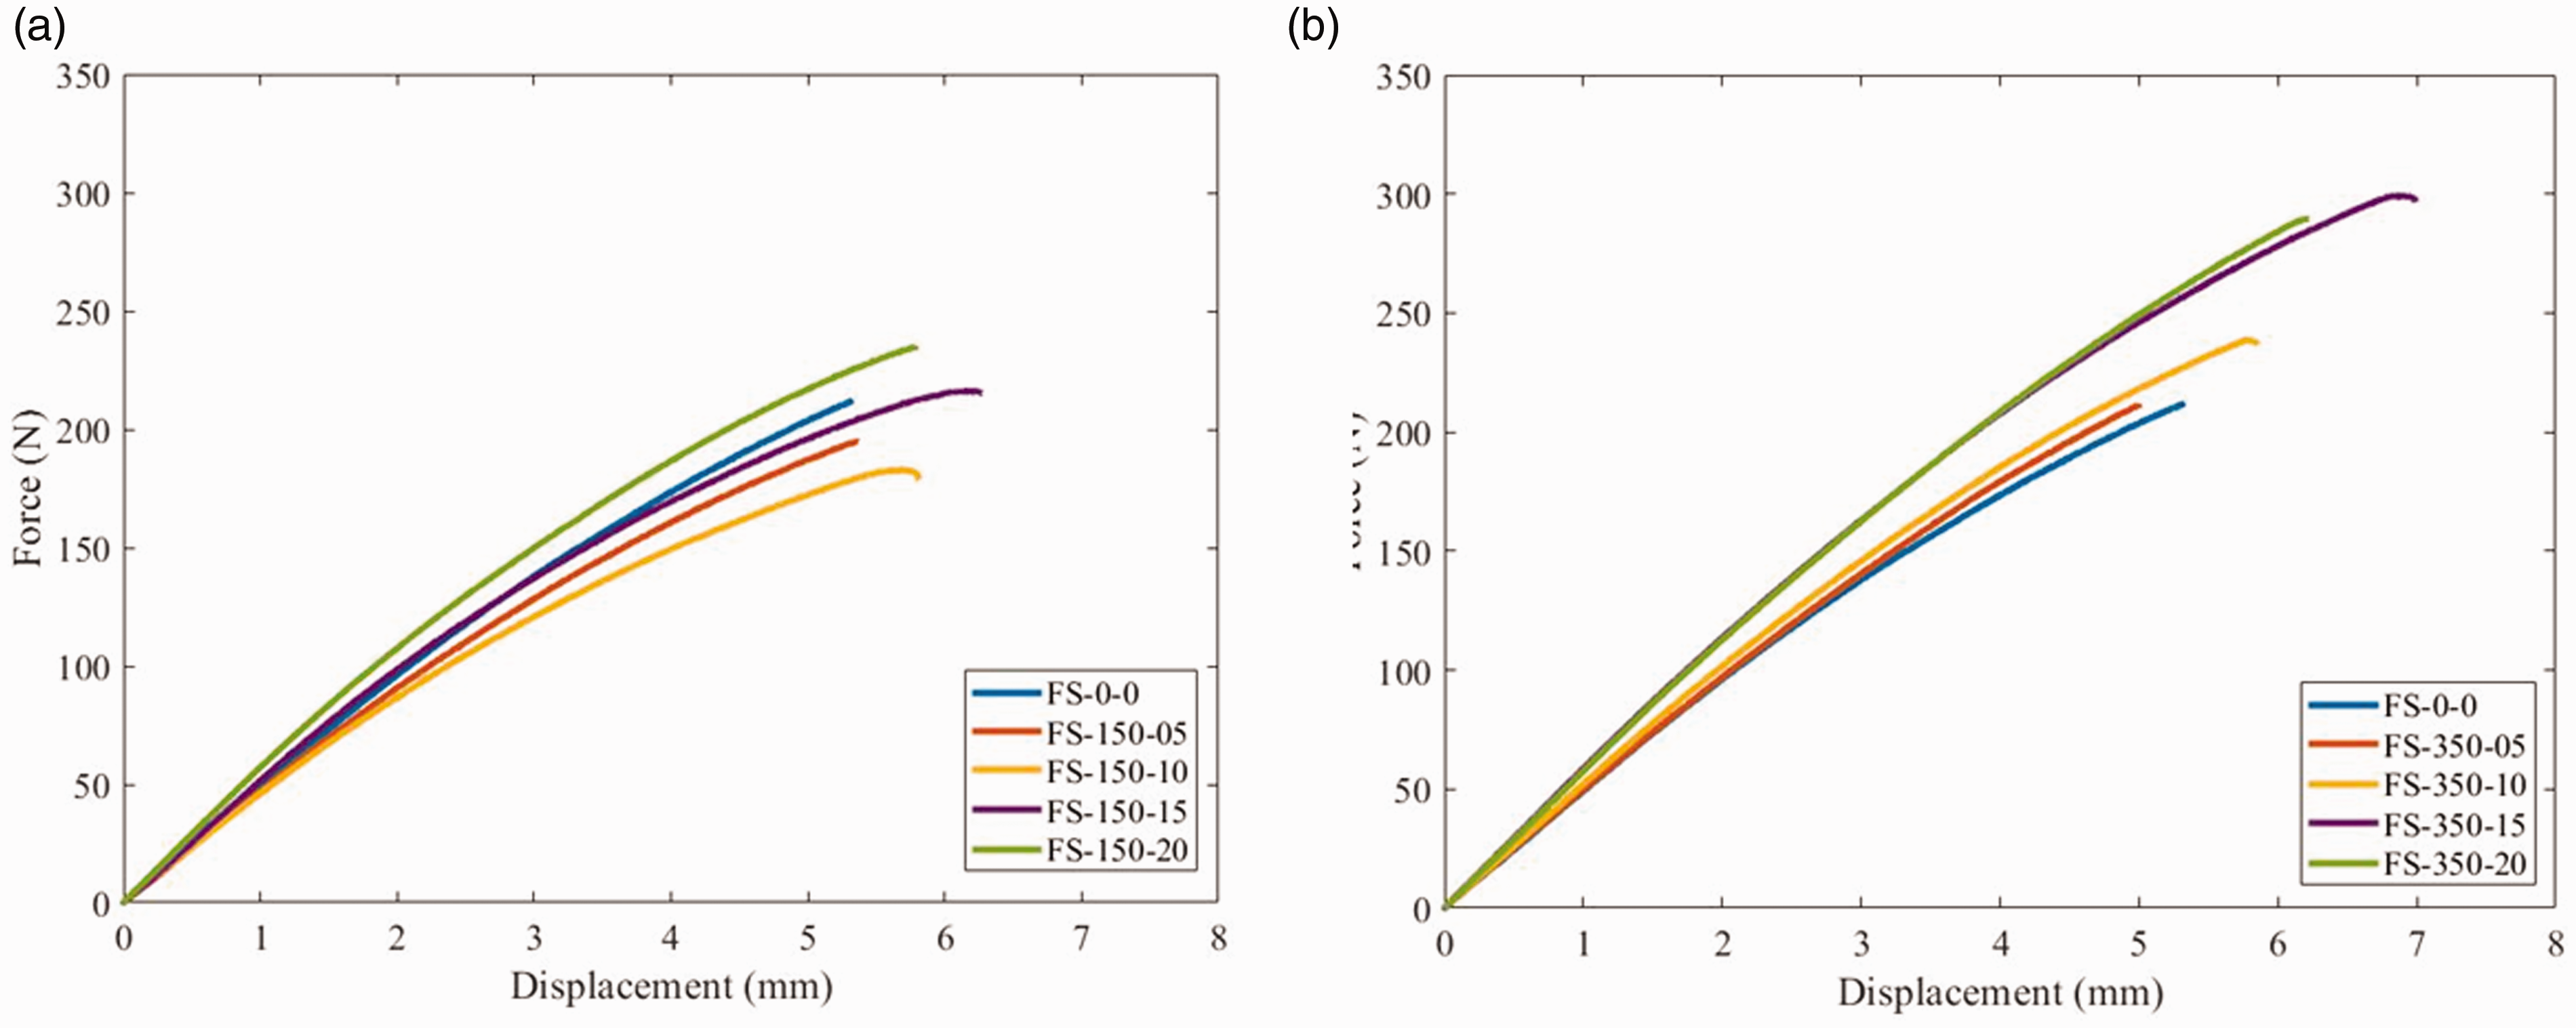
The characteristic force–displacement curves for: (a) FS-150-XX series and (b) FS-350-XX series.
Flexural strength
The flexural strength values for all composite types are shown in Figure 6. The addition of carbon fibers as z-axis reinforcement increased the flexural strength of the composites slightly compared to the composite without reinforcement in two cases, for FS-150–20 and FS-350–15. This occurred because the carbon fibers in these composites effectively blocked crack growth within the composite. However, for the rest of the cases, the addition of carbon fibers did not increase the flexural strength. This is a result of the addition of carbon fibers creating local stress concentrations within the matrix of the composite. 29 The carbon fibers did not bond well to the epoxy, and they delaminated quickly. This weakened the composite because the carbon fibers de-bonded at much lower force than the fibers or resin failing. These microcracks grew and caused the composite to fail. 29 Additionally, increasing the carbon fiber density increased the amount of epoxy between laminates. This increased the weight fraction of epoxy in the composite for increasing carbon fiber density and decreases the percent weight of laminate fibers within the composite. This also contributed to the composites having reduced flexural strength.
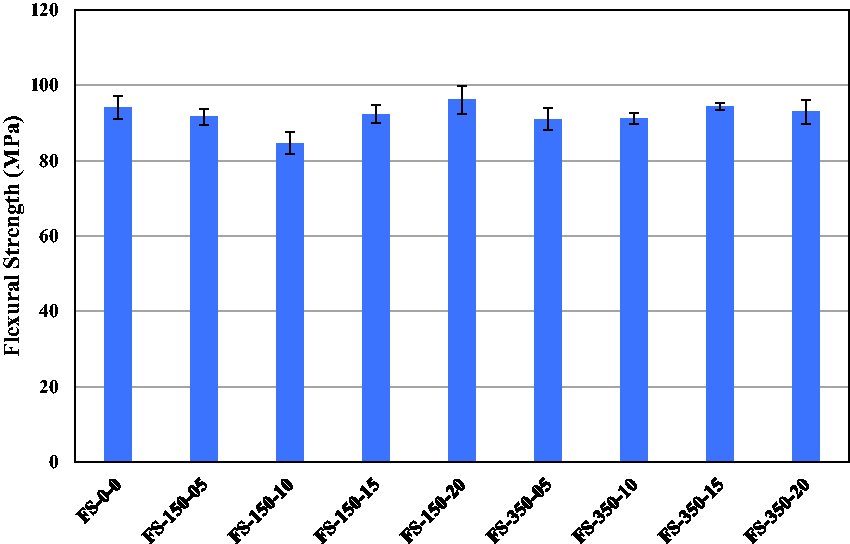
The flexural strength of composites.
What determines whether a specific composite has increased flexural strength compared to FS-0–0 depended on whether the carbon fibers blocked crack growth more effectively than the added fibers weakened the composite by creating additional weak bonding interfaces. When the fiber density increased, there are more stress concentrations and zones of weak bonding within the composite, but the additional fibers increased the blocking of crack growth within the composite. In the FS-150-XX series, the additional carbon fibers did not block crack growth well until FS-150–20. This resulted in a decreased flexural strength for these composites because the shorter 150 µm fibers did not block crack growth well, which required a large amount of them to increase flexural strength. FS-150–10 has the lowest flexural strength since the addition of fibers created more zones of weak bonding interface and the added fibers did not block the crack growth well enough to mitigate this effect. However, FS-150–05 has less fibers that resulted in less zones of weak bonding, and FS-150–15 has many more fibers than FS-150–10 to block the crack growth well. The FS-350-XX series resulted in similar flexural strength values for all composites. This is because the 350 µm carbon fiber is more effective at blocking crack growth due to its increased length. It can better penetrate laminates, and its increased length covers a larger area to block crack growth. Since the additional stress concentrations weakened the composite almost as much as the fibers increased the blocking of crack growth, only a slight increase in flexural strength results, until the fiber density of 2000 fibers/mm2. At this density, there are so many fibers that the stress concentrations are overwhelming within the composite and the additional fibers from 1500 to 2000 fibers/mm2 were not as effective at blocking crack growth, which results in a minor decrease in flexural strength. Additionally, the linen fabric is not as easily penetrable as the jute fabric because the linen fabric is woven together tighter than the jute fabric, shown in Figure 7. This caused the fibers to bunch together in “clumps” in-between laminates and create large zones of weak bonding and stress concentrations. With increased density, there are higher number of clumps in-between laminates and the size of the clumps increased. This greatly reduced the strength of the composite. The decreased penetration of the linen fabric also leads to decreased mechanical interlocking, which decreases normal flexural strength.
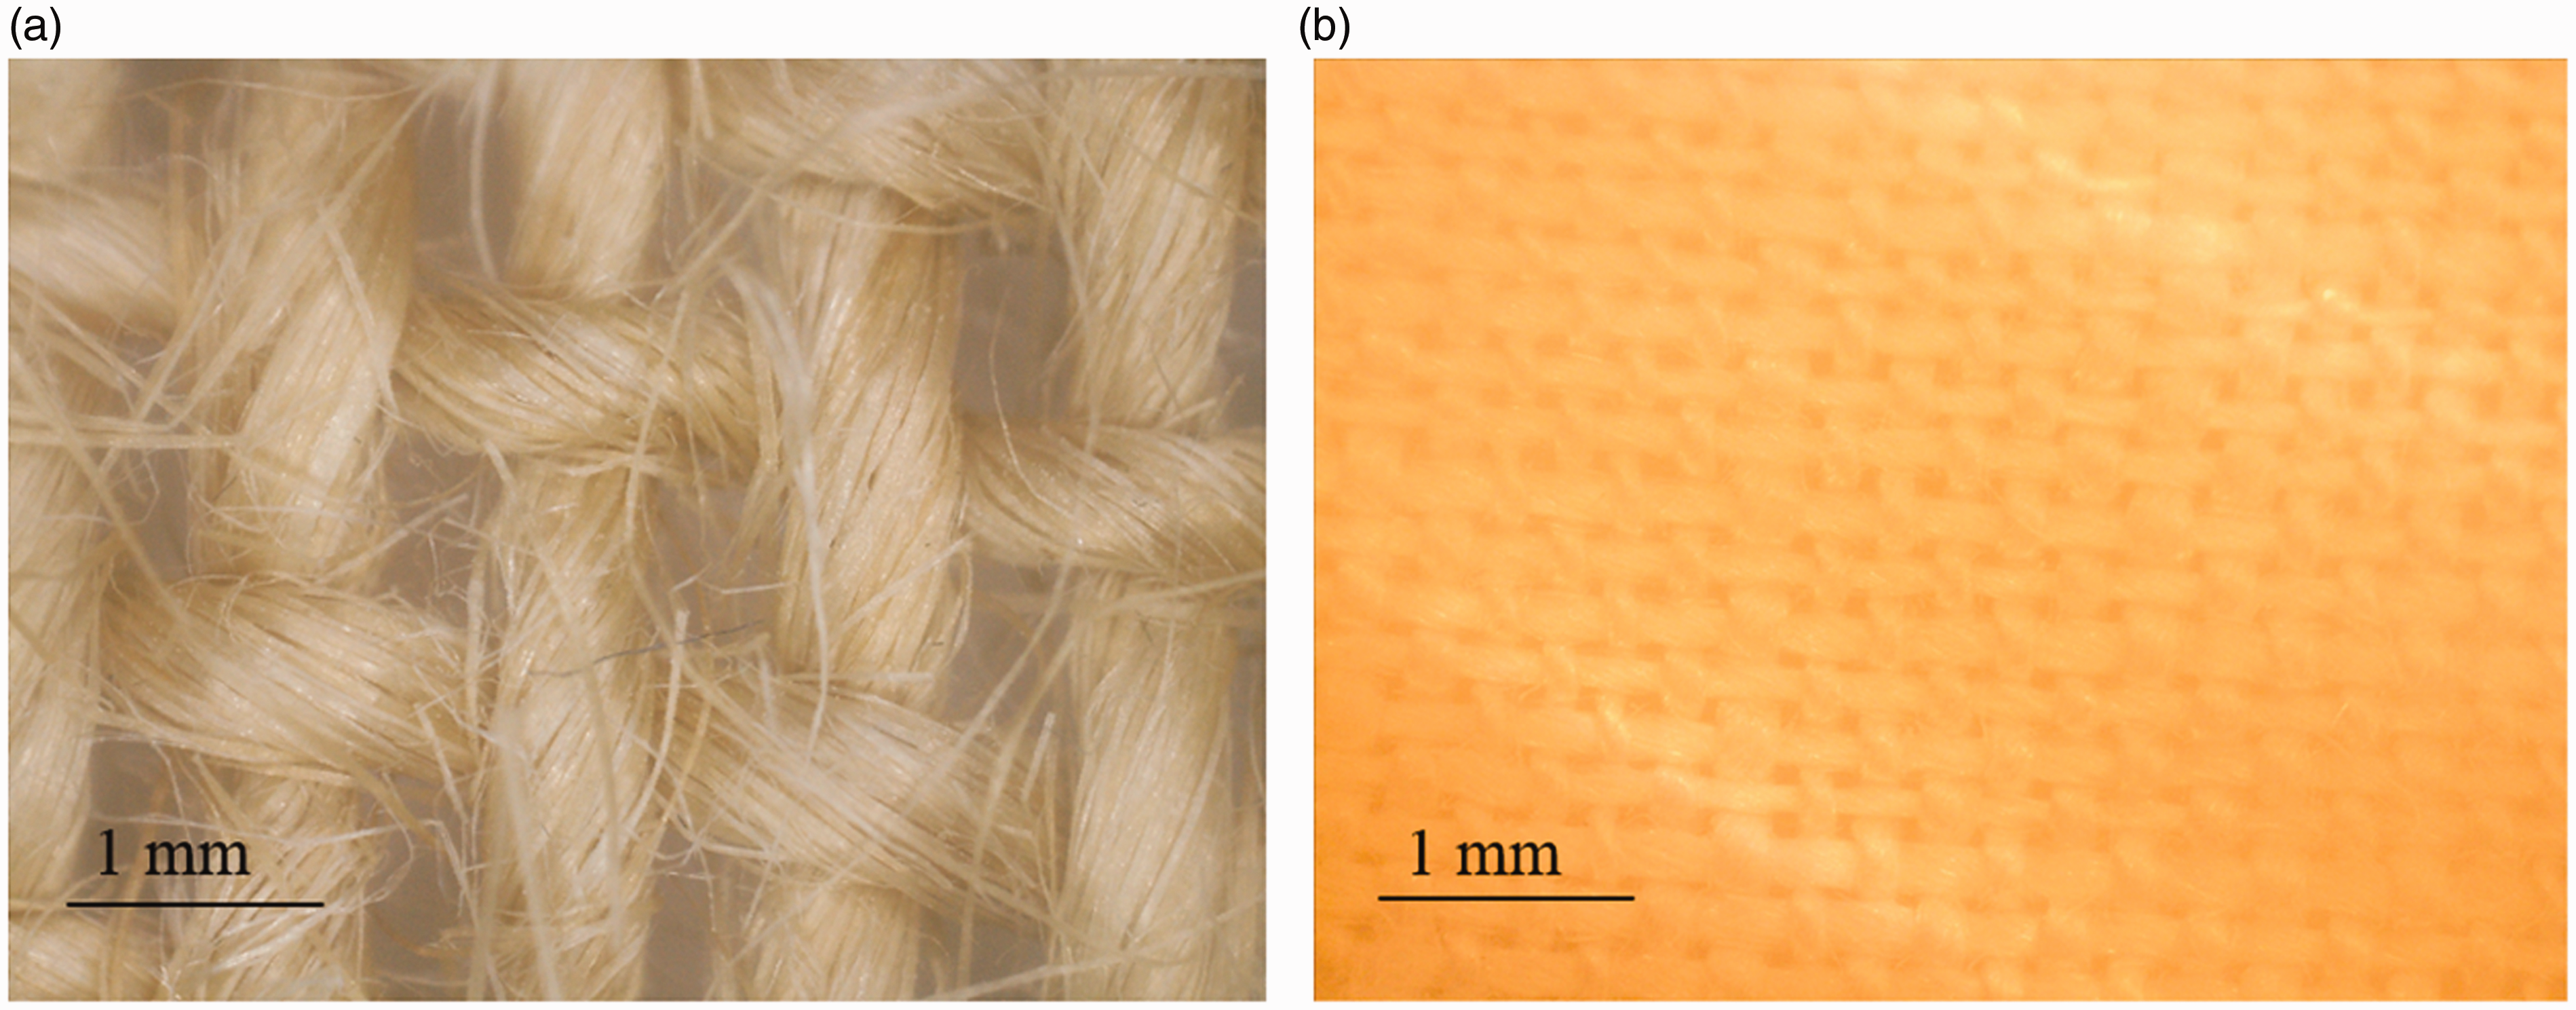
The fabric structure of: (a) jute and (b) flax.
Figure 8(a) and (b) shows scanning electron microscope (SEM) images for FS-150–1000 and FS-350–1000, respectively. The effects of the varying carbon fiber lengths at the same carbon fiber density can be observed. The carbon fibers in FS-350–1000 were more apparent due to their increased length that covered a larger area than the shorter carbon fibers. This resulted in carbon fibers being closer to each other, which created more electrical connections. This also increased the effectiveness of blocking crack growth from the increase in fiber bridging. The carbon fibers in FS-150–1000 were not as successful in penetrating the laminates and epoxy, but fiber pull outs were present in each case. When the fibers were pulled out or broken, it required more energy to cause the composite to fail. This effect increased the strength of the composite, but only slightly in both cases. To depict the effects of increasing carbon fiber density, Figure 9(a) and (b) shows SEM images of FS-350–500 and FS-350–2000, respectively. FS-350–500 had less carbon fibers present than FS-350–2000 as expected. The lower carbon fiber density resulted in less area being covered by the fibers, which explains why it was less effective at blocking crack growth. In FS-350–2000, there were so many fibers that some fiber clumps were observed where many carbon fibers were bunched together in one area. This helped to create many more electrical connections in composites with higher carbon fiber densities, while also creating larger stress concentrations due to weak bonding zones.
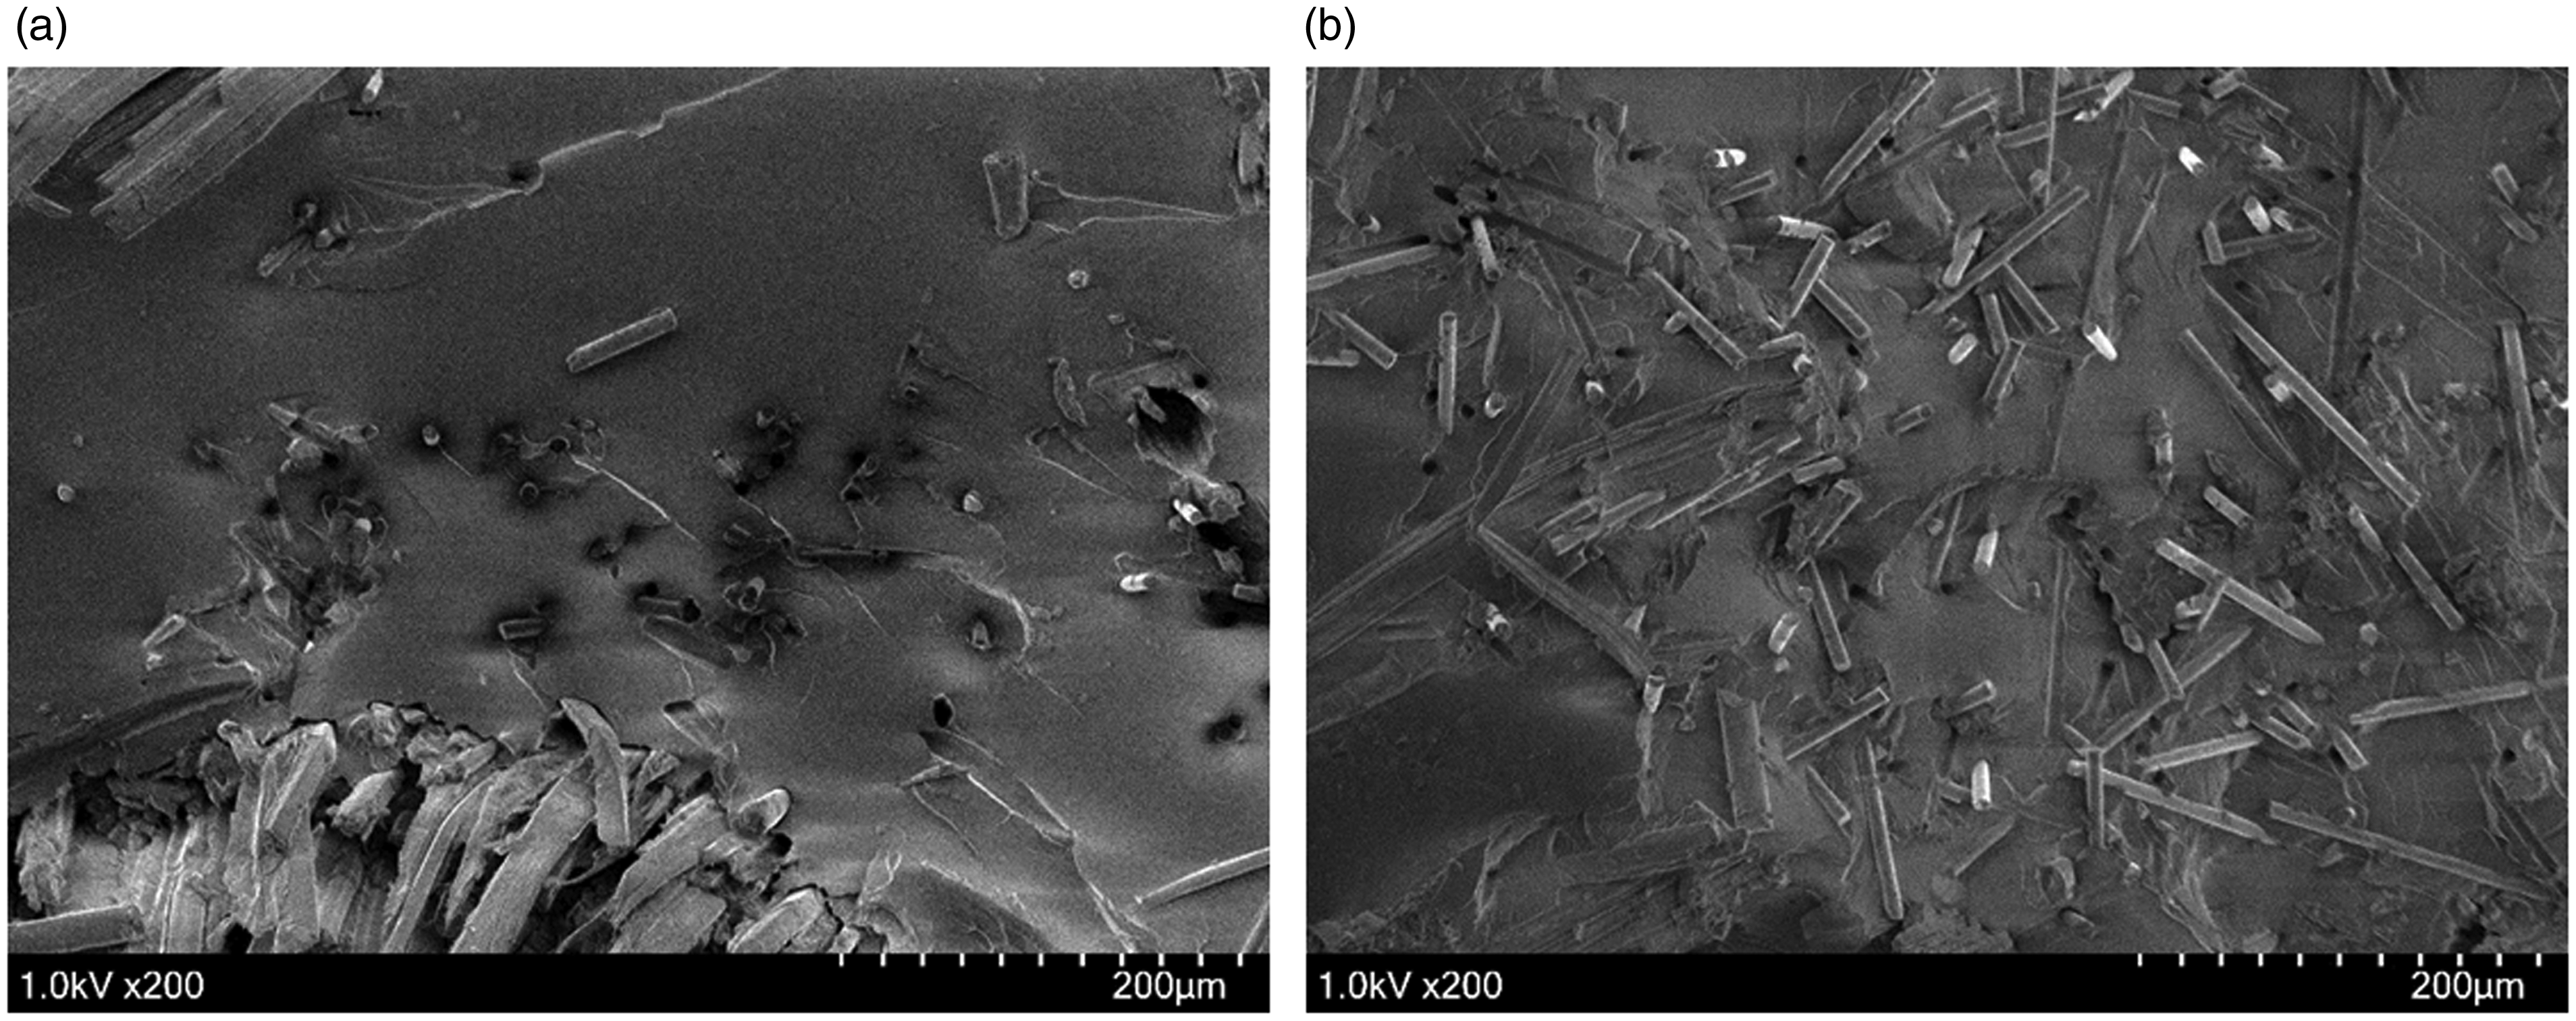
Scanning electron microscope image of: (a) FS-150–1000 and (b) FS-350–1000.
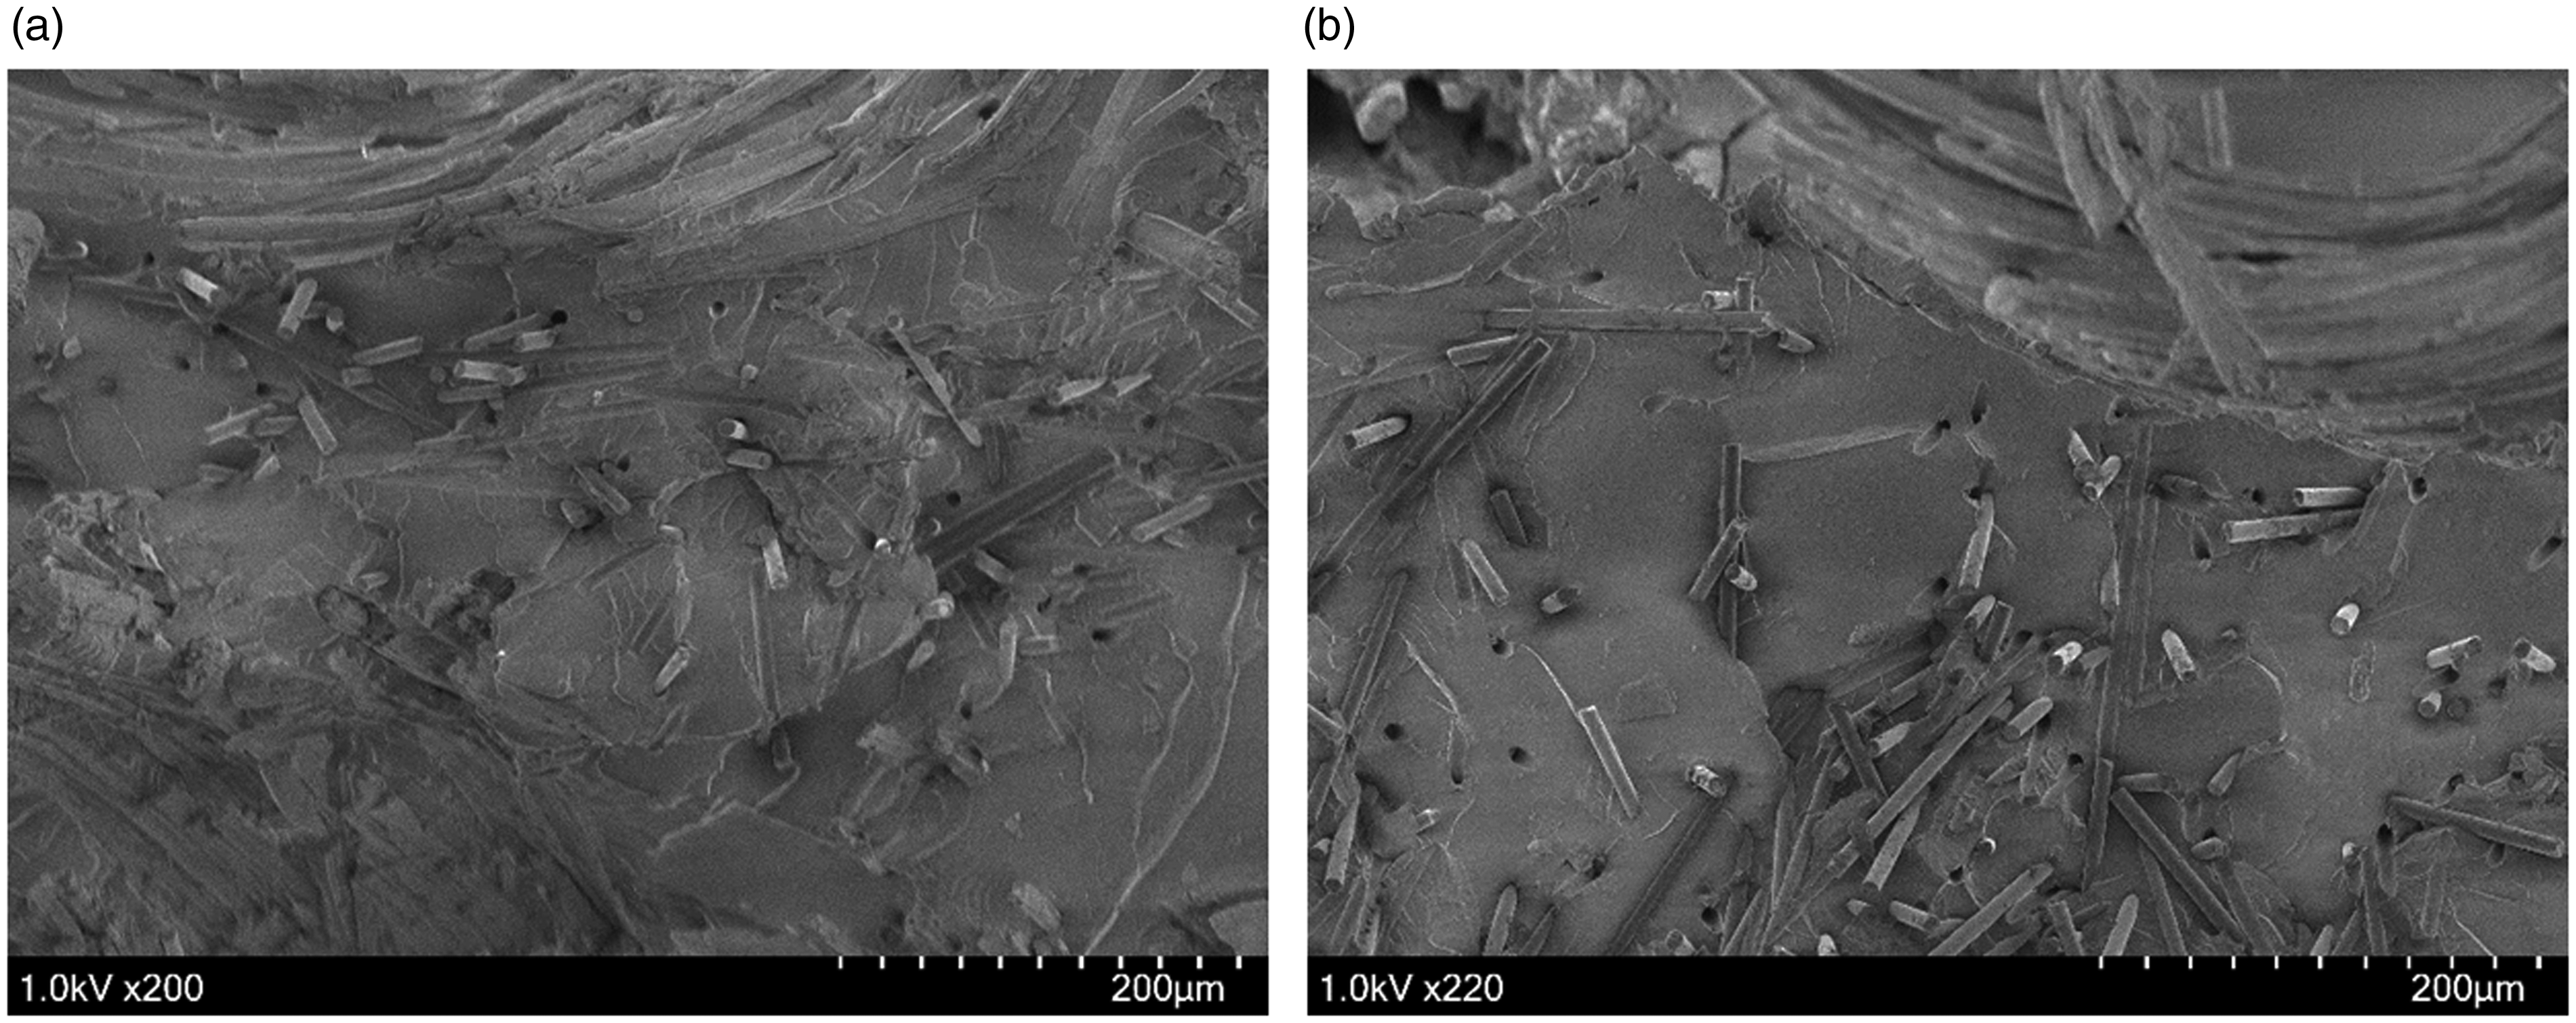
Scanning electron microscope image of: (a) FS-350–500 and (b) FS-350–2000.
Displacement and flexural strain at break
Each composite type experienced a different displacement at break and flexural strain at break as shown in Figure 10(a) and (b), respectively. FS-350–05 resulted in the smallest deflection at break of 5.15 mm and FS-350–15 resulted in the largest of 6.84 mm. Within each series of FS-150-XX and FS-350-XX, the deflection at break increased with increasing carbon fiber density until the maximum of 2000 fibers/mm2. Carbon fiber reinforcement increased the deflection at break for all cases aside from FS-350–05. FS-350–20 resulted in the smallest flexural strain at break of 2.47% and FS-150–15 resulted in the largest of 3.04%. The FS-150-XX series produced an increase in flexural strain at break compared to FS-0–0, and the strain increased with increasing carbon fiber density until FS-150–20. These results occurred because the reinforced carbon fibers effectively bridged crack growth in the specimen and prevented crack propagation. 23 Thus, the carbon fibers effectively blocked the damage from cracks and allowed the specimen to deflect more before the cracks damage the specimen enough to cause it to fail. With increasing carbon fiber density, more fibers are present to bridge cracks and delay further damage. At 2000 fibers/mm2, the bunches of fibers became too large as previously mentioned and created large stress concentrations. These stress concentrations weakened the composite greater than the fibers effectively bridged the crack growth, which caused the cracks to grow larger and damage the composite to failure at lower deflections and thus, strains. The FS-350-XX series resulted in lower strains at break than both FS-0–0 and the FS-150-XX series. This is due to the increased thickness of the specimen when adding the longer carbon fiber reinforcement. As per ASTM D790-17 test method, the increased thickness of the specimens required greater support spans, specifically 16 times the thickness of specimens. The composites with 350 µm carbon fibers have lower flexural strain values because they have higher thickness compared to those with 150 µm carbon fibers (as shown in Table 1). The decrease is significant because the span length is squared in the denominator of equation (2), which causes even small increases to the span to have a large effect on the flexural strain. Although the FS-350-XX series resulted in larger displacements than the FS-150-XX series, the larger support span contributed more to reducing the flexural strain at break to be lower than the FS-150-XX series.
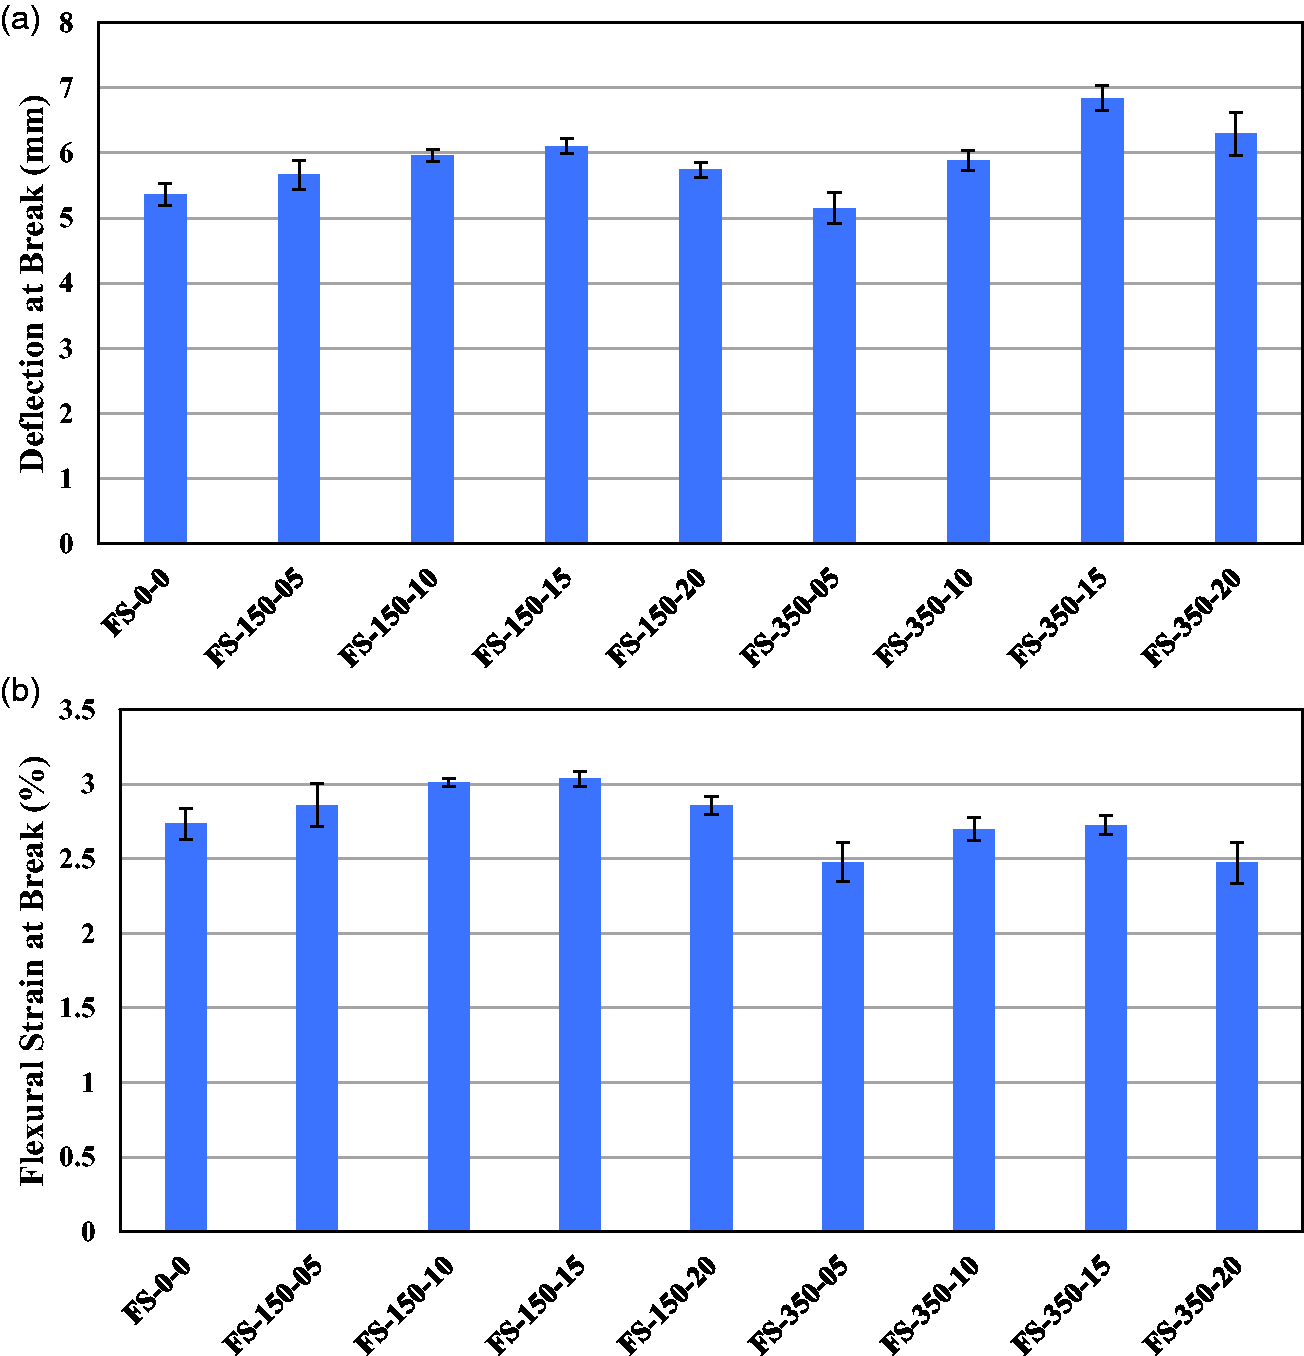
(a) The deflection at break for each composite type and (b) the flexural strain at break for each composite type.
Electrical response under flexural loading
From the flexural tests, the load–displacement and the change in resistance curves are graphed on the same plots to demonstrate the relationship between them. Each configuration had a minimum of five samples plotted to demonstrate consistency among the tests. The following sections detail the initial resistance of the composites and the effect of carbon fiber length on electro-flexure response.
Initial resistance of composite series
The initial resistance of each composite type is plotted in Figure 11. The specimen with the highest resistance was the composite with no carbon fiber reinforcement (FS-0–0). The series with 150 µm carbon fiber reinforcement decreased in initial resistance with increasing carbon fiber density. The FS-150–05 had an initial resistance that is about 320 times lower than FS-0–0. This is because the addition of carbon fiber reinforcement created a better electrical network within the composite. The carbon fibers interacted with surrounding CNTs to create electrical connections. FS-150–10 had an initial resistance that was around 47,000 times lower than FS-150–05. More fibers mean more electrical connections among carbon fibers and with CNTs, which resulted in a better electrical network with increasing carbon fiber density. This effect also resulted in a decreased resistance for FS-150–15 and FS-150–20. The FS-350-XX series had substantially lower initial resistance values than the FS-150-XX series. FS-350–10 had an initial resistance that is about 110 times lower than FS-150–10. This is because the longer carbon fiber can penetrate the laminates more successfully, creating an increasing number of electrical connections with CNTs in the resin within the laminates, and with other carbon fibers in neighboring zones in-between laminates. 30
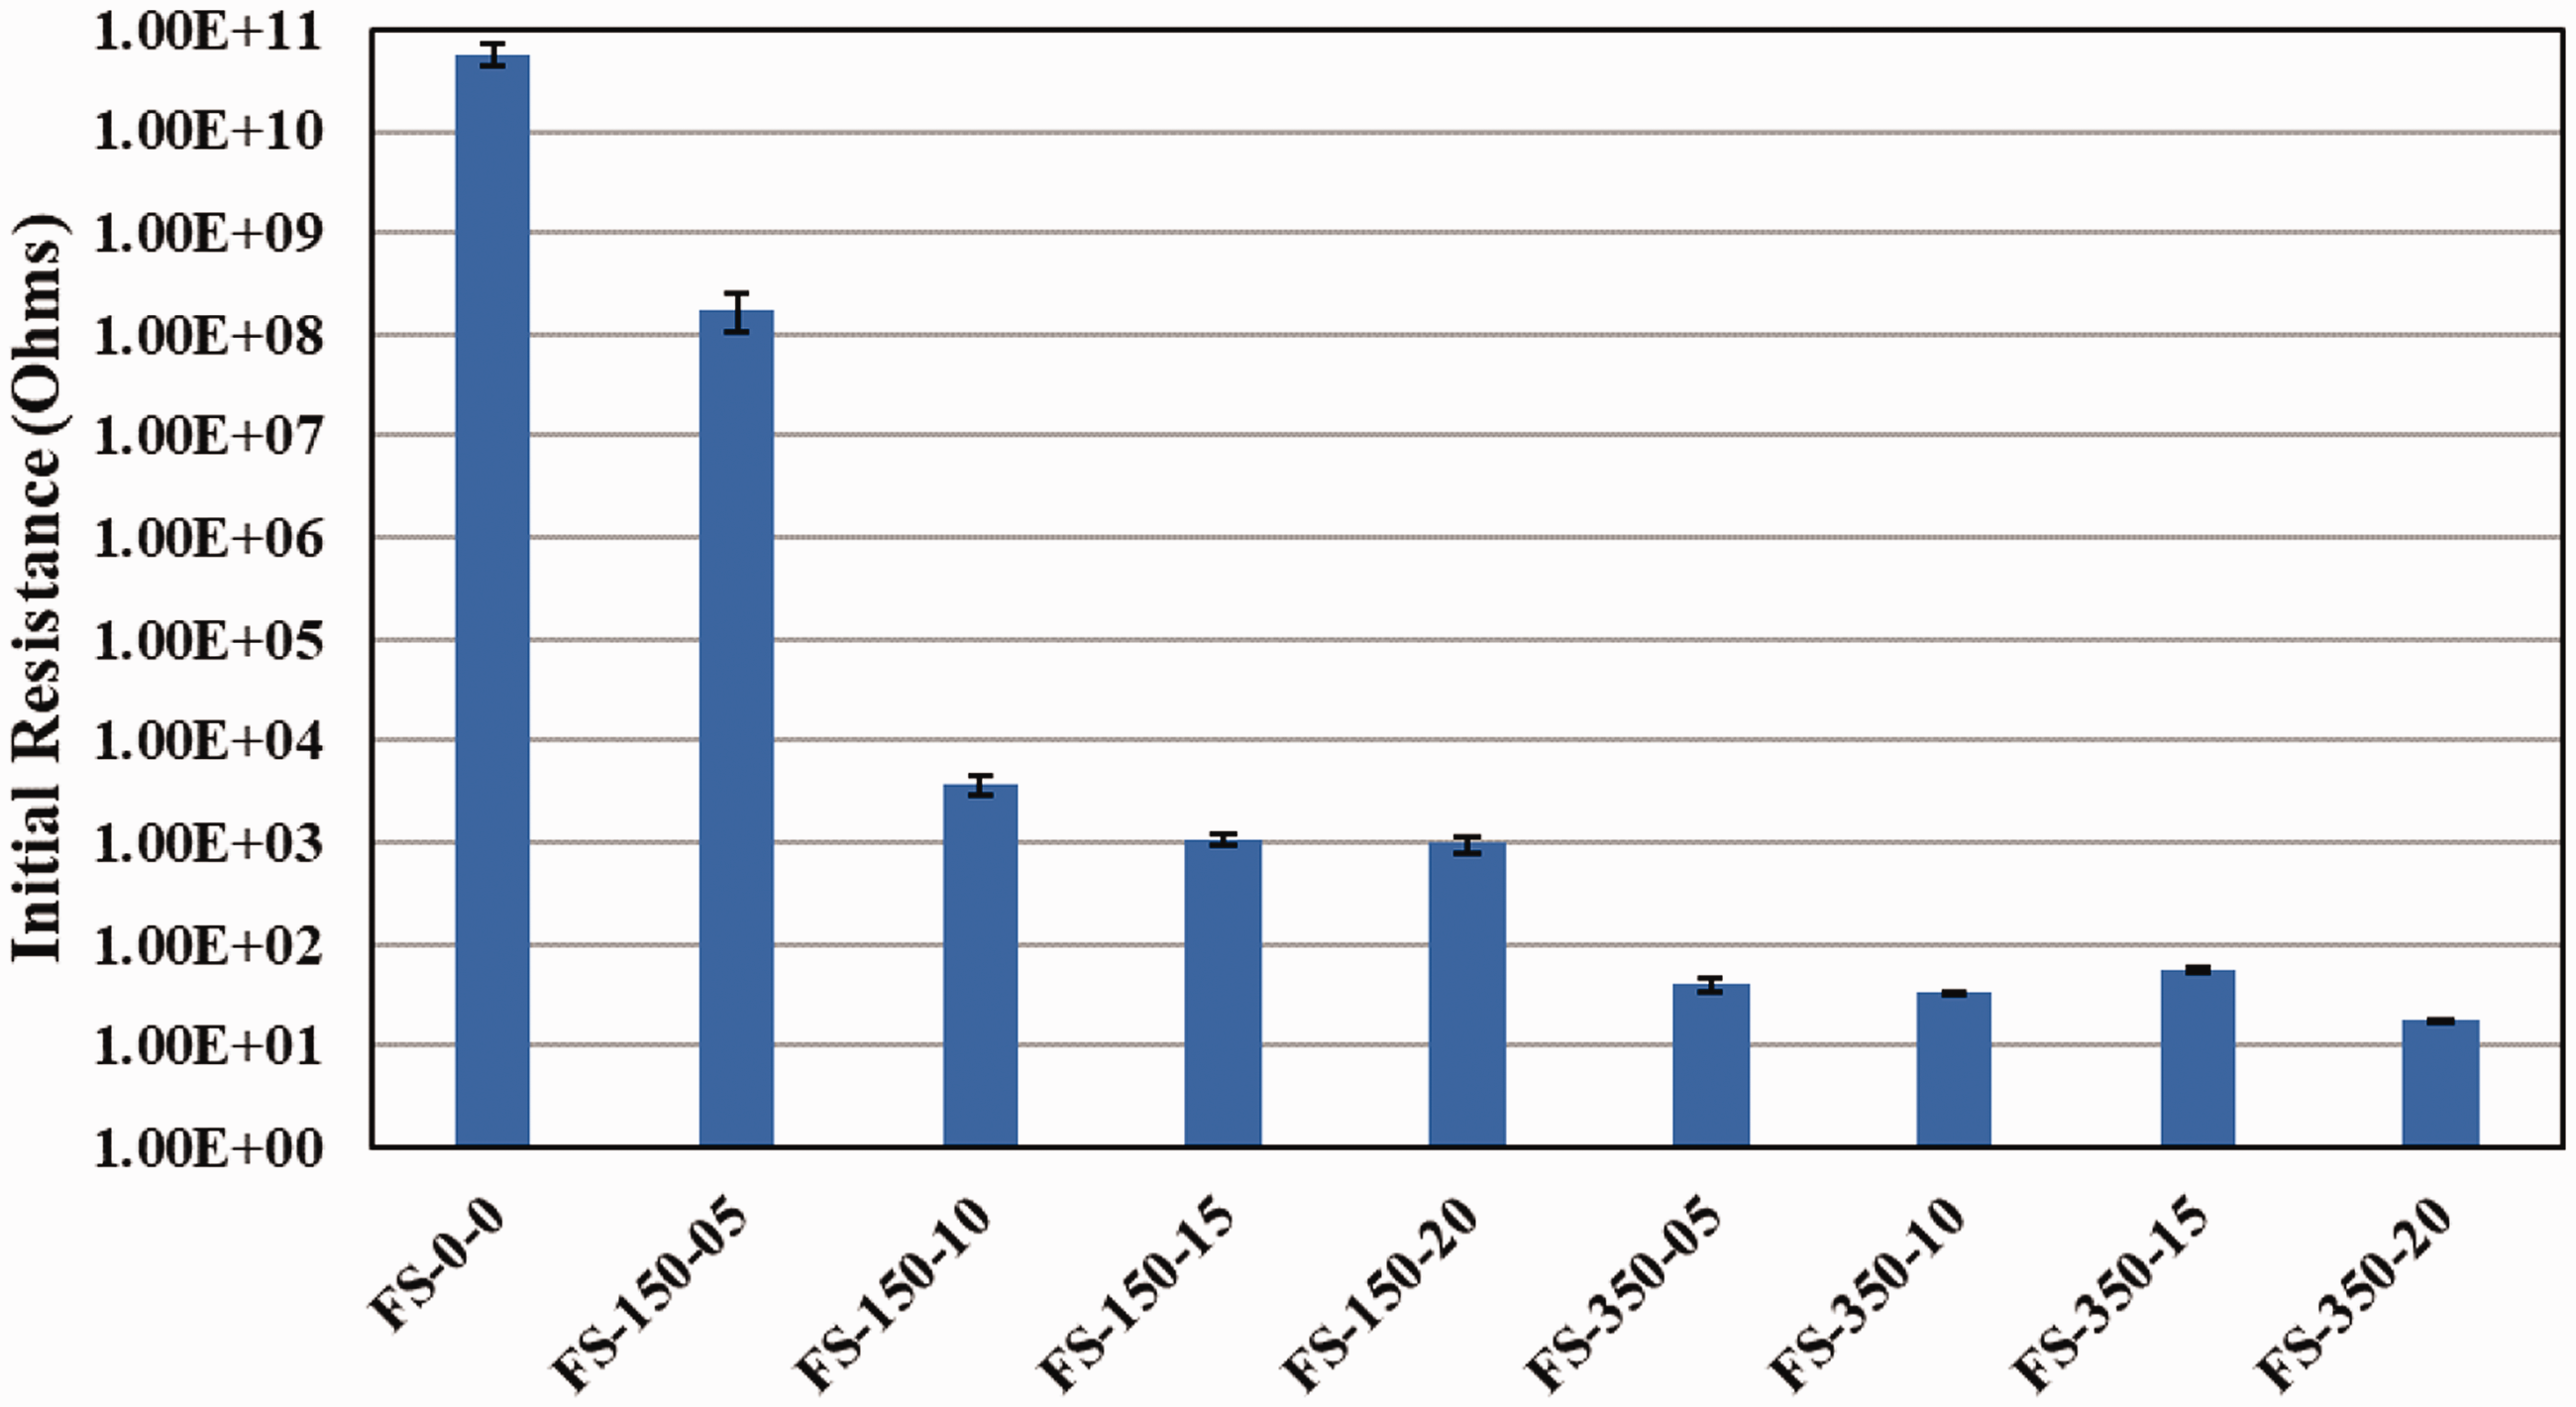
The initial resistance of all composite specimen types.
Electrical response of FS-150-XX series
The electro-mechanical response of the composites in FS-150-XX is shown in Figure 12. Two zones are labeled for each composite type to detail the modes of changes in resistance. Zone-1 is represented by the onset of changing electrical network within the composites. The resistance in this zone increased with a steadily increasing slope. As a result of the bending, the tension below the neutral surface separated CNTs from carbon fibers and from each other, which removed electrical connections between them. In the compression zone above the neutral surface, the CNTs and carbon fibers moved closer, creating more electrical connections above the neutral surface. The connections below the neutral surface were being removed faster than those being created above it. This resulted in a net positive change in resistance. This continued until the end of zone-1, when microcracks began forming due to the carbon fibers creating stress concentrations and debonding from the resin. 31 This is when zone-2 begins, which resulted in a mostly linear increase in resistance. The microcracks contributed to the removal of electrical connections among carbon fibers and CNTs by cracking the matrix between them. This became the dominant form of resistance change, which caused the change in resistance to be large and steady. The removal of connections continued until a large crack propagated in the outer jute layer of the composite. Due to the addition of carbon fibers and the low density of the jute fabric, there was a large fraction of epoxy in the composite which caused the composite to be brittle. As soon as the crack propagated in the outer layer of jute, it quickly broke the composite.
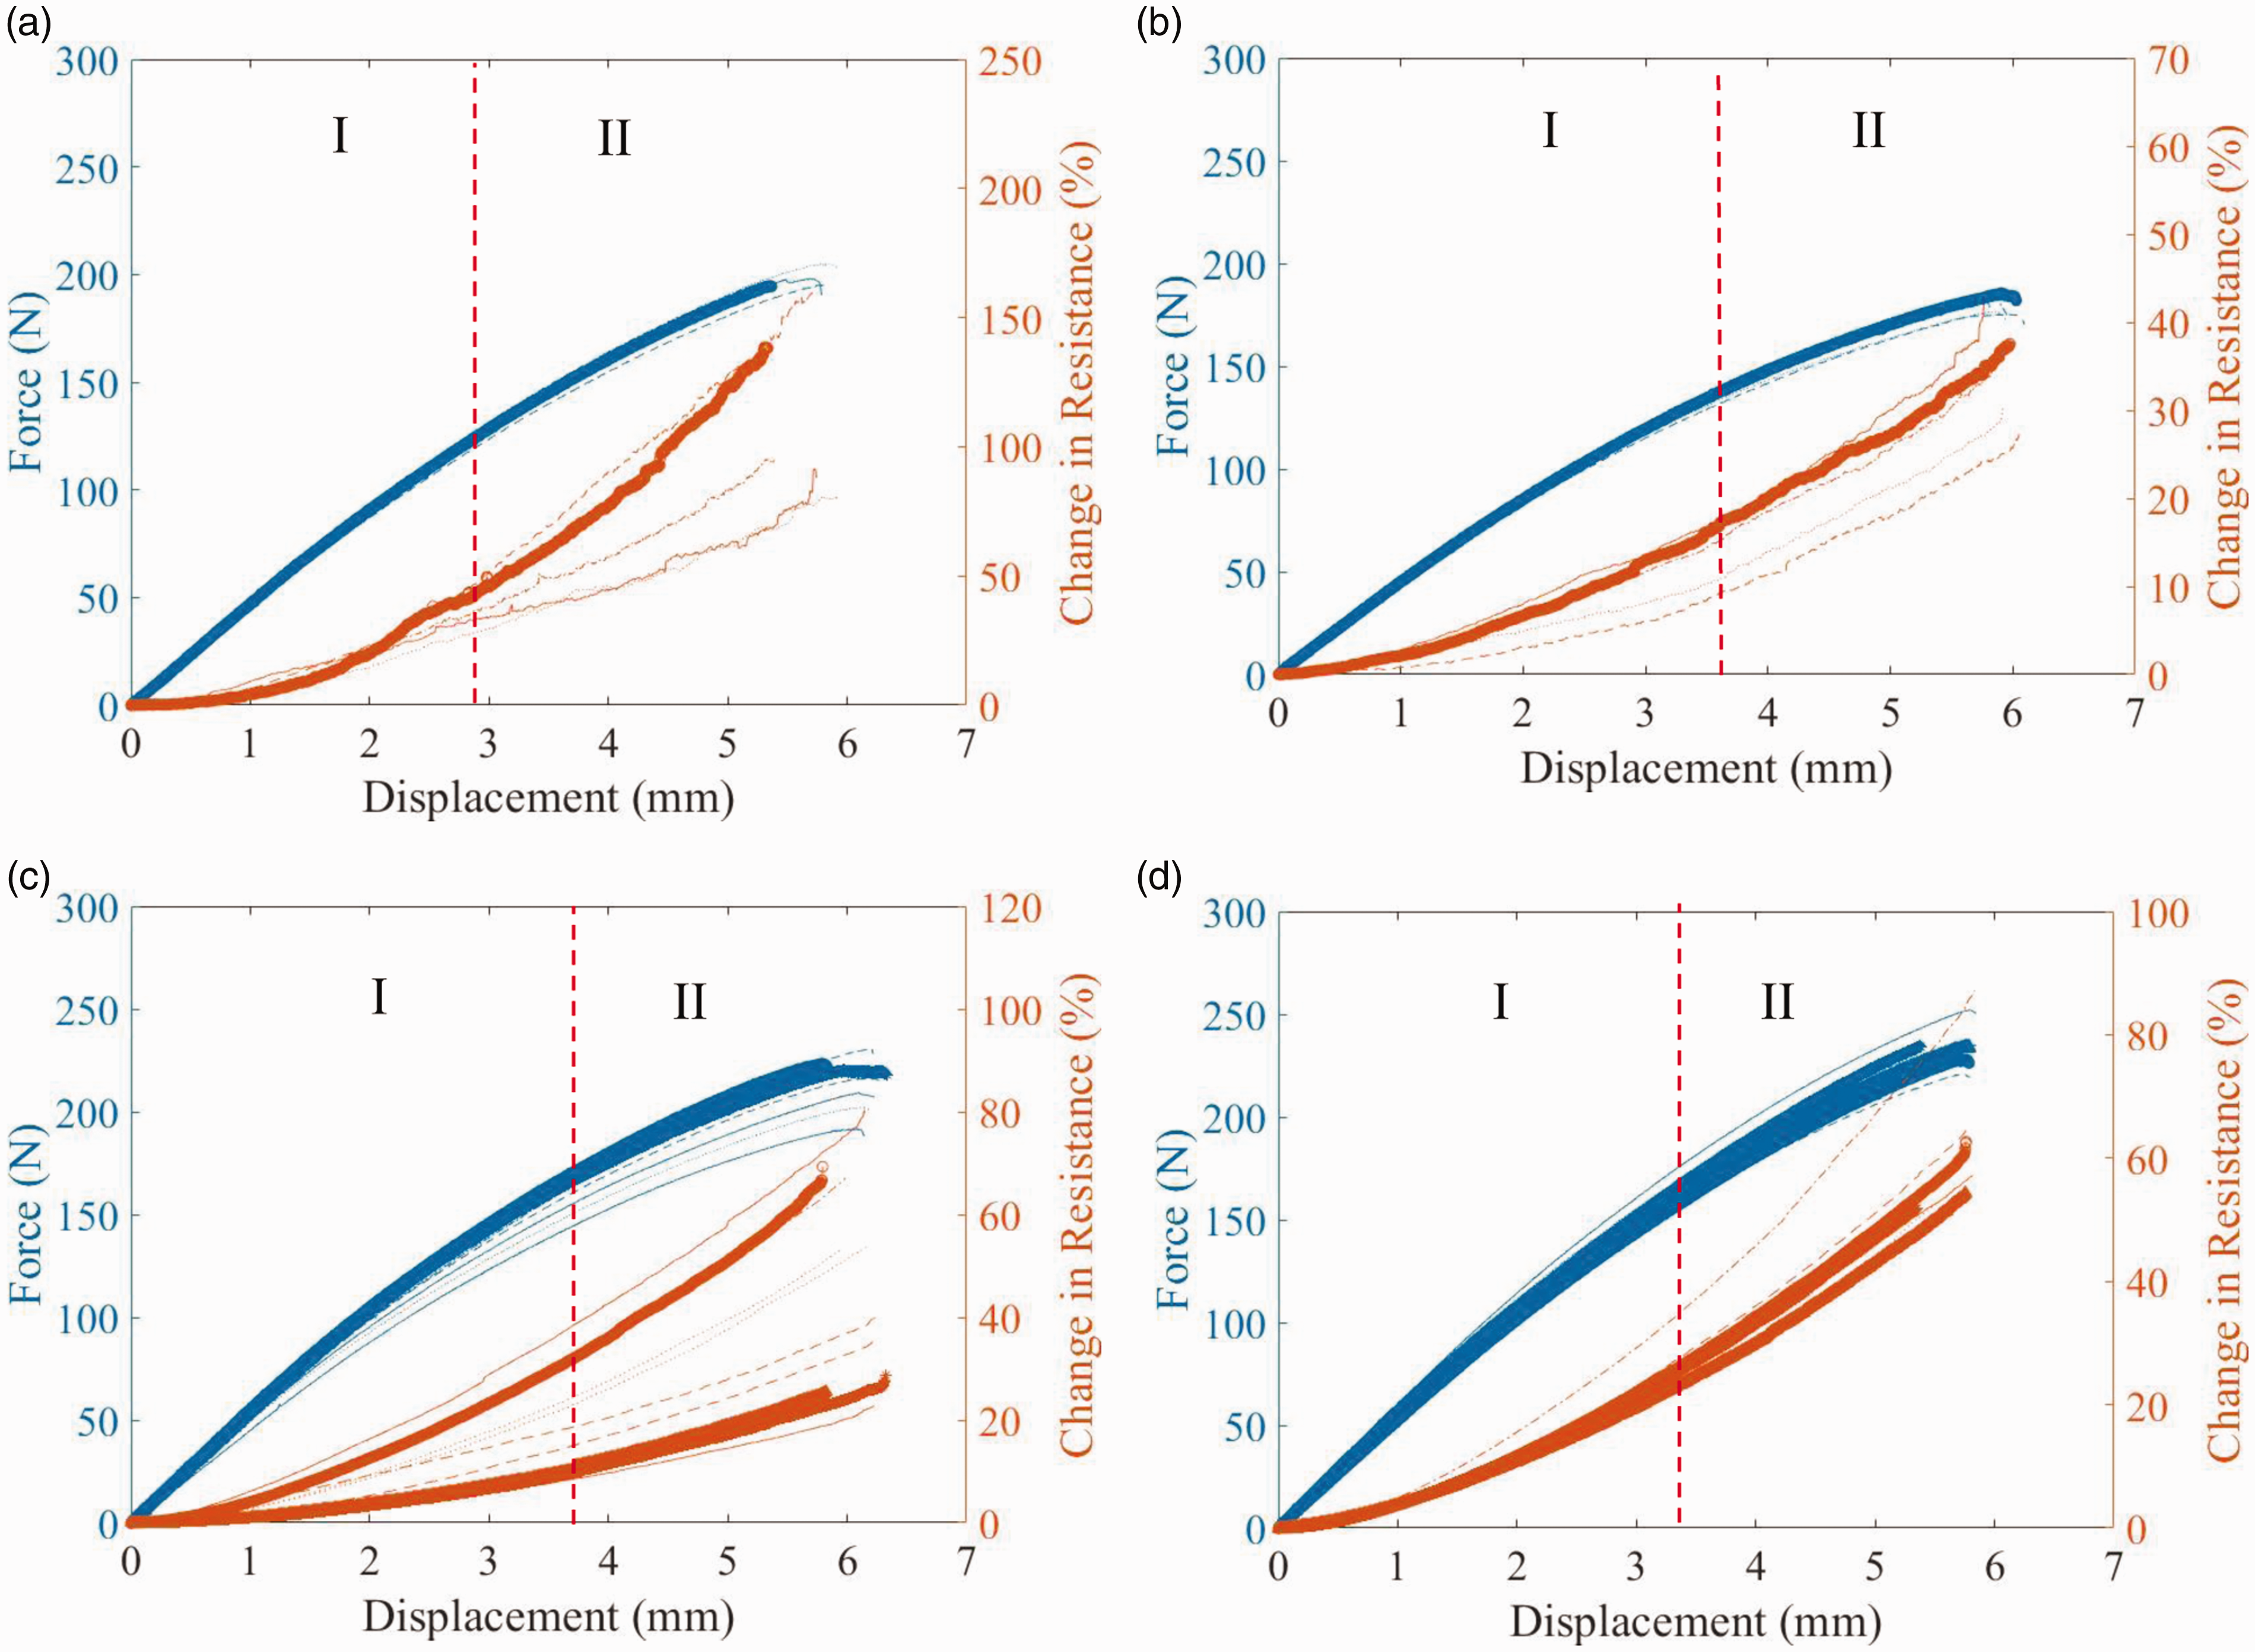
The flexural and electrical response of: (a) FS-150–05, (b) FS-150–10, (c) FS-150–15, and (d) FS-150–20.
The overall change in resistance decreased from FS-150–05 to FS-150–10. This is because with increasing carbon fiber density, the addition of carbon fibers created more electrical connections within the composite, improving its electrical network. This reduced the composites initial resistance and required more connections to be removed from the network to create a similar change in resistance as a composite with lower initial resistance. More carbon fibers in the matrix also allowed for more electrical connections to be generated in the zone above the neutral surface in compression. This resulted in an overall lower change in resistance. However, this trend did not continue to FS-150–15 and FS-150–20. The change in resistance of both groups of composites was higher than FS-150–10. Though there was an increasing amount of carbon fibers for these two composite types, at carbon fiber densities of 1500 and 2000 fibers/mm2, the clumps began to form, which affected the electrical response of the composites. The clumps of carbon fibers created large zones of weak bonding to the resin and acted as stress concentrations. Due to the increased number and size of these stress concentrations, when the microcracks began to form due to the debonding of the carbon fibers and the resin, the microcracks grew larger. This increased the resistance faster by breaking more electrical connections. For 1500 fibers/mm2, the clumps of carbon fibers were sporadic, creating an inconsistent electrical network. Areas with more bunches of carbon fibers were more conductive than those with less carbon fibers. This inconsistent distribution of carbon fibers caused the inconsistency in the electrical response for FS-150–15 as shown in Figure 12. As for the 2000 fibers/mm2 carbon fiber density, there were so many clumps of carbon fibers that the distribution of the clumps was relatively even. The layers with this fiber density had a consistent number of carbon fiber bunches throughout the surface, which created a more consistent electrical network.
Electrical response of FS-350-XX series
Figure 13 shows the electro-flexure response of the FS-350-XX series composites. The electrical response was again split into two zones, with the same characteristics as the FS-150-XX series. For zone-1, the electrical response varied based on the carbon fiber density of the composites. For FS-350–05, this zone was linearly increasing. This was due to the lowest carbon fiber density having the weakest electrical network. When connections were removed during elastic deformation, it was consistent because there were not as many connections as higher carbon fiber densities. This gradual removal of connections in an already weak electrical network created a linear change in resistance. For FS-350–10, FS-350–15, and FS-350–20, zone-1 was increasing with an increasing slope, like zone-1 in the FS-150-XX series. This was because of the increased amount of carbon fibers. With more carbon fibers, more electrical connections were created among carbon fibers and CNTs, and the longer carbon fibers created even more electrical connections because the 350 µm long carbon fibers penetrated better into the laminates, as explained previously. The longer carbon fibers created more electrical connections among CNTs and make it more difficult to remove the connections. Thus, a more defined electrical network was created. An increased amount of electrical connections resulted in greater sensitivity in the electrical network. During elastic deformation, when connections were removed by separation of carbon fibers and CNTs, the change was more noticeable and gradually increased because there were so many connections available initially. Zone-2 continues with a trend similar to zone-1, this being an increasing slope of resistance. The longer fibers had larger surface areas, creating larger zones of weak bonding and stress concentration. Thus, when the microcracks began to form, there were more and larger cracks than in the FS-150-XX series. This effect removed more electrical connections than in zone-1, which resulted in a further increase in slope of percentage change in resistance.
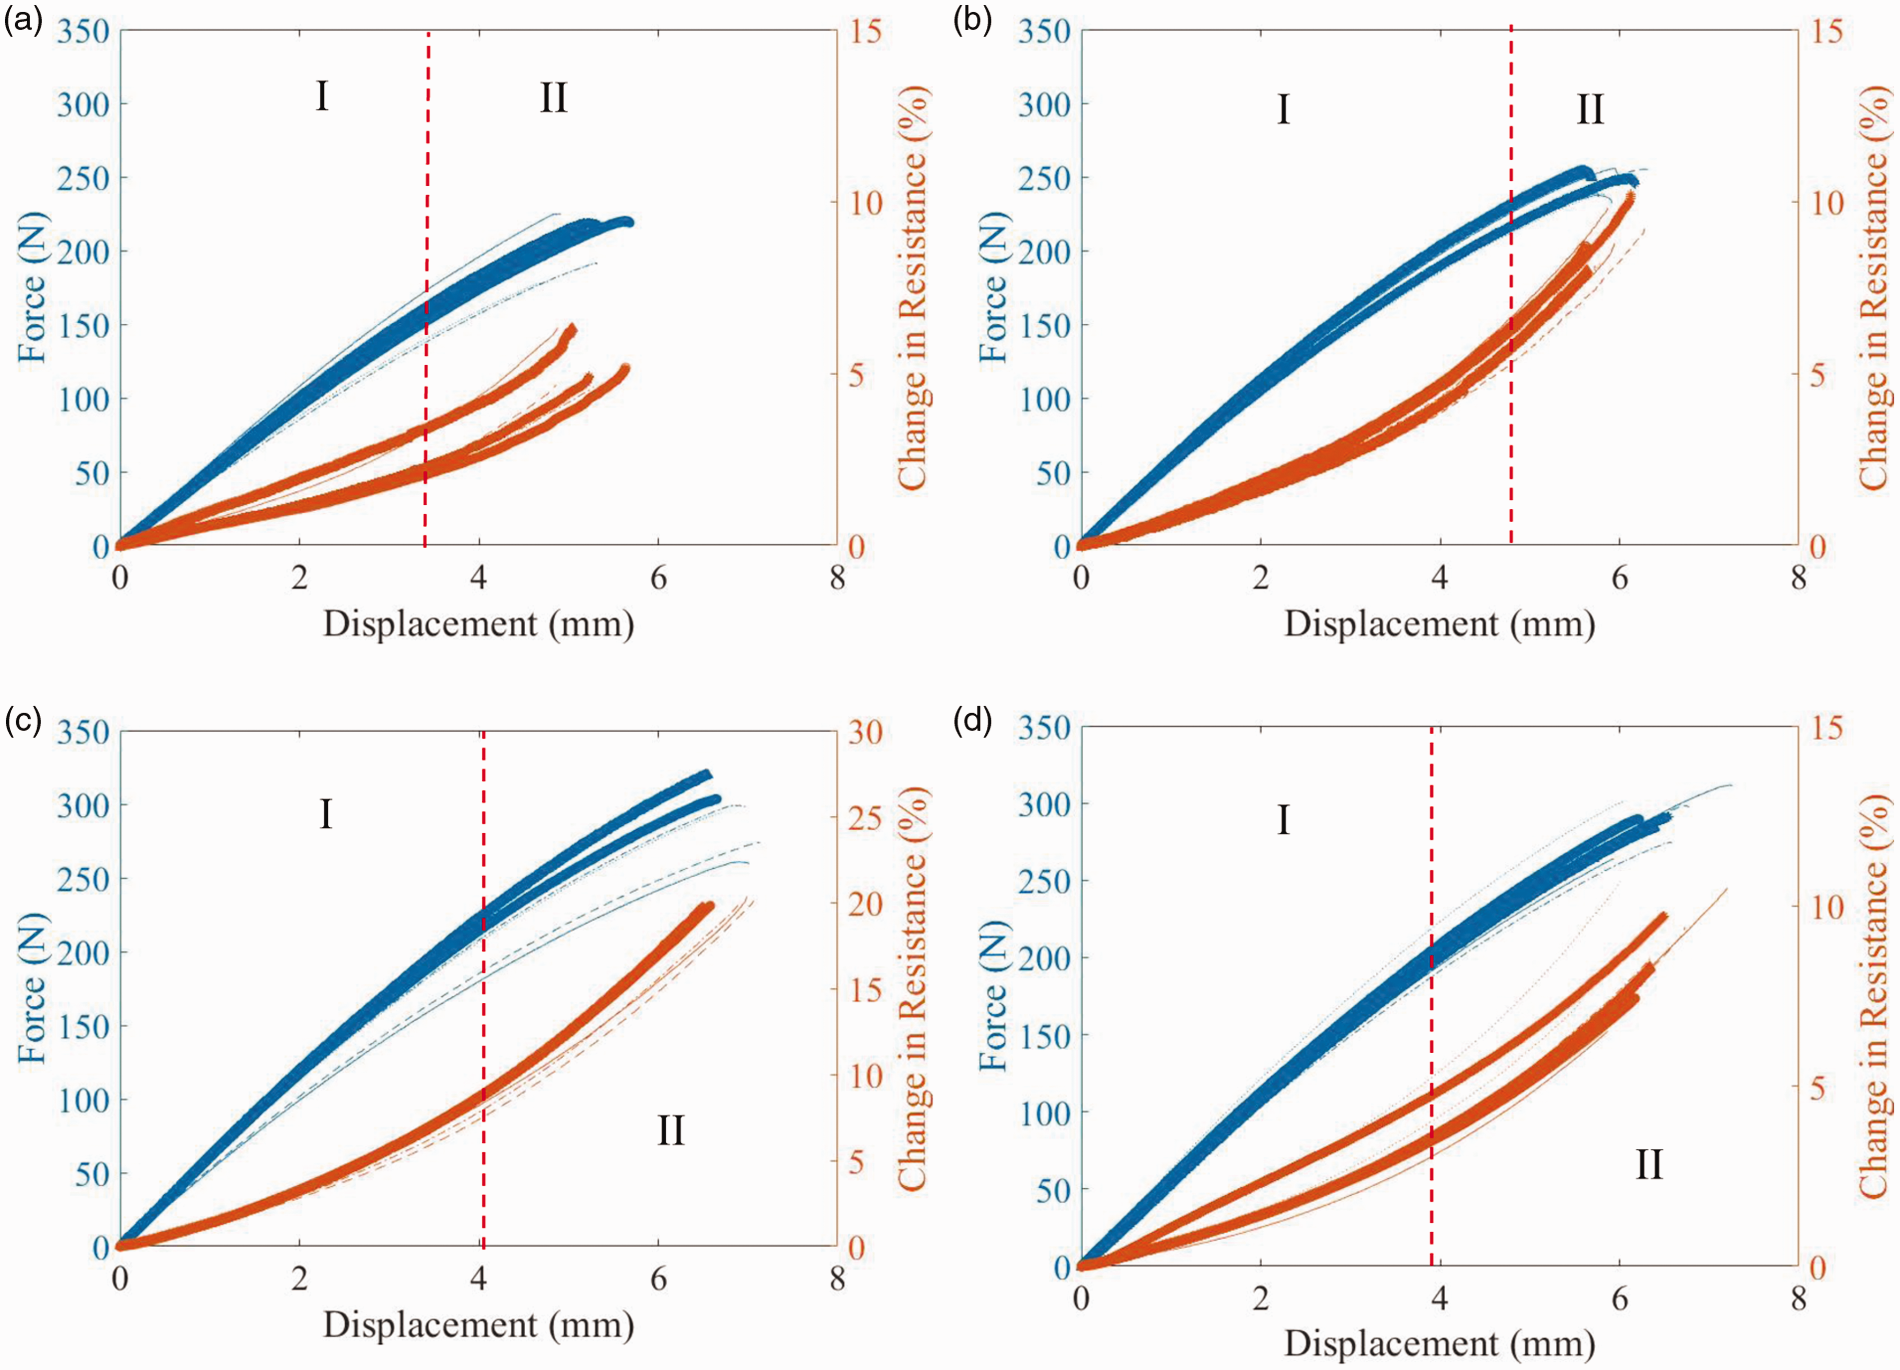
The flexural and electrical response of: (a) FS-350–05, (b) FS-350–10, (c) FS-350–15, and (d) FS-350–20.
The percent change in resistance was overall lower in the FS-350-XX series compared to that of the FS-150-XX series. For example, FS-150–05 and FS-350–05 had significant differences in electrical responses. At the onset of microcracks, the percent change in resistance of FS-150–05 was 15 times greater than FS-350–05. This is because the longer fibers (350 µm) can create more electrical connections among the carbon fibers and CNTs. More connections are required to be removed to produce the same percent change in resistance as the 150 µm composites. However, the longer carbon fibers maintained more connections during flexural loading. Additionally, the peak percent change in resistance of FS-150–05 was about 25 times greater than that of FS-350–05. This occurred because the longer carbon fibers created more electrical connections within the composite, which were more difficult to break. Additionally, during the flexural deformation and microcrack propagation, the movement of the longer fibers has a greater chance to create new electrical connections compared to the shorter fibers. This is consistent with all carbon fiber densities in comparison, the peak percent change in resistance of FS-150–10 was 3.5 times greater than FS-350–10, FS-150–15 has a peak that is 2.5 times greater than FS-350–15, and FS-150–20 had a peak that was 8 times greater than FS-350–20. Therefore, in each case for every fiber density, the longer 350 µm carbon fiber reinforcement resulted in a lower percent change in resistance.
Change in resistance (ΔR) values
The change in resistance (ΔR) as a function of carbon fiber density for multiple displacements is plotted in Figures 14 and 15. Figure 14 shows the ΔR for the composites with 150 µm carbon fiber reinforcement. The change in resistance has the same trend for all displacement values. The composites with a carbon fiber density of 500 fibers/mm2 had the highest value, which decreased for 1000 and 1500 carbon fiber densities, and finally ended with a slight 31% increase for a carbon fiber density of 2000. The decrease in ΔR with increasing carbon fiber density was due to the improved electrical network with increased amount of carbon fibers, as explained before in Figure 11. With a better electrical network, more connections were required to be broken to create the same change in resistance for weaker electrical networks. The 2000 carbon fiber density resulted in a slight increase because of the large stress concentrations created by the bunches of carbon fibers. These stress concentrations created additional microcracks, which broke electrical connections quickly.
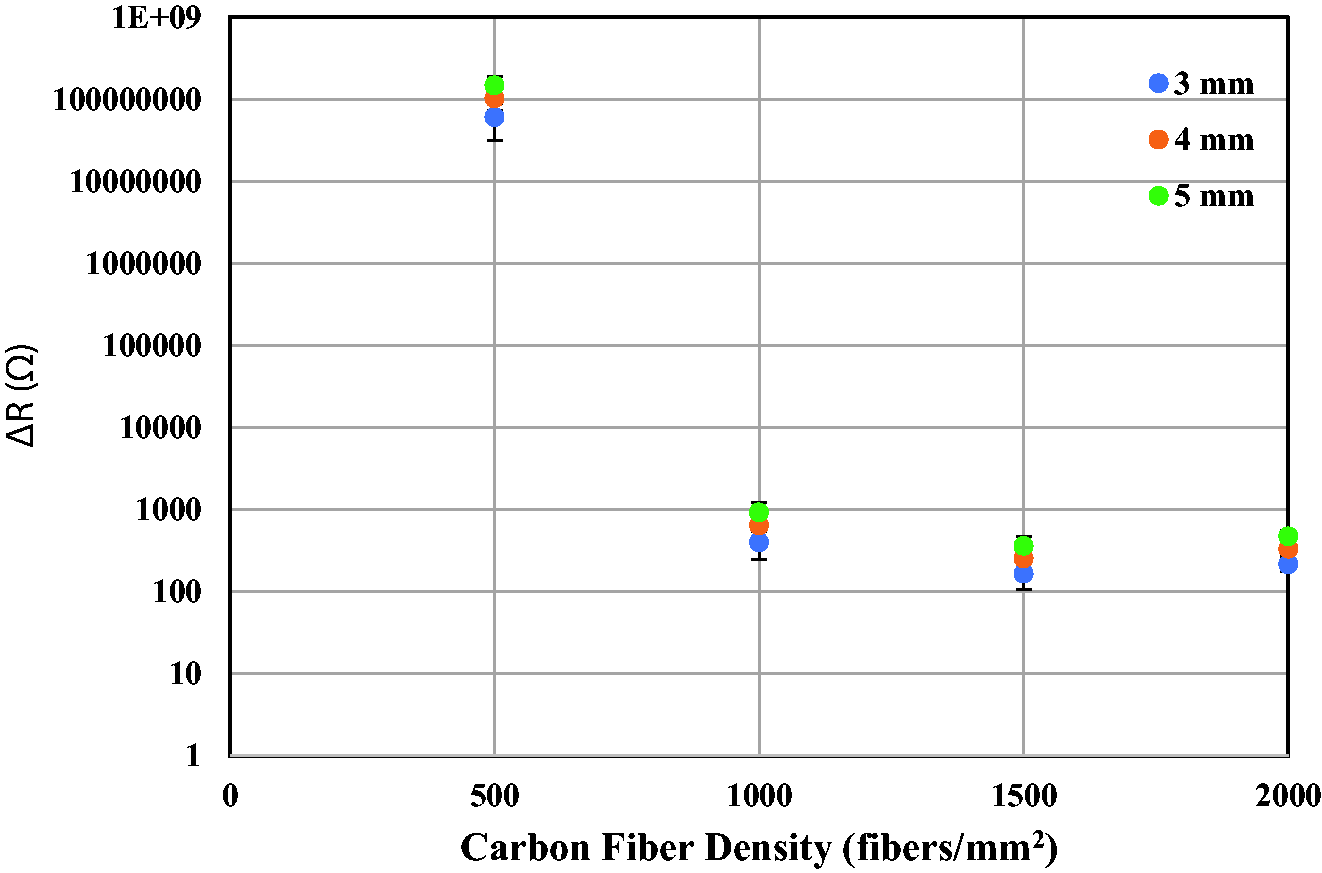
The change in resistance (ΔR) of the FS-150-XX series at varying displacements.
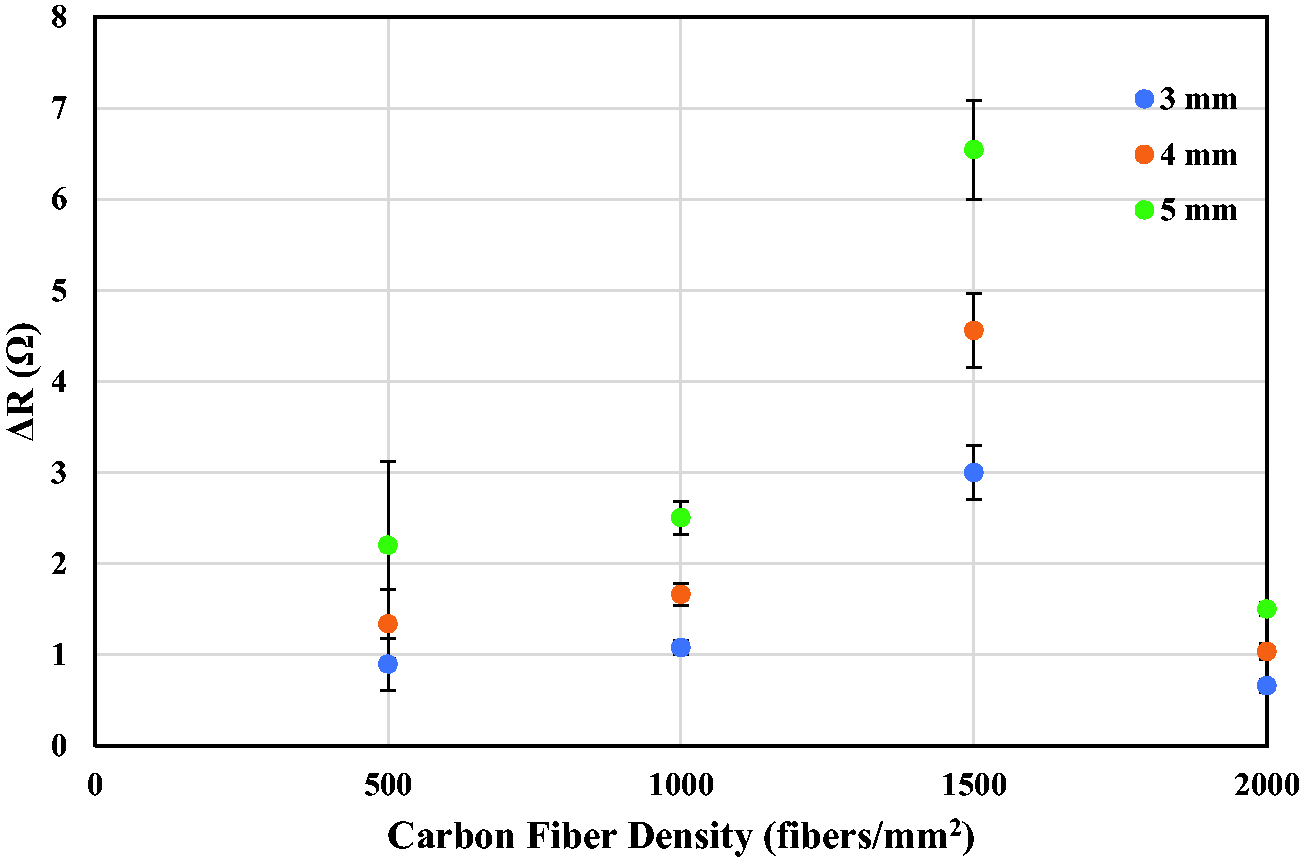
The change in resistance (ΔR) of the FS-350-XX series at varying displacements.
Figure 15 shows the ΔR for the composites with 350 µm carbon fiber reinforcement. The ΔR is similar for all composite types except for fiber density of 1500 fibers/mm2. The composite with the carbon fiber density of 1500 fibers/mm2 resulted in the highest ΔR. The slight increase from the 500 to the 1000 carbon fiber density can be explained by the increase in the longer 350 µm fibers. Additional fibers created more stress concentrations due to the fibers’ longer length, as explained before. The added stress concentrations due to the weak bonding created more microcracks, like the FS-150–20 specimen. As they grew larger, the microcracks tended to coalesce to form larger cracks. With an increased number of microcracks, this happened more frequently in samples with more stress concentrations. This resulted in more electrical connections being removed to increase the ΔR to be greater than FS-350–05. The increase observed for FS-350–15 is explained by the inconsistency in carbon fiber deposition while flocking process for 1500 carbon fiber density, as mentioned previously. The irregular fiber deposition and the inconsistent bunches of fibers created a nonuniform electrical network within the composite. An unstable network leads to larger changes in resistance when electrical connections were removed. The decrease in FS-350–20 was from the excess of carbon fibers present. The large number of carbon fibers present in the electrical network allowed for more electrical connections initially, as well as a higher chance of electrical connections to be made with the neighboring carbon fibers and CNTs during loading. The FS-350-XX series had lower ΔR than the FS-150-XX series due to the lower initial resistance of the FS-350-XX series. The decreased initial resistance resulted in more electrical connections having to be removed to create a large change in resistance
Conclusions
An experimental study was performed to determine the flexural and electrical response of multi-functional jute and flax reinforced hybrid natural fiber composites under flexural loading.
The major outcomes of this study are as follows: The addition of carbon fibers reduced flexural strength in most cases, aside from FS-150-20 and FS-350-15. The fibers did not bond well with the epoxy, which caused stress concentrations throughout the composite, resulting in a weakened composite. Adding carbon fibers to composites increased the flexural strain at break for all samples in the FS-150-XX series and decreased for all samples in the FS-350-XX series. However, all composite with carbon fiber reinforcement aside from FS-350-05 resulted in greater displacement at break. This is due to the fibers blocking microcrack growth to allow for greater deflection of the composite before it fails. The addition of carbon fibers also increased the thickness of the composite causing a decrease in flexural strain. Carbon fiber reinforcement greatly reduced the initial resistance of the composites in comparison to FS-0-0. The FS-350-XX series resulted in lower initial resistances than the FS-150-XX series due to the longer carbon fibers penetrating better into the composite laminates, having more electrical connections and creating a thorough electrical network. Each composite exhibited two zones of electrical response, with zone-1 referring to elastic deformation and zone-2 corresponding to onset and growth of microcracks. The beginning of microcrack growth resulted in a linear slope in change of resistance for the FS-150-XX series, whereas it increased the slope of change in resistance for the FS-350-XX series. For the FS-150-XX series, increasing carbon fiber density resulted in decreasing ΔR values for increasing carbon fiber densities. The decrease is contributed to increasing carbon fiber density creating better electrical networks. When the electrical network of a composite is improved, it requires more connections to be broken to create the same change in resistance as other composites. The FS-350-XX series results in similar ΔR values due to the initial resistances of the composites being so close. This is contributed to the longer carbon fiber creating a better electrical network. The 1500 carbon fiber density experienced the largest ΔR due to the inconsistency of carbon fiber dispersion.
Footnotes
Declaration of conflicting interests
The author(s) declared no potential conflicts of interest with respect to the research, authorship, and/or publication of this article.
Funding
The author(s) disclosed receipt of the following financial support for the research, authorship, and/or publication of this article: This study was supported by the National Science Foundation (NSF) of the United States of America under grant number CMMI-1563040.