
Abstract
A comprehensive study of the fibre breakage mechanisms during mould filling in injection moulding of short-fibre polymer composites requires the isolation of the main parameters promoting fibre length attrition. In this work, hydrodynamic parameters such as injection flow rate and residence time in the range of injection moulding were isolated, and their effect on fibre length attrition was studied. Fibre breakage was quantified by means of a capillary rheometer attached to an injection moulding machine minimising fibre-equipment interactions. Fibre breakage increased linearly as a function of injection flow rate in the range of 30–120 cm3.s−1. It was also found that residence time in the order of milliseconds had a significant effect on fibre breakage. The results shown that longer fibres had less breakage probability, which contradicts the buckling failure theory for brittle fibres in a simple shear flow. This result was attributed to the similar rotation period of the fibres in comparison with the test residence times.
Introduction
Short-fibre thermoplastic composites (SFTCs) have been developed in the last decades looking for higher mechanical performance in lightweight structures. Injection moulding is a processing technique used to produce high performance SFTC parts with complex geometries at high production rates. The main issue to overcome is to prevent fibre length attrition during injection moulding in order to improve mechanical properties. 1 Previous literature suggested that most fibre breakage (FB) occurs in the screw and nozzle during injection moulding. Some solutions have been proposed regarding the plasticisation process which was related with the geometry of the screw.1,2 The plasticisation stage can be optimised balancing dispersion, fibre length and plasticisation rate. Then, final fibre length distribution will be dependent on the infinite combinations of injection parameters during mould filling and mould geometry. 1 For these reasons, recent studies are focused on the mould filling stage. An accurate model to predict final fibre length distribution after mould filling is crucial for the prediction of the final mechanical properties of the part by means of micromechanical models. 3 The design of models for fibre length attrition in extrusion or injection moulding processes should be based on the fundamental understanding of the physics in FB. As described by Wolf et al., 4 during flow of molten polymer/glass fibre composites confined in a closed geometry, fibre length is reduced by undergoing three interactions called fibre–polymer, fibre–equipment and fibre–fibre. Fibre–polymer interactions are those related with hydrodynamic parameters such as shear stresses. Fibre–equipment can be referred to crashes of fibres with metal parts of the flow geometry. Fibre–fibre interactions can be a strong FB mechanism in composites with high fibre loadings. Many works have dealt with FB of polymer composites processed by injection moulding.1,2,5–7 Phelps et al.’s model 6 and its implementation in mould filling simulators, that is Moldflow and Moldex3D, is probably the most relevant approach in this topic. It is a statistical model, which describes the probability of a fibre breaking due to buckling and shearing forces in a flow field. Fibre–polymer interactions are the mechanism proposed for FB and it does not account for fibre–equipment and fibre–fibre interactions. Some experimental studies were proposed as validation methods for this model.5,6 Hopmann et al. 5 and Phelps et al. 6 validated the model extracting fibres at different positions of centre-gated and fan-gated plates. These studies did not isolate the different parameters promoting FB. Fibre–polymer, fibre–equipment and fibre–fibre interactions acted simultaneously and changed, in some cases randomly, upon modifications on processing conditions. The same problem was found in several works dealing with the experimental FB study after mould filling in injection moulding. 7
Few attempts have been reported for the isolation of hydrodynamic parameters (fibre–polymer interactions) in the study of FB.8–10 Most reliable results have been obtained using Couette rheometers.8,9 Shear rates below 500 s−1 were achieved which can be considered low values for the validation of models for injection moulding.8,9 Gaps 2.5 and 5.0 mm in height were used in the works by Goris et al. 8 and Moritzer et al., 9 while initial fibre lengths were in the range of 0.5–15.0 mm. Initial fibre lengths were similar or higher than the gap between cylinders. At these geometrical conditions, fibre–equipment interactions should not be neglected because individual fibres periodically flip and rotate inside the flowing geometry promoting crashes between fibres and metal walls. 6 Quijano-Solis and Yan 10 have used conventional a capillary rheometer with capillaries 1 mm in diameter to study wood fibre length attrition in polypropylene composites with initial average fibre length around 1 mm. Tian et al. 11 have also used conventional capillary rheometer with capillaries 1–3 mm in diameter at shear rates between 80 and 2000 s−1 to study FB with initial fibre average lengths between 3 and 12 mm. The range of shear rate was higher than Couette flow. Initial fibre lengths were similar of higher than capillary diameter (CD), so fibre–equipment interactions should not be neglected. Increasing CD to prevent fibre–equipment interactions keeping shear rates in the range of injection moulding (up to 105 s−1) would require cross head speeds out of range for conventional capillary rheometers. Mounting a capillary rheometer to an injection moulding machine could be a solution to overcome this issue. Thomasset et al. 12 mounted a capillary rheometer to an injection moulding machine to study rheological properties of polypropylene filled with 30 mass % of 15 mm long glass fibres. They also measured fibre length distributions before and after extrusion through capillaries 30 and 60 mm in length and 3 mm in diameter at an apparent shear rate of 88,600 s−1. They found strong fibre length attrition after capillary flow, but they did not study the effect of fibre–polymer interactions on fibre length attrition. In addition, their results may be significantly affected by fibre–equipment interactions because average fibre length in the reservoir, close to the entrance to the capillary, was two times higher than the CD. Individual fibres periodically flip and may rotate during flow inside the capillary, 6 so these geometrical characteristics may promote fibre–equipment interactions which should not be avoided in the FB analysis.
The aim of this work was to design an experimental set-up to study the fibre length attrition in a flow field at controlled flow rates and residence times in the injection moulding range. The method was designed to isolate these hydrodynamic parameters preventing fibre–equipment interactions. The fibre length measuring procedure was designed following updated standards for this practice in order to improve the accuracy, comparability and repeatability of the measurements of this work and eventually with other studies.
Experiment
Material
Domolen P1-014-V20-N (PPV20 N) from Domo Chemicals & Polymers was used for all tests. It is a polypropylene homopolymer filled with 20 wt. % of chemically coupled glass fibres with a melt flow rate of 7 g/10 min at 230°C-2.16 kg, tensile modulus of 5100 MPa, tensile stress at break of 81 MPa and tensile strain at break of 3.3% (data from supplier).
Characterisation
Conventional capillary rheometry

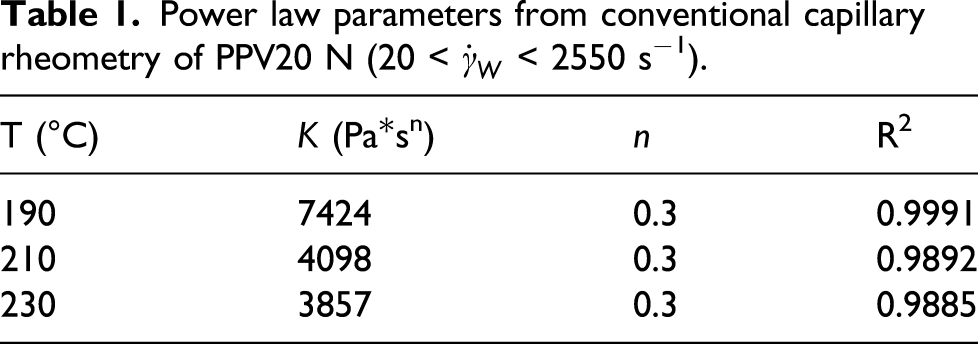
Power law parameters from conventional capillary rheometry of PPV20 N (20 <
Fibre content
Five g of pellets were put in a ceramic vessel and the fibres were extracted after the pyrolysis of the plastic in an electric oven “FMR Herramientas M250 S” operating at 620°C for 1.5 h. The oven had a heating capacity up to 1000°C and internal dimensions of 250 mm × 250 mm × 250 mm. Four vessels were used for the statistical analysis. The fibre content is calculated by the following equation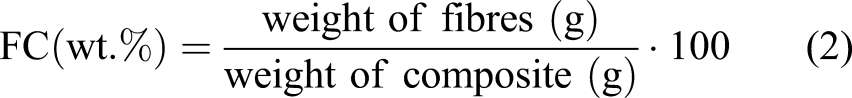
Fibre content of the as-received PPV20 N pellets was 19.5 ± 0.5 wt. %, which was in accordance with the technical datasheet of the supplier.
Varying rheology and fibre content of the polymer composite might have a significant effect on FB even tested at the same experimental conditions, so these parameters need to be analysed when comparing FB results from different works.
Quantification of fibre length attrition
Experimental set-up: Capillary rheometer adapted to injection moulding (CRIM)
Technical specifications of the injection moulding machine (ENGEL Victory 50) used for the design of the capillary rheometer.
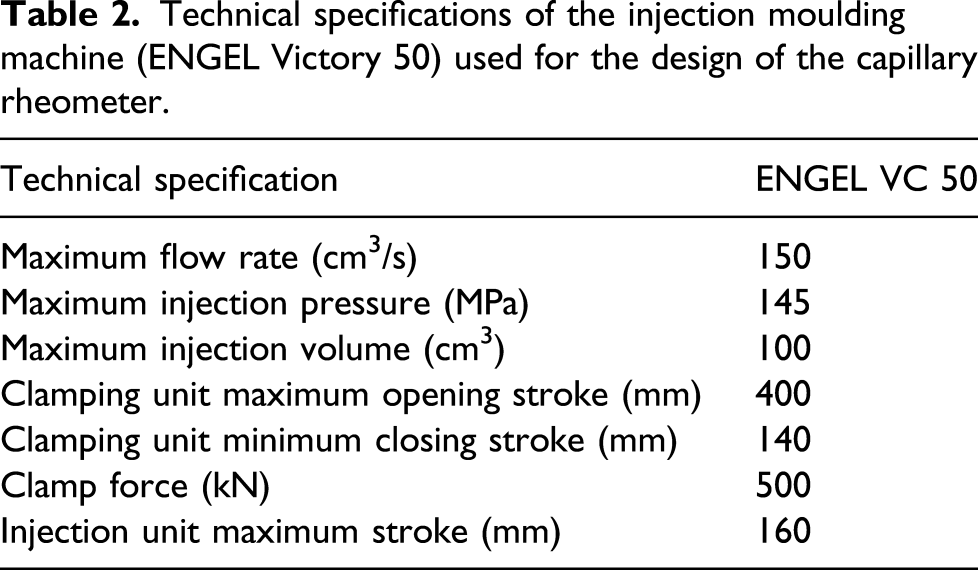
Figure 1(a) and (b) shows the computed aided design (CAD) drawings and assembly of the main parts of CRIM and a picture of the rheometer with the configuration for capillary length (CL) 200 mm mounted to the injection moulding machine. Capillary rheometer adapted to injection moulding set-up: (a) CAD drawings of the main parts and assembly (units [mm]) and (b) picture.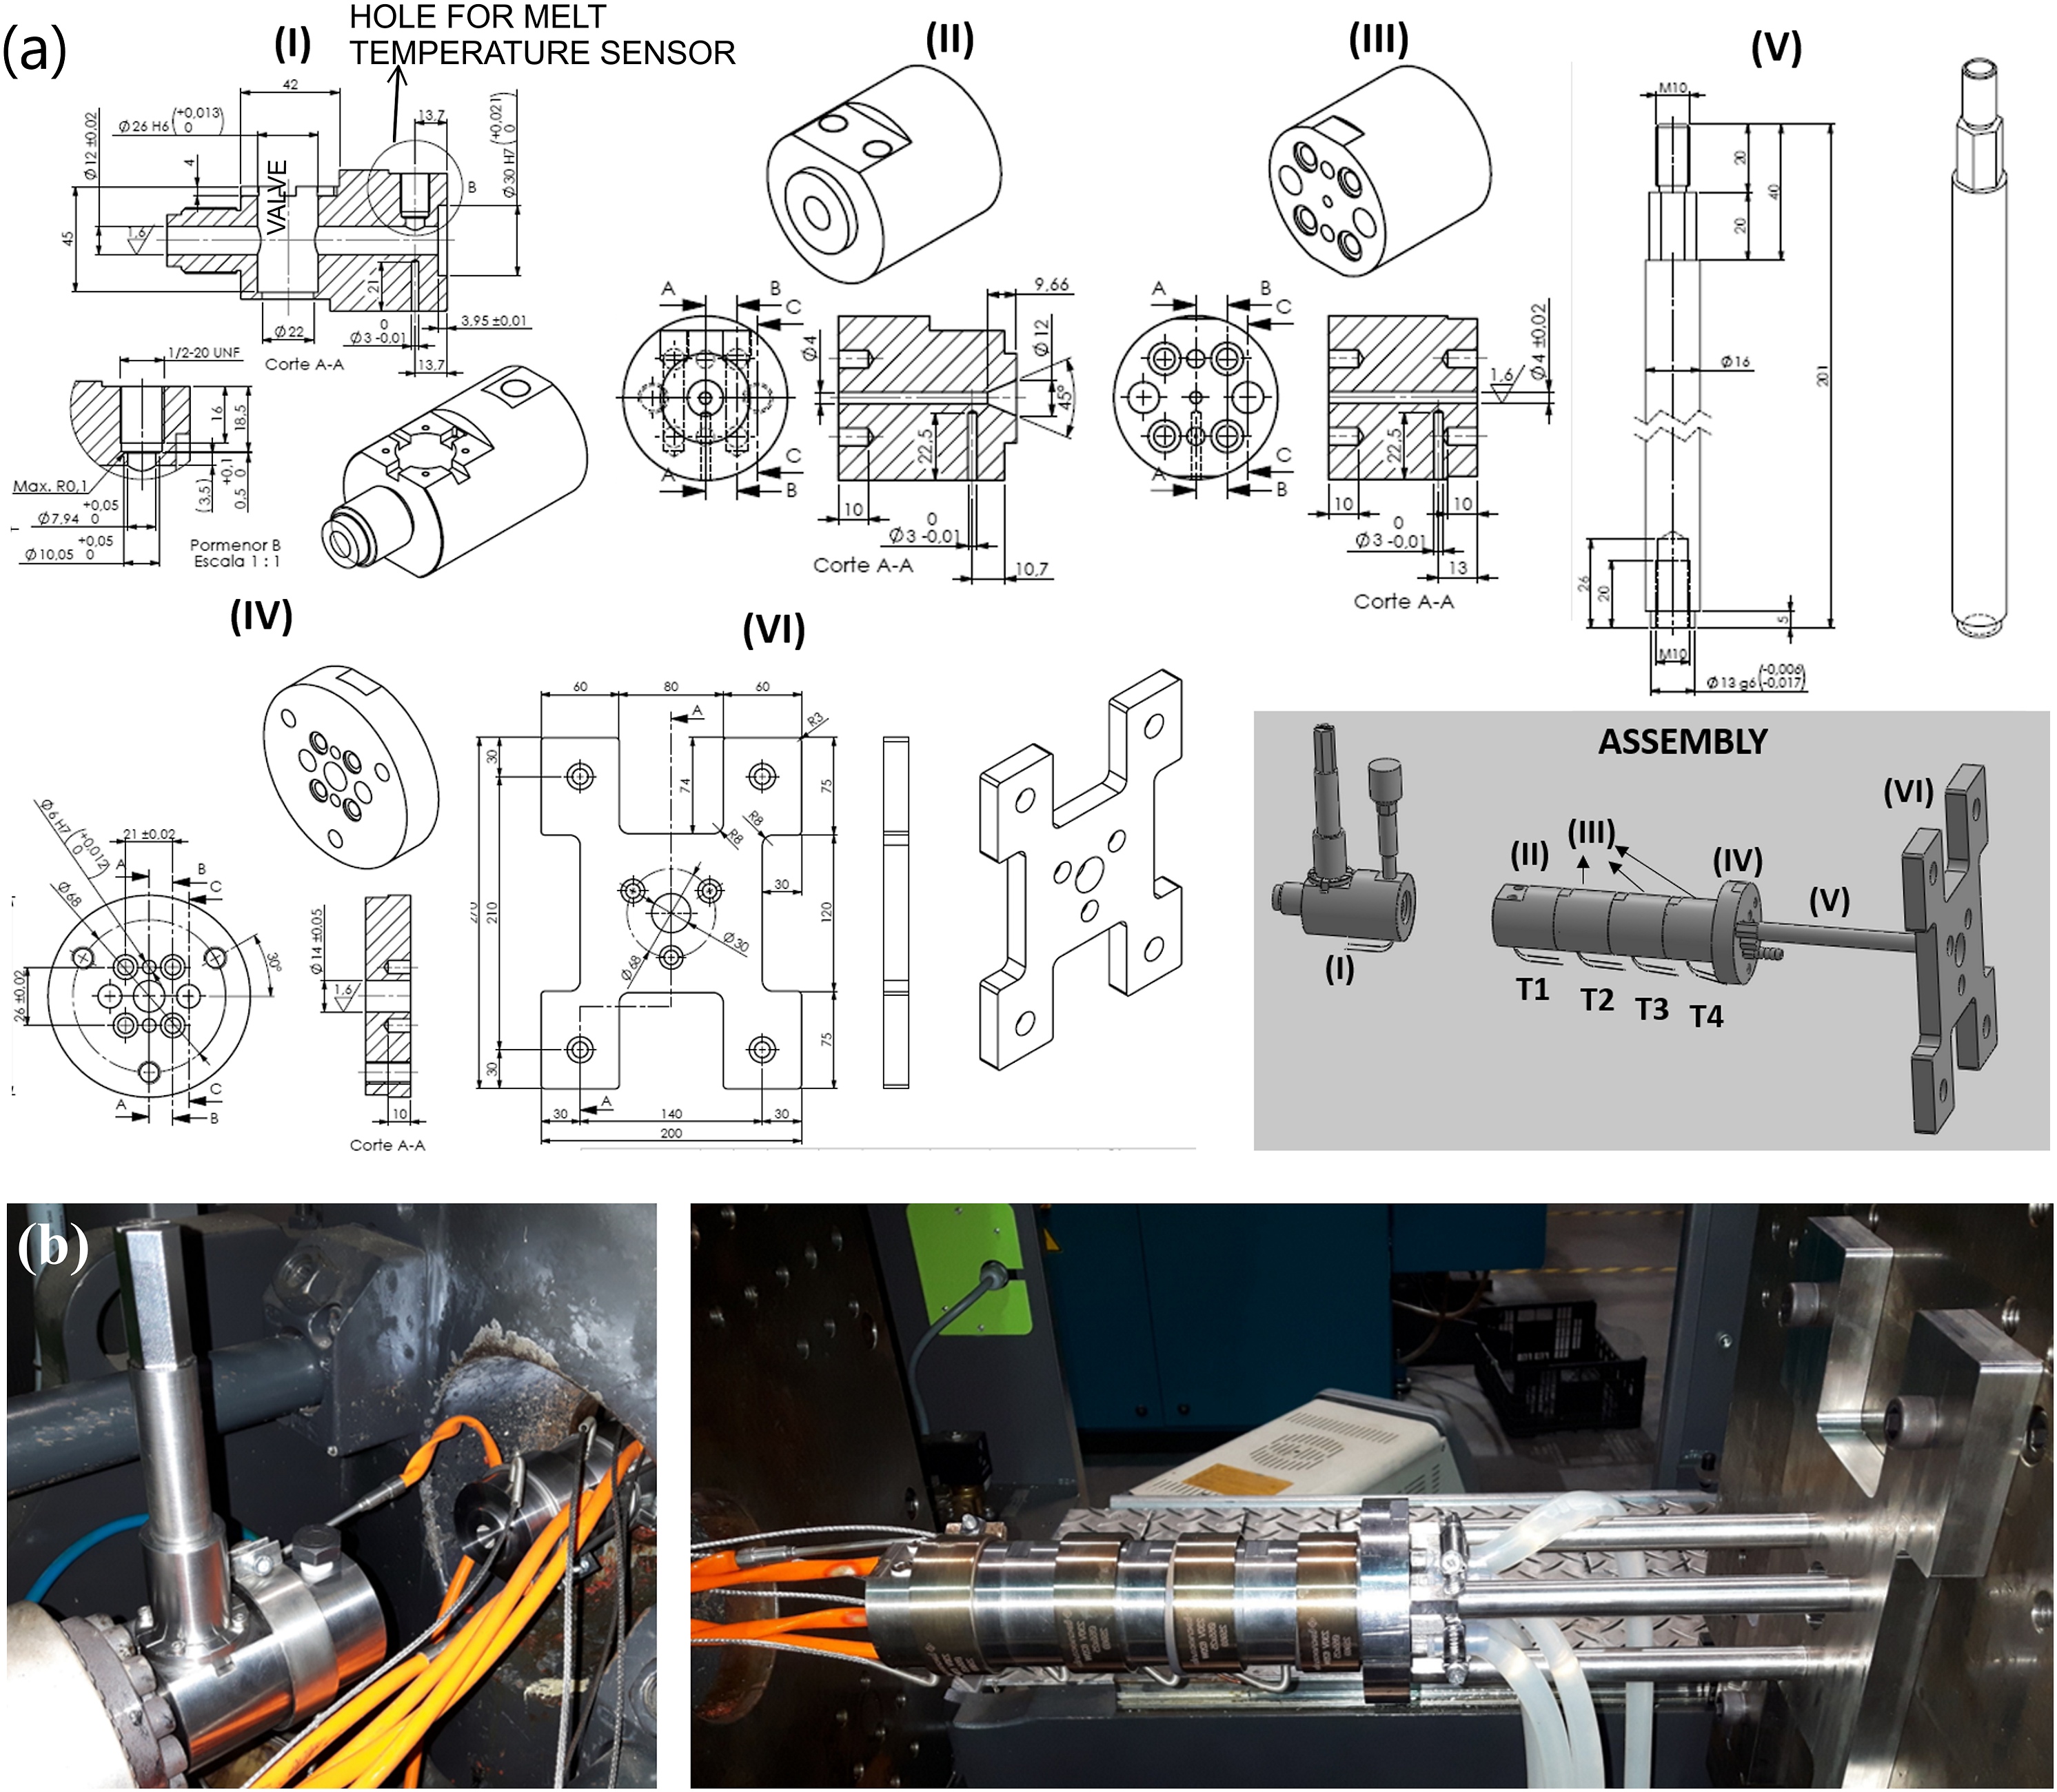
Supplementary material is available online containing the drawings of all individual parts needed to construct the rheometer. The capillary rheometer was designed following the ASTM D 3835 Standard. 14 Stainless steel 0878 R22 AISI 420 was used for all parts. The surface roughness of the capillary and barrel was below R a 0.2 μm. Barrel diameter (BD) was 12 mm. An inlet angle (IA) of 90° was used. The barrel length (BL) was 119.5 mm. Capillary diameter was designed as large as possible in order to prevent fibre–equipment interactions but working at shear rates in the injection moulding range. Capillary diameter was 4 mm. Four capillaries 50 mm in length were machined in order to operate with four configurations: CL = 50, 100, 150 and 200 mm. A temperature sensor Kistler type 4021B30HAP1 was installed in the barrel for high speed melt temperature lecture and acquisition. It allowed acquisition at real-time thresholds below 0.18 ms with a sampling rate of 1200 Hz operating in the range of 35–350°C. The barrel and each capillary had their own heating and temperature control system to work from 35 to 350°C.
The plasticisation parameters in the injection unit were constant for all samples. The temperatures downstream the barrel of the injection unit were 40/170/190/190°C, the screw rotation speed was 100 r/min and back pressure was 1 MPa. The average fibre lengths of PPV20 N after plasticisation were in the range of 325 μm–434 μm for the number average and 513 μm–583 μm for the weight average. It gives a CD to average fibre length ratio higher than six, which was arbitrarily considered high enough to prevent fibre length attrition due to fibre/equipment interactions.
Injection moulding tests were performed at constant flow rate and capillary temperatures T1 = T2 = T3 = T4 = 190°C (see assembly in Figure 1(a)). The shear rate at wall is calculated with the expression for isothermal pressure flow through a capillary for a power law fluid as shown in equation (3)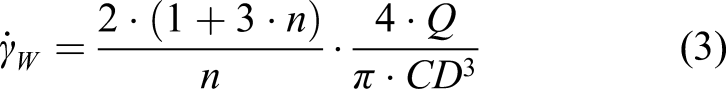
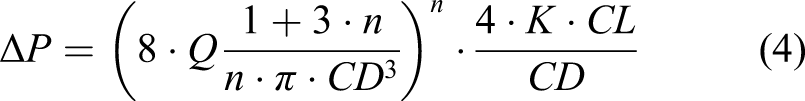
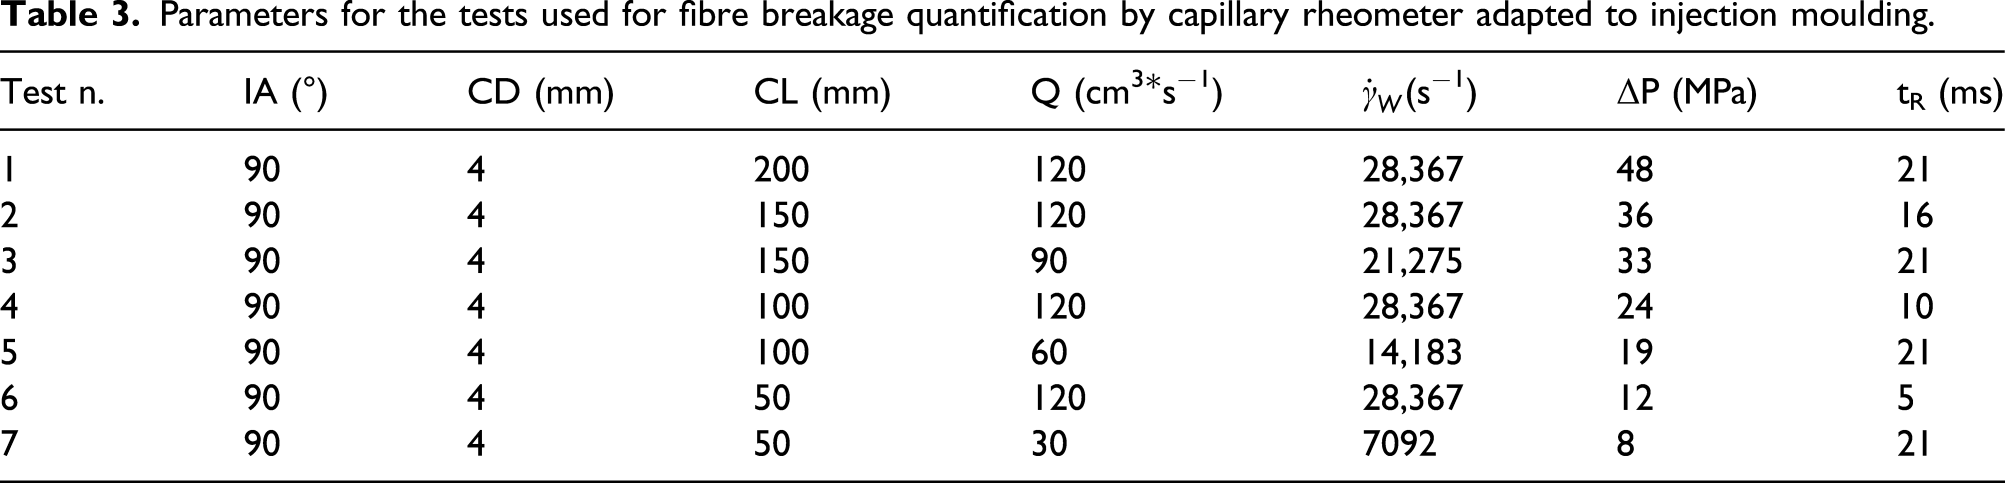
The parameters used were CD = 4 mm and n = 0.3, and Q was the corresponding flow rate set in the injection moulding machine (Q = 30, 60, 90 and 120 cm3∗seg−1). Performing these calculations, flow rates above 60 cm3∗s−1 give shear rates at wall above 104 s−1. At such high shear rates, the assumptions made for using equation (3) may not be valid because viscous heating and wall slip should not be neglected. Even so, performing accurate calculations for shear rate at wall was not the aim of this work. Fibre breakage was analysed as a function of injection flow rate instead of shear rate. In such a way CRIM can be easily used as an experimental validation technique for FB models in mould filling simulations. The pressure drop in the capillary should not exceed the maximum injection pressure of the injection moulding machine, which was 145 MPa. The pressure drop along the capillary is calculated by equation (4)
15
Parameters for the tests used for fibre breakage quantification by capillary rheometer adapted to injection moulding.
Sample extraction
Figure 2 shows an example of the collected samples after a test. EN, EN1 and EX were the name of the samples corresponding to 3 g of residual composite inside the rheometer barrel (before the capillary entrance), the first 5 mm of filament inside the capillary (after the capillary entrance) and the last 3 g of material out the capillary, respectively. The samples from as-received pellets were called PPV20 N. The fibre length and diameter distributions of the as-received pellets were measured using 3 g of PPV20 N taken from raw material used for test n. 1. Samples collected for fibres extraction from test n. 7.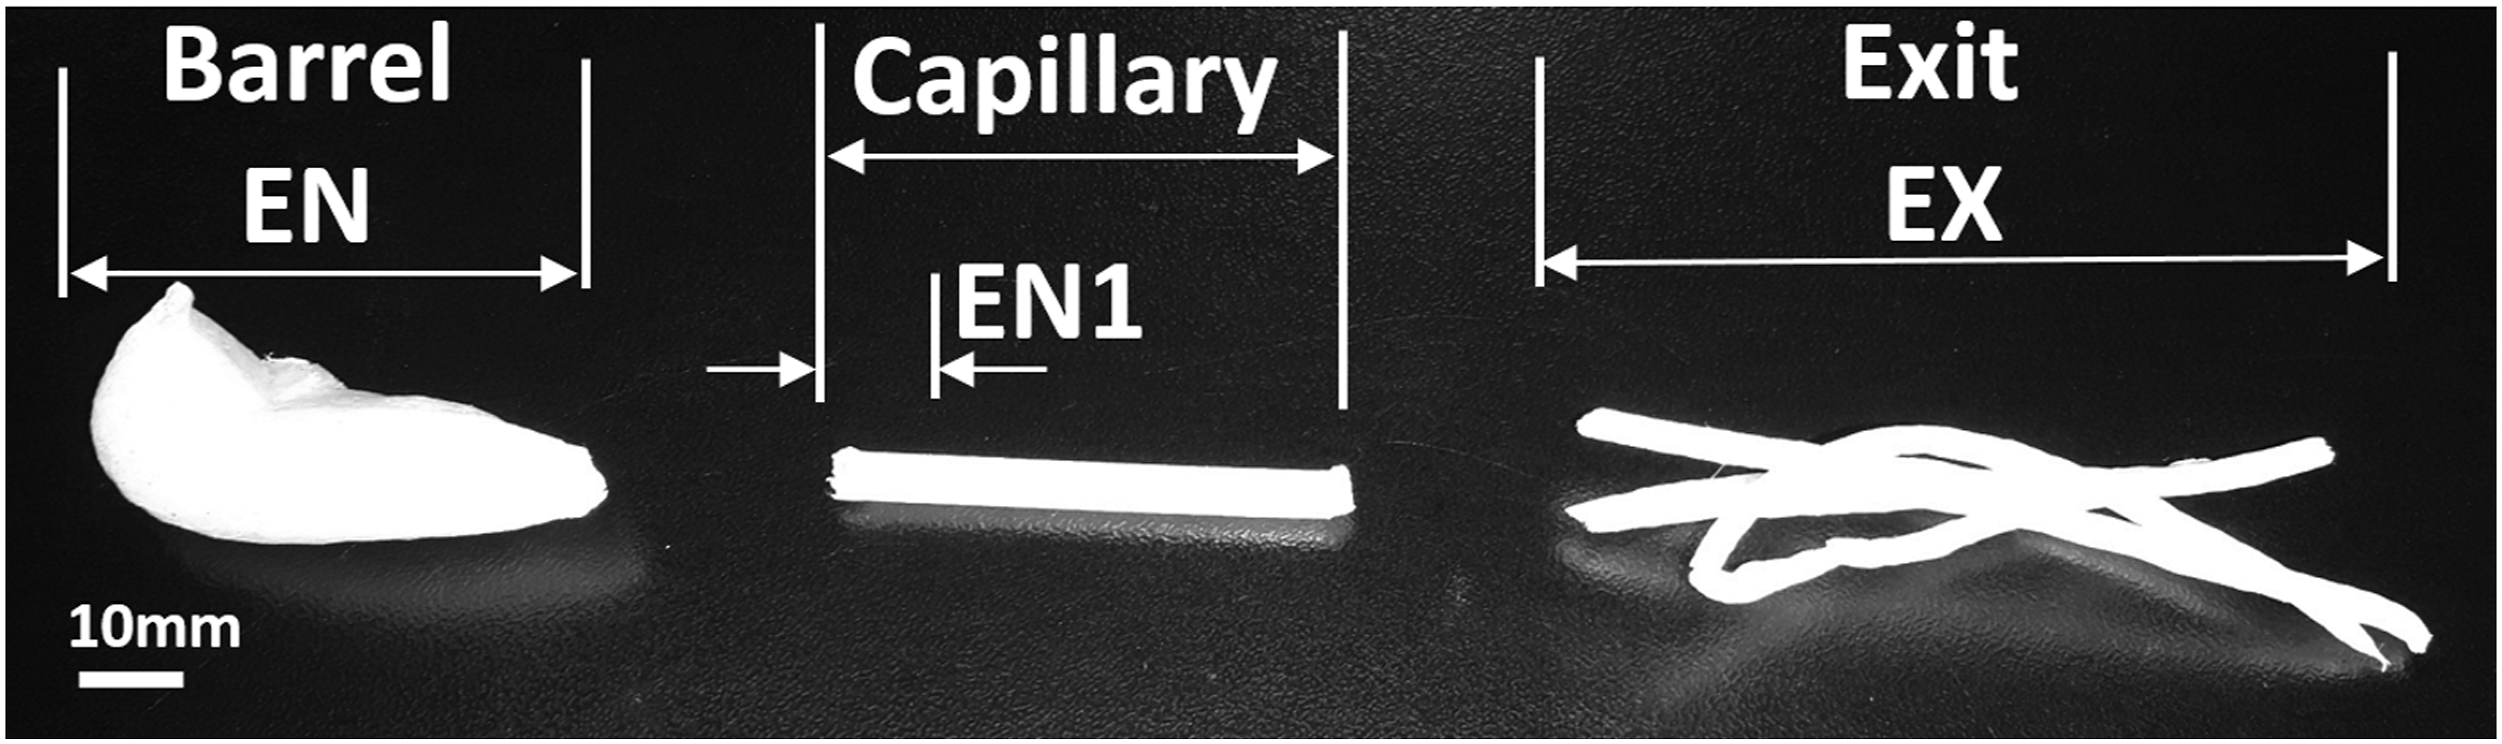
Figure 3(a) and (b) shows the typical images used for fibre length and diameter measurements. Typical micrographs used for measurements: (a) diameter and (b) length. These examples were extracted from the subsample PPV20N-1.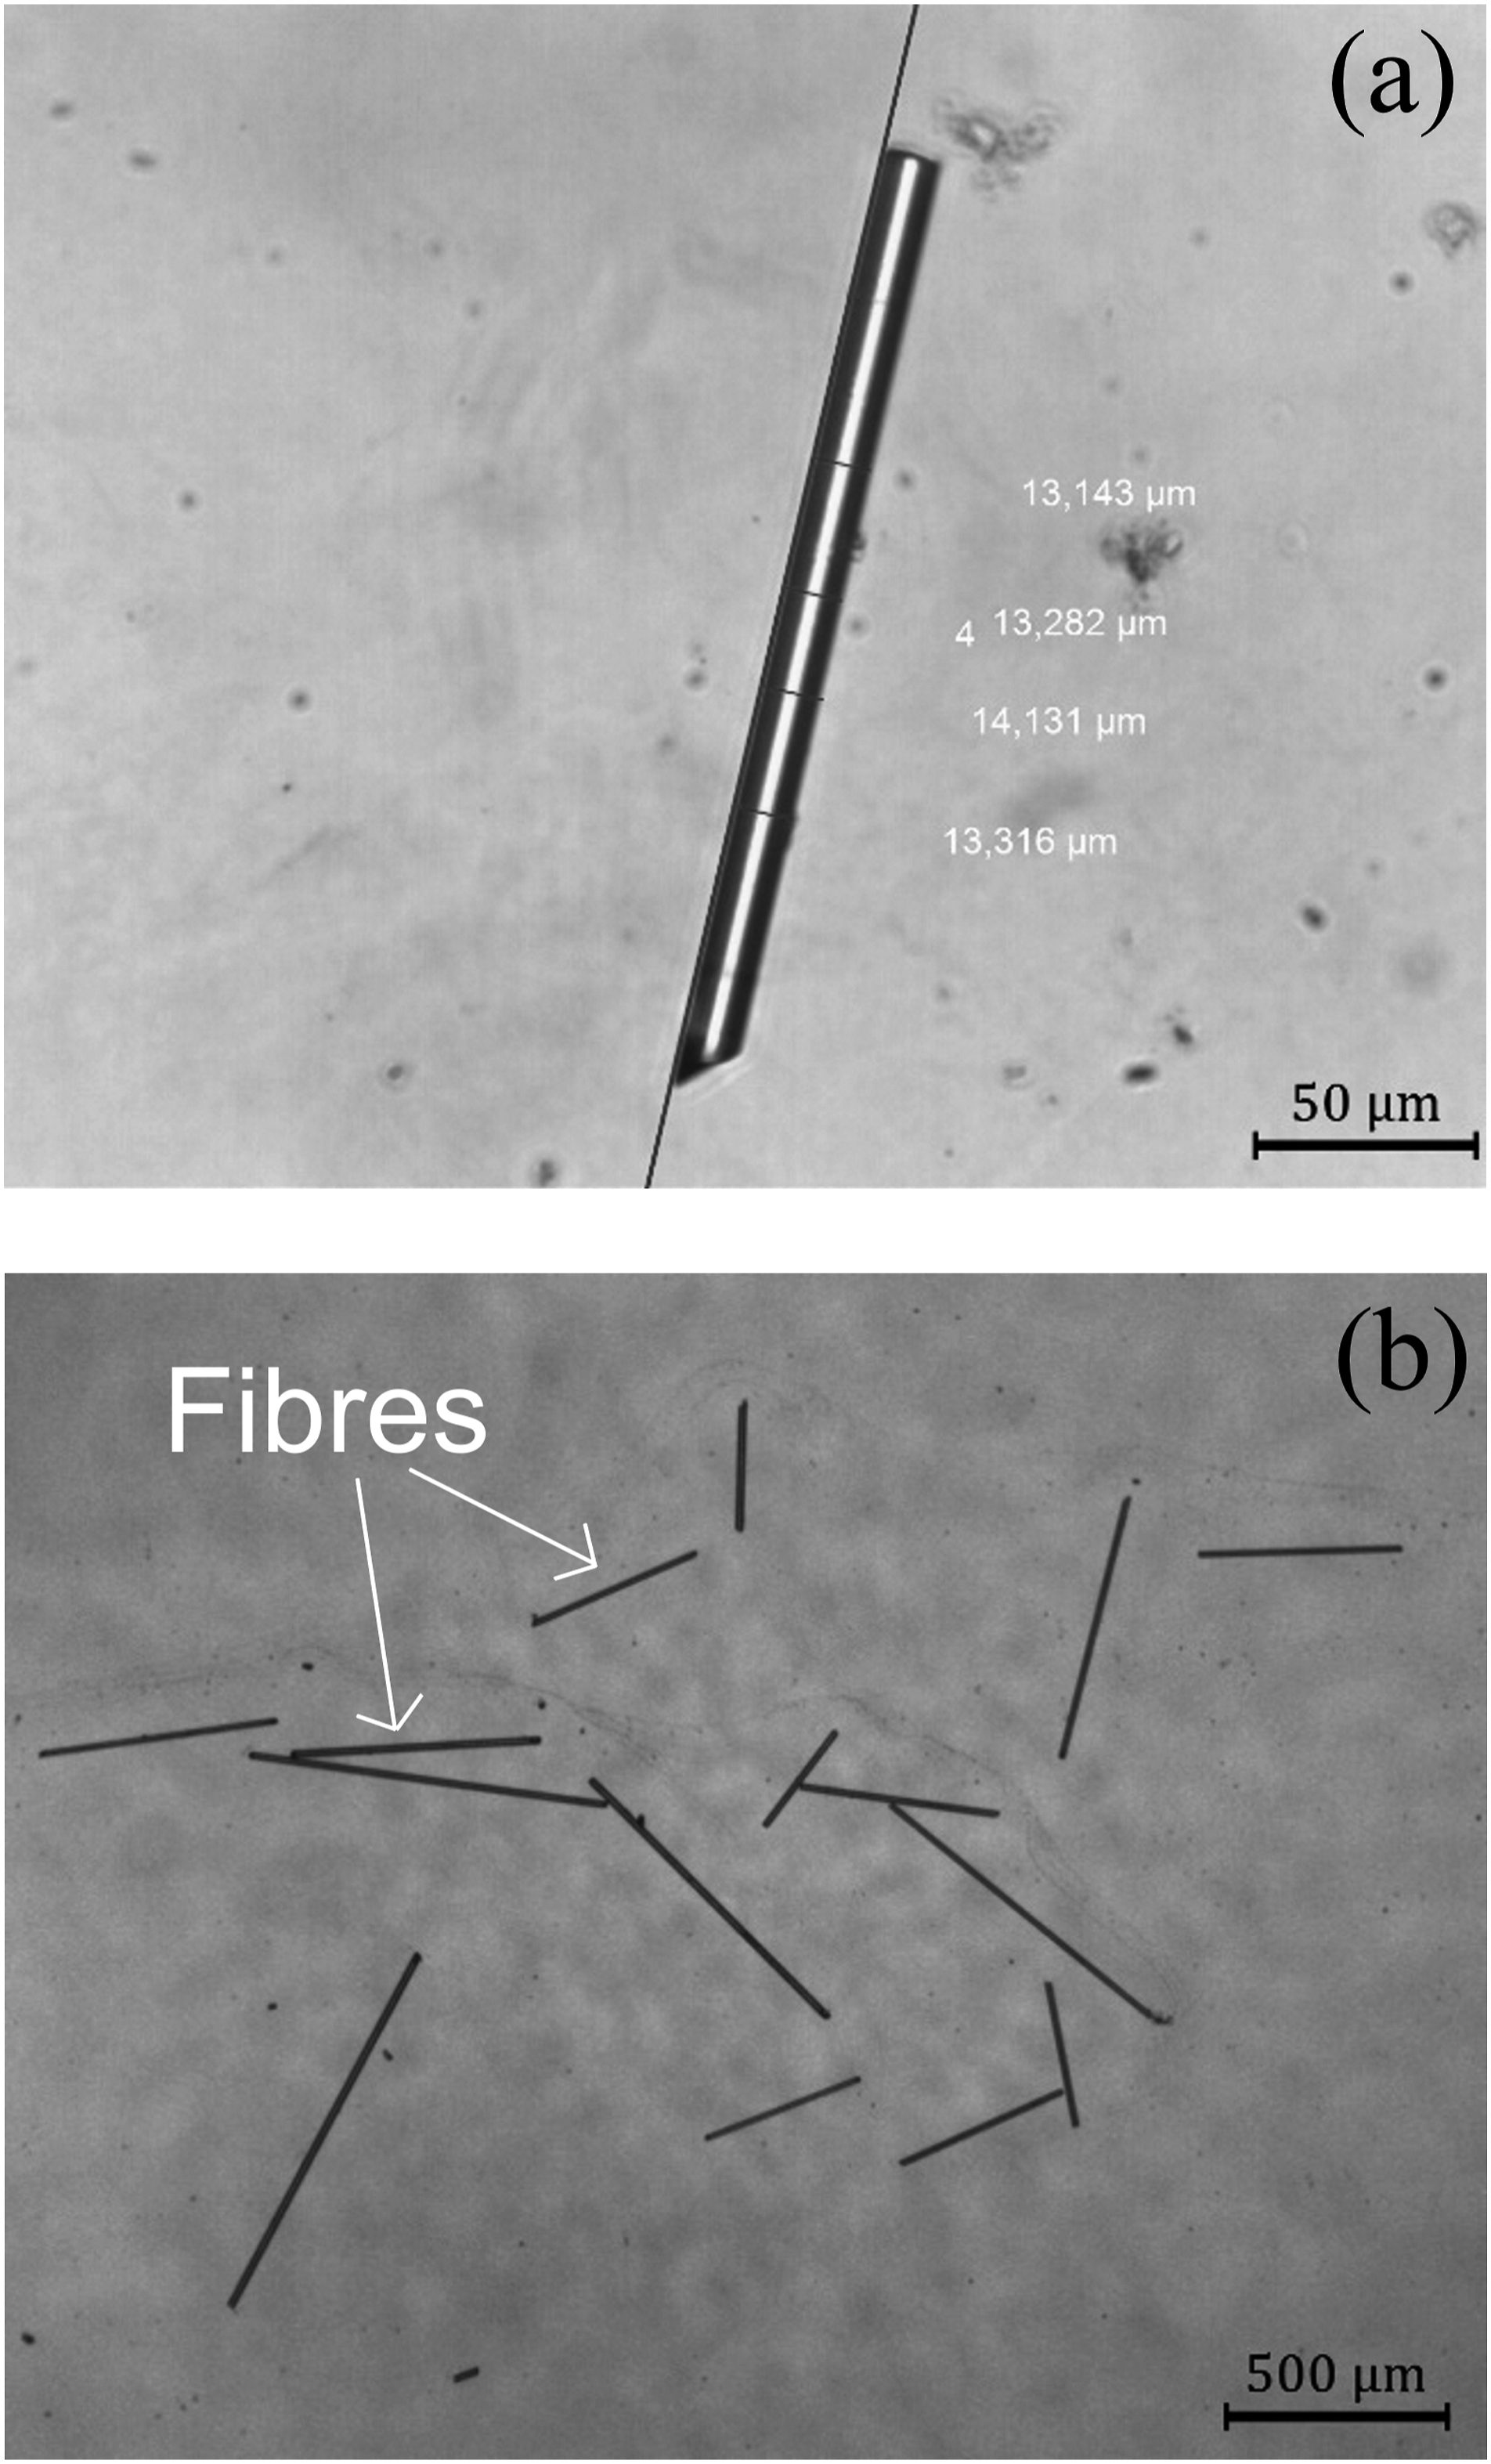
The technique used for the measurement of fibre length distributions is relevant for the interpretation and comparison of FB during compounding or injection moulding. Giusti et al. 16 and Goris et al. 7 have done an exhaustive review about methods for fibre length measurement in thermoplastic polymer short/long fibre composites. Fibres have been measured following five steps that included the pyrolysis of the polymer, fibre dispersion in ultrasonic bath, image acquisition in optical microscope, fibre length measurement and construction of the fibre length distribution. The fibre length measurement was done either manually or using image processing algorithms.
In this work, fibre length distributions were measured following the procedures of ISO:22314 standard. 17 Some modifications to this standard were developed following recommendations of the work by Goris et al. 7 in order to improve the accuracy, comparability and repeatability of the measurements of this work and eventually with other studies. Fibres in all samples (EN, EN1 and EX for each test of Table 1 and for PPV20 N) were isolated by polymer pyrolysis at 620°C for 1.5 h using the same oven mentioned in Section 2.2.2. Once fibres were isolated, three subsamples containing 15 mg of randomly selected fibres were carefully removed using plastic tweezers avoiding FB during this procedure. These subsamples were called EN-i, EN1-i, EX-i and PPV20N-i, for i = 1, 2, 3. The fibres were dispersed in a 50 mL glass beaker with 20 mL of distilled water. The suspension was manually stirred for 30 s at room temperature with a small sized plastic laboratory spoon. The stirring was weak and the spoon did not touch the walls nor bottom of the vessel in order to avoid FB during the dispersion process. After stirring, the suspension was collected with the spoon and casted onto a microscope glass slide. The water was evaporated placing the glass slide on a hot surface at 80°C. The fibres were observed in an optical microscope Olympus model BH-2 with an observing magnification of ×401.67 and 4 × 1.67 for diameter and length measurements, respectively. Digital images were taken at 2500 dpi. ISO:22314 recommended the measurement of 300 ± 60 randomly picked fibres per sample. Giusti et al. 16 and Goris et al. 7 suggested the measurement of at least 1000 fibres per sample to get an accurate fibre length distribution. In this work, we used the software of the microscope to manually detect the end points and measure the length of 1000 individual fibres for each subsample. Additional procedures were performed following the suggestions of Giusti et al. 16 and Goris et al. 7 Special care was taken to avoid the measurements in repeated areas. All fibres intersecting boundaries of the images were measured centring the specific fibres in the area to be measured. The diameter of each fibre was measured at three positions using a straight line on the fibre surface as reference in order to keep all measurements perpendicular to the fibre surface.
The diameter and fibre length distributions of each subsample were obtained using the Sturges rule
18
for the calculation of the number of fibre diameter or length intervals. The same name was used for the subsamples and their fibre length distributions. Absolute frequency 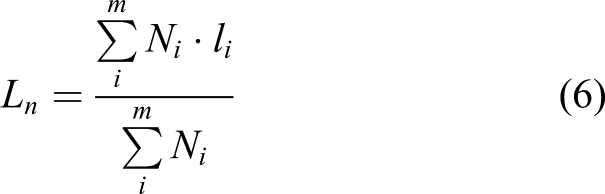
In studying models for the fibre length distribution, it is also helpful to define the weight average (or length average) fibre length 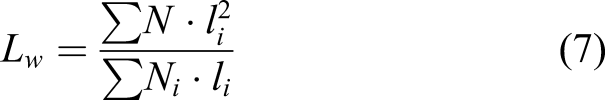
The same procedure was done for the diameter obtaining
The average fibre lengths of each subsample (EN-i, EN1-i or EX-i for i=1, 2, 3) for a test of Table 3 or for as-received pellets (PPV20N-i for i=1, 2, 3) were called SUBSAMPLE Lj where j can be n or w for number or weight average lengths, respectively. For example, for a given test of Table 3, EN-1 Ln is the number average fibre length of the fibre length distribution corresponding to the subsample EN-1 (before capillary entrance).
The calculation of the average fibre length of a sample was performed by the arithmetic mean of the average fibre lengths, number or weight, of the corresponding three subsamples. Standard deviation (S) was also calculated and informed as error bars in plots. The average fibre length of a sample (EN, EN1 or EX) for a certain test of Table 3 or for as-received pellets (PPV20 N) was called SAMPLE
Lj
where j can be n or w for number or weight average lengths. For example, for a certain test of Table 3, EN
Ln
is the number average fibre length of the sample EN, before capillary entrance, and
Averages and standard deviations of fibre diameter and length for the as-received pellets were PPV20N Dn = 13.33 ± 0.02 μm, PPV20N Dw = 13.42 ± 0.04 μm, PPV20N Ln = 490 ± 8 μm and PPV20N Lw = 690 ± 12 μm.
It was assumed that the diameter of glass fibres did not change after the breakage process. Works dealing with the experimental analysis and modelling of glass FB in injection moulding or extrusion supported this assumption.2,3,5–7,16,19–21 For this reason, only the diameter in the as-received pellets was measured in this work.
Quantification of fibre length attrition at the capillary entrance
The abrupt contraction at the capillary entrance, including the inlet angle, might have a significant effect on FB due to fibre–equipment interactions.
The FB at the capillary entrance (FBCE) was quantified by equations (8) and (9) using the samples of test n. 1

Quantification of fibre length attrition after capillary flow
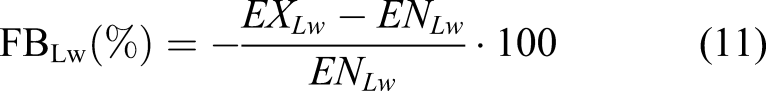
The FB after capillary flow for each test of Table 3 was quantified by equations (10) and (11)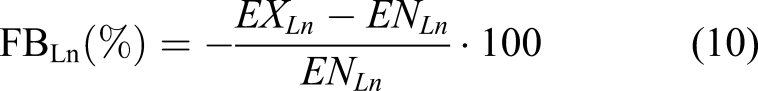
Calculus of uncertainty in the calculation of fibre length attrition
The uncertainty in FB was calculated by equations (12)–(15) for FBCE and FB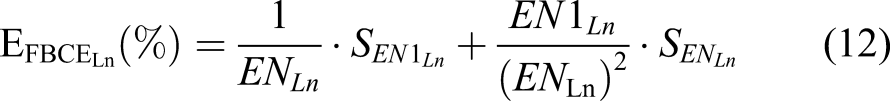
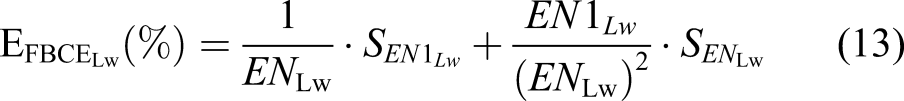
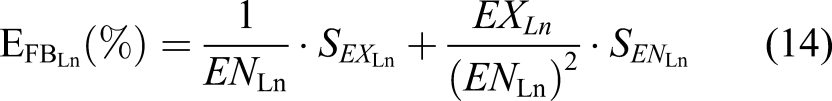
The values are reported as error bars in plots.
Results and discussions
Fibre length attrition by CRIM
Analysis of fibre–equipment and fibre–fibre interactions
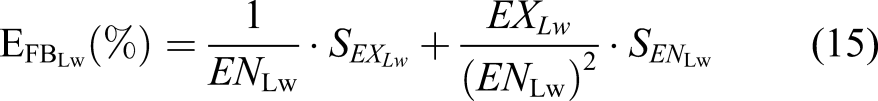
CRIM was designed with a capillary entrance of dimensions BD = 12 mm and CD = 4 mm, which gives a BD-to-CD ratio of 3, with an IA of 90°. In order to study the effect of fibre–equipment interactions in this contraction on fibre length attrition, fibre length distributions in EN and EN1 samples at the strongest flowing conditions (test n. 1: tR = 21 ms, Q = 120 cm3∗s−1) were measured. Figure 4 shows the fibre length distributions of the EN-1 and EN1-1 subsamples of this test. Fibre length distributions of EN-1 and EN1-1 subsamples of test n. 1.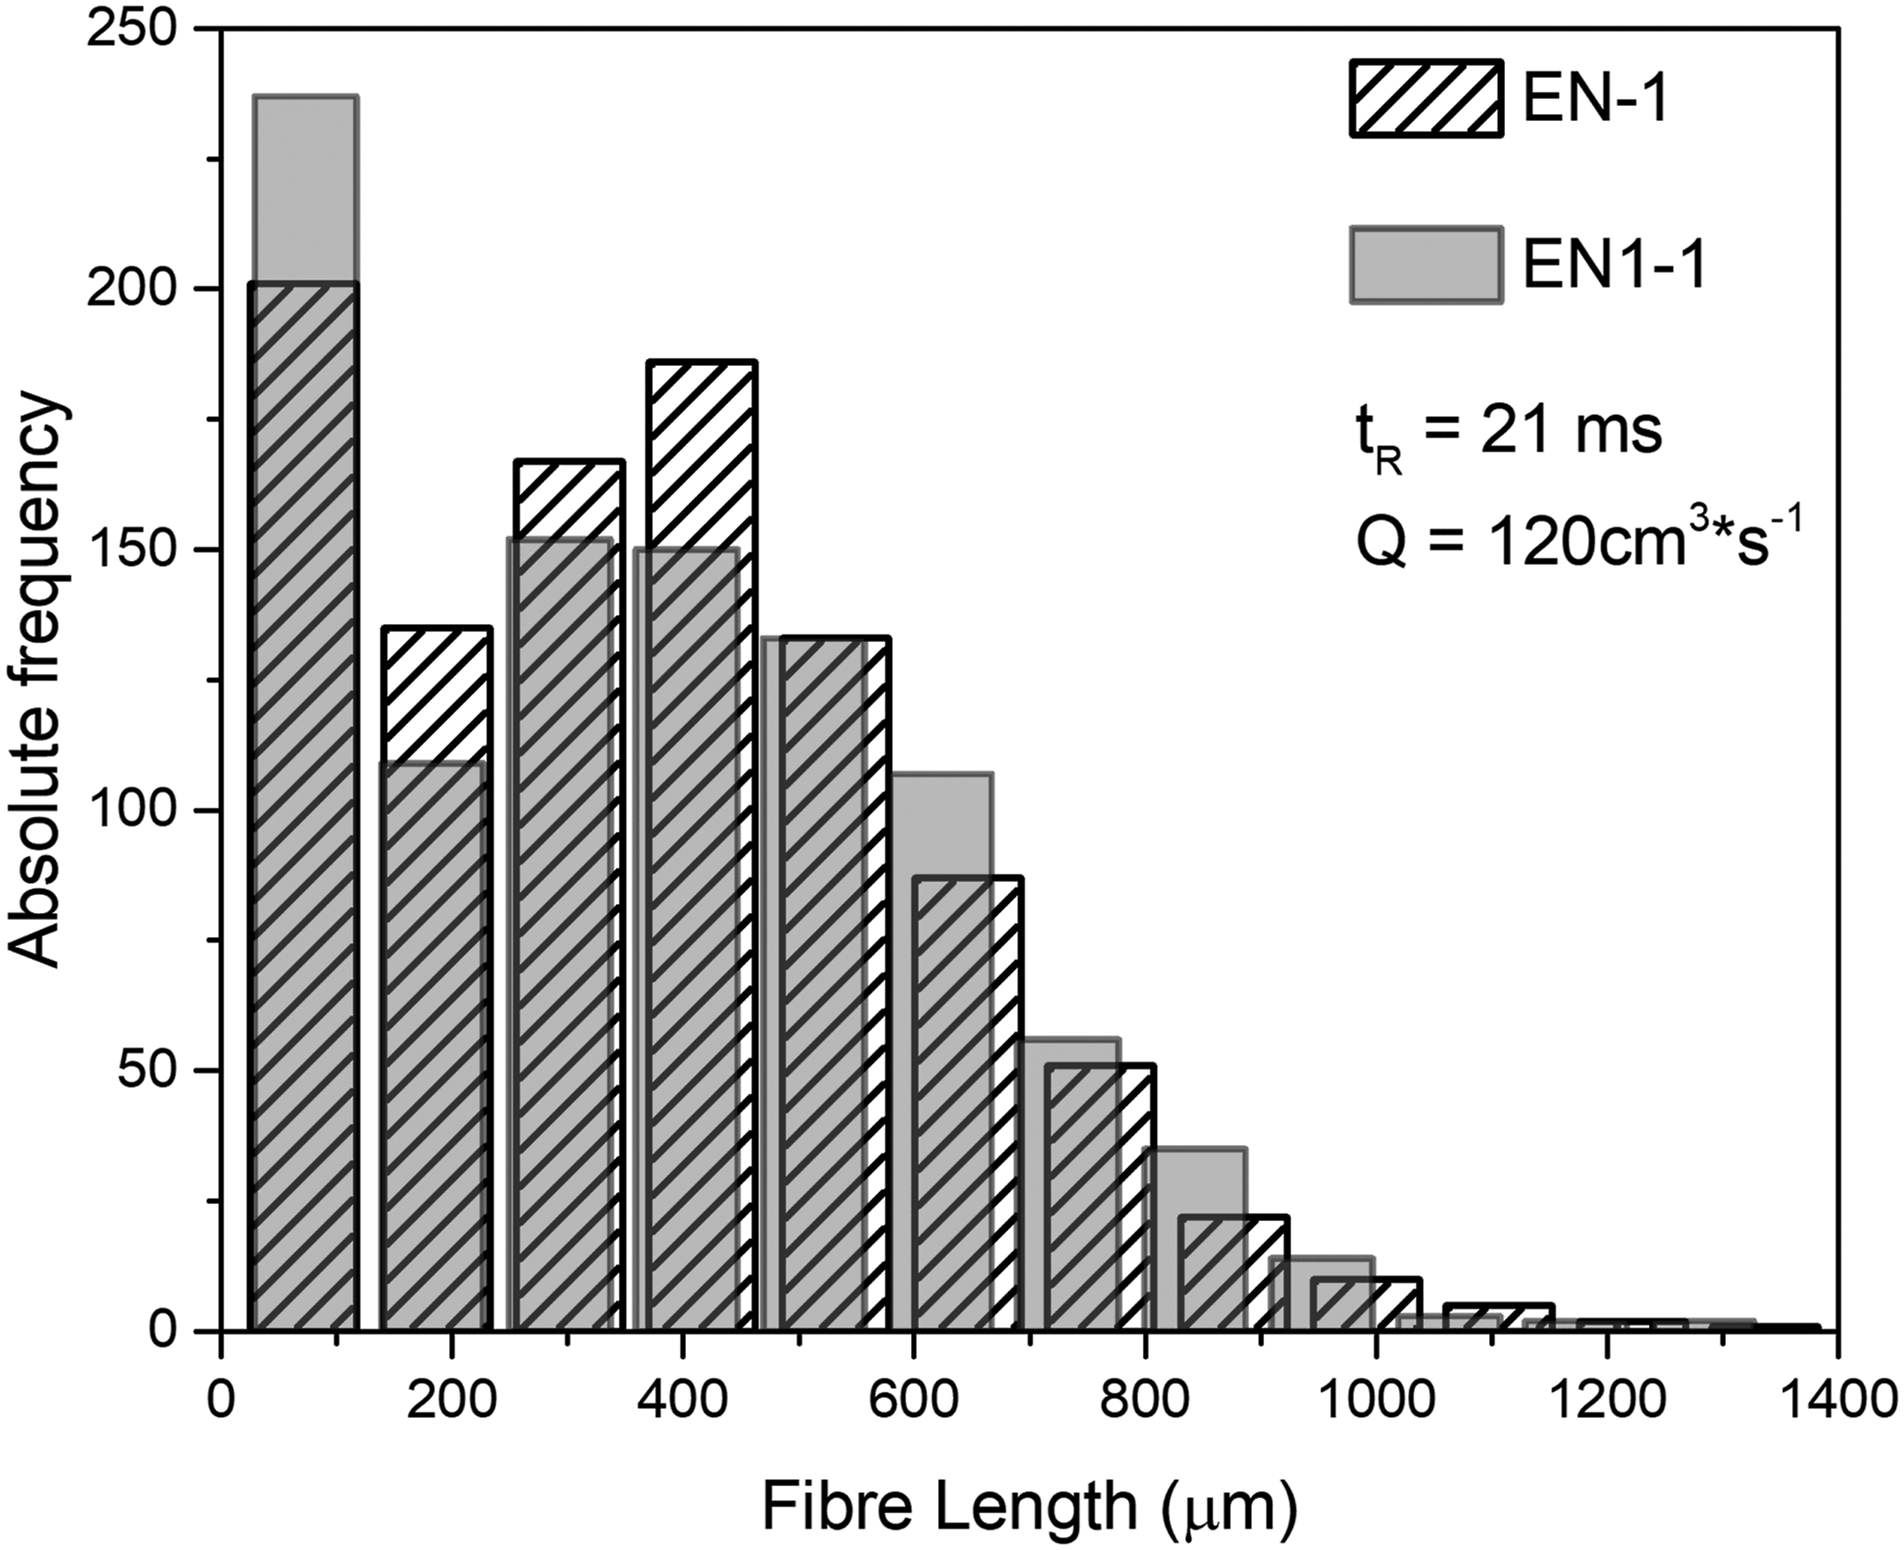
Average fibre lengths and standard deviations of these samples were EN Ln =375 ± 5 μm, EN Lw =524 ± 4 μm, EN1 Ln =374 ± 5 μm and EN1 Lw =520 ± 9 μm. Using these data, the FBCE was calculated. The values were FBCE Ln =0.27 ± 0.02% and FBCE Lw =0.64 ± 0.03%. With these results, we assumed that the CRIM geometrical design for the contraction at the capillary entrance and inlet angle were efficient preventing FB due to fibre–equipment interactions in this zone. Therefore, we proceeded to neglect fibre length attrition at capillary entrance for the next sections.
In this work, the composite materials used for all tests of Table 3 had the same fibre loading, so we also neglected variations in the effect of fibre–fibre interactions on FB for the different test conditions. Goris et al., 8 Quijano-Solis et al. 10 and Moritzer et al. 9 studied the effect of fibre loading on FB using Couette and capillary rheometers. They found increased FB as a function of fibre loading, but the effect was less notorious for fibre contents higher than 30 wt. %, which was attributed to the formation of a rigid network between the fibres.
Effect of residence time
Previous works22,23 studied the effect of shear rate, screw configuration and residence time on FB during compounding, but they did not isolate these parameters in their studies.
The isolation of residence time and its effect on fibre length attrition requires the flow of the composite in a controlled flow field.8,9 In recent works, Goris et al. 8 and Moritzer et al. 9 have isolated the effect of residence time on fibre length attrition of glass fibre polypropylene composites in a Couette flow at shear rates below 500 s−1. The shortest residence time analysed was 2.5 s. Lower times could not be studied due to the poor starting performance of the test rig, which was caused by the high translation of the gear. They found that fibre length achieved the stationary value after 2.5 s shearing at 500 s−1. Phelps et al. 6 validated their FB model, which was implemented in Moldflow and Moldex3D, using 180 mm in diameter and 3 mm in thickness centre-gated disk with a filling time of 0.65 s. Filling times and shear rates for smaller parts, that is microinjection moulding, can be in the order of 10−13 s and 104 s−1, respectively. 24 The Couette rheometers used in the studies of Goris et al. 8 and Moritzer et al. 9 were not able to cover the wide processing window of injection moulding processes, so in some cases, their experimental results will not be useful for understanding the FB dynamics in injection moulding.
In this section, we will analyse fibre length attrition at residence times in the order of 10−13 s and injection flow rate of 120 cm3.s−1, which gives shear rates at wall in the order of 104 s−1 for the conditions of this work.
Figure 5 shows the fibre length distributions of the EN-1 and EX-1 subsamples at different resident times and the PPV20N-1 subsample. Fibre length distributions of PPV20N-1, EN-1 and EX-1 subsamples at different residence times.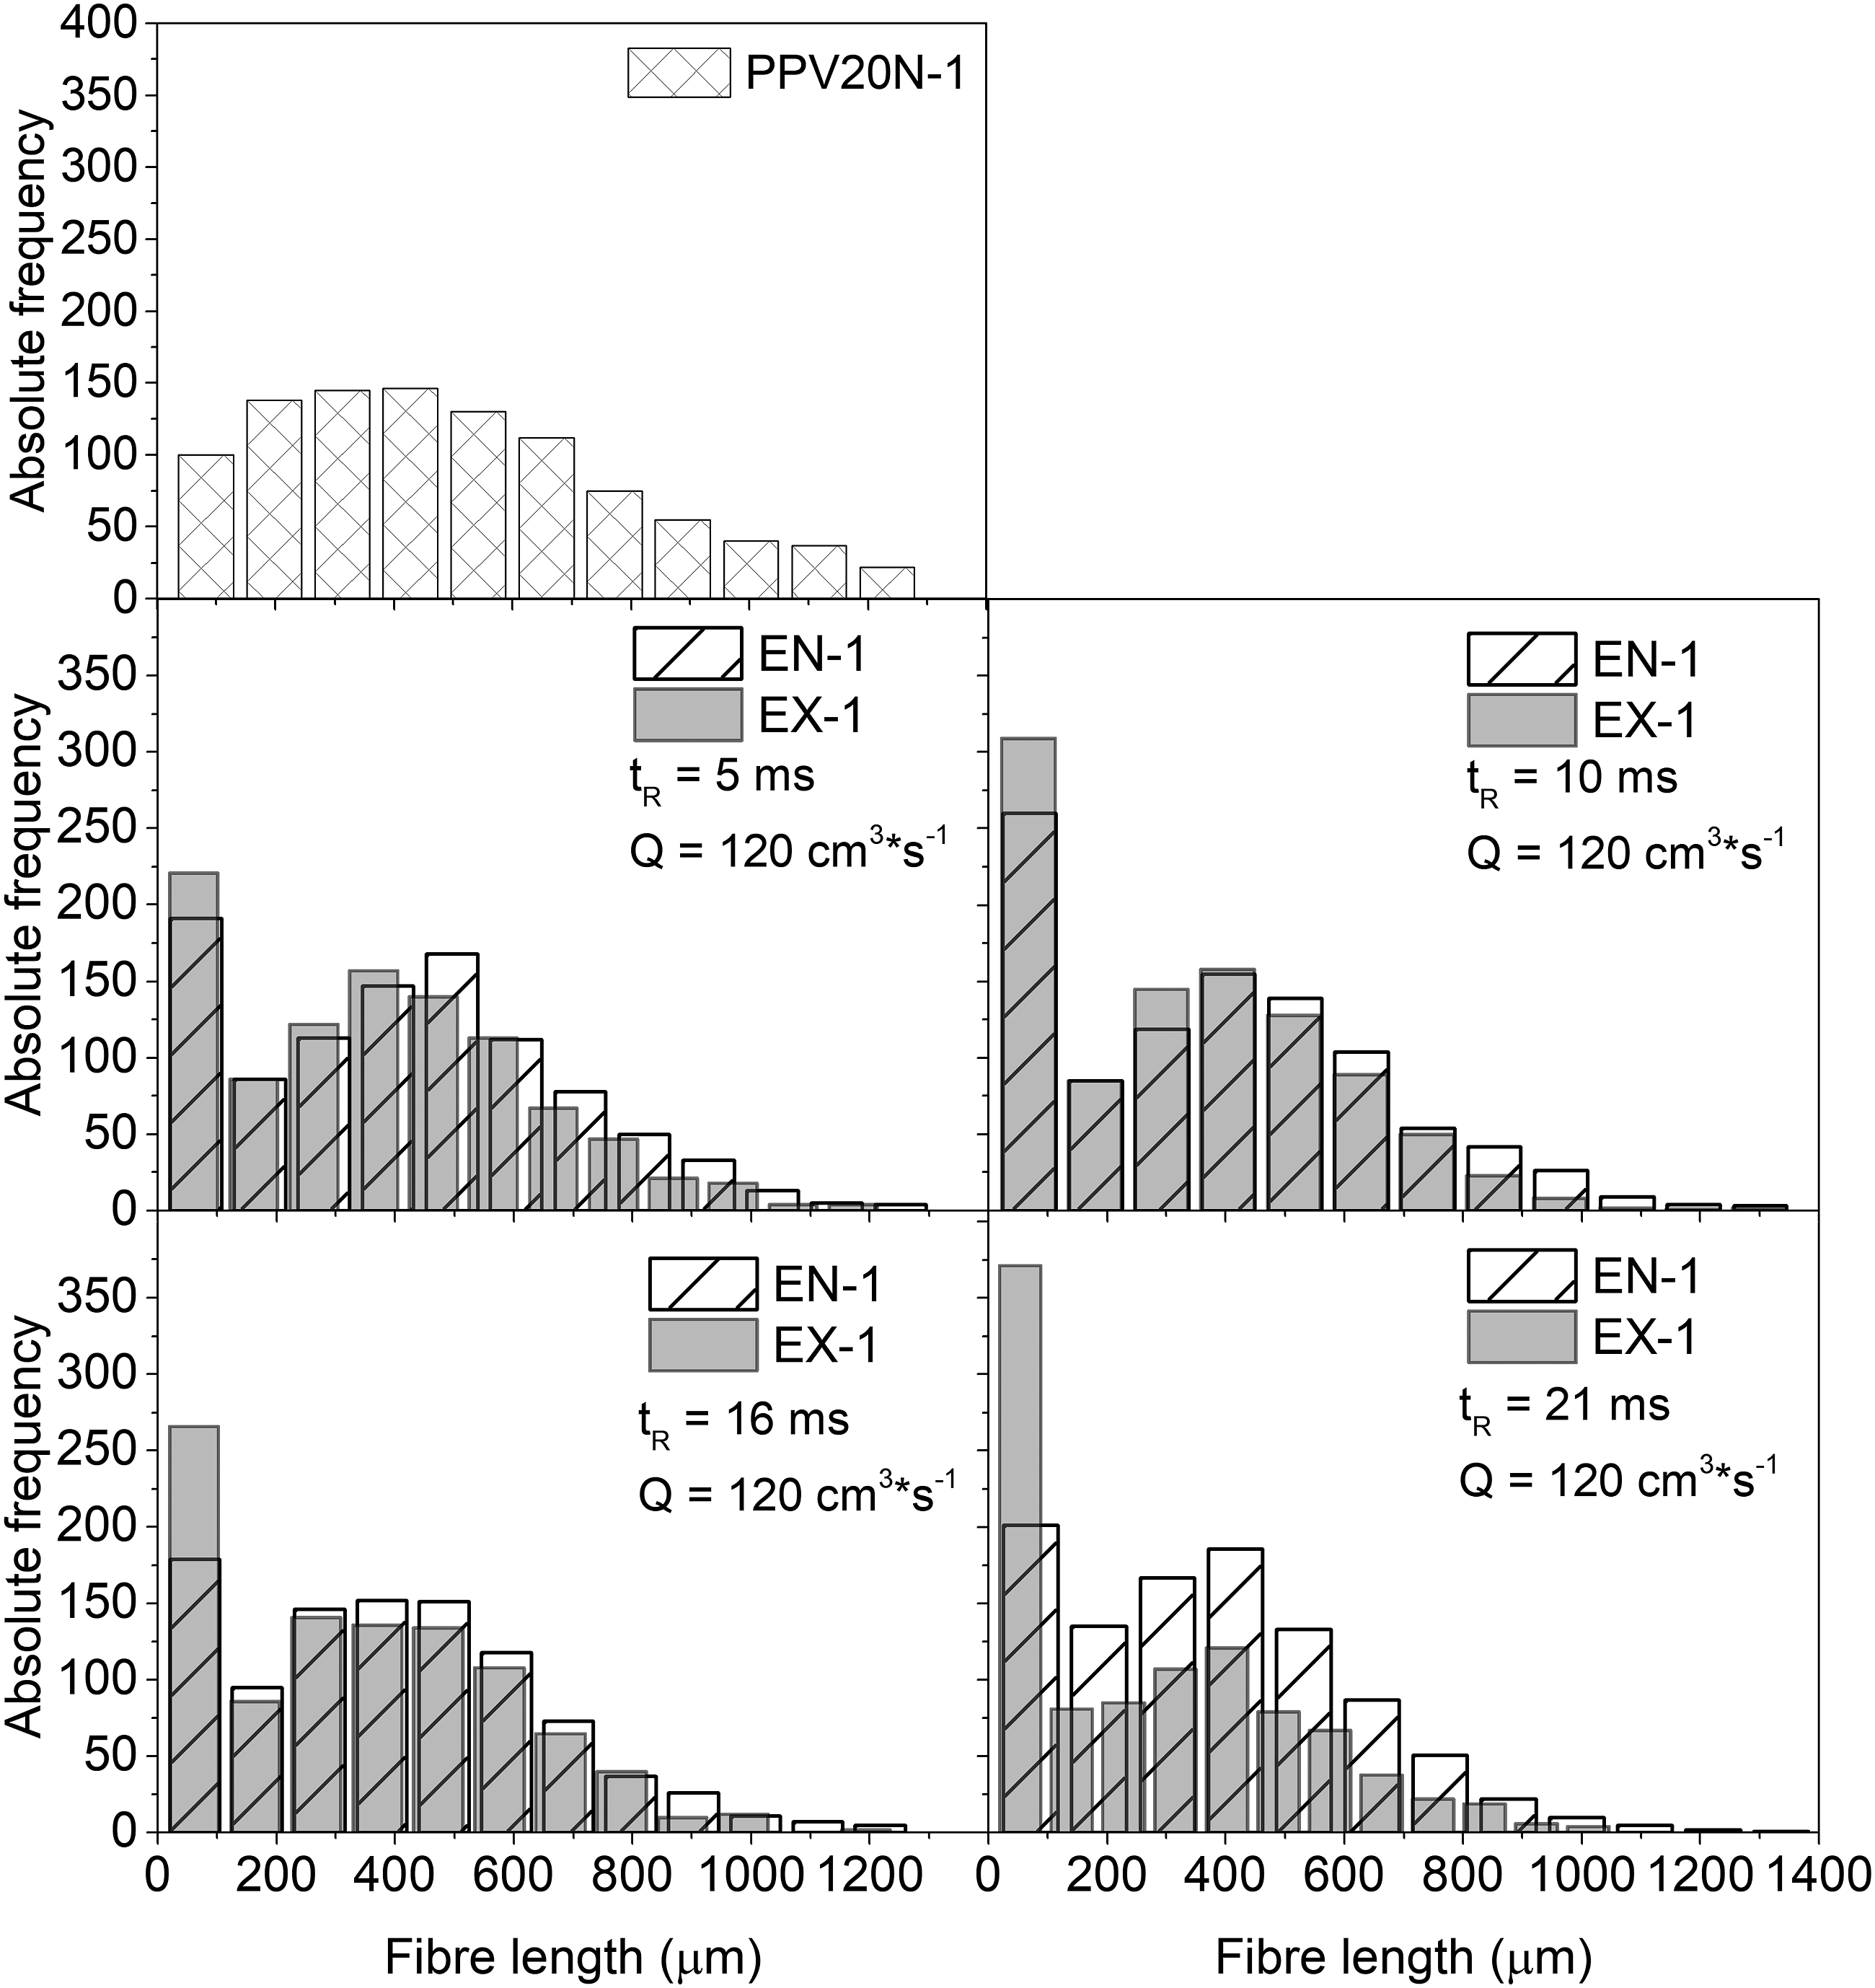
All subsamples studied after plasticisation (EN-i, EN1-i and EX-i) showed a bimodal fibre length distribution. The absolute frequency decreased from 50 μm to 200 μm (fibre length). After 200 μm, the absolute frequency tended to increase, while at around 500 μm started to decrease again. The observed bimodal distribution could be a consequence of the FB after plasticisation in the injection unit. Figure 5 also shows the fibre length distribution of PPV20N-1 subsample extracted from the as-received pellets (before plasticisation). In this case, a unimodal fibre length distribution was observed. It has been demonstrated that most FB in an injection moulding process occurs in the screw during the plasticisation stage.1,2 The peak at lower lengths observed in the bimodal fibre length distributions of the EN-1 subsamples was a consequence of the FB after plasticisation. The peak at lower lengths became more intense after capillary flow (EX-1 subsamples) due to the FB by CRIM. The fibre length for the maximum absolute frequency of this peak (around 50 μm) can be assigned to the “unbreakable fibre length” defined by Phelps et al. 6
Figure 6(a) and (b) resumes the average fibre lengths of the samples and their standard deviations. Average fibre lengths and standard deviations for EN and EX samples at different residence times: a) number average and b) weight average.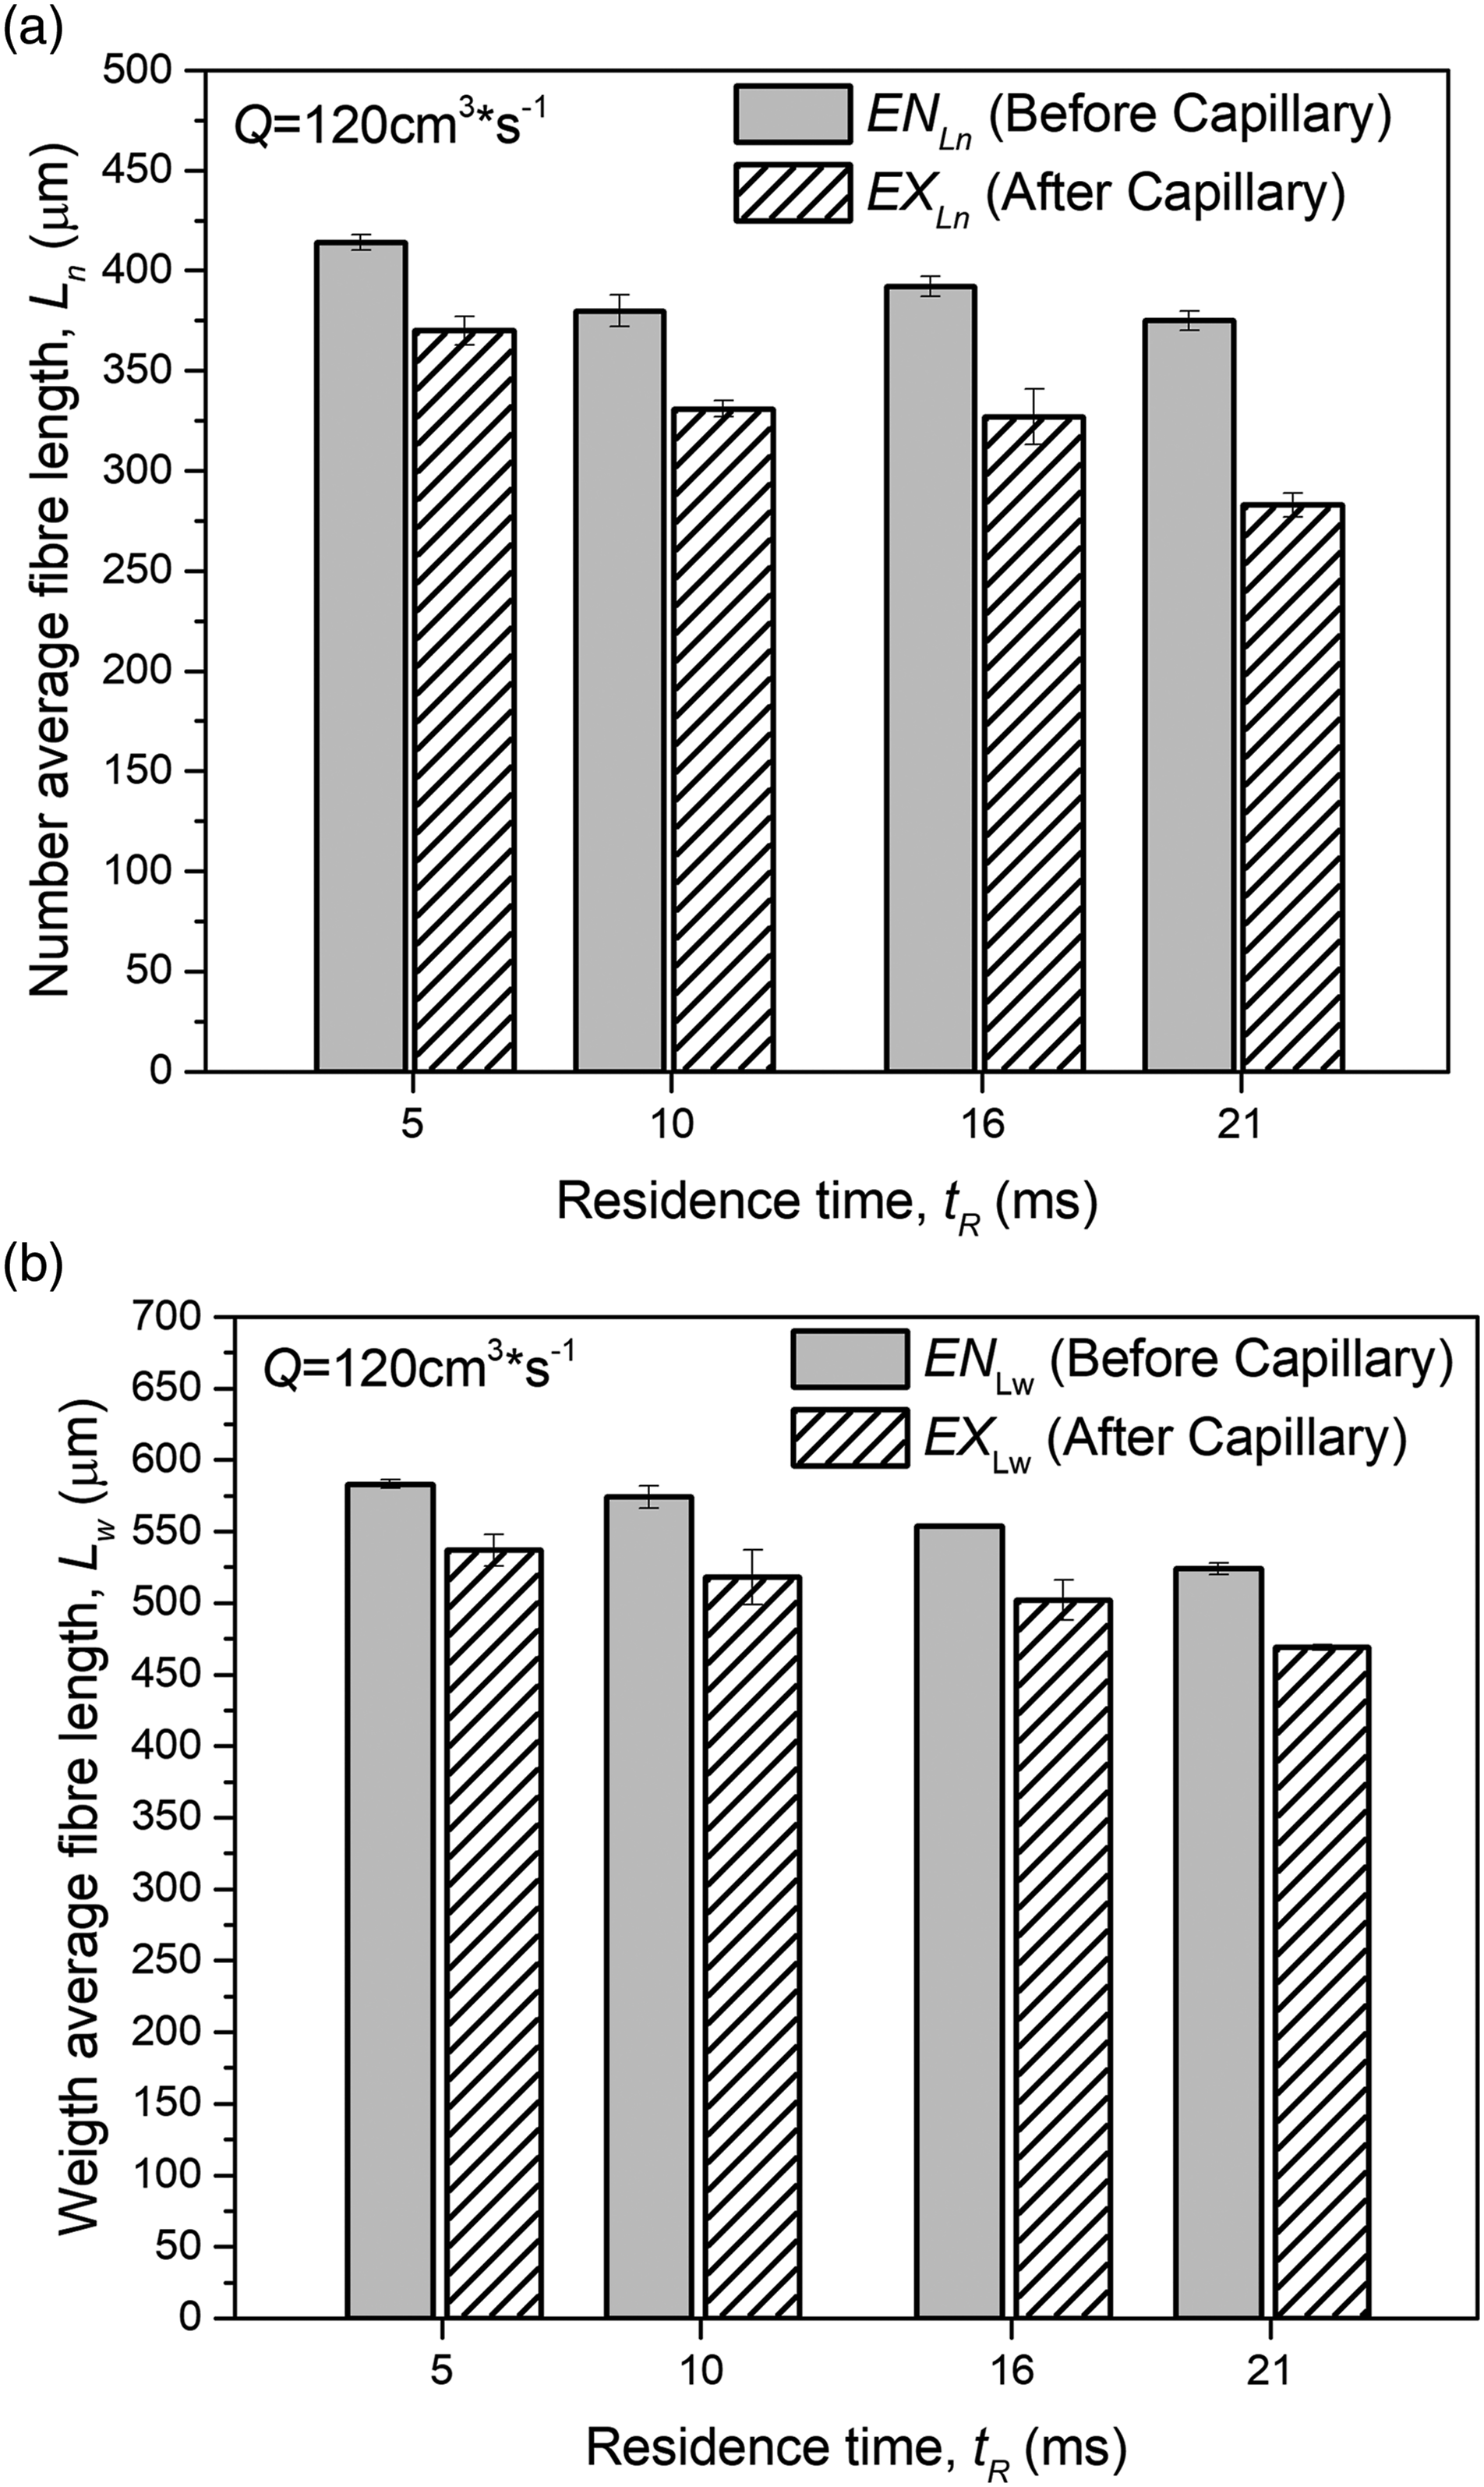
Average fibre lengths for samples randomly extracted from as-received pellets.
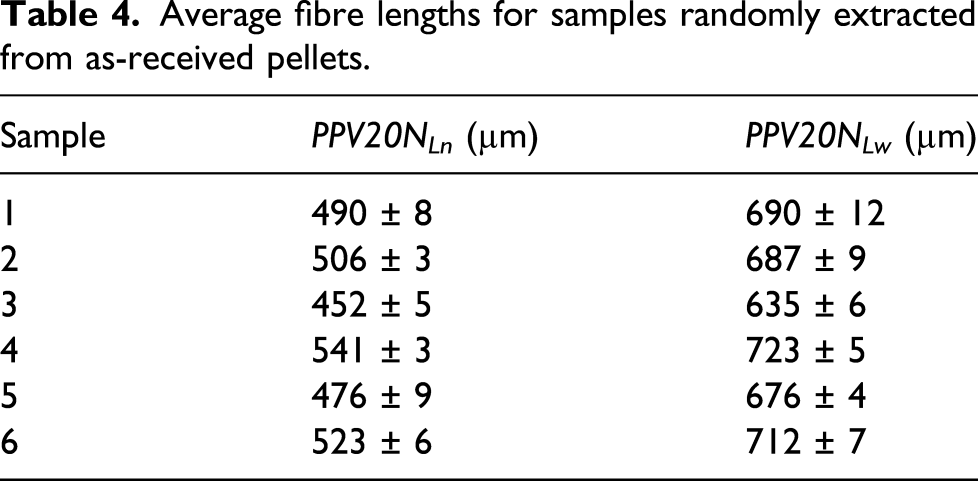
Average fibre lengths in the different PPV20 N samples had random values in the range from 452 μm to 541 μm for number average lengths and from 635 μm to 723 μm for weight average lengths. This result explained the differences found in the average fibre lengths of the EN samples as a function of residence time. It also brought out the need of measuring both fibre length distributions before and after capillary flow for each test in order to quantify FB.
Figure 7 shows the FB values as a function of residence time. Effect of residence time on fibre breakage.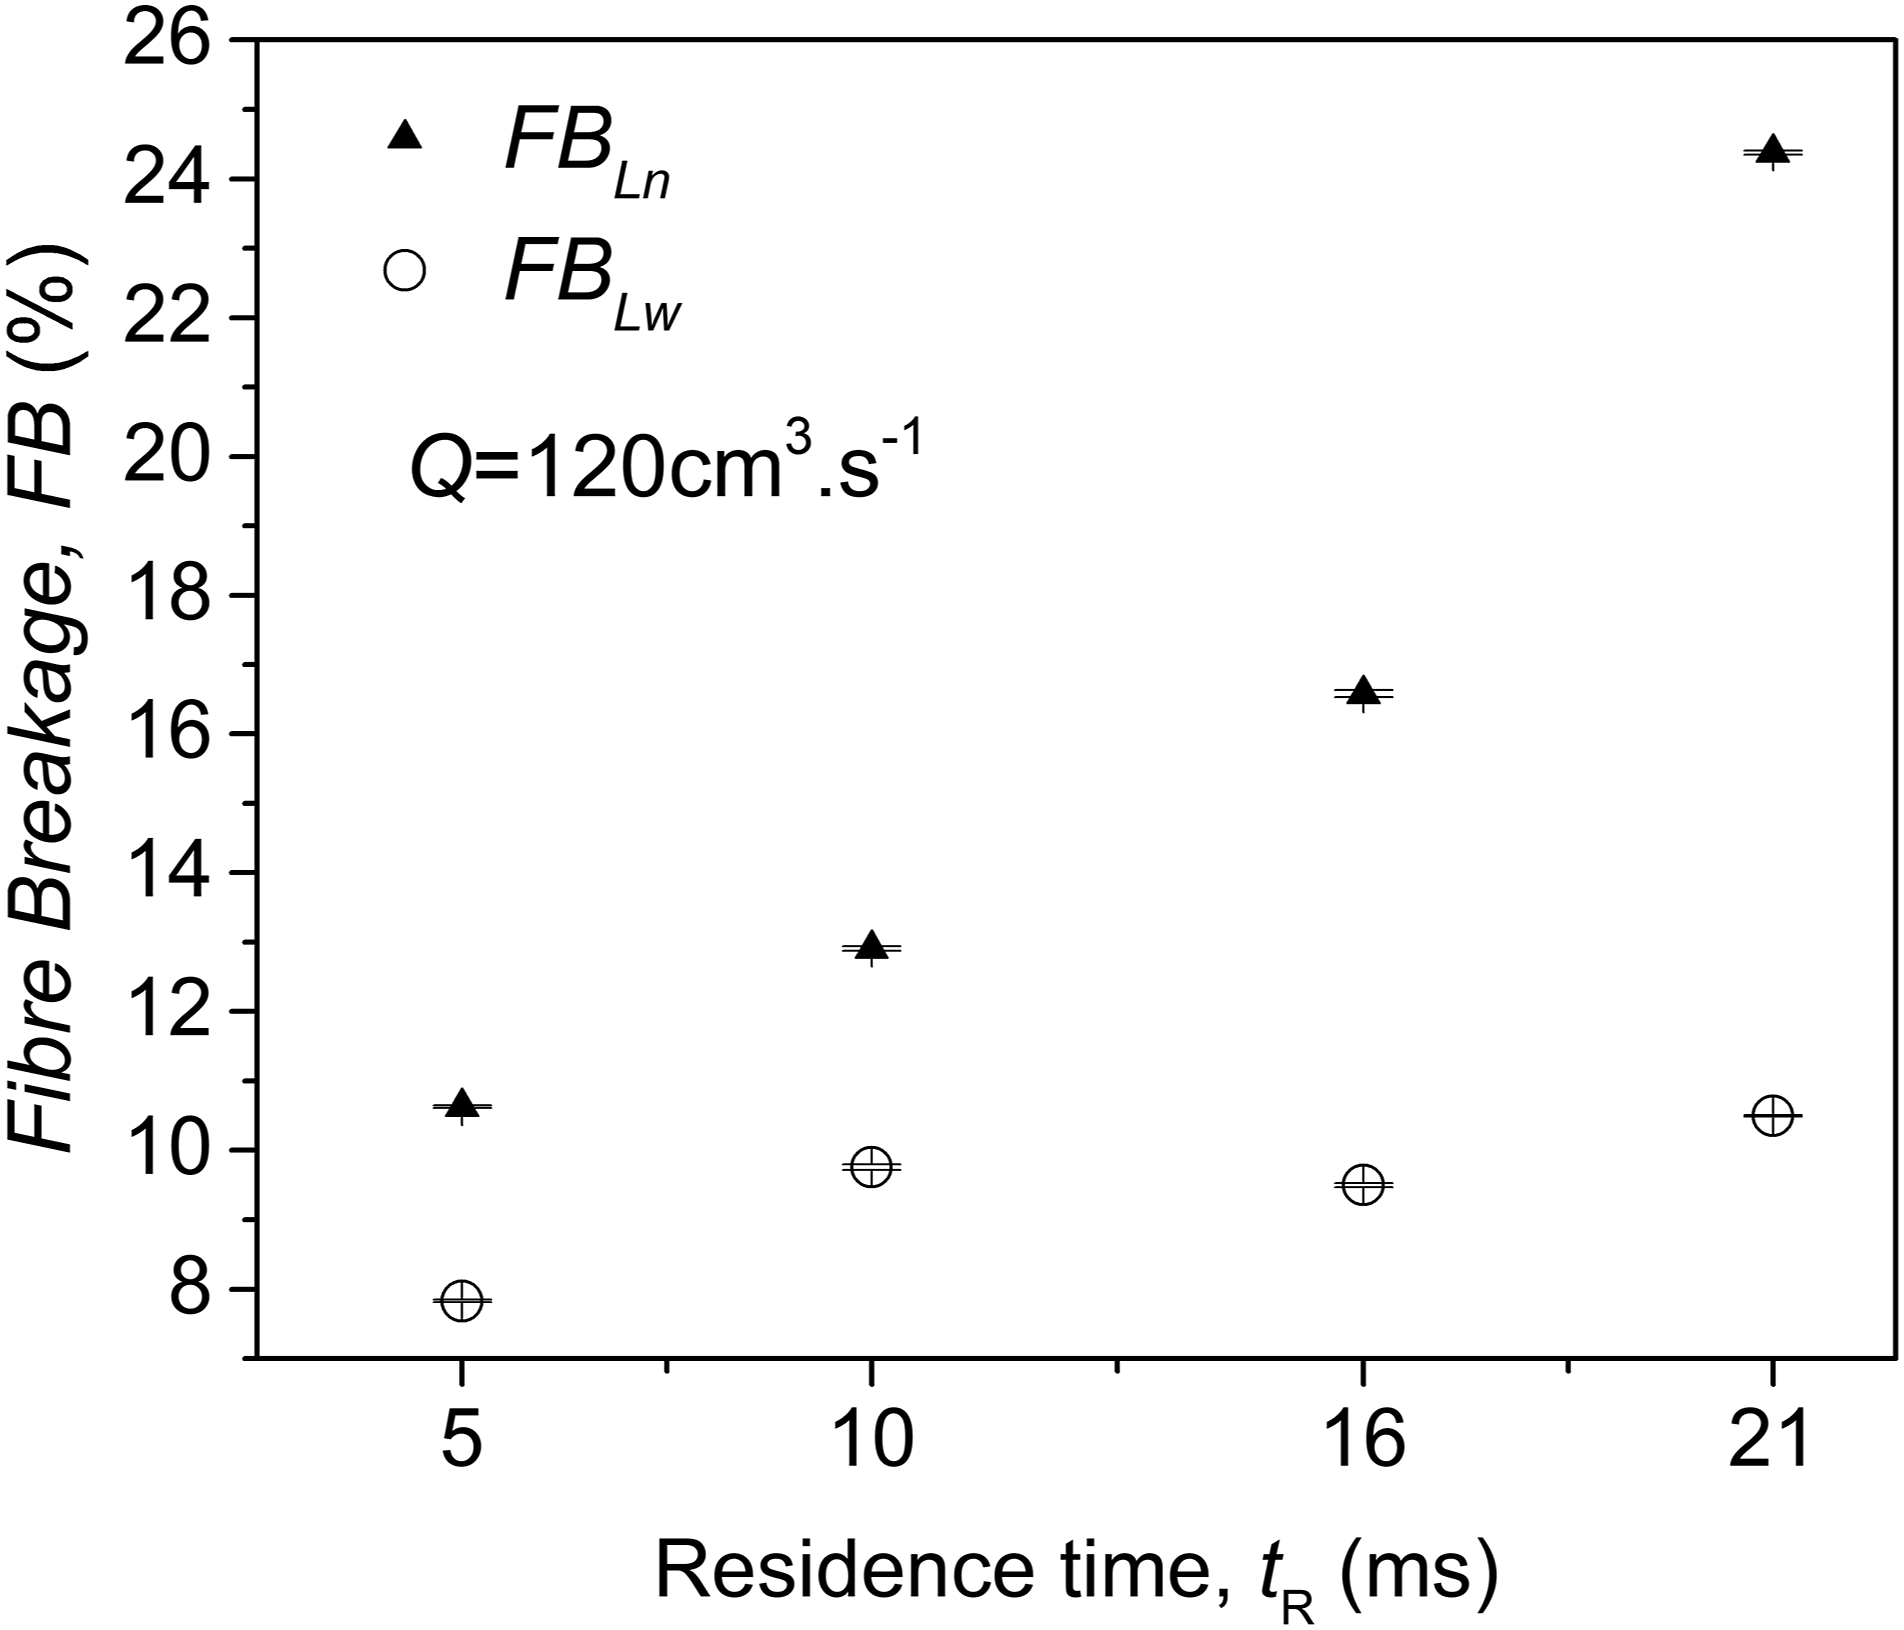
It can be observed that residence time is a parameter that promoted FB. Even at short time increments, in the order of 10−13 s, FB increased significantly.
Moritzer et al. 9 also found strong dependence of fibre length attrition with residence time for 20 wt.% short glass fibre polypropylene composites in a Couette flow at shear rates below 500 s−1 and residence times above 2.5 s. They found 30% of reduction in the average length for the strongest hydrodynamic condition. Similar experimental set-up was used by Goris et al. 8 but using 30 wt.% long glass fibre reinforced polypropylene composites measuring 90% of reduction in the average fibre length at similar flowing conditions. It should be taken into account that the results for fibre length attrition shown by Goris et al. 8 and Moritzer et al. 9 may be influenced by polymer–equipment interactions because of the similar size of the gap between cylinders and fibre length and centrifugal forces that migrate fibres to the outer cylinder promoting fibre–equipment interactions.
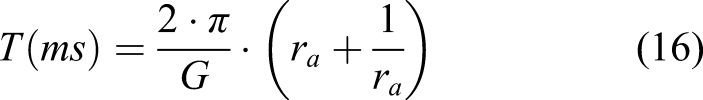
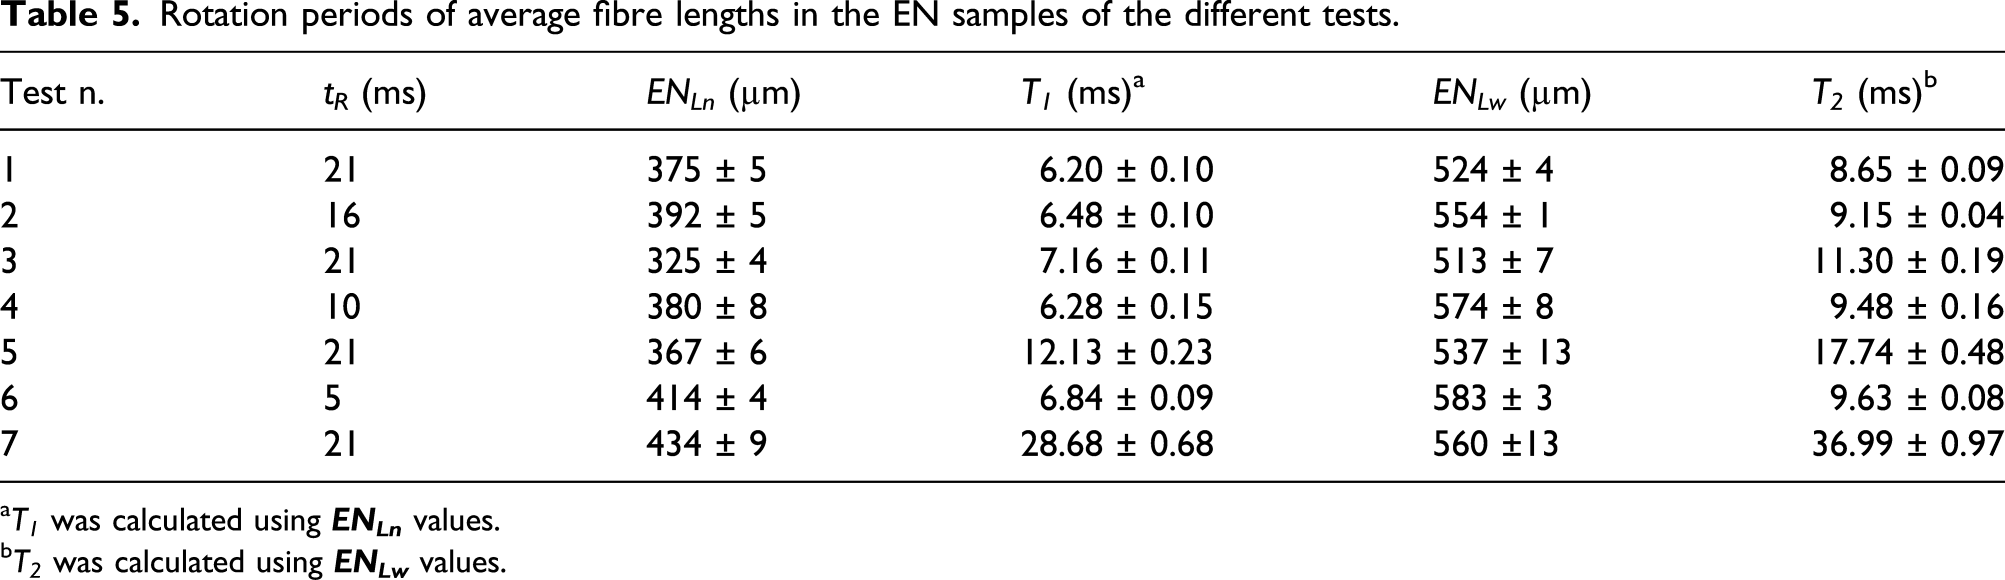
Rotation periods of average fibre lengths in the EN samples of the different tests.
aT
1
was calculated using
bT
2
was calculated using
It can be observed that for a given test, the rotation periods for the average fibre lengths of the samples were similar than the residence time. It should be noted that the accuracy in the T calculation could be improved since the shear rate at wall was calculated neglecting viscous heating and wall slip.
Effect of injection flow rate
Figure 8 shows the fibre length distributions of the EN-1 and EX-1 subsamples at different injection flow rates. Fibre length distributions of EN-1 and EX-1 subsamples at different injection flow rates.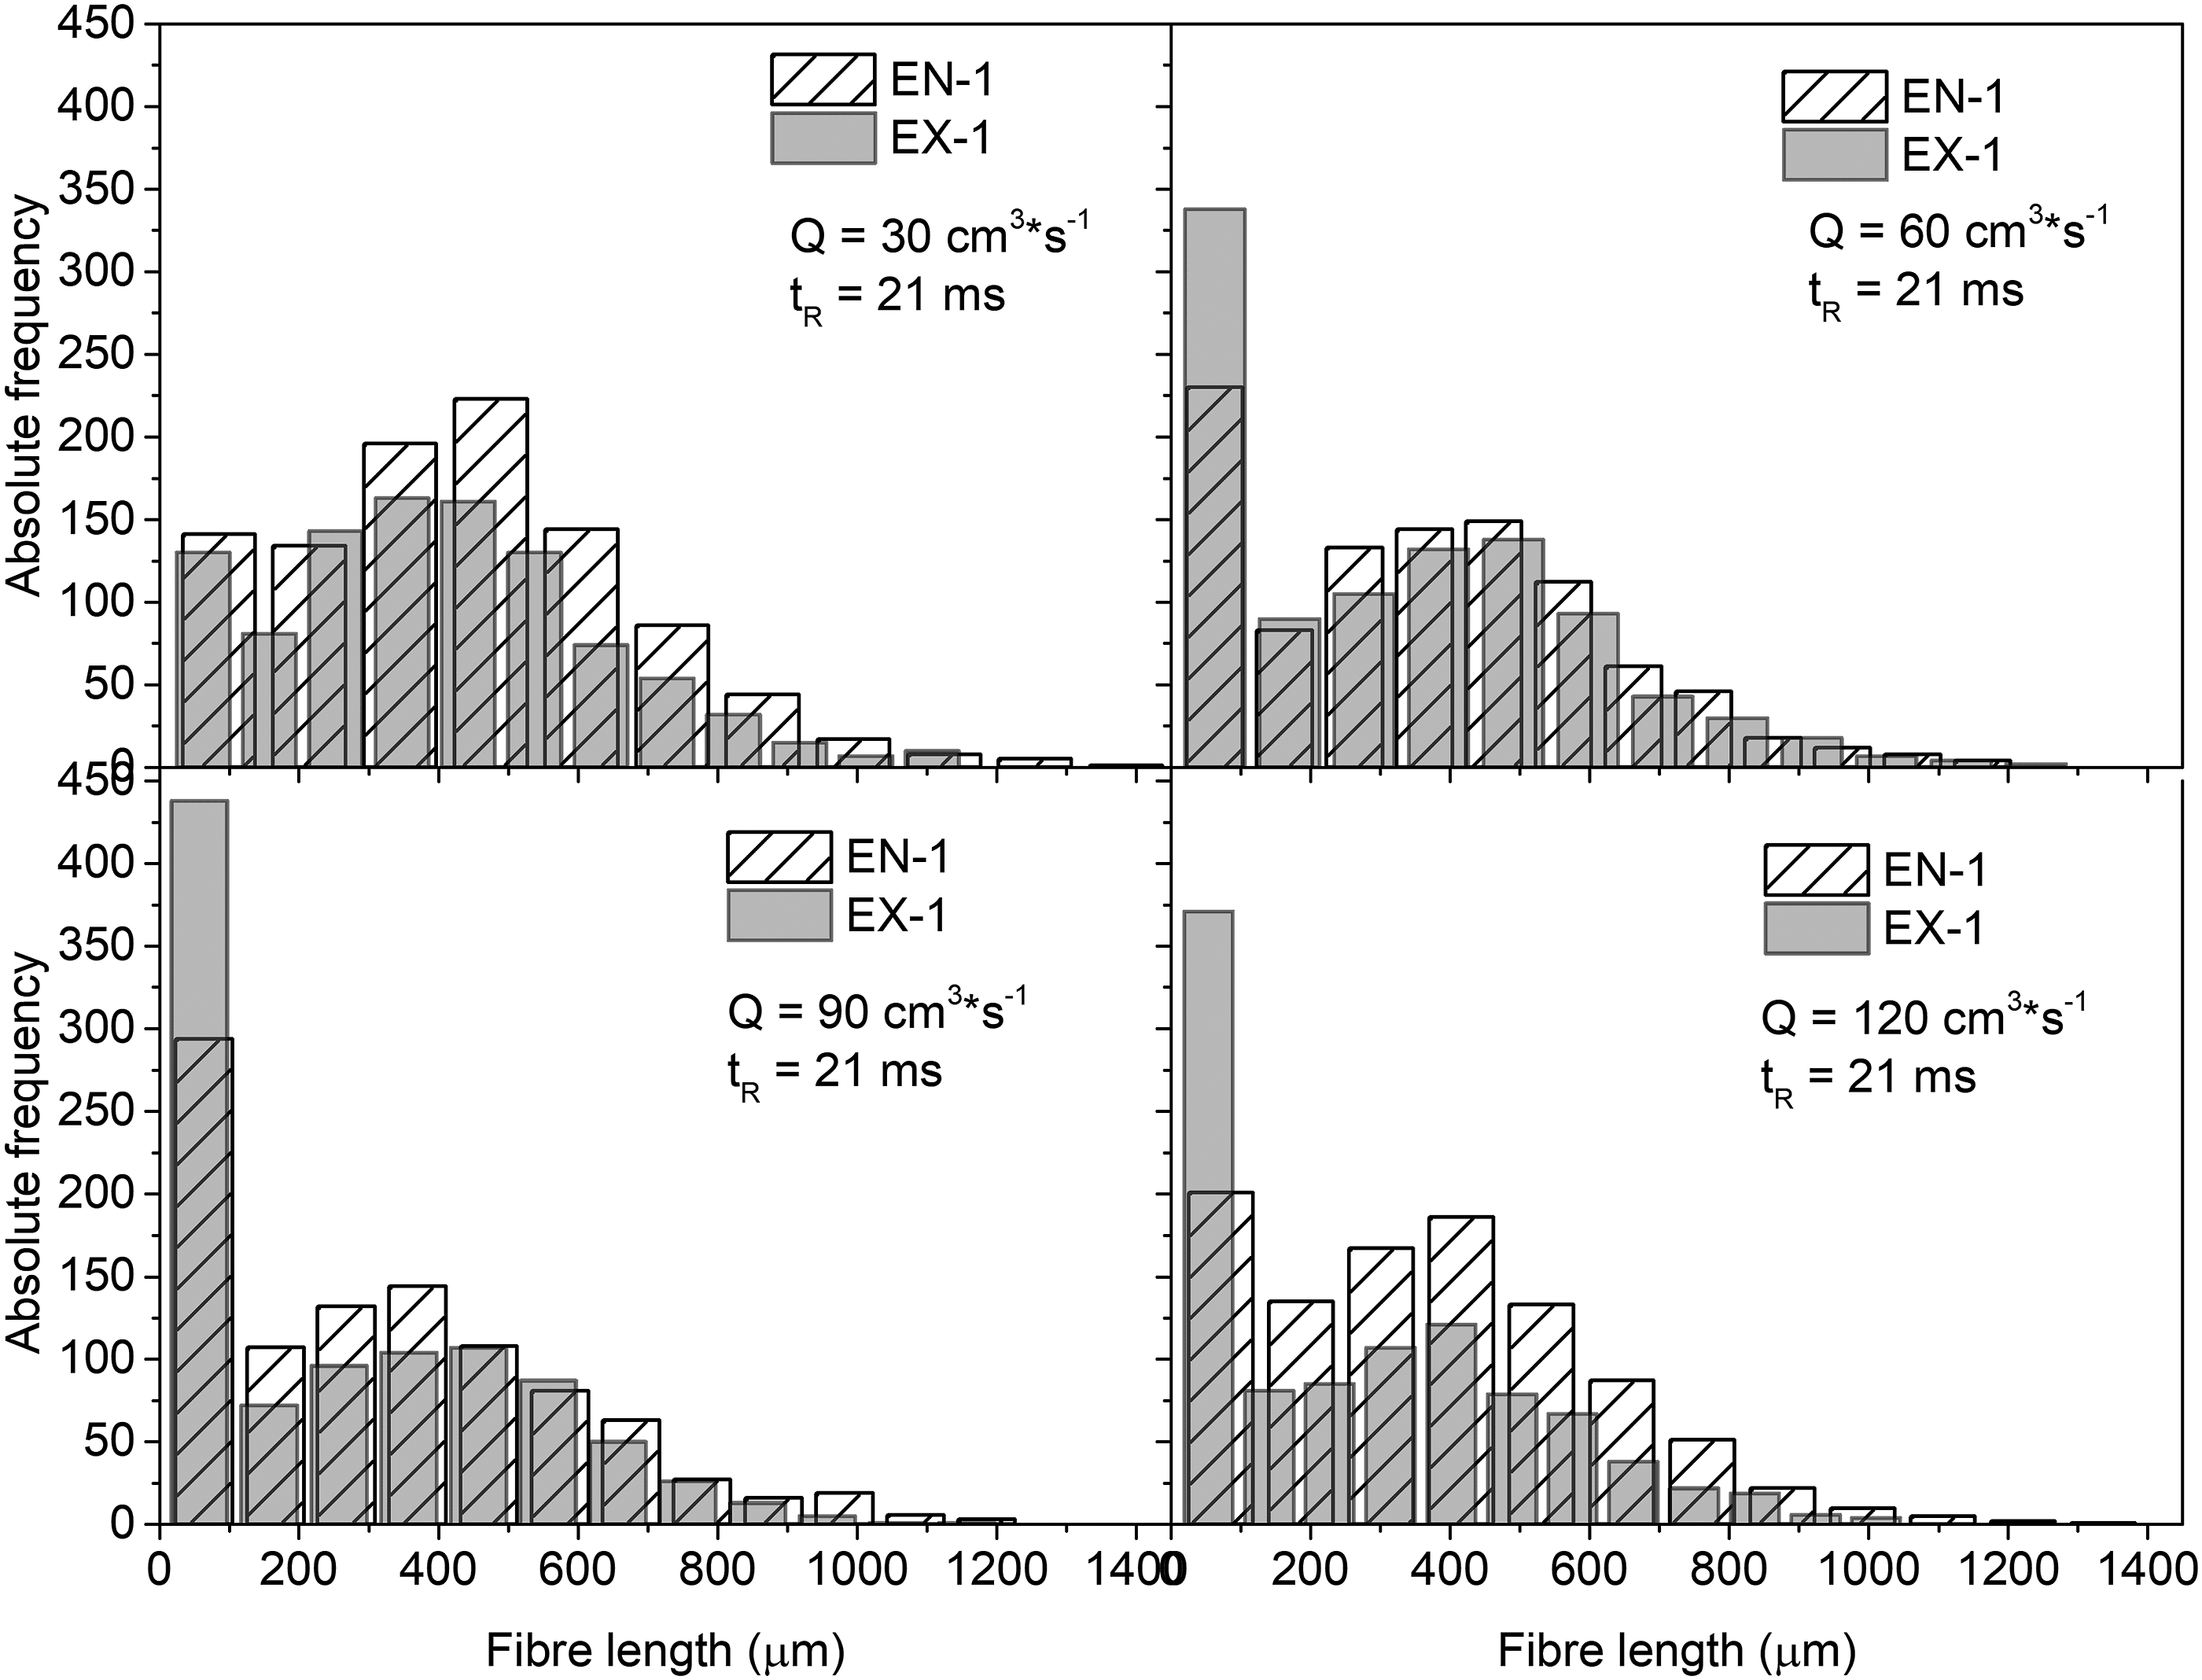
Figure 8 shows the same trends as Figure 5. Bimodal fibre length distributions were observed for EN-1 subsamples due to FB after plasticisation. In addition, the peak at lower lengths for EX-1 subsamples became more intense due to the FB process by CRIM.
Figure 9(a) and (b) resumes the average fibre lengths and their standard deviations. Average fibre lengths and standard deviations of EN and EX samples for the different injection flow rates: a) number average and b) weight average.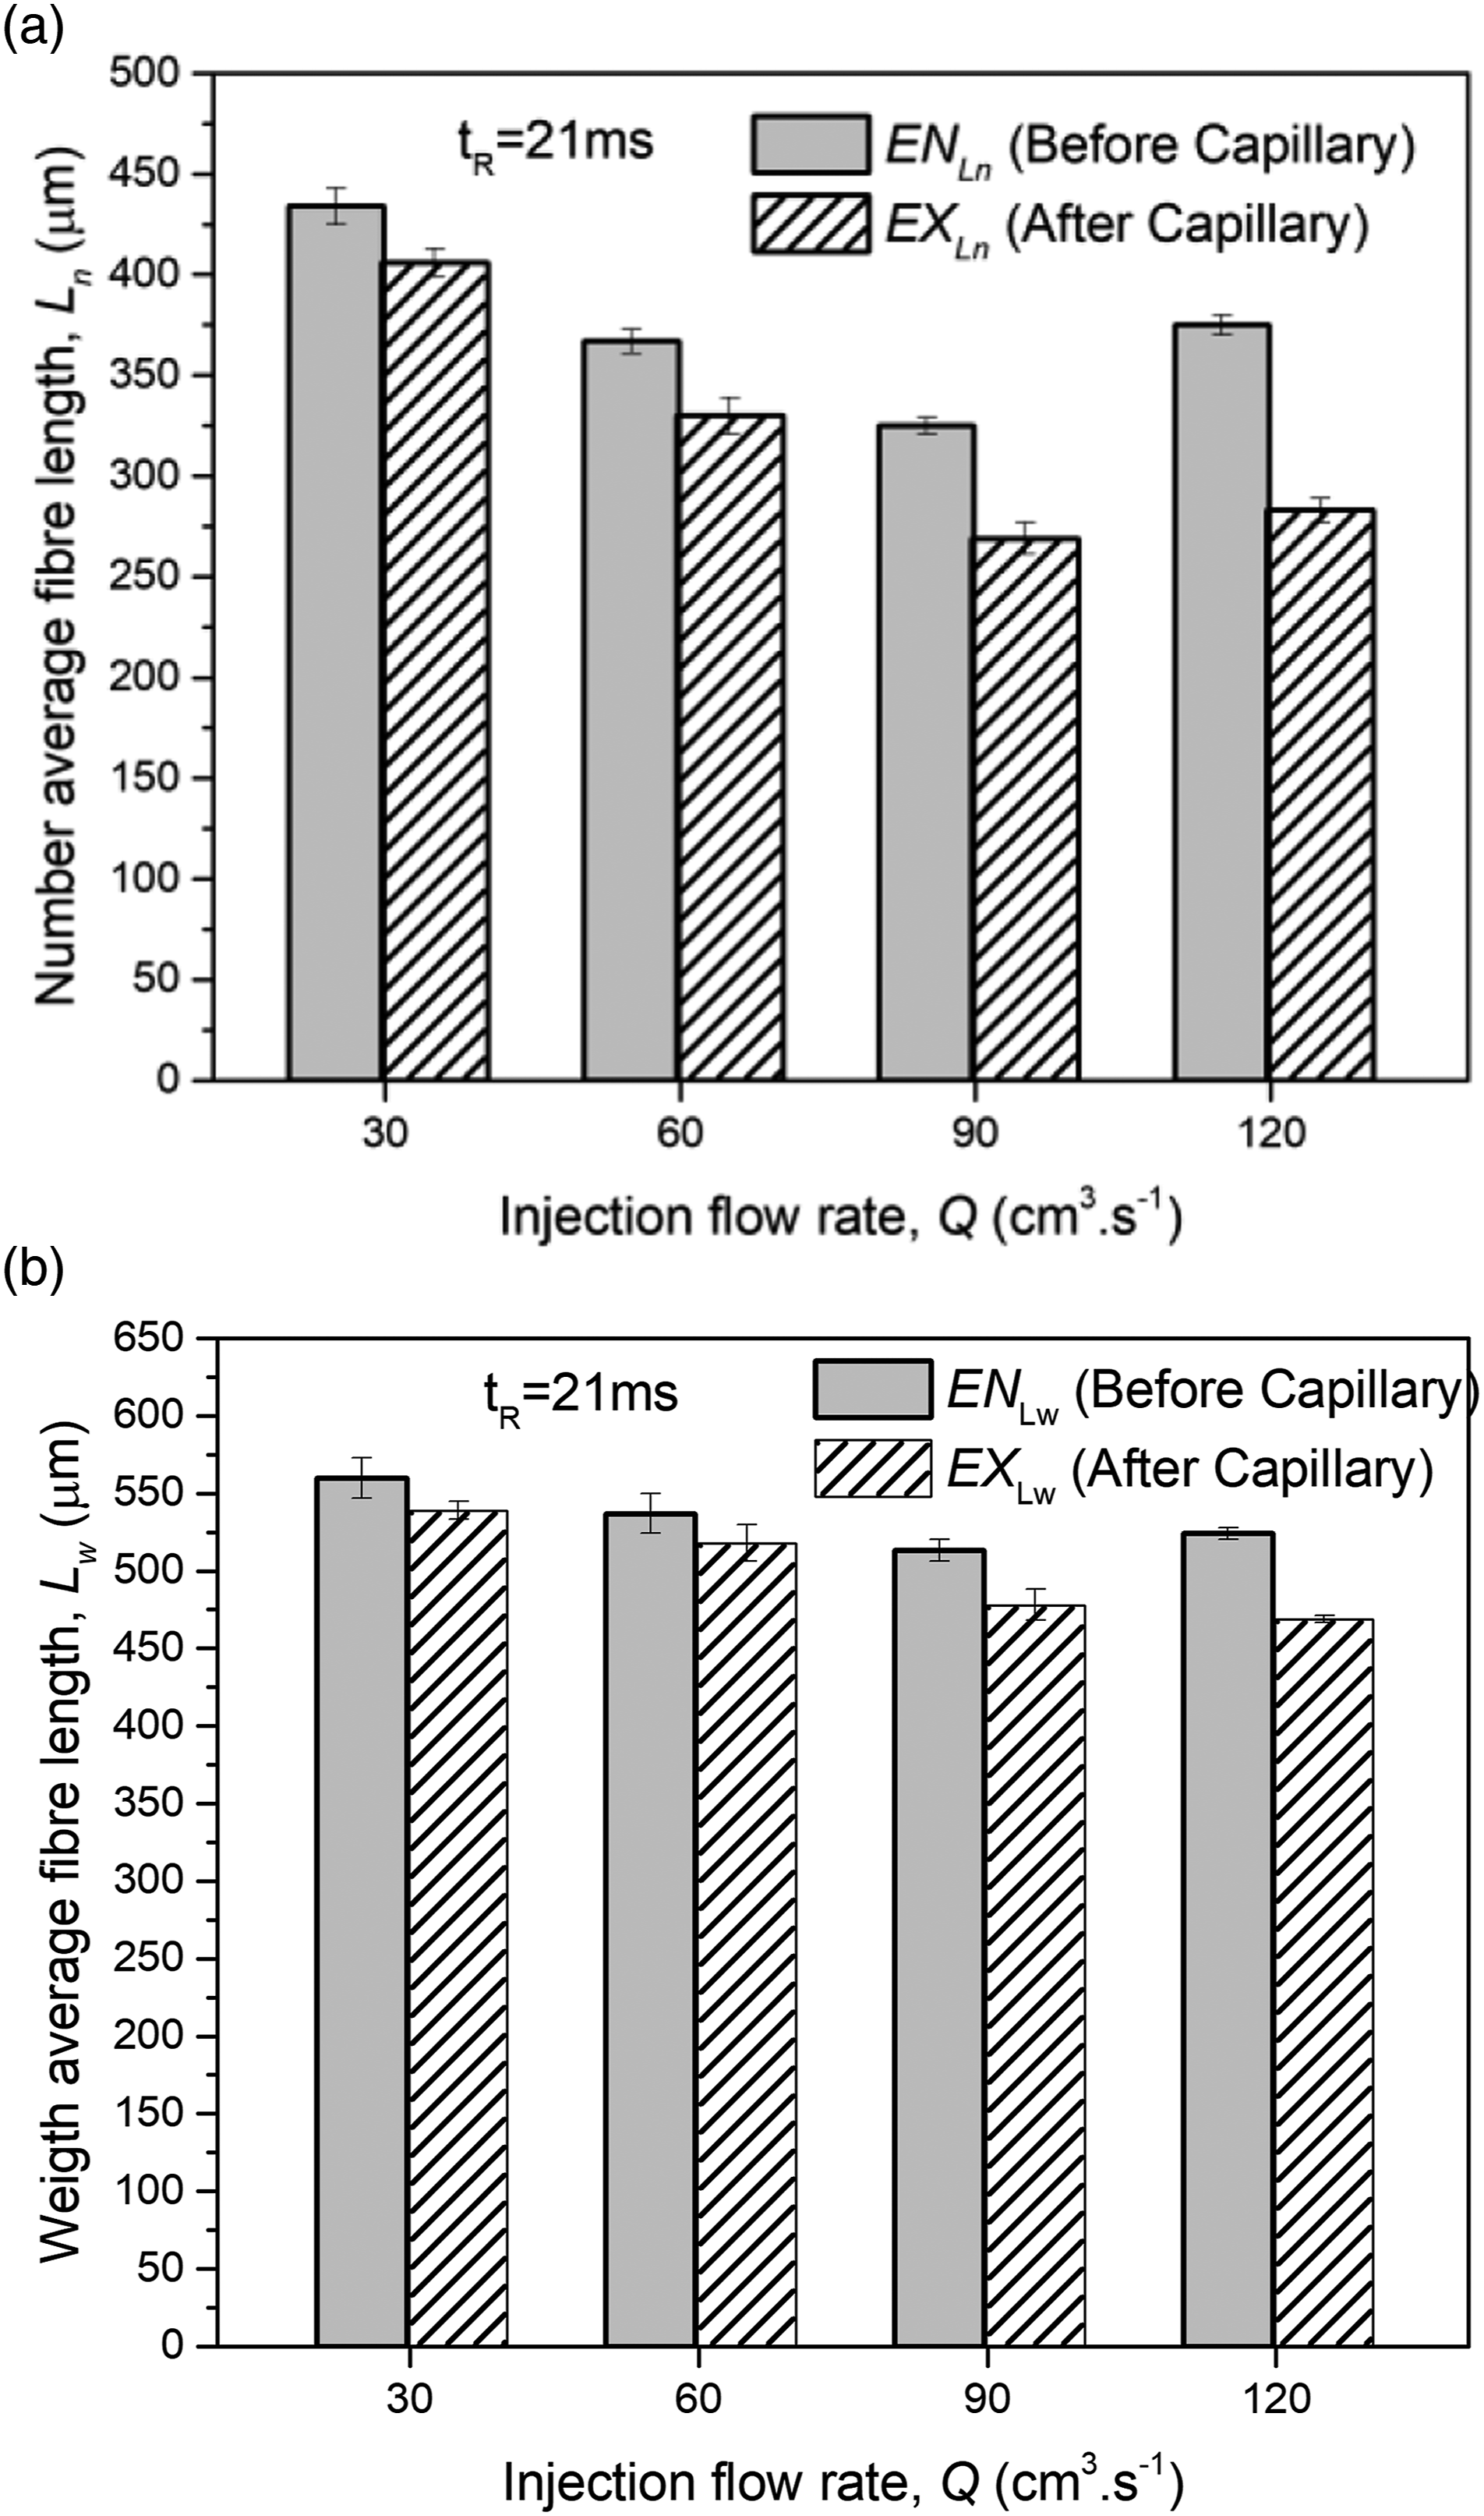
It can be observed that the average fibre lengths of the EN distributions changed randomly as a function of injection flow rate which can be attributed to the dissimilar fibre length distributions in different samples of the same batch of the as-received pellets (PPV20 N) shown in Table 4.
Figure 10 shows the FB values as a function of injection flow rate. Effect of injection flow rate on fibre breakage.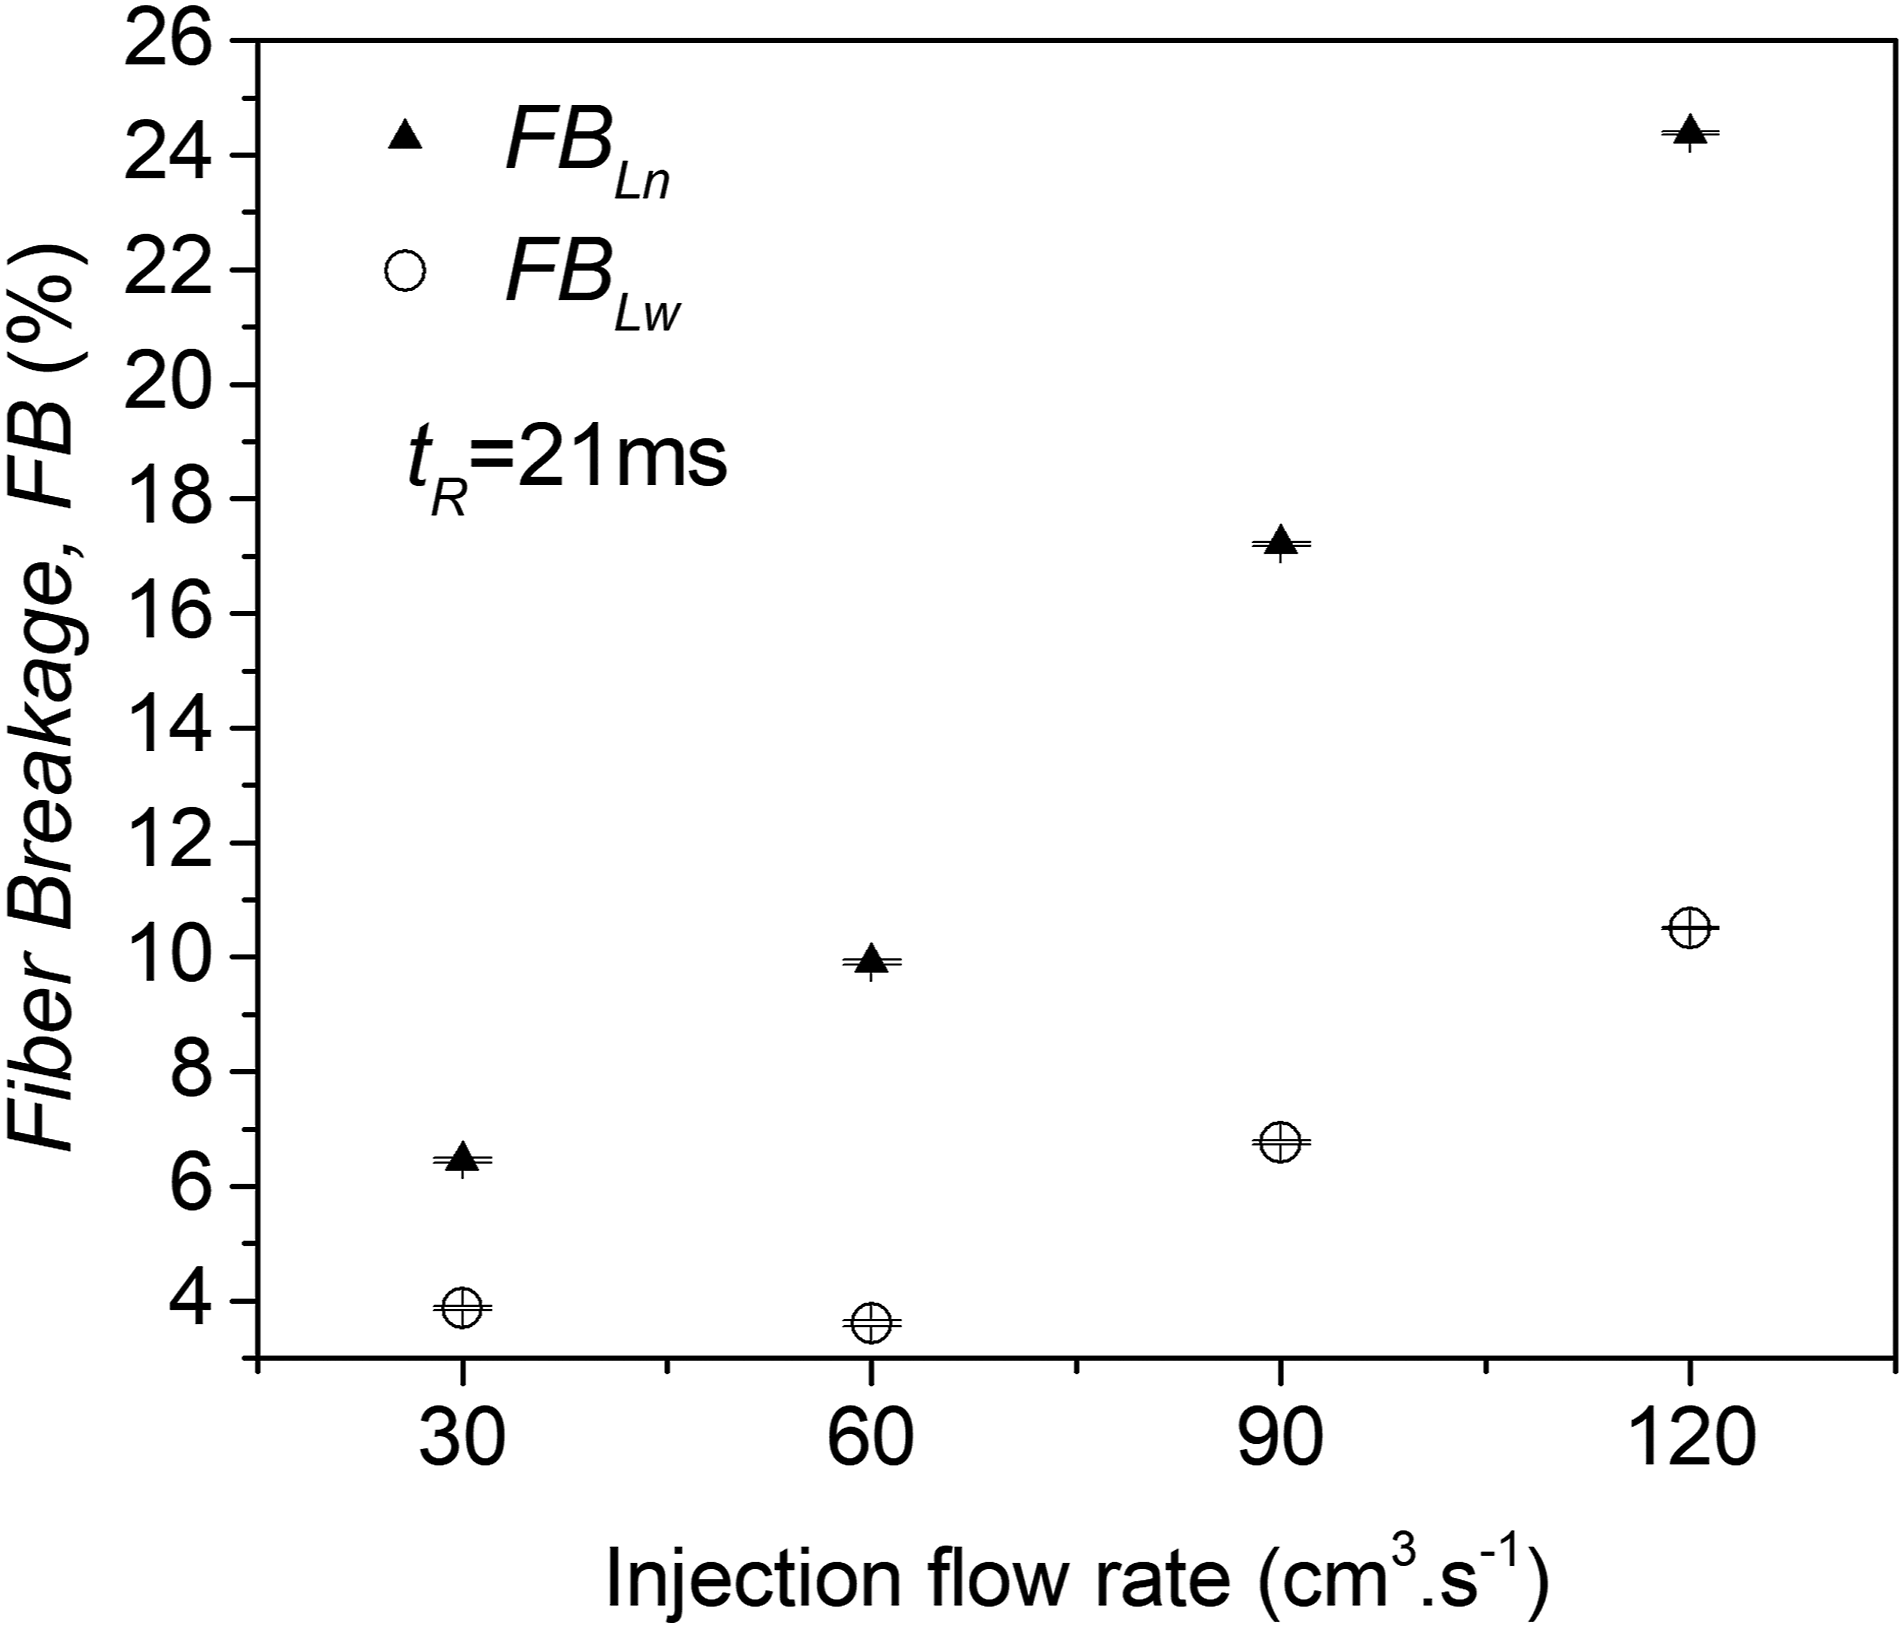
It can be observed that FB
Lw
was lower than FB
Ln
for all injection flow rates. On the other hand,
Moritzer et al. 9 found more than 10% of reduction in the number average length for the strongest hydrodynamic condition studied in their work (230°C, shear rate below 500 s−1) after shearing 2.5 s for 20 wt. % short glass fibre polypropylene composites with initial number average length of 856 μm. The stationary fibre length was achieved after 10 s showing 30% of reduction in the number average fibre length. We found only 3% of reduction in the number average fibre length after shearing 21 ms at 190°C with an injection flow rate of 30 cm3.s−1, which gives an apparent shear rate at wall of 7092 s−1, for a composite with the same fibre content as Moritzer et al. 9 An accurate identification of the cause could not be clearly made. Different mechanisms acting simultaneously could be responsible of this result. First, the initial fibre length in the work by Moritzer et al. 9 was slightly higher than those reported in this work, so higher FB is expected. Composite rheology should also be analysed. Goris et al. 8 have shown that higher melt viscosity increases fibre length attrition due to the increased shear stresses. Higher melt viscosity for tests performed at the same shear rate can obtain lowering test temperature for the same material or changing the material for the same or different test temperature. Moritzer et al. 9 did not inform the rheological properties of the composites; only the shear viscosity from capillary rheometry for the neat polypropylene at 230°C for shear rates at wall between 250 and 5500s−1 were reported. More information about the composite rheology is needed for a complete analysis. On the other hand, Moritzer et al., 9 Goris et al. 8 and the previous section of this work showed that fibre length attrition increased as a function of residence time during shearing. Moritzer et al. 9 and Goris et al. 8 showed that the residence time needed to reach the stationary fibre length decreased as a function of shear rate. Probably, a residence time of 21 ms at an injection flow rate of 30 cm3.s−1 was too short to reach the stationary fibre length in PPV20 N. In fact, it is shown in Figure 7 that the stationary fibre length value was not reached in the range of residence times studied in this work. Other mechanisms that may have conducted to the stronger FB shown by Moritzer et al. 9 were the fibre–equipment interactions due to both the high ratio of the initial fibre length to the gap between cylinders and the centrifugal forces developed in the Couette flow. Differences in the mechanical properties of the fibres should also be analysed for the comparison of FB between different works.
Conclusions
A capillary rheometer adapted to injection moulding machine (CRIM) was used to isolate the effect of fibre–polymer interactions on fibre length attrition of short-fibre polymer composites. Fibre breakage increased linearly as a function of residence time and injection flow rate in the range of injection moulding. Fibre breakage quantified by means of weight average fibre lengths was lower than FB calculated with number average lengths for all tests. In addition, FB based on weight average fibre lengths increased at a lower rate as a function of residence time and injection flow rate. This result was not in agreement with the buckling failure theory of fibres in sheared suspensions that predicts higher breakage probability for longer fibres and was proposed as the main FB mechanism in models for injection moulding implemented in commercial mould filling simulators such as Moldflow and Moldex3D. The observed phenomena were attributed to the similar rotation period of the fibres in comparison with the residence times inside the capillaries which makes longer fibres to have less probability of rotation during flow being less submitted to compression forces and, consequently, having less probability of breakage due to buckling failure.
Future works
In Section 2.3.1 “Experimental Set-up: CRIM,” we stated that a CD to average fibre length ratio higher than six was selected and arbitrarily considered high enough to prevent fibre length attrition due to fibre/equipment interactions. In future works, we will study the effect of the CD to average fibre length ratio on the FB by CRIM using composites with same rheological behaviour and fibre content but different average fibre length in order to support this assumption.
Based on the works by Goris et al., 8 Quijano-Solis et al. 10 and Moritzer et al. 9 we concluded that fibre loading plays a significant role in the FB process. In future works, we will use CRIM to isolate the effect of fibre loading on FB designing the test temperature so as to match the same viscosity for each composite.
In order to confirm the linear dependence of FB as a function of injection flow rate, future works will be carried out running more tests at flow rates of 45, 75 and 105 cm3.s−1.
Supplemental Material
sj-rar-1-jrp-10.1177_0731684420983899 – Supplemental Material for Isolation of hydrodynamic parameters for the fibre length attrition in injection-moulded short-fibre polymer composites
Supplemental Material, sj-rar-1-jrp-10.1177_0731684420983899 for Isolation of hydrodynamic parameters for the fibre length attrition in injection-moulded short-fibre polymer compositesby María P Ruiz, António J V Pontes and Leandro N Ludueña in Journal of Reinforced Plastics and Composites
Supplemental Material
sj-rar-2-jrp-10.1177_0731684420983899 – Supplemental Material for Isolation of hydrodynamic parameters for the fibre length attrition in injection-moulded short-fibre polymer composites
Supplemental Material, sj-rar-2-jrp-10.1177_0731684420983899 for Isolation of hydrodynamic parameters for the fibre length attrition in injection-moulded short-fibre polymer compositesby María P Ruiz, António J V Pontes and Leandro N Ludueña in Journal of Reinforced Plastics and Composites
Footnotes
Declaration of conflicting interests
The author(s) declared no potential conflicts of interest with respect to the research, authorship, and/or publication of this article.
Funding
The author(s) disclosed receipt of the following financial support for the research, authorship, and/or publication of this article: This work was supported by the “Universidad Nacional de Mar del Plata” (ING560/19, 15/G575) and the “Agencia Nacional de Promoción Científica y Tecnológica” (PICT-2014-3228, PICT-2017-2458).
Data availability statement
All data generated or analysed during this study were included in this published article or in the provided supplementary material. Any additional information or query is available from the corresponding author on reasonable request.
Supplement Material
Supplemental material for this article is available online.
References
Supplementary Material
Please find the following supplemental material available below.
For Open Access articles published under a Creative Commons License, all supplemental material carries the same license as the article it is associated with.
For non-Open Access articles published, all supplemental material carries a non-exclusive license, and permission requests for re-use of supplemental material or any part of supplemental material shall be sent directly to the copyright owner as specified in the copyright notice associated with the article.