
Abstract
Natural fiber-reinforced composites are promising alternative materials in the manufacture of modern moderate-to-high-technology products. However, their heterogeneous structure causes processing defects uncommon with metallic parts. Drilling of composites is an essential machining process to facilitate assembly and fastening of composite components. The occurrence of delamination damage around the drilled hole and fiber pull-out within the hole are critical factors that affect the performance of these parts when assembled. A new image processing method using digital scanning and tracing for characterizing delamination and fiber pull-out induced by drilling has been developed to address the limitations in the existing methods of quantifying drilled hole qualities. The capability of the proposed method as a delamination and fiber pull-out assessment tool was verified using simulated and real images of drilled holes. The method was also used to investigate the effect of drilling parameters on delamination and fiber pull-out in jute reinforced epoxy composite produced via resin transfer molding. The results show that drill bit diameter, feed rate, and spindle speed have varying effects on both delamination areas and fiber pull-out within the drilled hole.
Introduction
In the recent years, natural fiber-reinforced composites (NFRCs) have become very significant materials for engineering applications.1,2 NFRCs are used in various industries and applications, such as in automotive, aerospace, building and construction, and furniture industries, as alternatives to conventional glass and carbon fiber-reinforced composites. NFRCs need far lower cost to produce, are ecofriendly, safe to use, have high stiffness-to-strength ratios, are light in weight, and easy to manufacture compared to metallic materials.
Natural fiber-reinforced composites have become a promising option as alternative to composites made of synthetic fiber because their costs are relatively lower. This is due to the much cheaper cost of natural fiber production compared to that of glass or carbon fibers. Natural fibers are usually sourced from plants that are specially cultivated in large scale crops around the world for use in the polymer composite industries. The studies on NFRCs production is more challenging compared to synthetic fiber composites because each type of natural fiber has its own characteristics due to the large variety of sources of natural fibers. 3 Although mechanical properties of glass and carbon fibers are superior to natural fibers, the production cost of synthetic fibers is far higher compared to that of natural fibers due to the processing, handling, power consumption, health issues, and labor cost involved in their production.4,5 Natural fibers, such as jute, hemp, and kenaf, are widely used in the manufacturing of NFRCs, which would be able to replace the glass fiber-reinforced and carbon fiber-reinforced composites in low-to-medium weight engineering application.
Although the properties and performance of NFRCs are being continuously improved all over the world,6–9 the drillability of NFRCs is an important aspect that has not received much attention from the research community. Besides drilling parameters, such as spindle speed and feed rate, used during drilling operations, the material used in the composite manufacturing also influences the delamination characteristics of the drilled hole. Low quality drilled holes would lead to the progressive failure of the product made from the composites, in spite of the material having good overall mechanical properties. 10
Drillability is the ease with which the NFRCs can be drilled, permitting the removal of material with a satisfactory hole quality. Materials with good drillability, that is, free-drilling materials, require little power to cut, can be cut quickly and easily to obtain a good finish, and do not wear the tooling much. NFRCs are usually manufactured in bulk uniform size panels. Fabrication into the end product requires several subsequent operations, such as drilling and fastening, in order to join the individual composite parts. Drilling of NFRCs is considered to be a critical operation owing to its tendency to cause the composite material to delaminate while being subjected to high cutting forces.11,12
Delamination is one of the major defects affecting drilled holes in NFRCs. Delamination is a form of damage and detachment between fiber-matrix which occurs on the surface of the composite around the drilled hole, both at the drill bit entry and exit points.13,14 The degree of delamination of the drilled hole would determine the lifespan, durability, and integrity of the final product. In general, the degree of delamination varies with the drilling parameters, such as drill bit geometries,15,16 point angle of drill bits, 17 drill bit materials, spindle speed, and feed rate. Díaz-Álvarez et al. 18 reported that higher point angles induce higher values of thrust force, but the damage generated is reduced during the drilling process because of the viscoelastoplastic behavior of the biodegradable composites. This suggest that not only the drilling parameters that affect delamination around the drilled hole, but the material characteristics also influence delamination. NFRC material will cause indirect effect on the delamination of the drilled hole in the composites. 10
In order to assess the delamination around the drilled hole, many researches have been conducted to understand how delamination occurs, factors that affect delamination, methods to determine the degree of delamination, and how to minimize delamination. Thus, several types of delamination assessments and analytical methods have been developed for that purpose, such as image processing method, 19 acoustic emission, ultrasonic C-scan, microscopy method, shadow moiré interferometry, radiography, and X-ray computerized tomography. 20 Machado et al. 19 proposed a new approach to assess delamination factor using image processing based on digital radiography on holes drilled in carbon fiber-reinforced epoxy composites. Although their method is able to provide precise delamination area around the holes, it is unable to analyze fiber pull-out left inside the holes after drilling. Vaziri Sereshk and Bidhendi 21 compared three different non-destructive tests (NDTs) in order to reveal delamination extension, such as digital photography, X-ray enhanced radiography, and processed image of C-Scan. All of these NDTs are the methods of tracking the maximum delamination (D max ) of the drilled hole, whereby D max indicates the vicinity of revealed damage extension. The limitations of using D max to quantify delamination is discussed in review of existing hole delamination and fiber pull-out analysis methods.
In this work, a delamination tracer and fiber pull-out analysis method that operates on high-resolution scanned images of drilled holes have been developed using MATLAB® R2020b. The delamination is traced along each pixel around the periphery of the delamination area, while the fiber pull-out is analyzed via image processing with user-selectable threshold to determine fiber pull-out area at drill entry and exit of the hole. From the delamination trace, the total delamination area, delamination area ratio, delamination factor (F d ), and mean delamination are calculated automatically. In the next section, some of the existing methods of hole delamination and fiber pull-out are reviewed and their limitations are highlighted.
Review of existing hole delamination and fiber pull-out analysis methods
In the drilled hole delamination analysis of polymer composites, several quantitative methods are used to represent the delamination area, delamination area ratio, and mean delamination. The value of delamination area represents the degree of area damage that occurs around the drilled hole and is calculated using the conventional equation of delamination factor (F
d
), two-dimensional delamination area (F
a
), and delamination size, as shown in Figure 1. Scheme of evaluation of: (a) delamination factor; 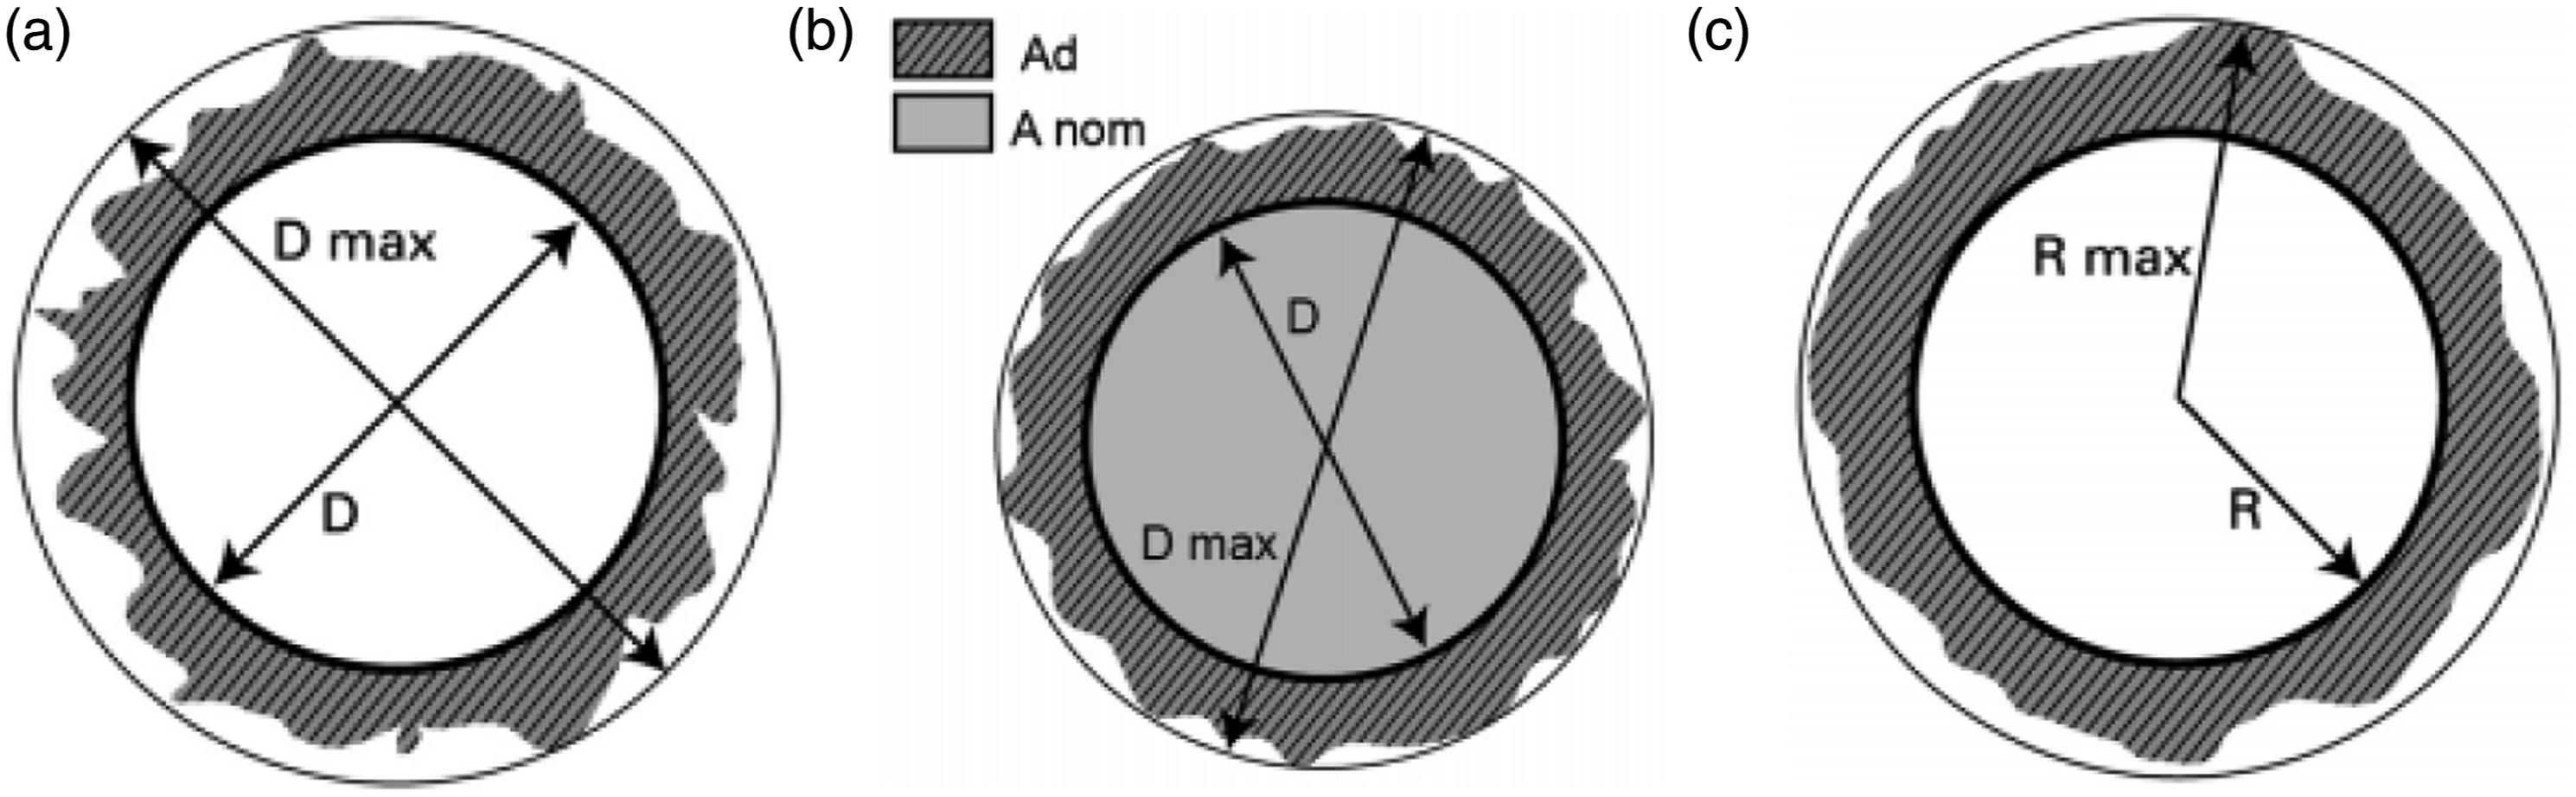
The use of maximum delamination (D
max
) and maximum radius of delamination (R
max
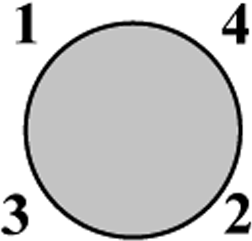
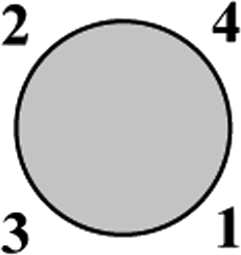
) could lead to inaccurate interpretation of the delamination because these parameters do not truly represent the actual delamination extent around the drilled hole. Figure 2 shows two cases where the maximum delamination is used to represent the delamination area, thus giving the same values of F
d
and D
size
although the delamination areas are markedly different. Delamination around two holes having the same D
max
and D.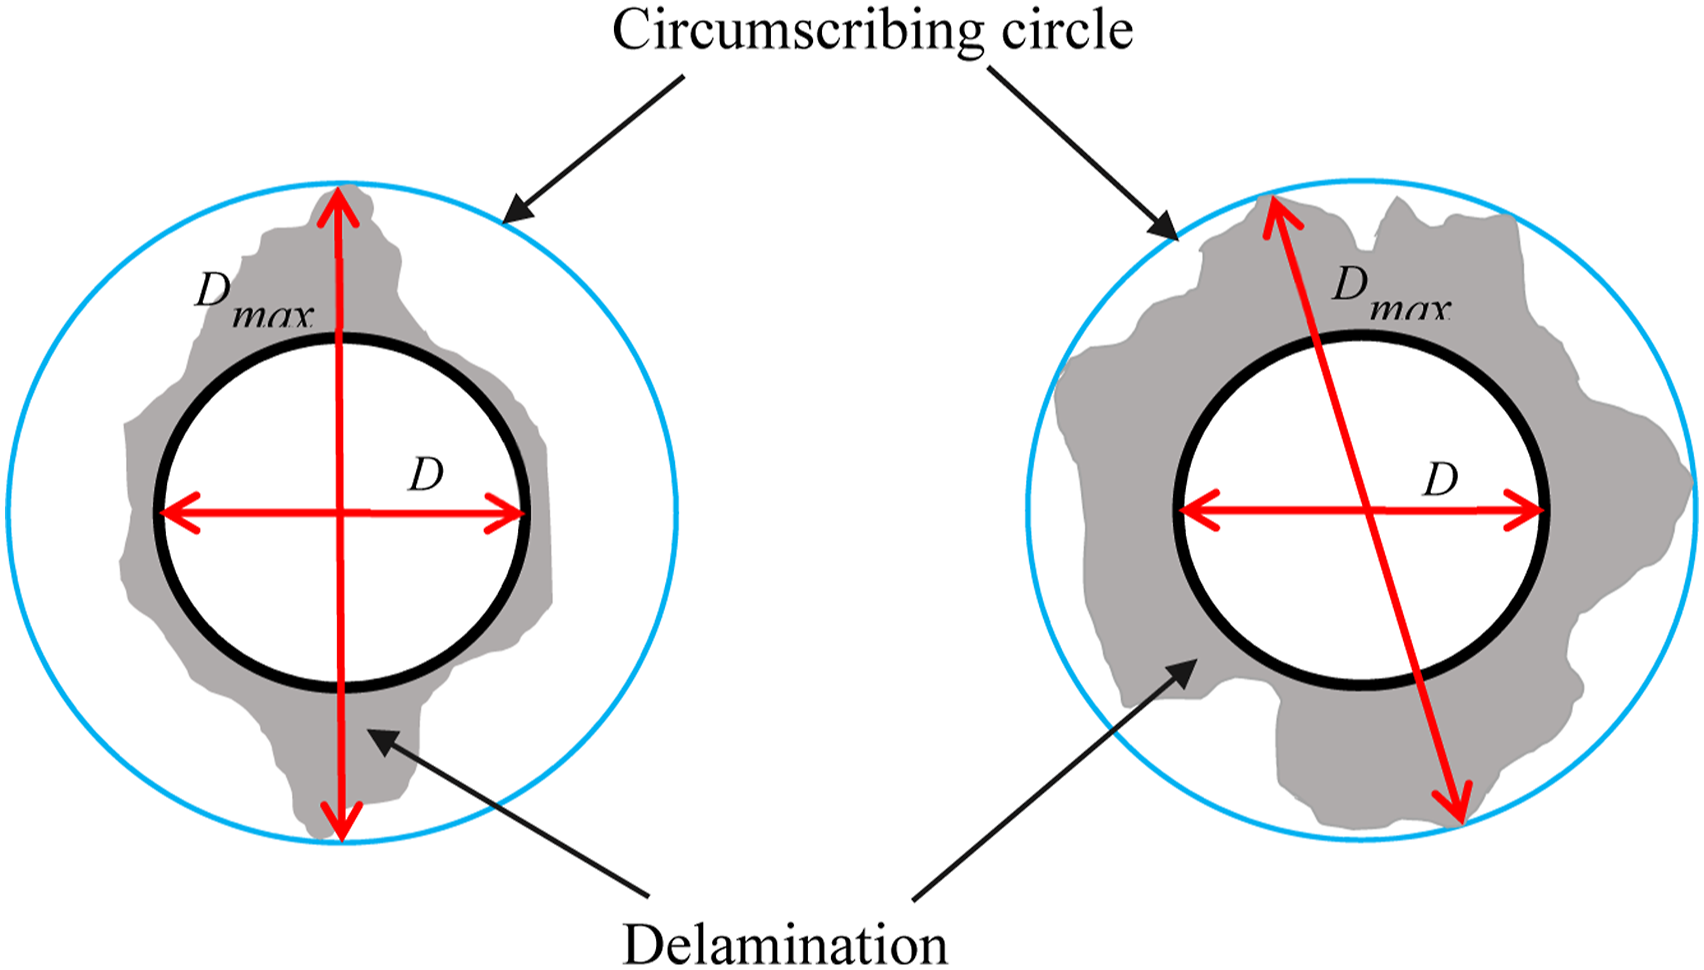
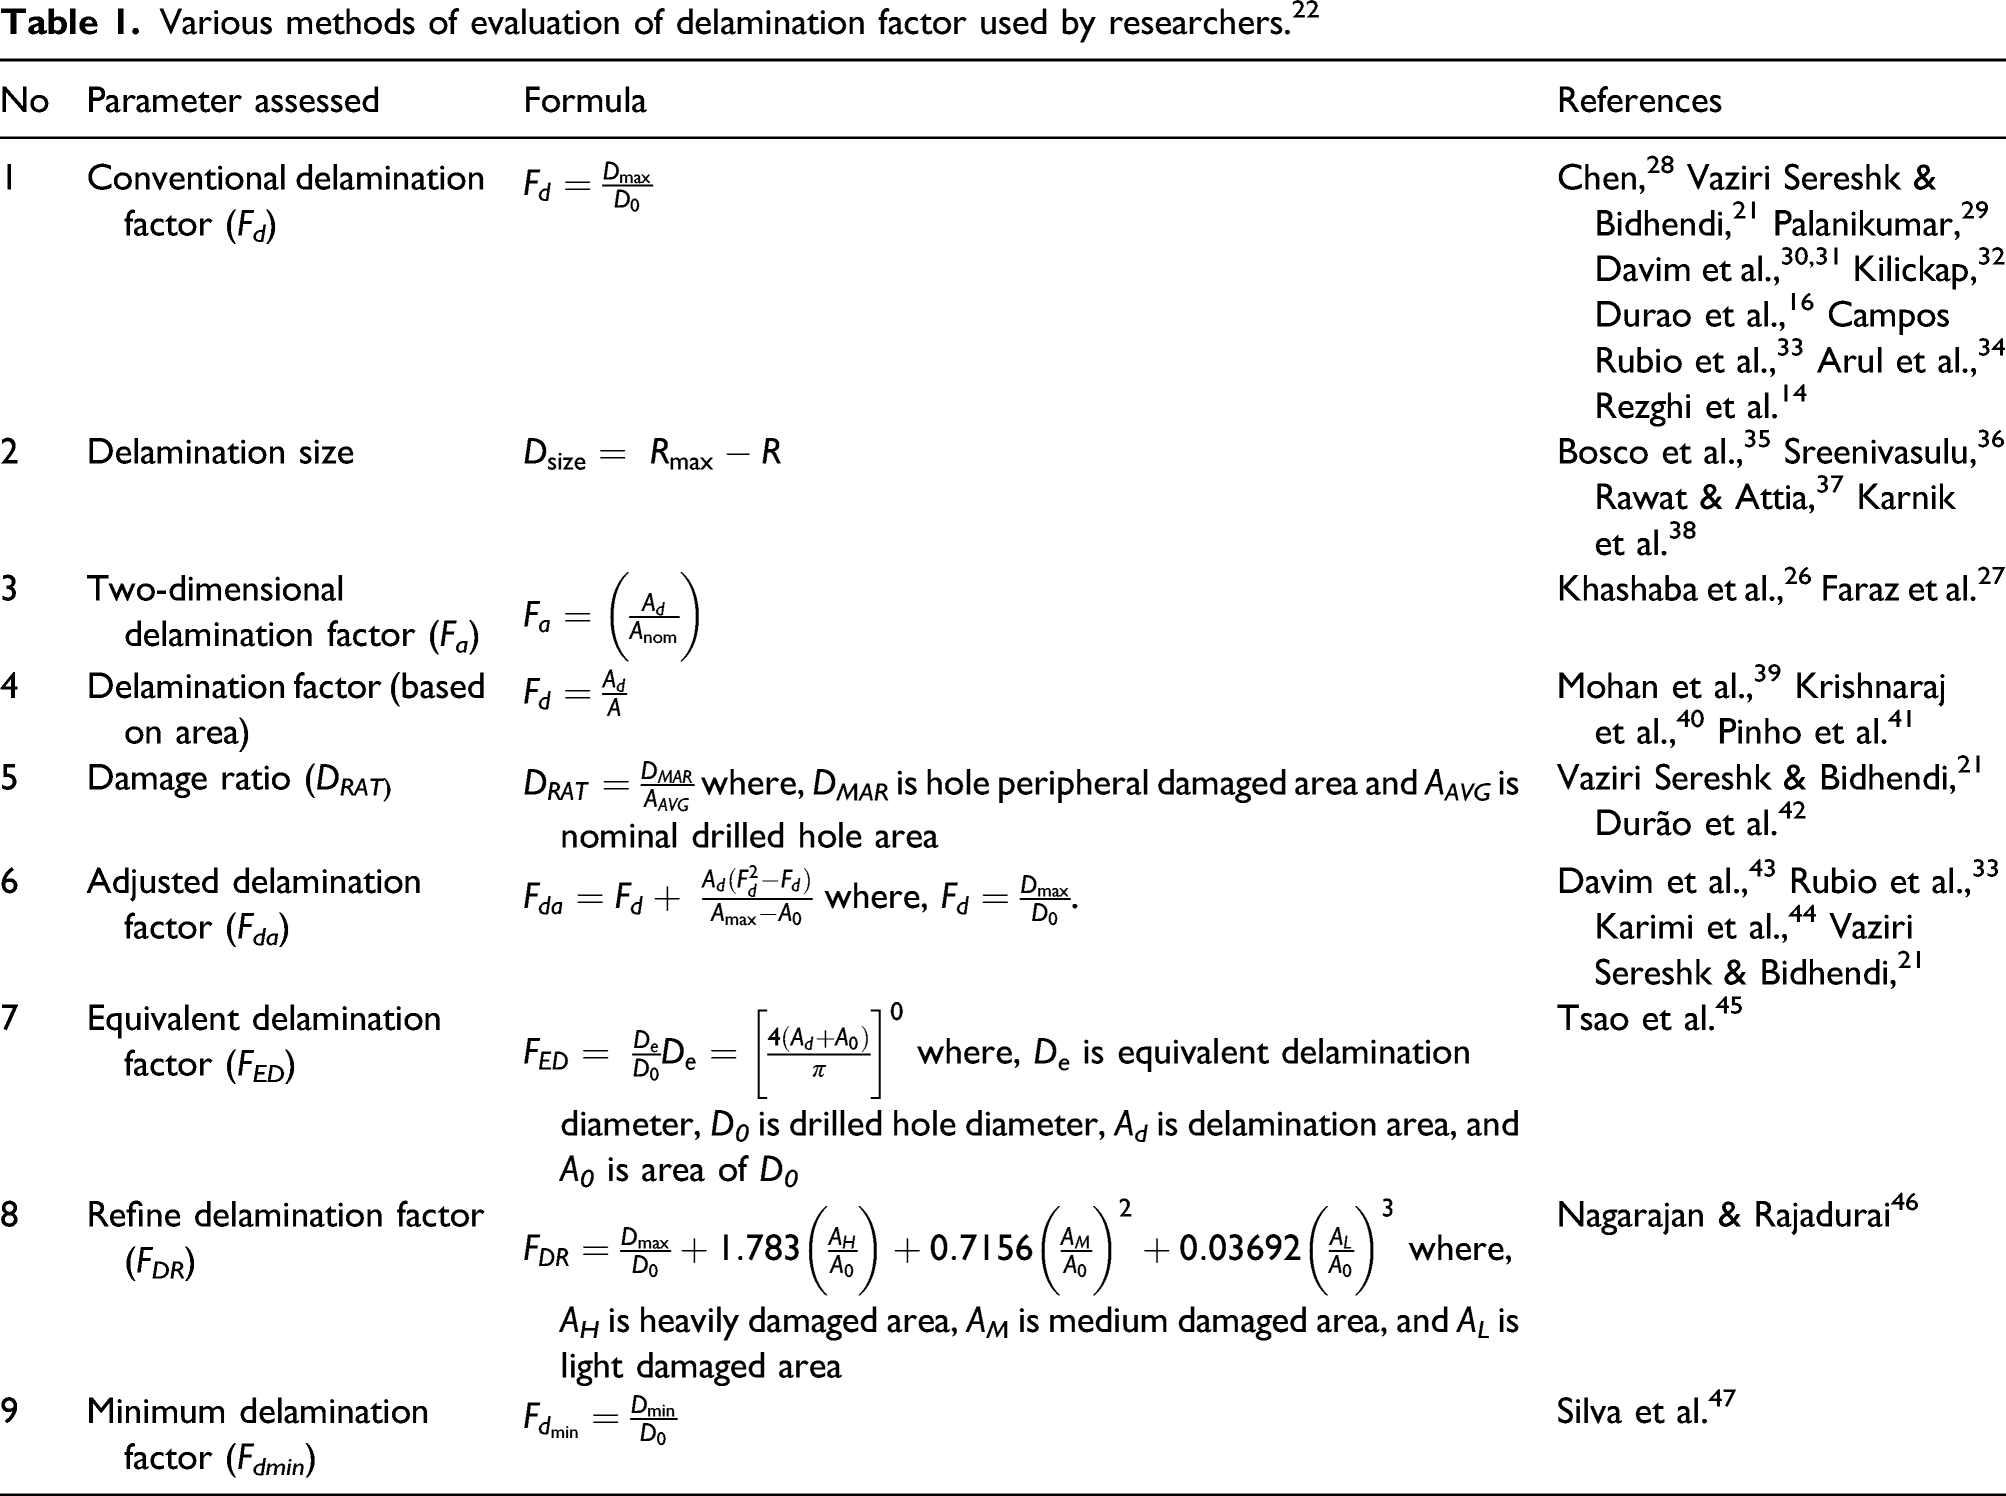
Various methods of evaluation of delamination factor used by researchers. 22
Analysis of fiber pull-out and splintering within the drilled hole is also important to assess the hole quality. Uncut fibers and splinters within the hole can interfere with the fastening process and affect the integrity of the joint. Thus far, an effective method of quantifying fiber pull-out has not been proposed in the literature. Previous studies only provide a qualitative assessment on the fiber pullout.37,48,49 Quantitative assessment of the fiber pull-out within the drilled holes is important in order to extend the understanding of drilled hole quality. Drilled holes having fiber pull-out and splintering will produce uneven surface roughness on the hole wall, and, thus, affect the effective hole diameter.
Materials, experimental, and image processing methods of delamination and fiber pull-out analyses
Materials and composite manufacturing
The delamination and fiber pull-out analyses were conducted on woven jute fiber-reinforced epoxy composites (JFRCs), one of the popular NFRC materials having good mechanical strength, good strength-to-weight ratio, and ease of manufacture. JFRCs were reported to achieve tensile modulus of 1–3 GPa50,51 and flexural modulus of 3 GPa, 50 which are favorable for use of the composite in various semi-structural applications. In spite of having good mechanical properties, JFRCs face problems when it comes to drilling. Drilling commonly induces delamination damage around the drilled hole. 13 The delamination factor or degree of delamination would determine the integrity of the fastened parts and durability of the end product. Generally, NFRCs exhibit viscoelastoplastic behavior compared to carbon or glass reinforced composites because of the high cellulose content in the composites. 18 This behavior causes NFRCs to require specific drilling conditions in order to obtain a good drilled hole. Moreover, the “soft” characteristics of loose cellulosic fibers render them difficult to be cut neatly during drilling, thus leaving fiber pull-out on the drilled hole surface.
The woven burlap jute, purchased from Sargodha Jute Mills Limited, Sheikhupura, Pakistan, was used in the NFRC manufacturing. Resin transfer molding technique was used to fabricate the NFRCs panels. Primarily, the release agent (wax) was applied to the mold to facilitate proper removal of the composite after fabrication. The Epoxamite 101 (resin) and Epoxamite 103 (hardener), supplied by Reynolds Advanced Materials, were mixed with the proportion of 10:3 by weight fraction. Figure 3(a) shows a schematic drawing of the resin transfer molding (RTM) process. Five layers of woven burlap jute fibers were used in the composite fabrication. The woven fibers were placed into chamber between RTM panels within rubber seal. The process was started by vacuuming the chamber. After the chamber was completely vacuumed, the mixed epoxy was transferred into the chamber with the help of vacuuming process. Once the epoxy has successfully filled the chamber, the piping channels were sealed. The composite was fully cured within 24 h at room temperature. Figure 3(b) and (c) shows the images of resin transfer molding setup and the manufactured NFRC panel. Manufacture of jute epoxy composite via resin transfer molding: (a) Schematic of resin transfer molding setup, (b) preparation of the woven jute fabric on resin transfer mold, and (c) manufactured composite panel.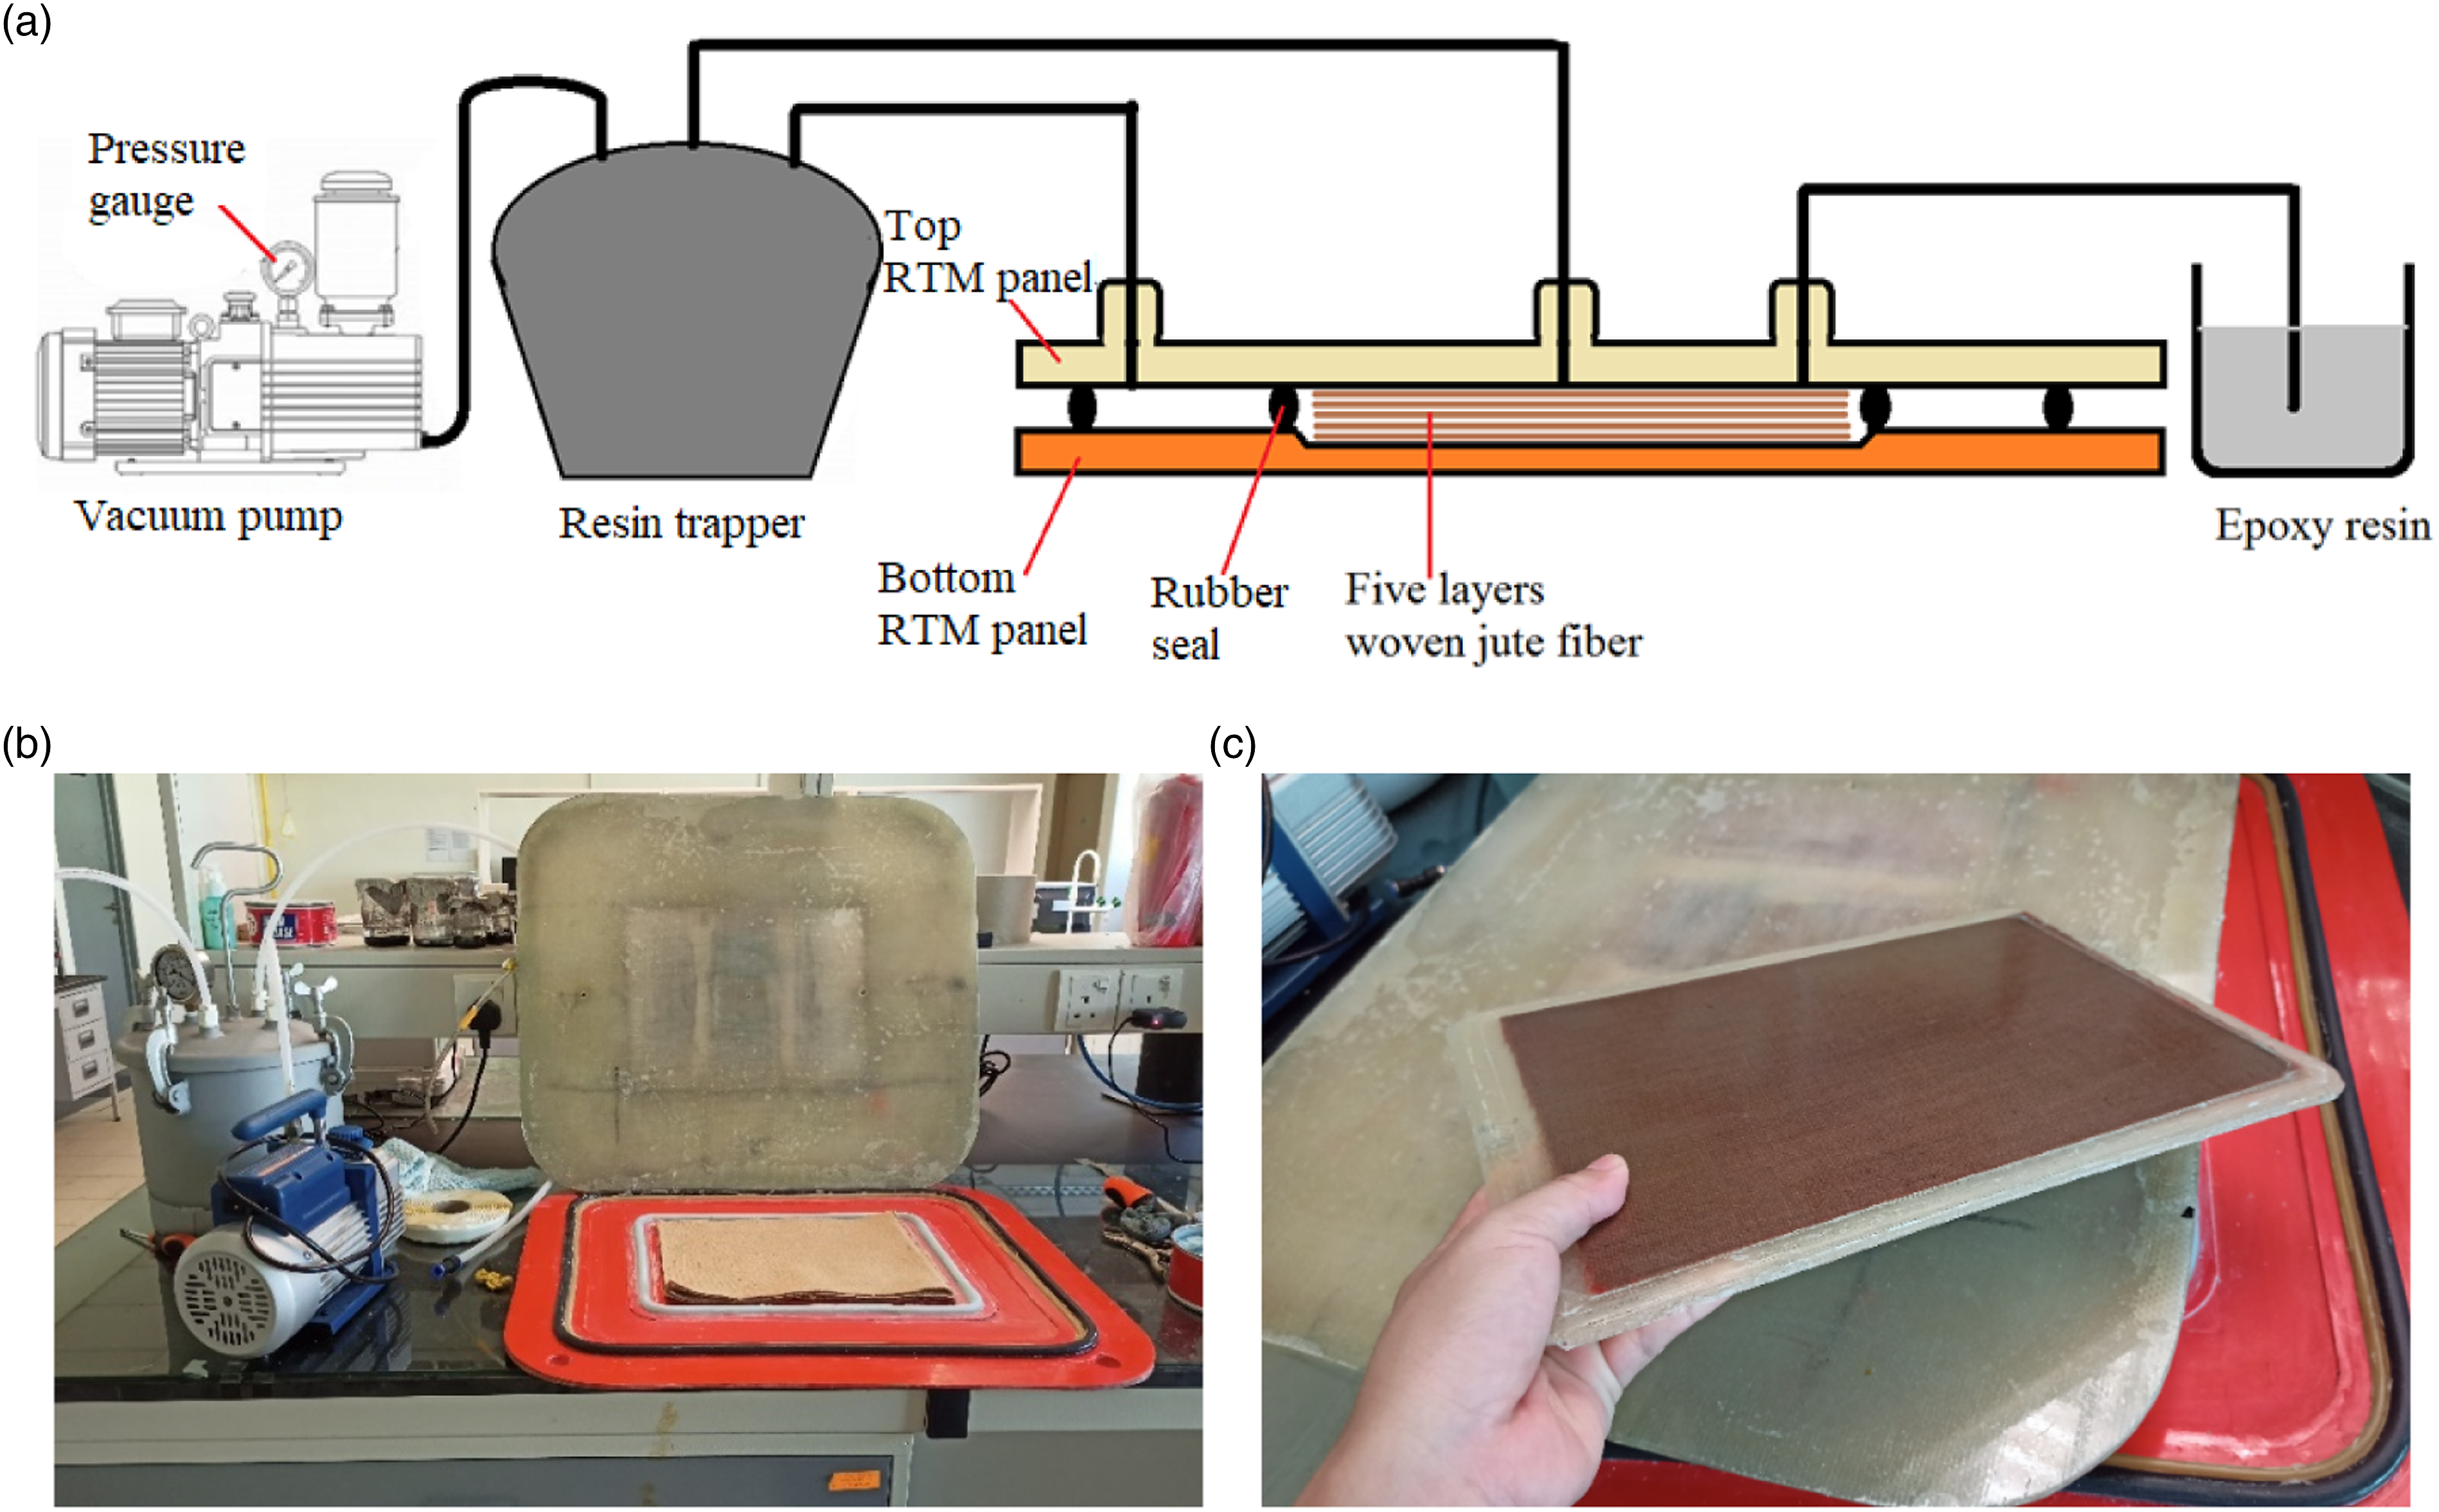
Drilling scheme, delamination tracing image processing, and fiber pull-out analysis

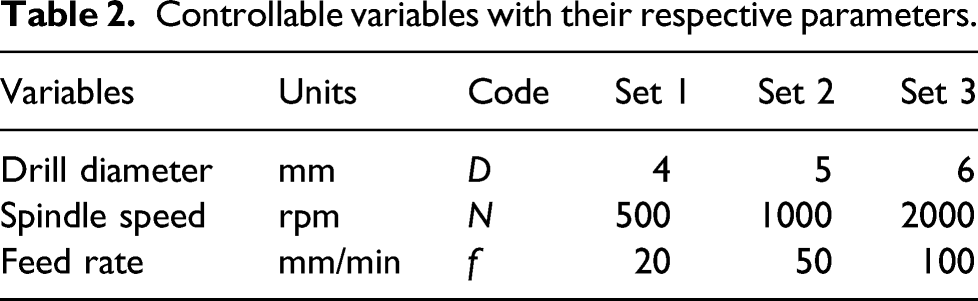
Controllable variables with their respective parameters.
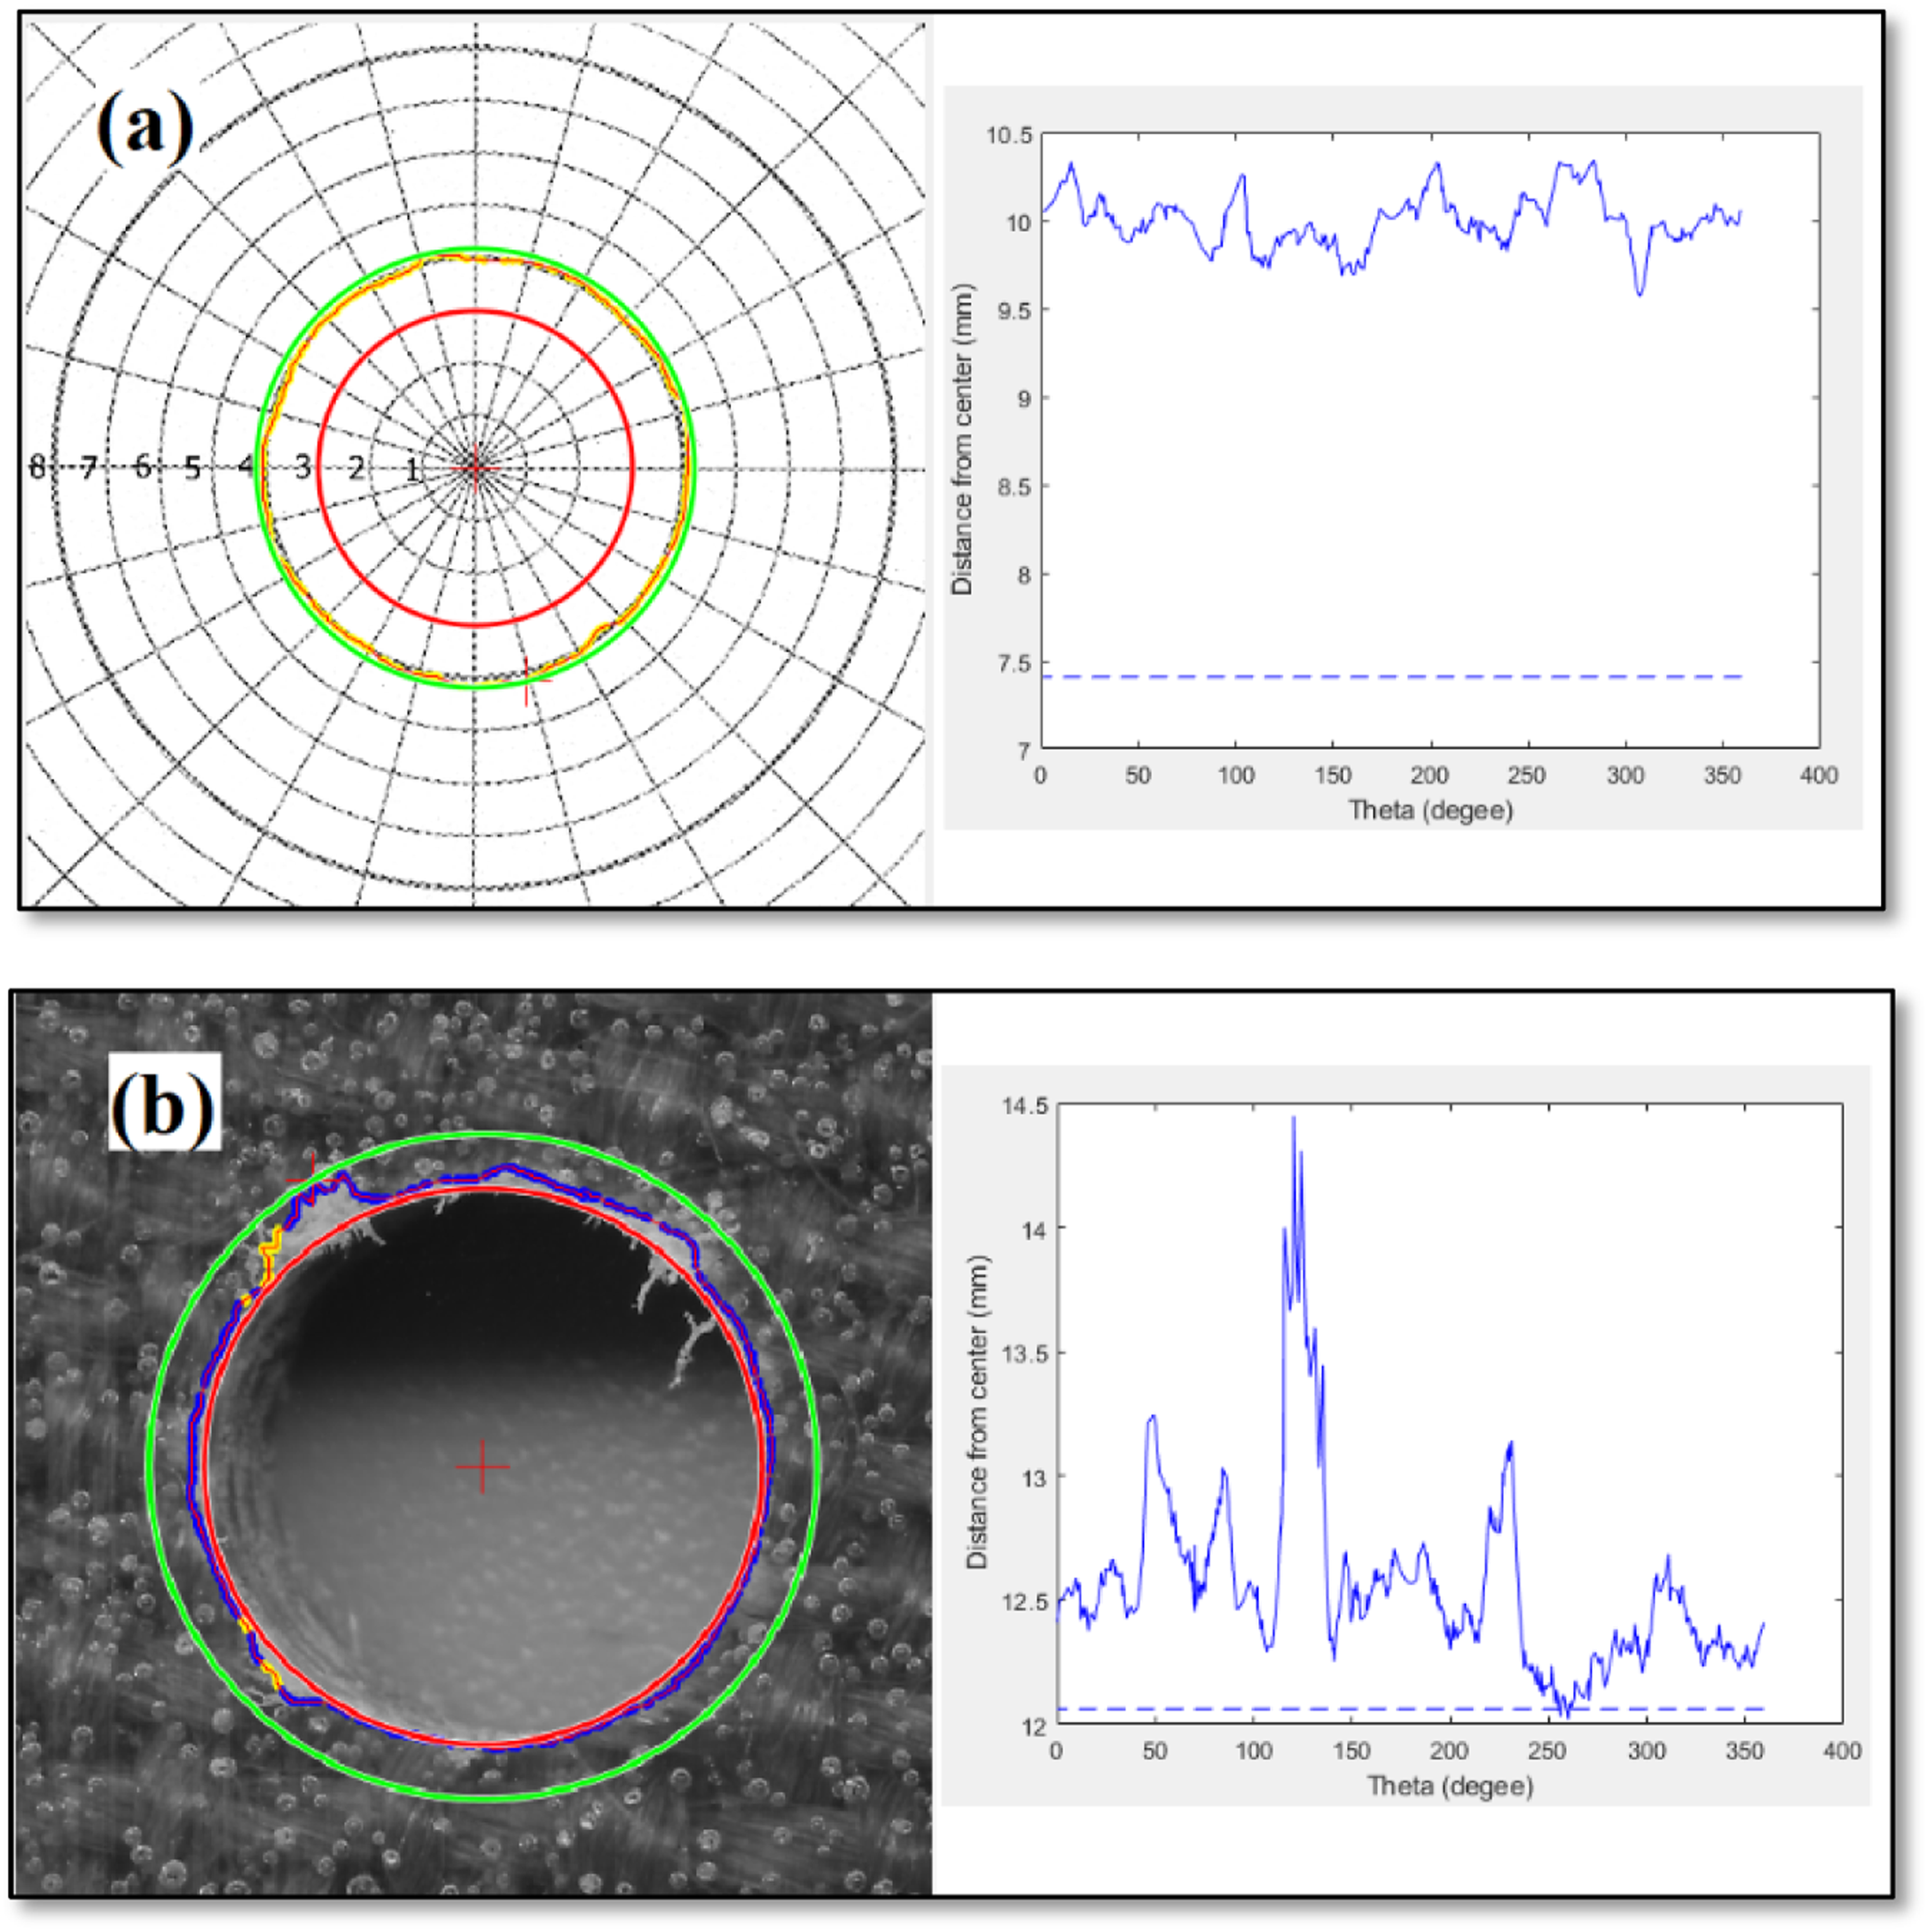
Delamination Tracing Image Processing (DTIP) method used to trace delamination and drilled hole circularity using polar-radius plot: (a) Delamination tracing validation using polar graph and (b) delamination tracing on actual drilled hole.
The images used in the delamination analysis (as in Figure 4(b)) were scanned using a standard flatbed scanner (Canoscan 5600F) having a maximum optical resolution of 9600 dpi. Although the scanning resolution can be selected by the user, a trade-off needs to be made between the amount of memory needed to process the image, processing time, and tracing accuracy. In this research, a scanning resolution of 4800 dpi was selected as the optimum value. The image was read into MATLAB workspace and the delamination was traced manually using a computer mouse. A lower setting of the mouse sensitivity is recommended so that a larger movement of the mouse causes smaller movement of the cursor on the image, hence resulting in a higher accuracy delamination trace. Once the tracing was completed, four points were selected on the periphery of the hole in order to automatically draw the circle representing the drilled hole. The MATLAB code used in the DTIP method was integrated into a graphical user interface (GUI) and is explained in greater detail in graphical user interface for delamination and fiber pull-out analyses.
Validation of DTIP method
The validity and accuracy of the DTIP tracing method to determine delamination are important aspects that need to be verified. The accuracy of the circle representing the drilled hole resulting from the four-point method and the accuracy of the manual tracing were initially assessed using a standard polar graph. To validate the accuracy of the circle, a MATLAB program called fit_circle was written. The fit_circle program uses the four-point method to draw a circle and calculate the radius of the circle as shown in Figure 5. (a) Four points on polar graph, (b) circle from four-point method, and (c) output of fit_circle program where radius R is in pixels.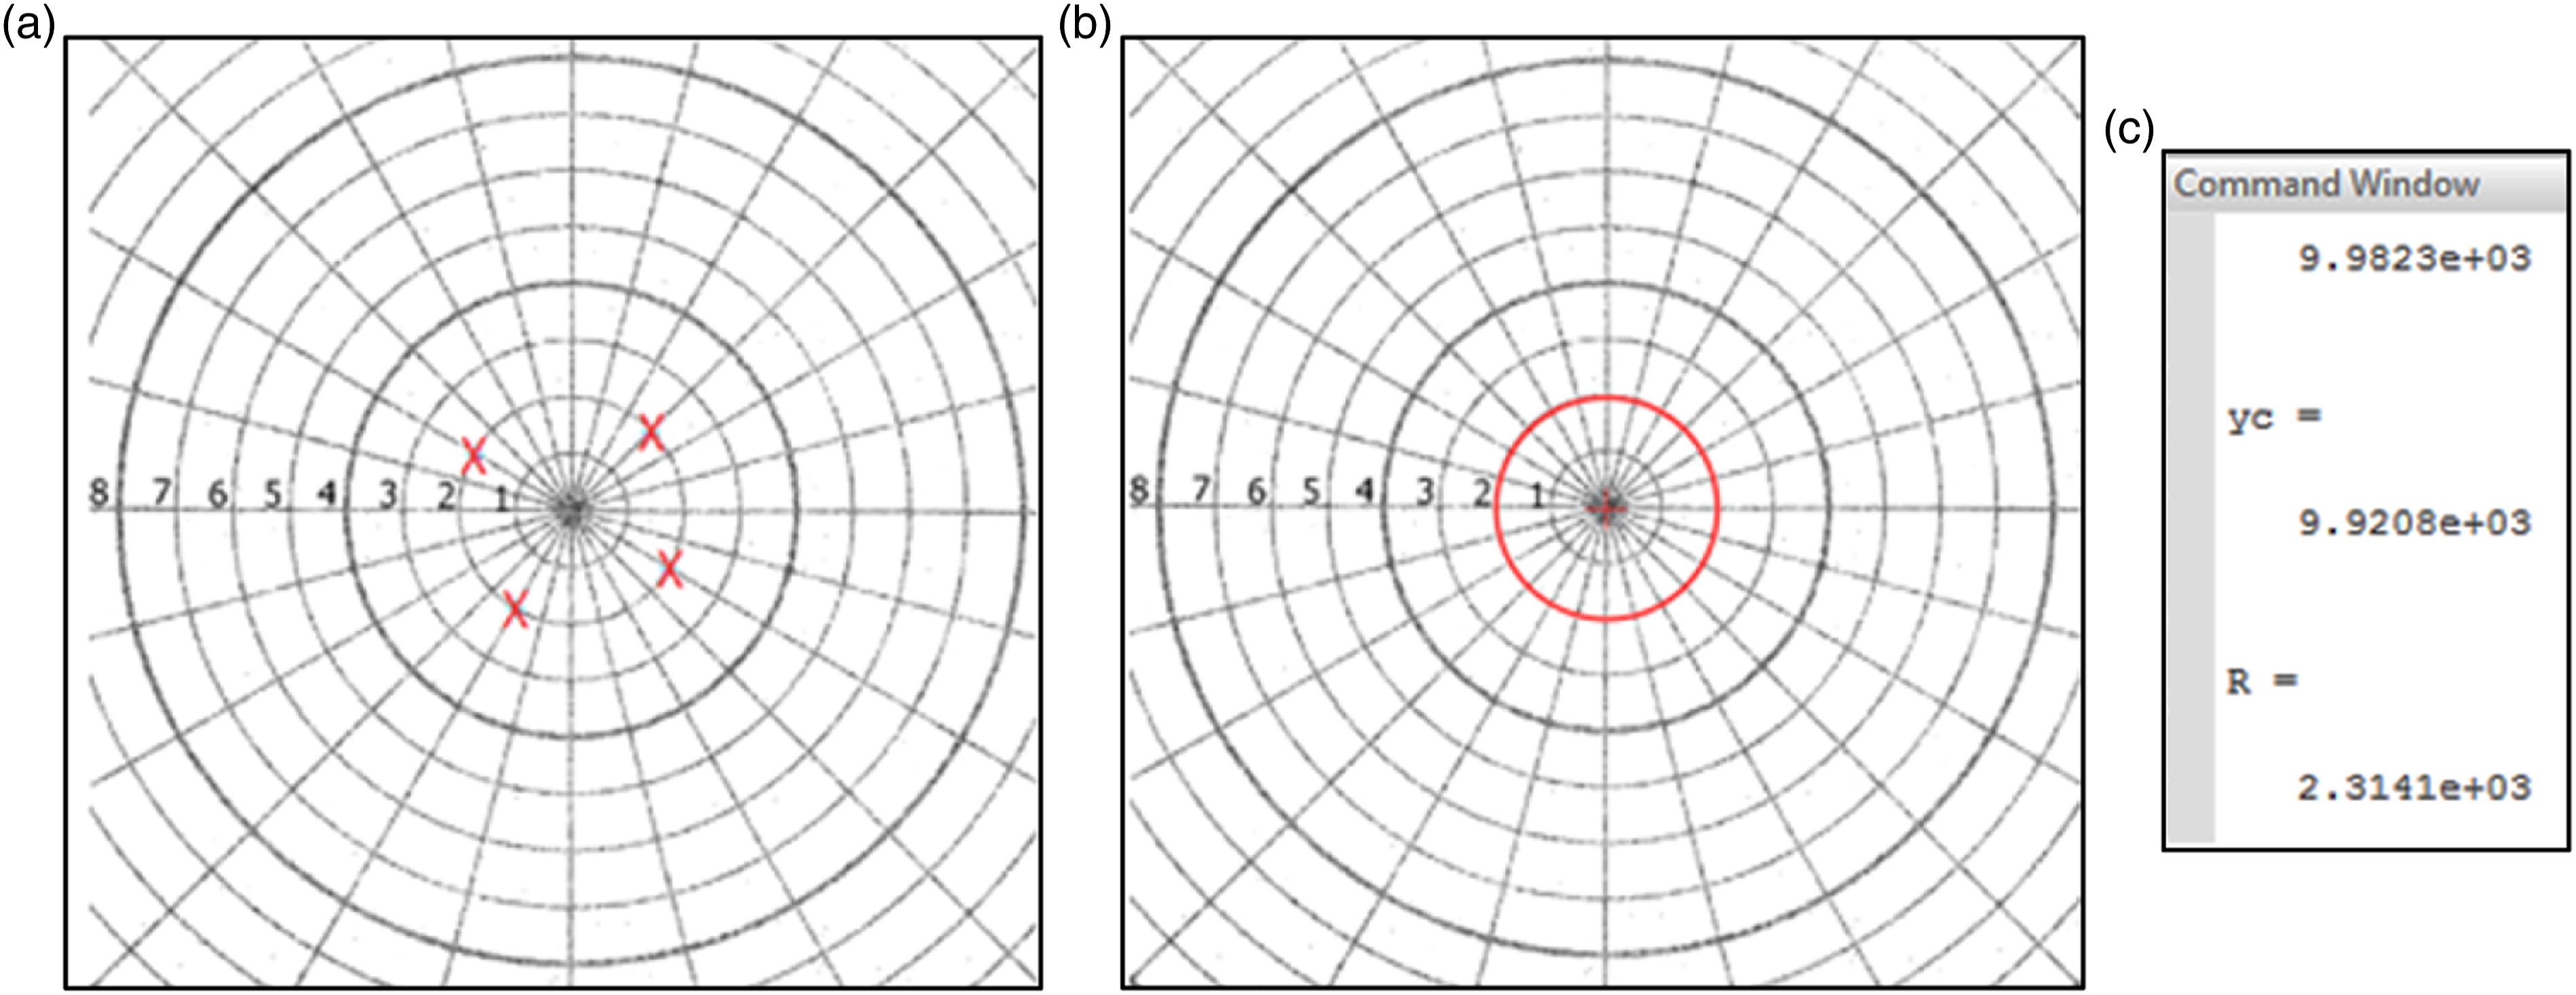
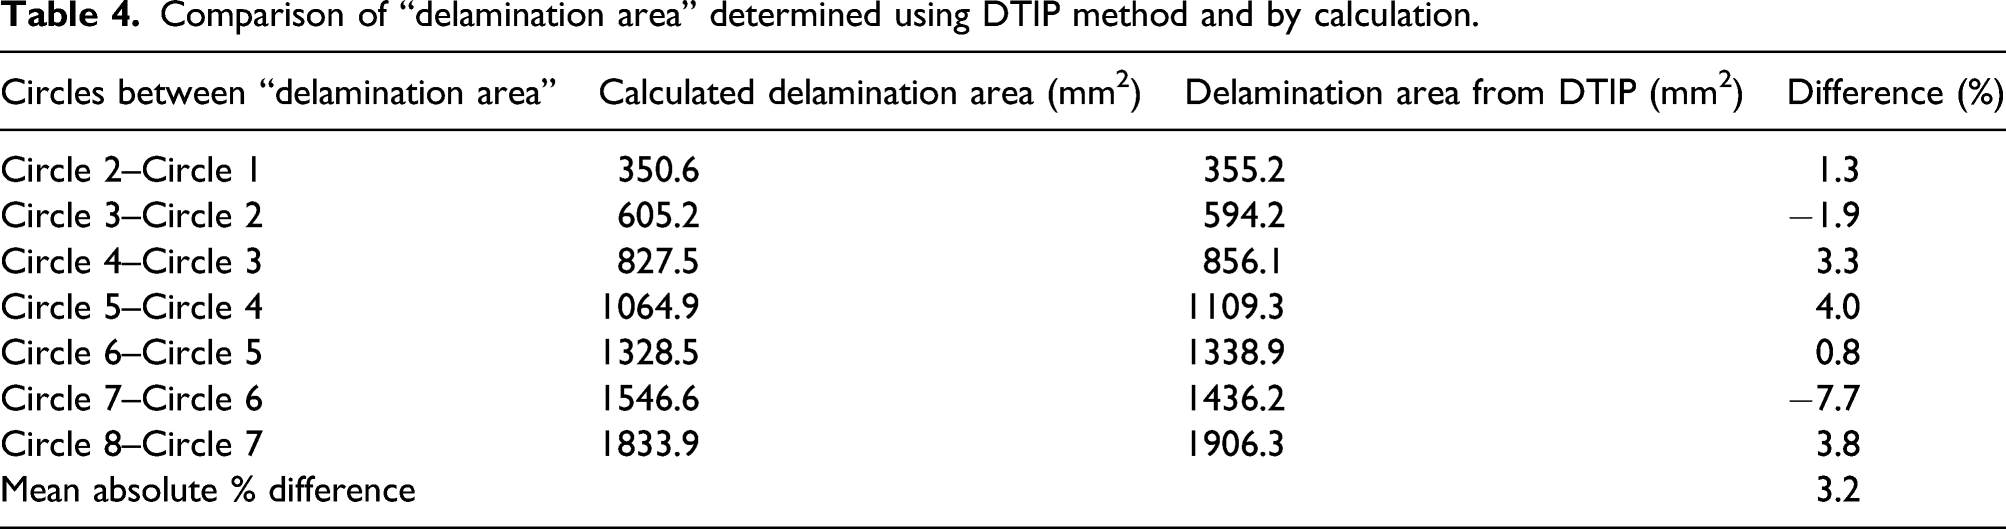
When the program is executed, it will prompt the user to select four-points in the image in order to construct a circle as shown in Figure 5(a). After the four points are selected a red circle will be created (Figure 5(b)), and the radius of the circle will be presented in units of pixels as shown in Figure 5(c). The circle radius in millimeter units was computed using a scaling factor of 0.005292 mm/pixel for 4800 dpi scanning resolution. By using the radius obtained from the fit_circle program, the “delamination area” bounded by the trace and the four-point circle was calculated using equation (2) (a) DTIP GUI used in delamination tracing accuracy evaluation. DTIP: delamination tracing image processing; GUI: graphical user interface.
Method of fiber pull-out analysis
Fiber pull-out within the drilled hole was evaluated by assessing the amount of loose fiber interruption inside the hole by using image processing. The image of the drilled hole was scanned in grayscale using the backlight available in the scanner. Figure 7 shows the various steps used in the determining the fiber pull-out area by image processing together with the intermediate output images. The image was first read into MATLAB workspace. Using the four-point method a circle was fitted to the hole. The hole region was then copped out using a circular mask whose radius is same as that of the fitted circle. The black pixels outside the mask were inverted and the resulting image was binarized using a predefined threshold value. The total number of white pixels remaining were counted as the fiber pull-out area in pixels and converted to square millimeters. The fiber pull-out analysis program was coded in a GUI. Various steps in the fiber pull-out analysis program.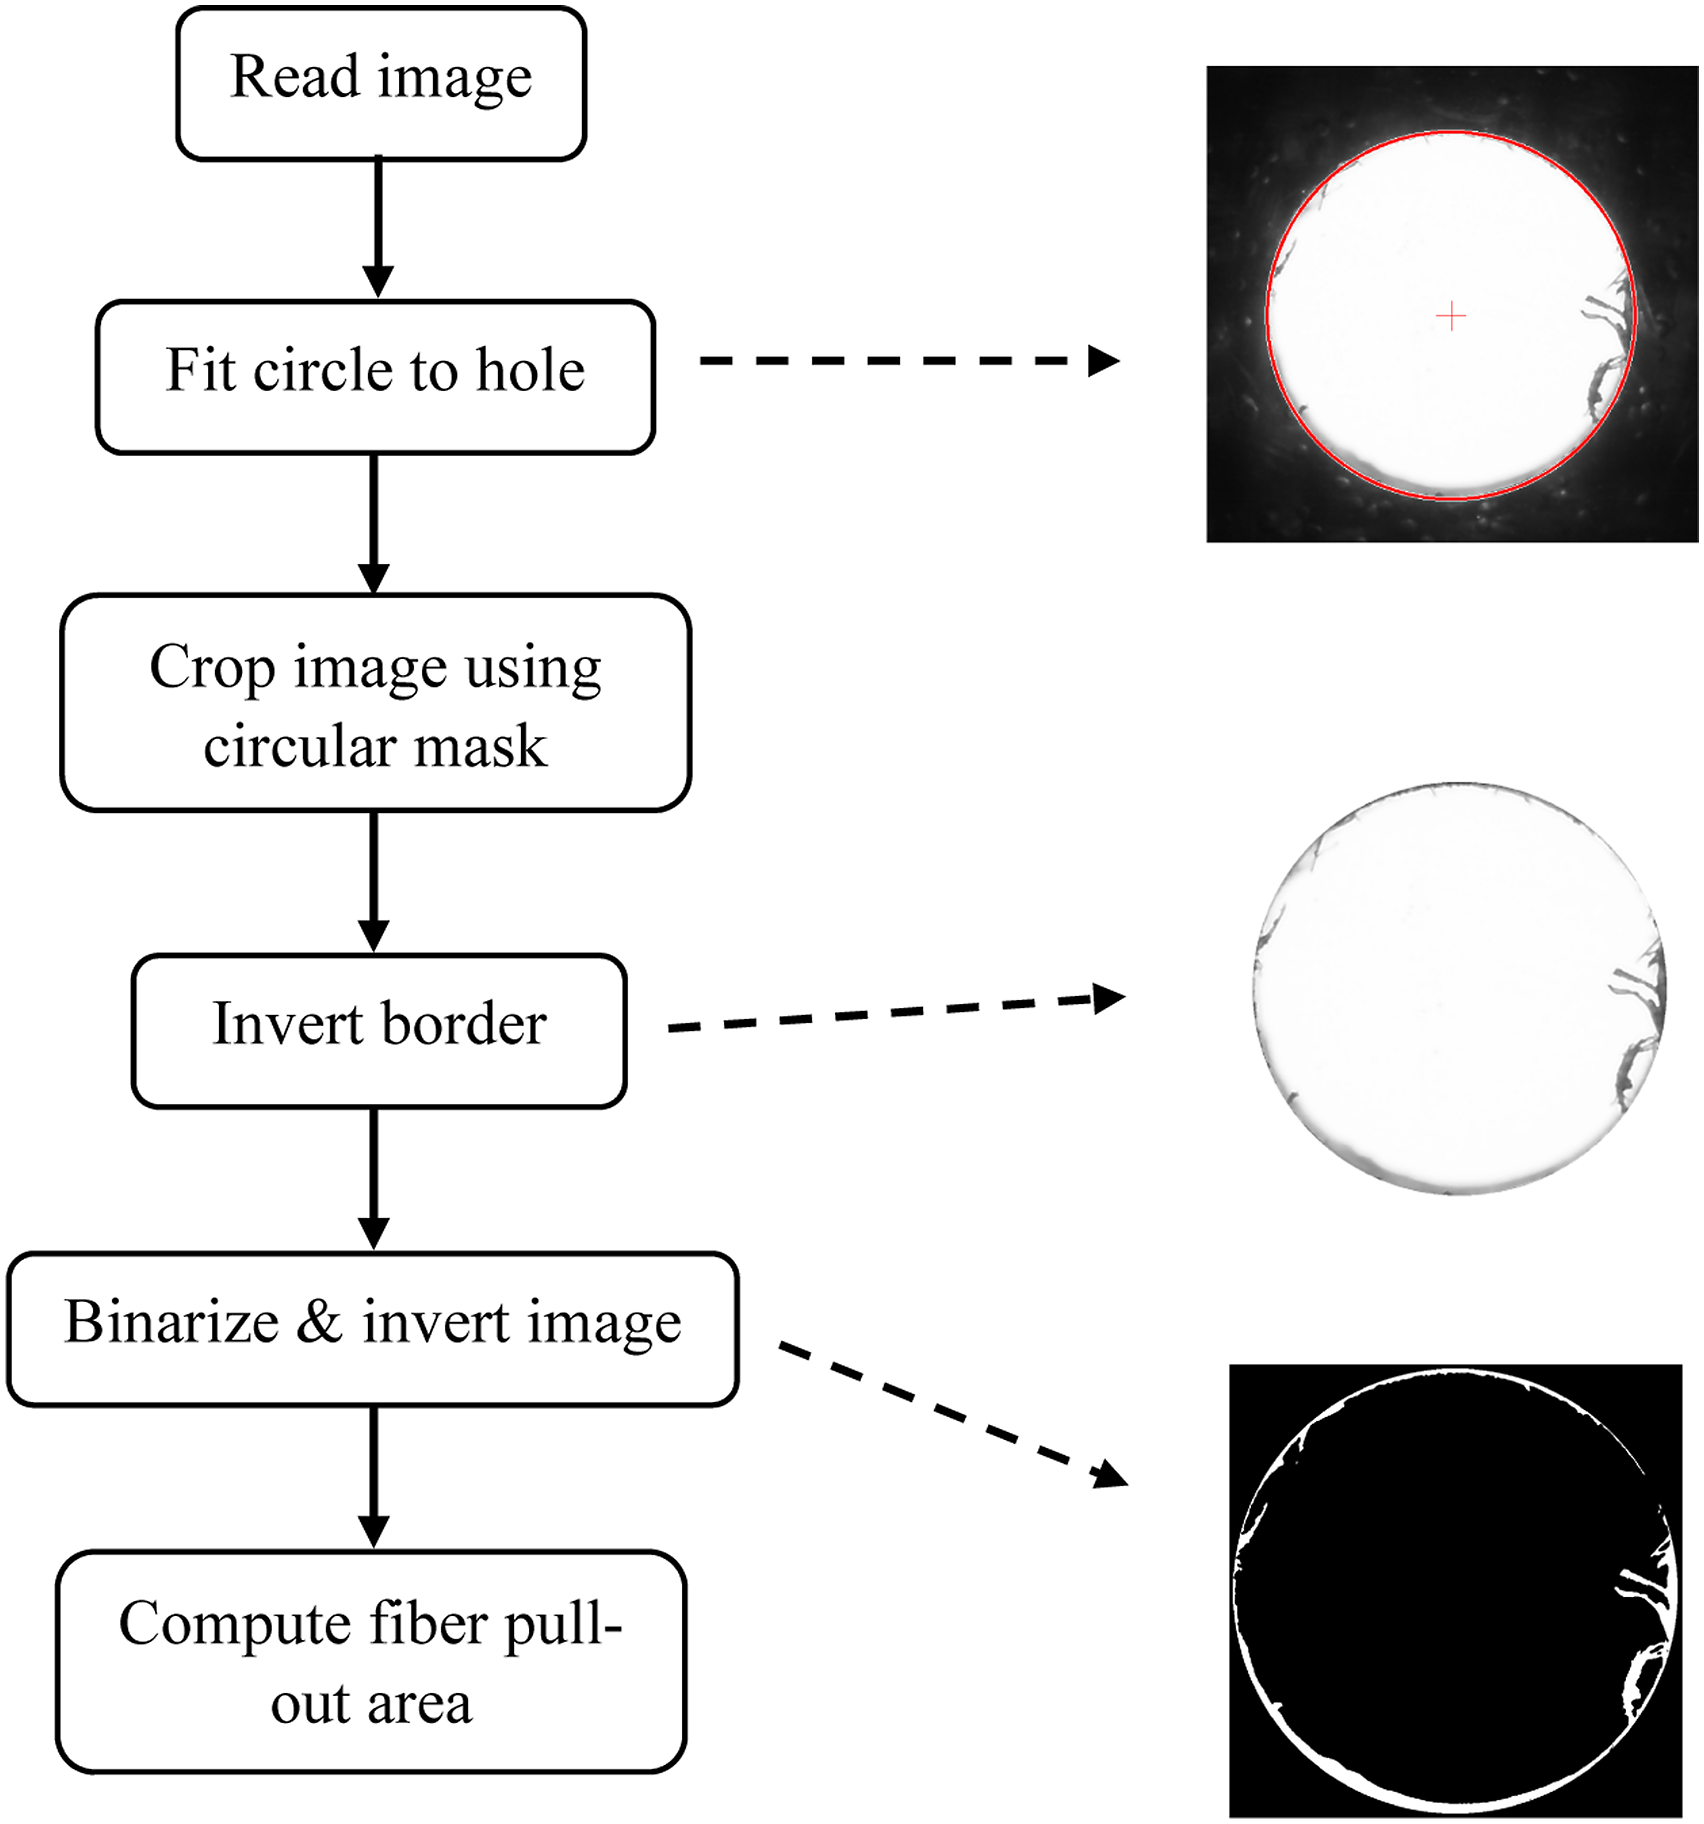
Graphical user interface for delamination and fiber pull-out analyses
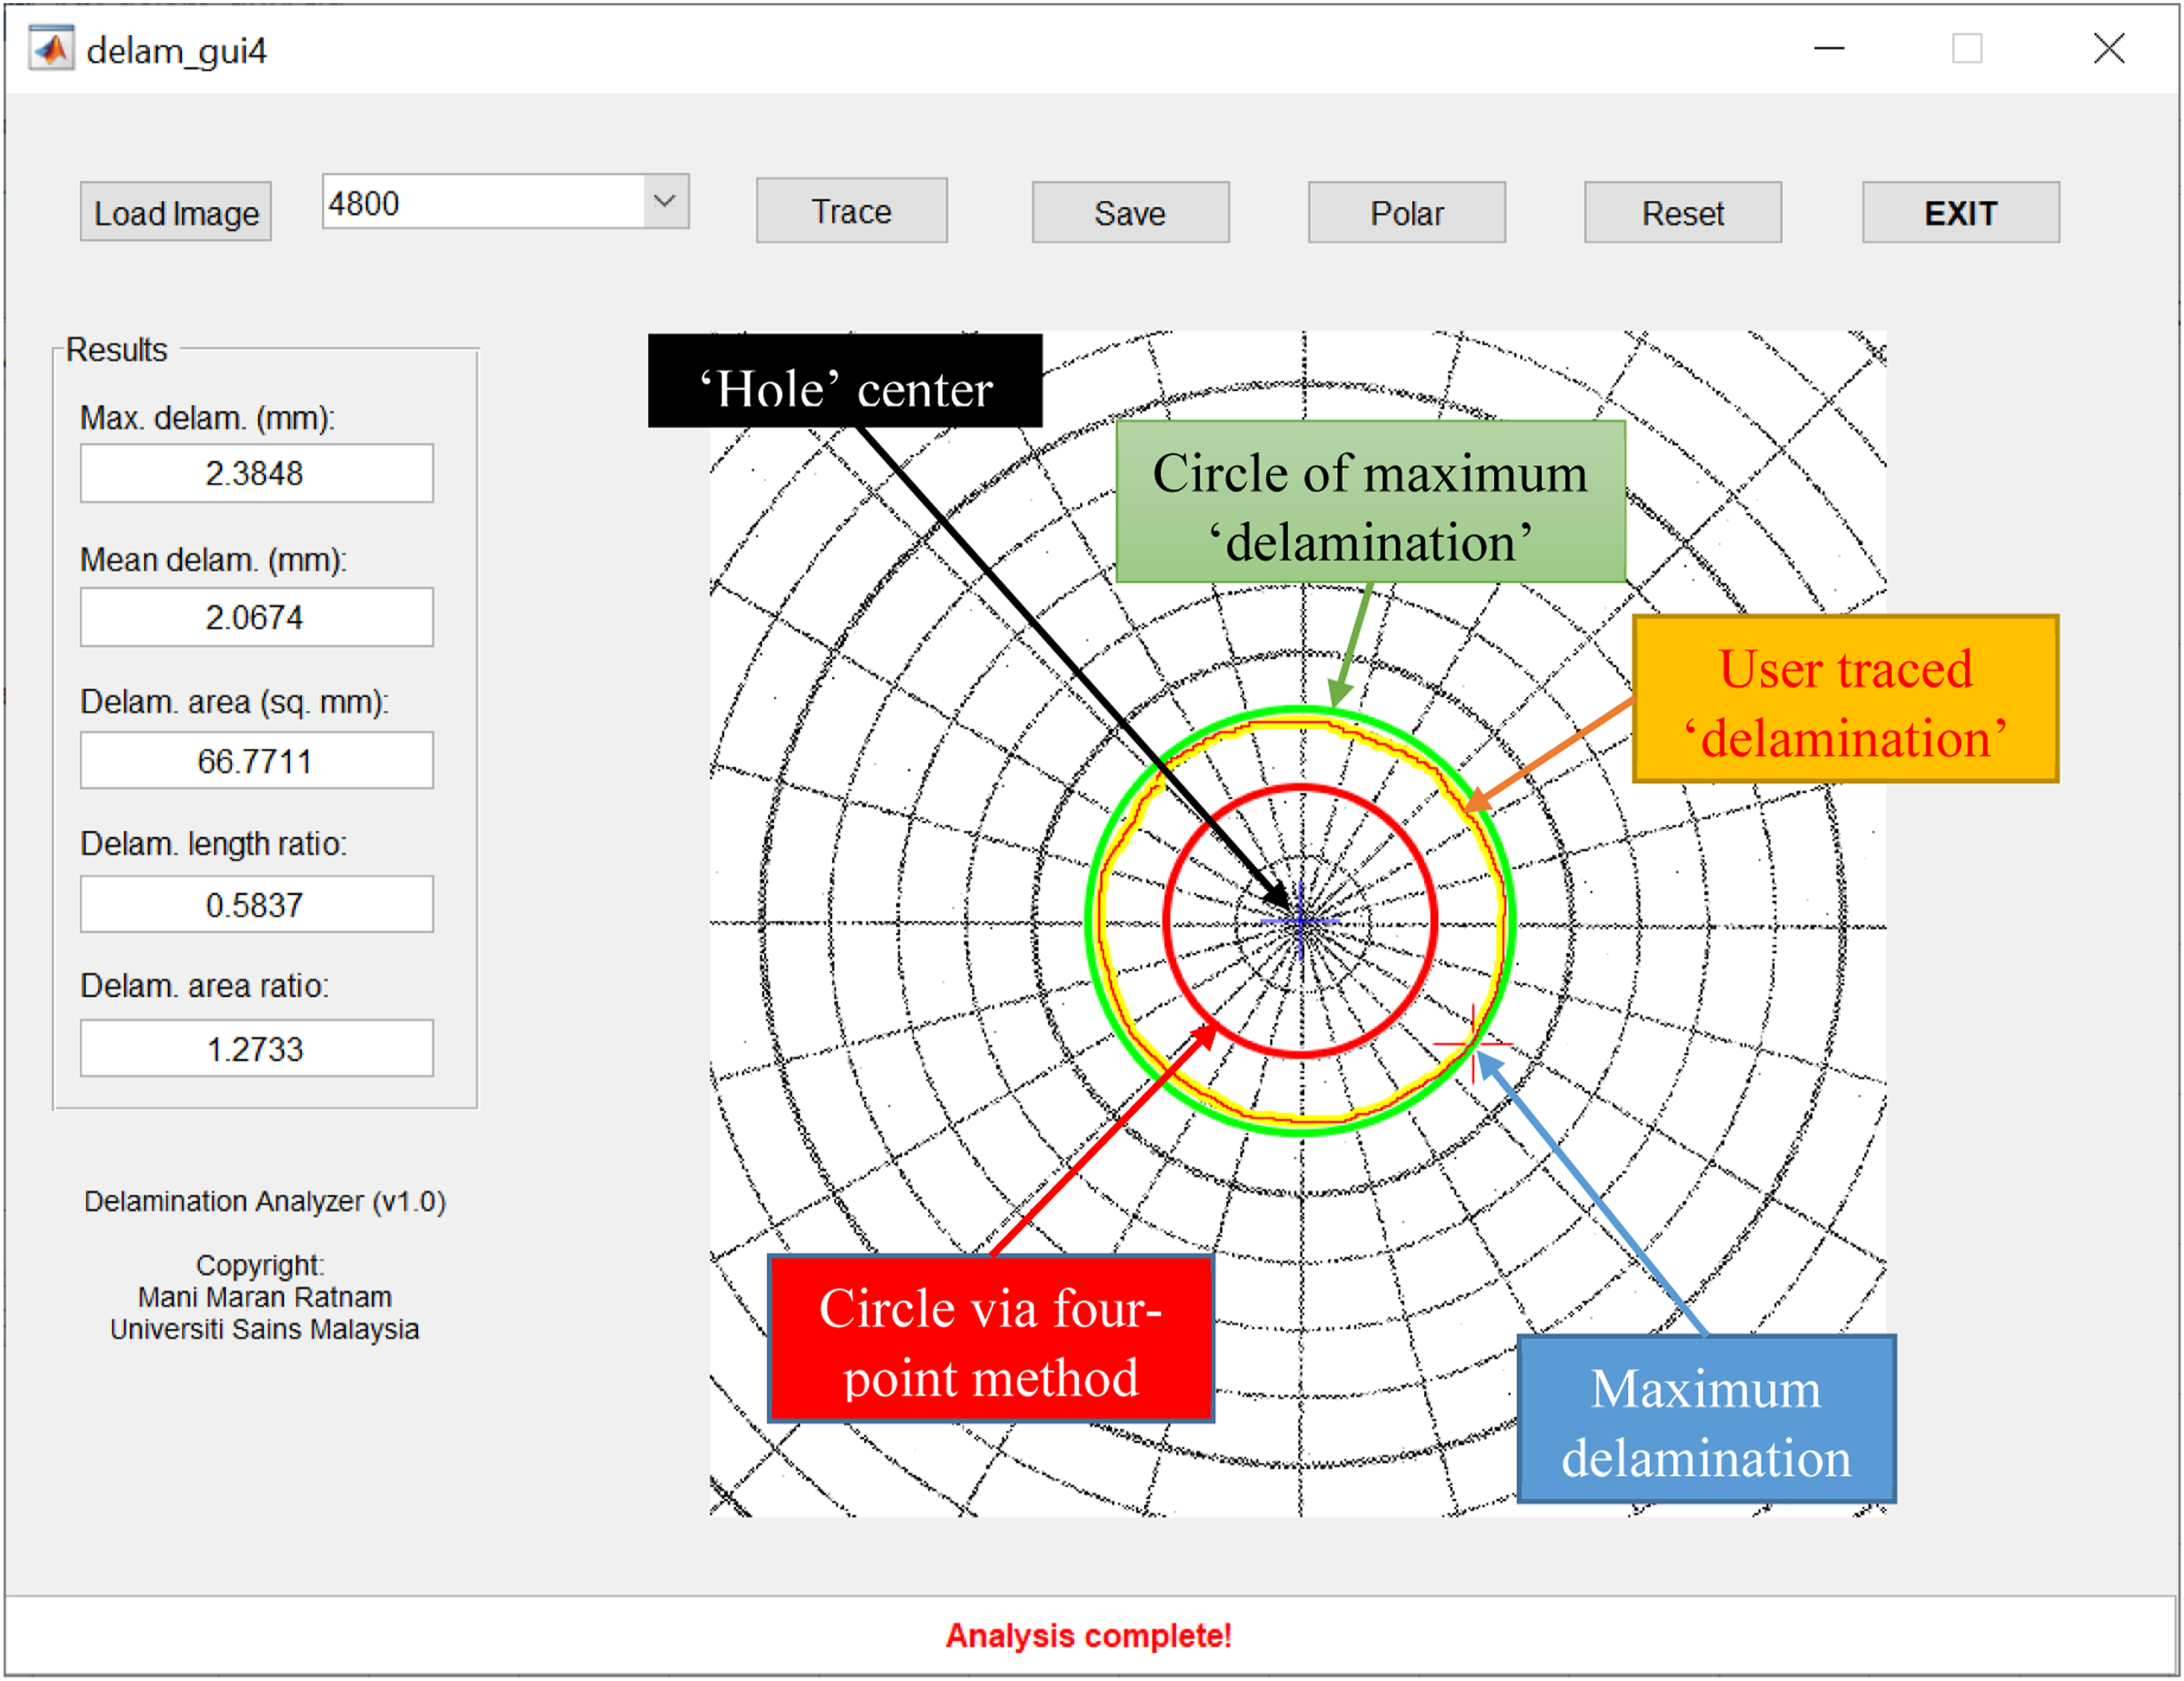
The graphical user interface developed for the delamination analysis is shown in Figure 8. The scanned image is loaded into the MATLAB GUI and the appropriate scanning resolution (1200, 2400, 4800 or 9600 dpi) is selected from the pull-down menu. The outline of the delamination is traced manually after clicking on the “Trace” button, followed by selection of four points on the circumference of the hole. Once done, the software calculates the maximum delamination, mean delamination, delamination area, delamination length ratio, and delamination area ratio. These values are displayed in the “Results” panel. The trace can be saved as an image in “jpeg” form by clicking the “Save” button. To view the polar graph shown in Figure 8(b) of the trace in a separate figure, the user has to click the “Polar” button. (a) The GUI interface of the delamination measurement and (b) a plot of delamination versus hole radius derived from the traced delamination area.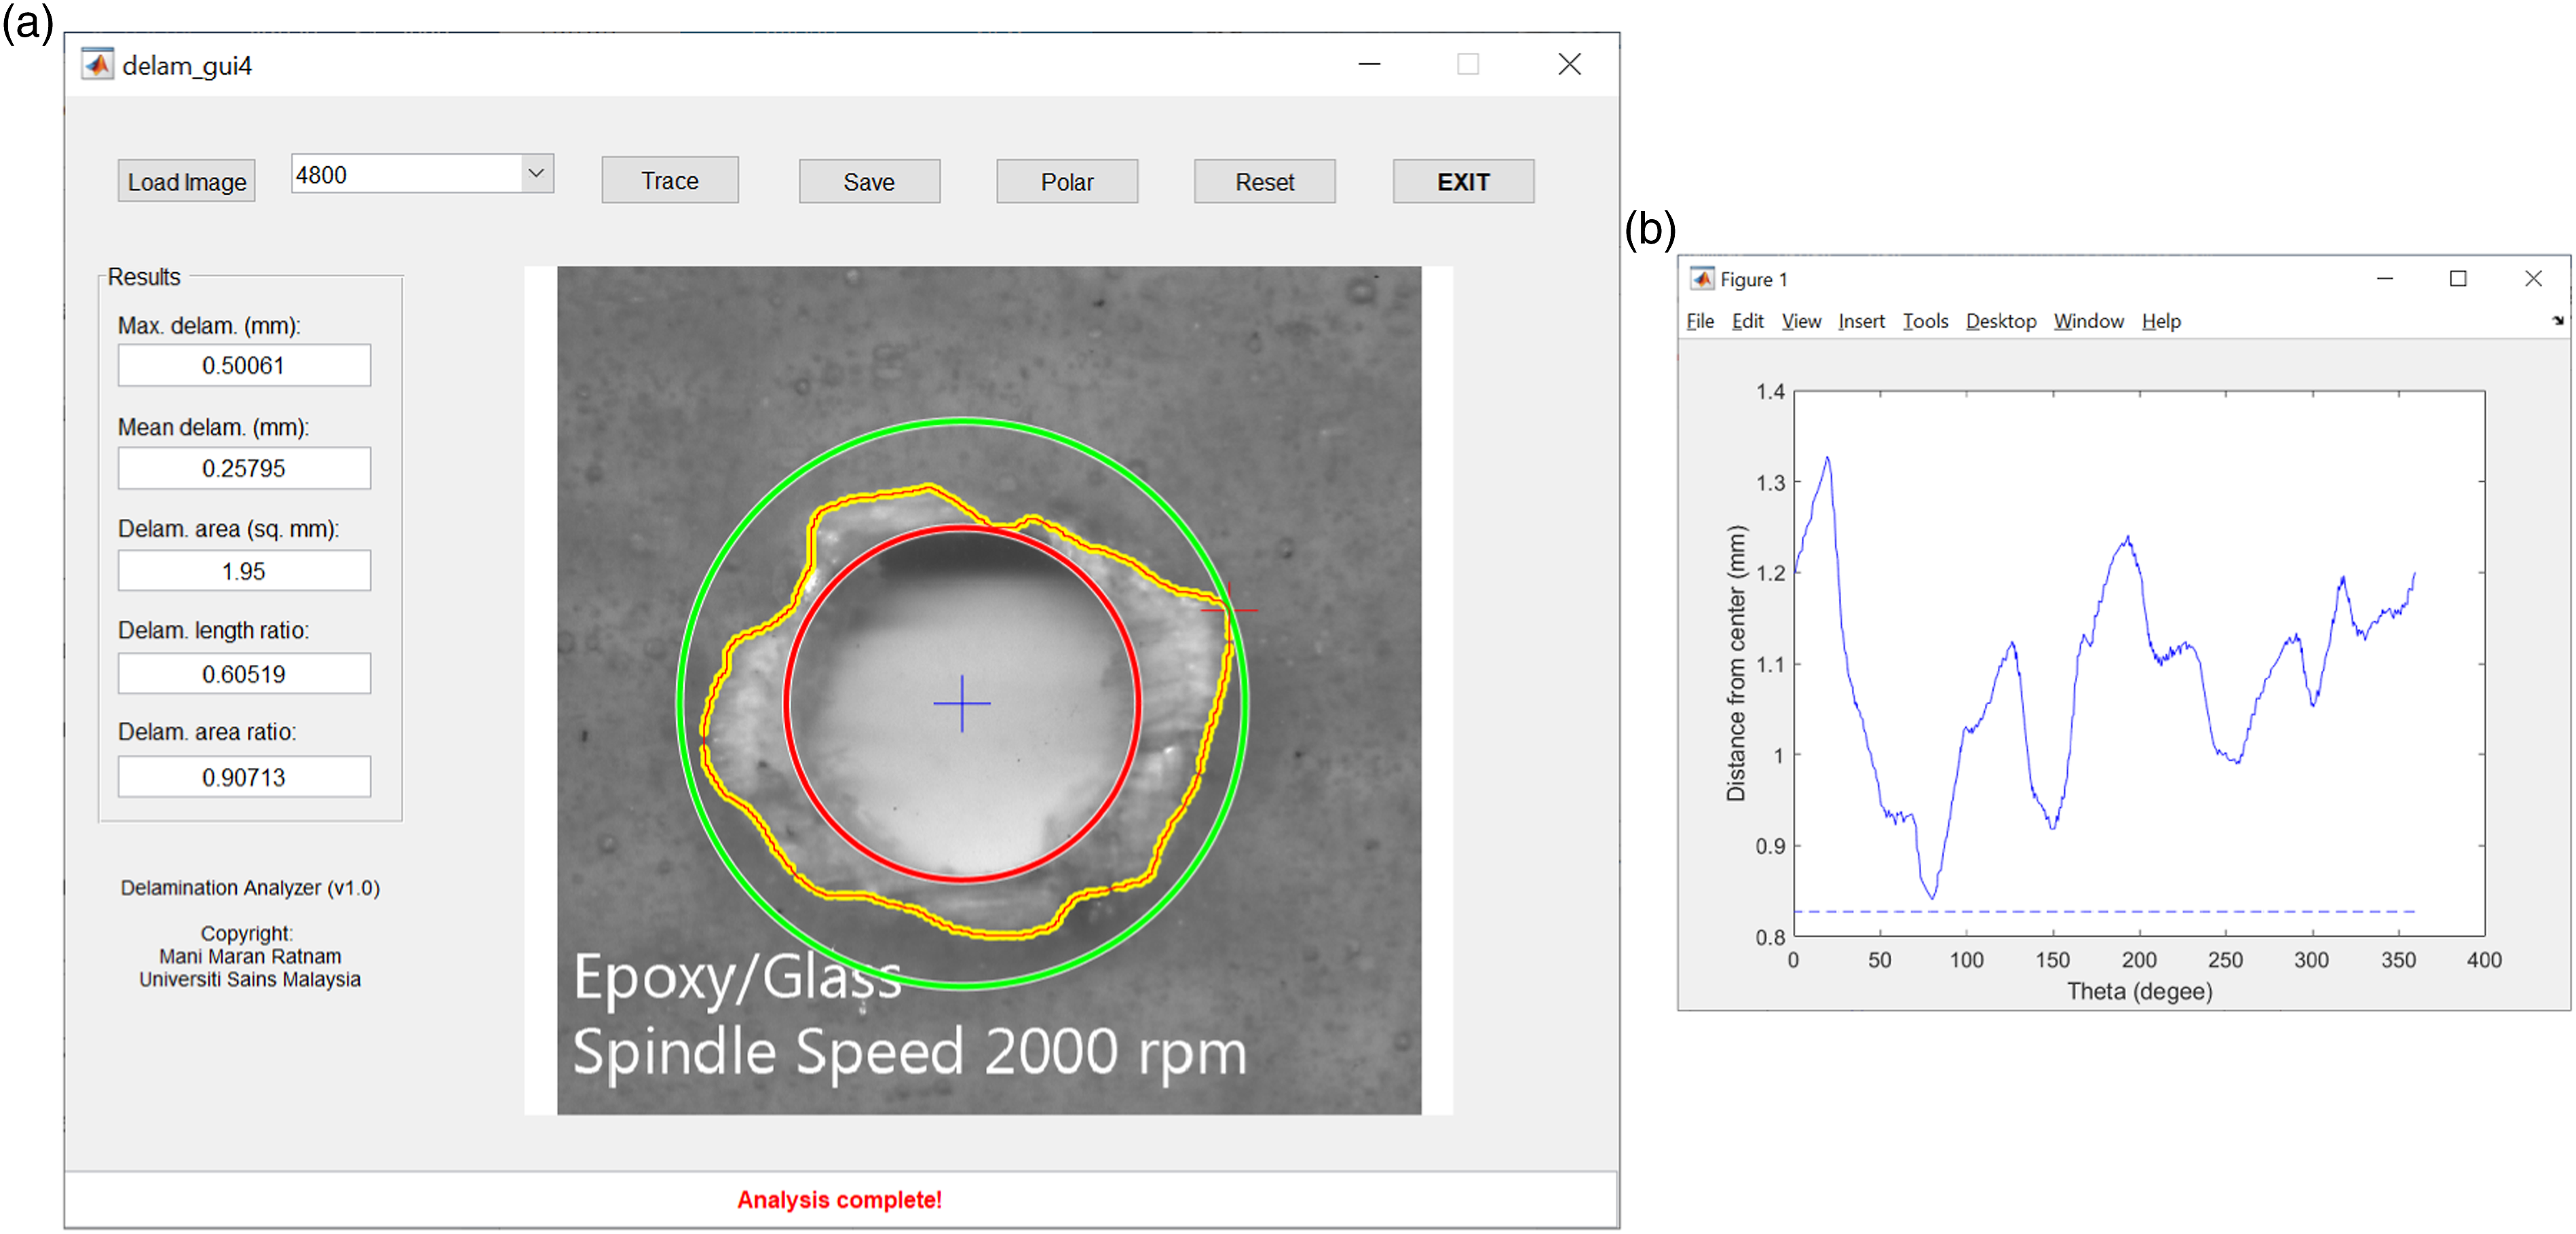
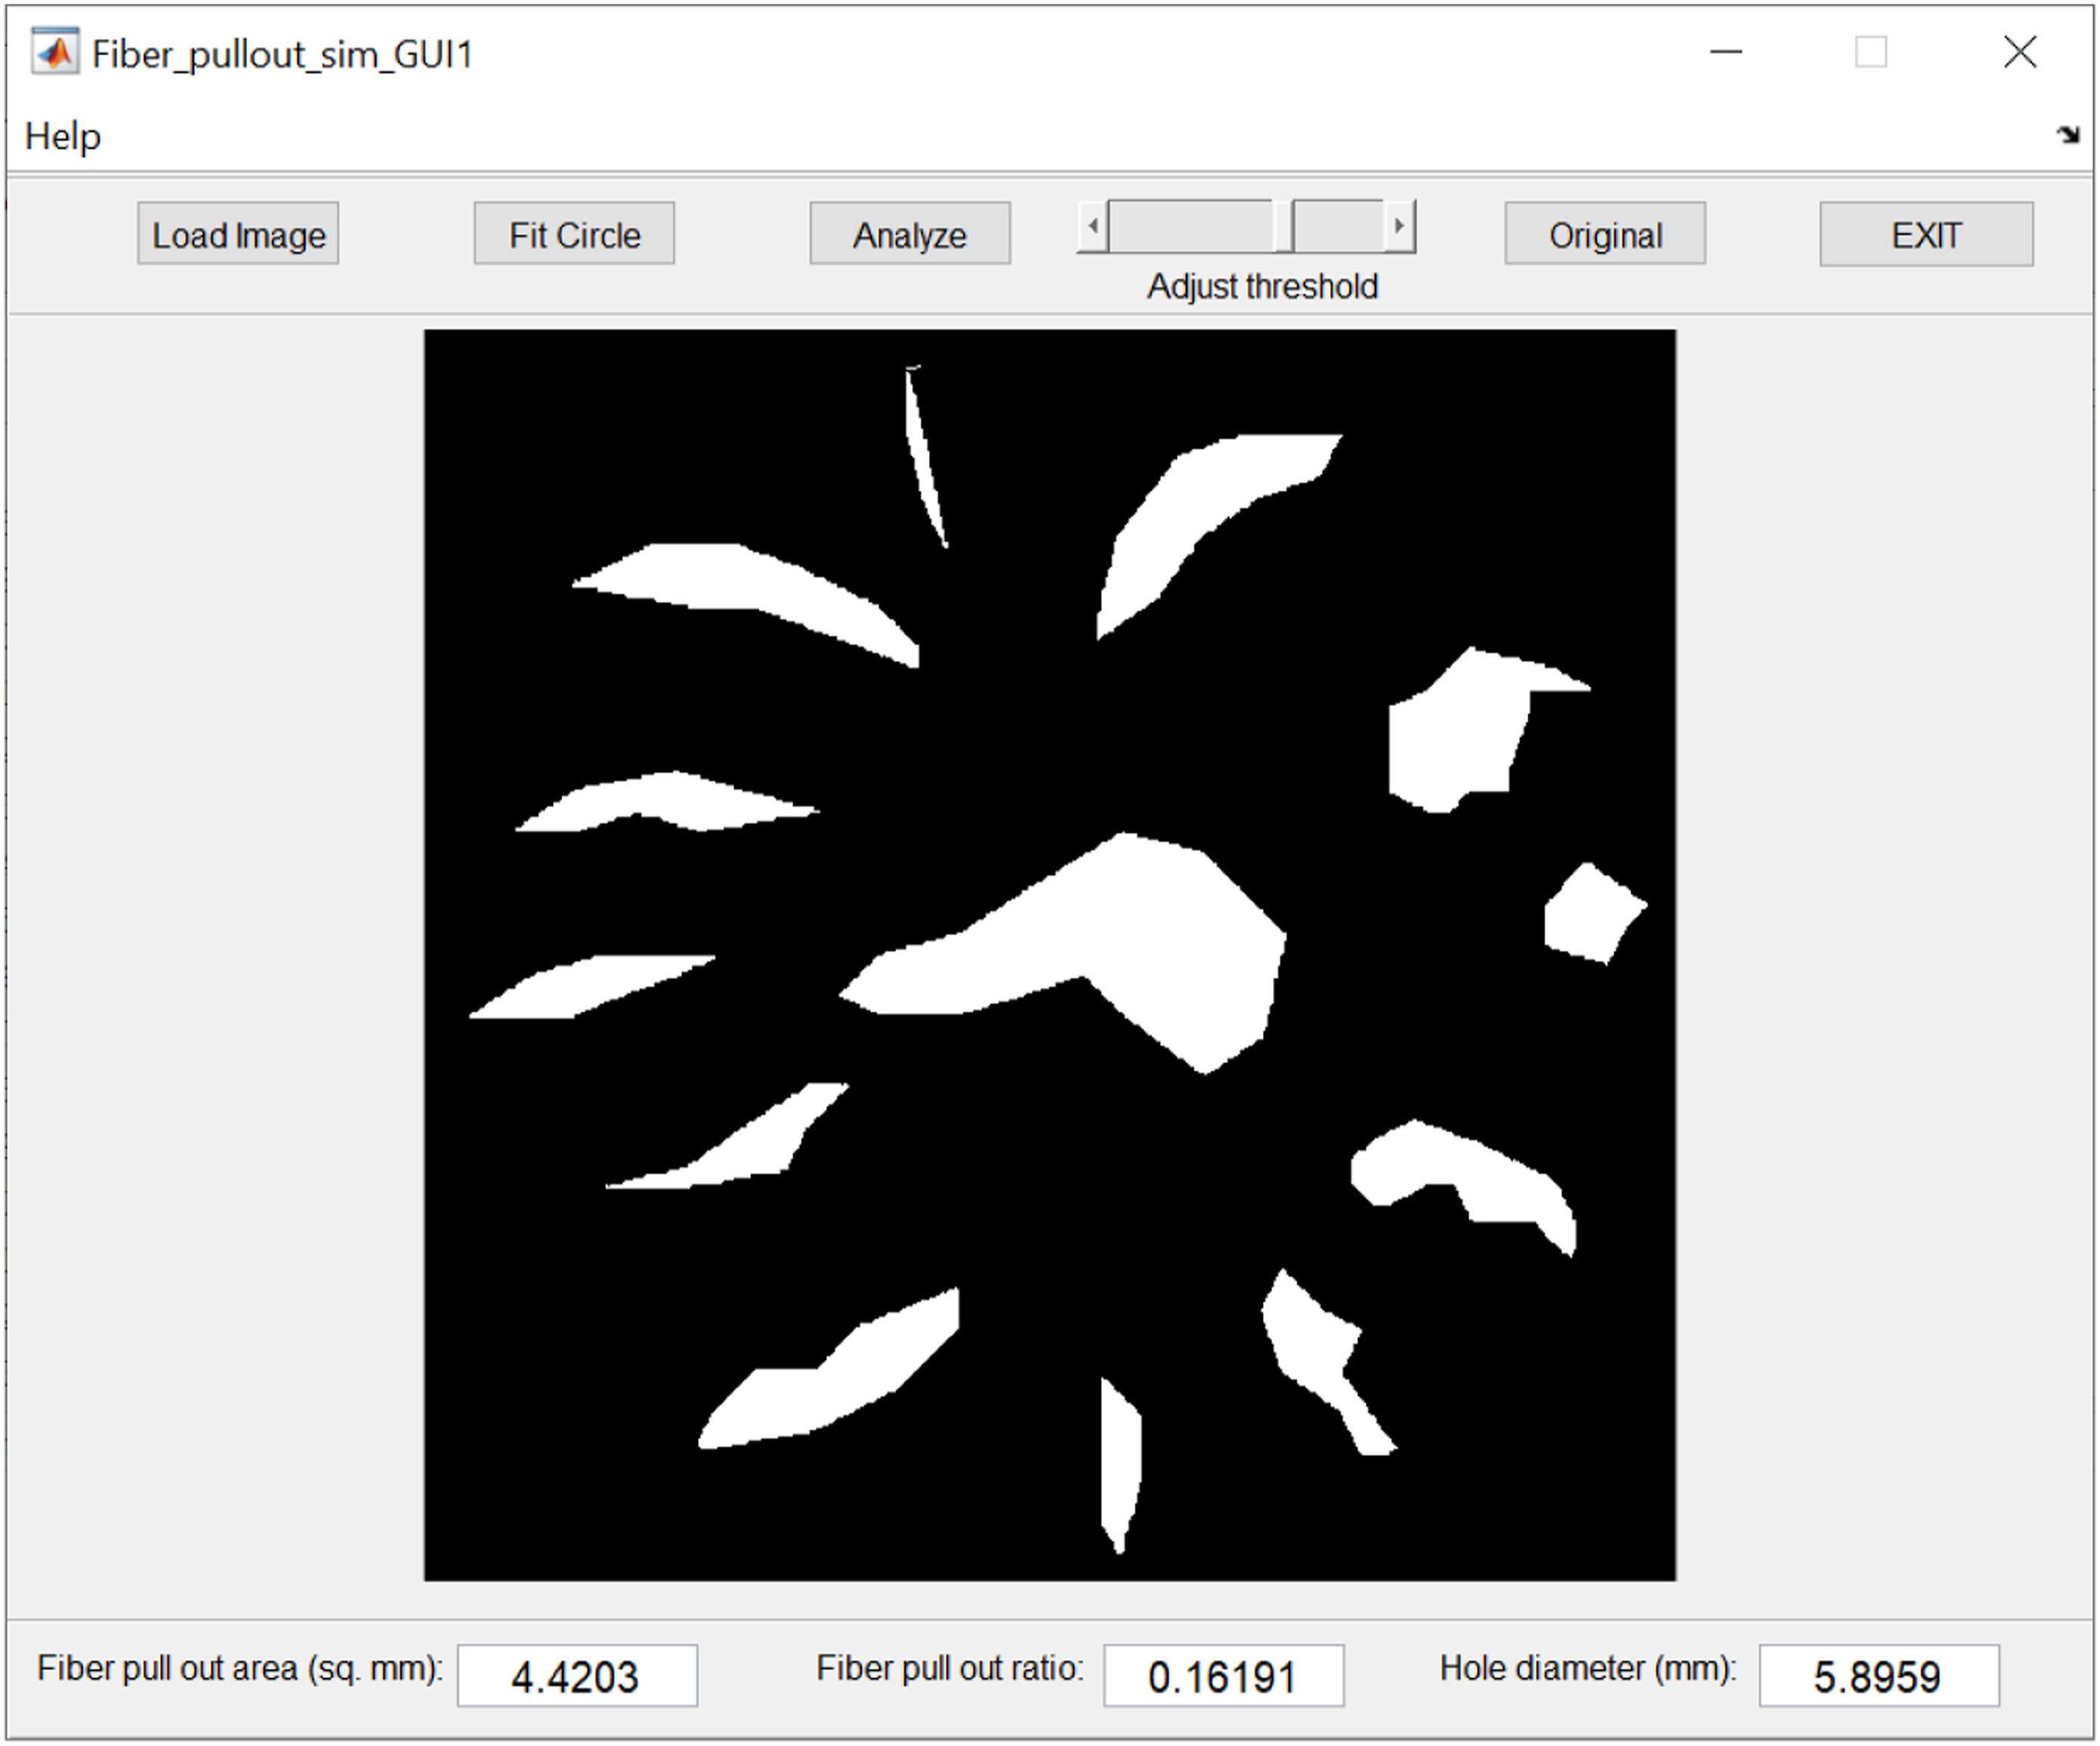
Figure 9(a) shows the GUI for the fiber pull-out analysis, while Figure 9(b) shows the original scanned image. Once the image is loaded, the “Fit Circle” button is pressed to select four points on the hole. The four points should be located as far apart as possible in order to improve the accuracy of the circle location. After circle fitting, the “Analyze” button is selected to analyze the image and determine the fiber pull-out area. In the initial stage of the analysis, the well-known Otsu’s method of automatic thresholding is used to segment the loose fiber from the background. If the segmented (binarized) image is not satisfactory, the user may use the slider to adjust the threshold value by comparing with the original image. This step is necessary so that only loose fibers of high contrast close to the hole entry or exit are segmented, whereas as much of the blurred areas within the hole as possible are excluded in the analysis. During the process of selecting the threshold value the fiber pull-out area and fiber pull-out ratio will be automatically updated in the results panel. (a) GUI for the fiber pull-out analysis and (b) the original scanned image.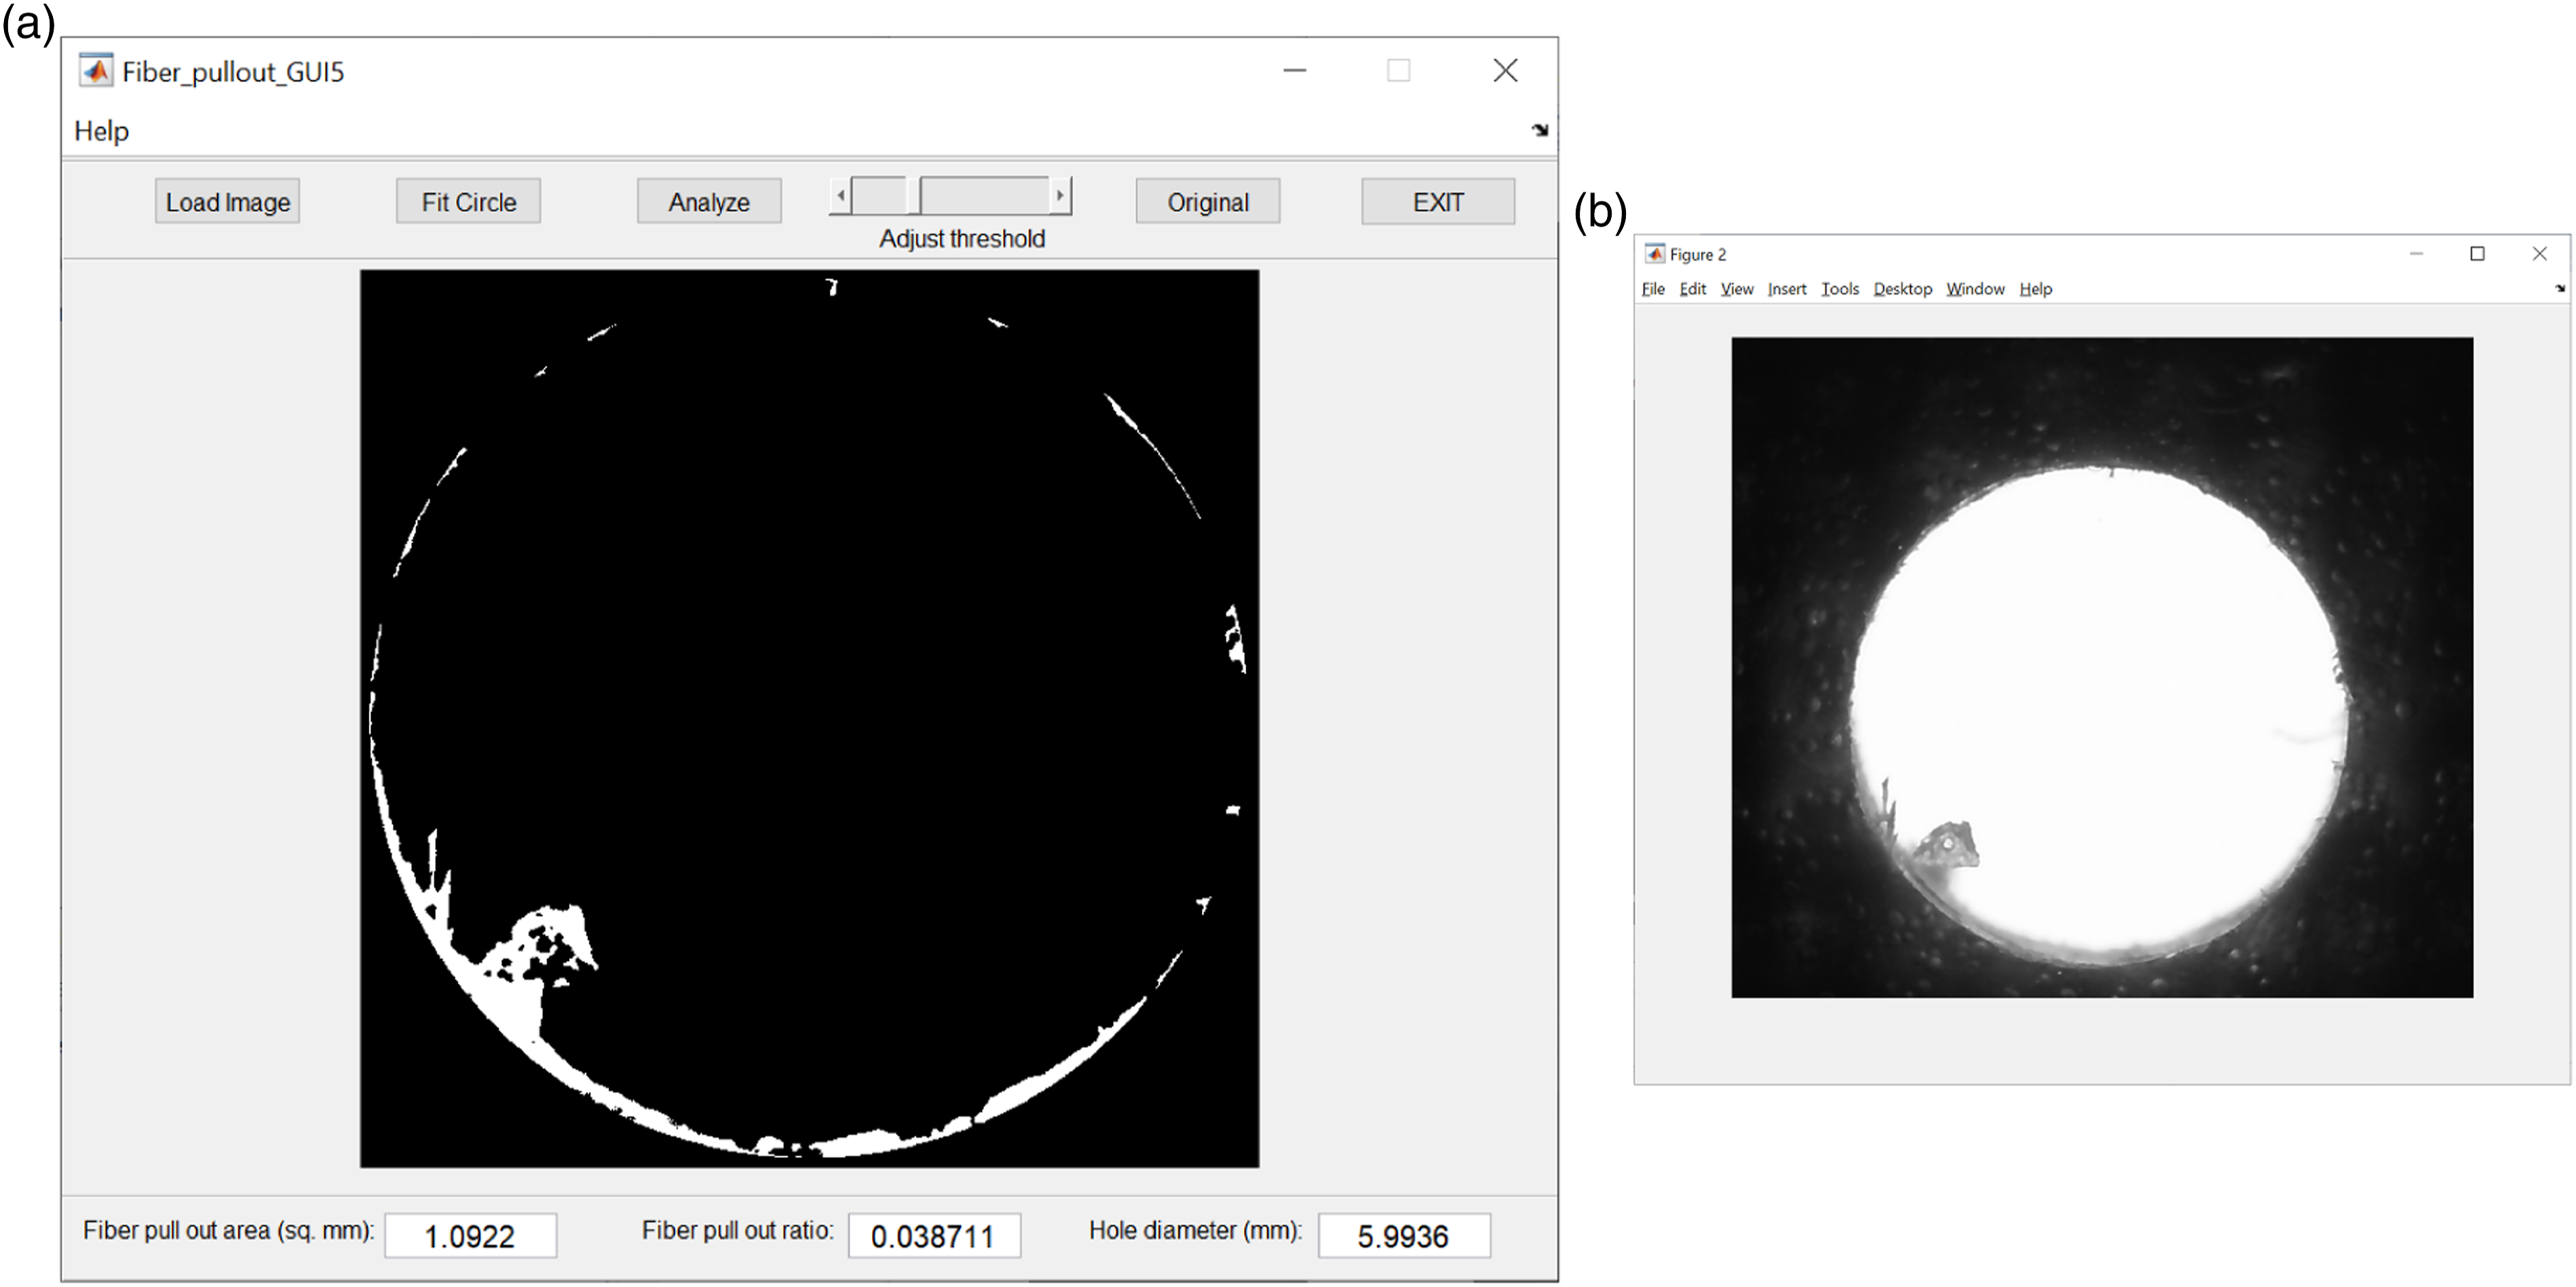
Results and discussion
Validation of delamination analysis using DTIP
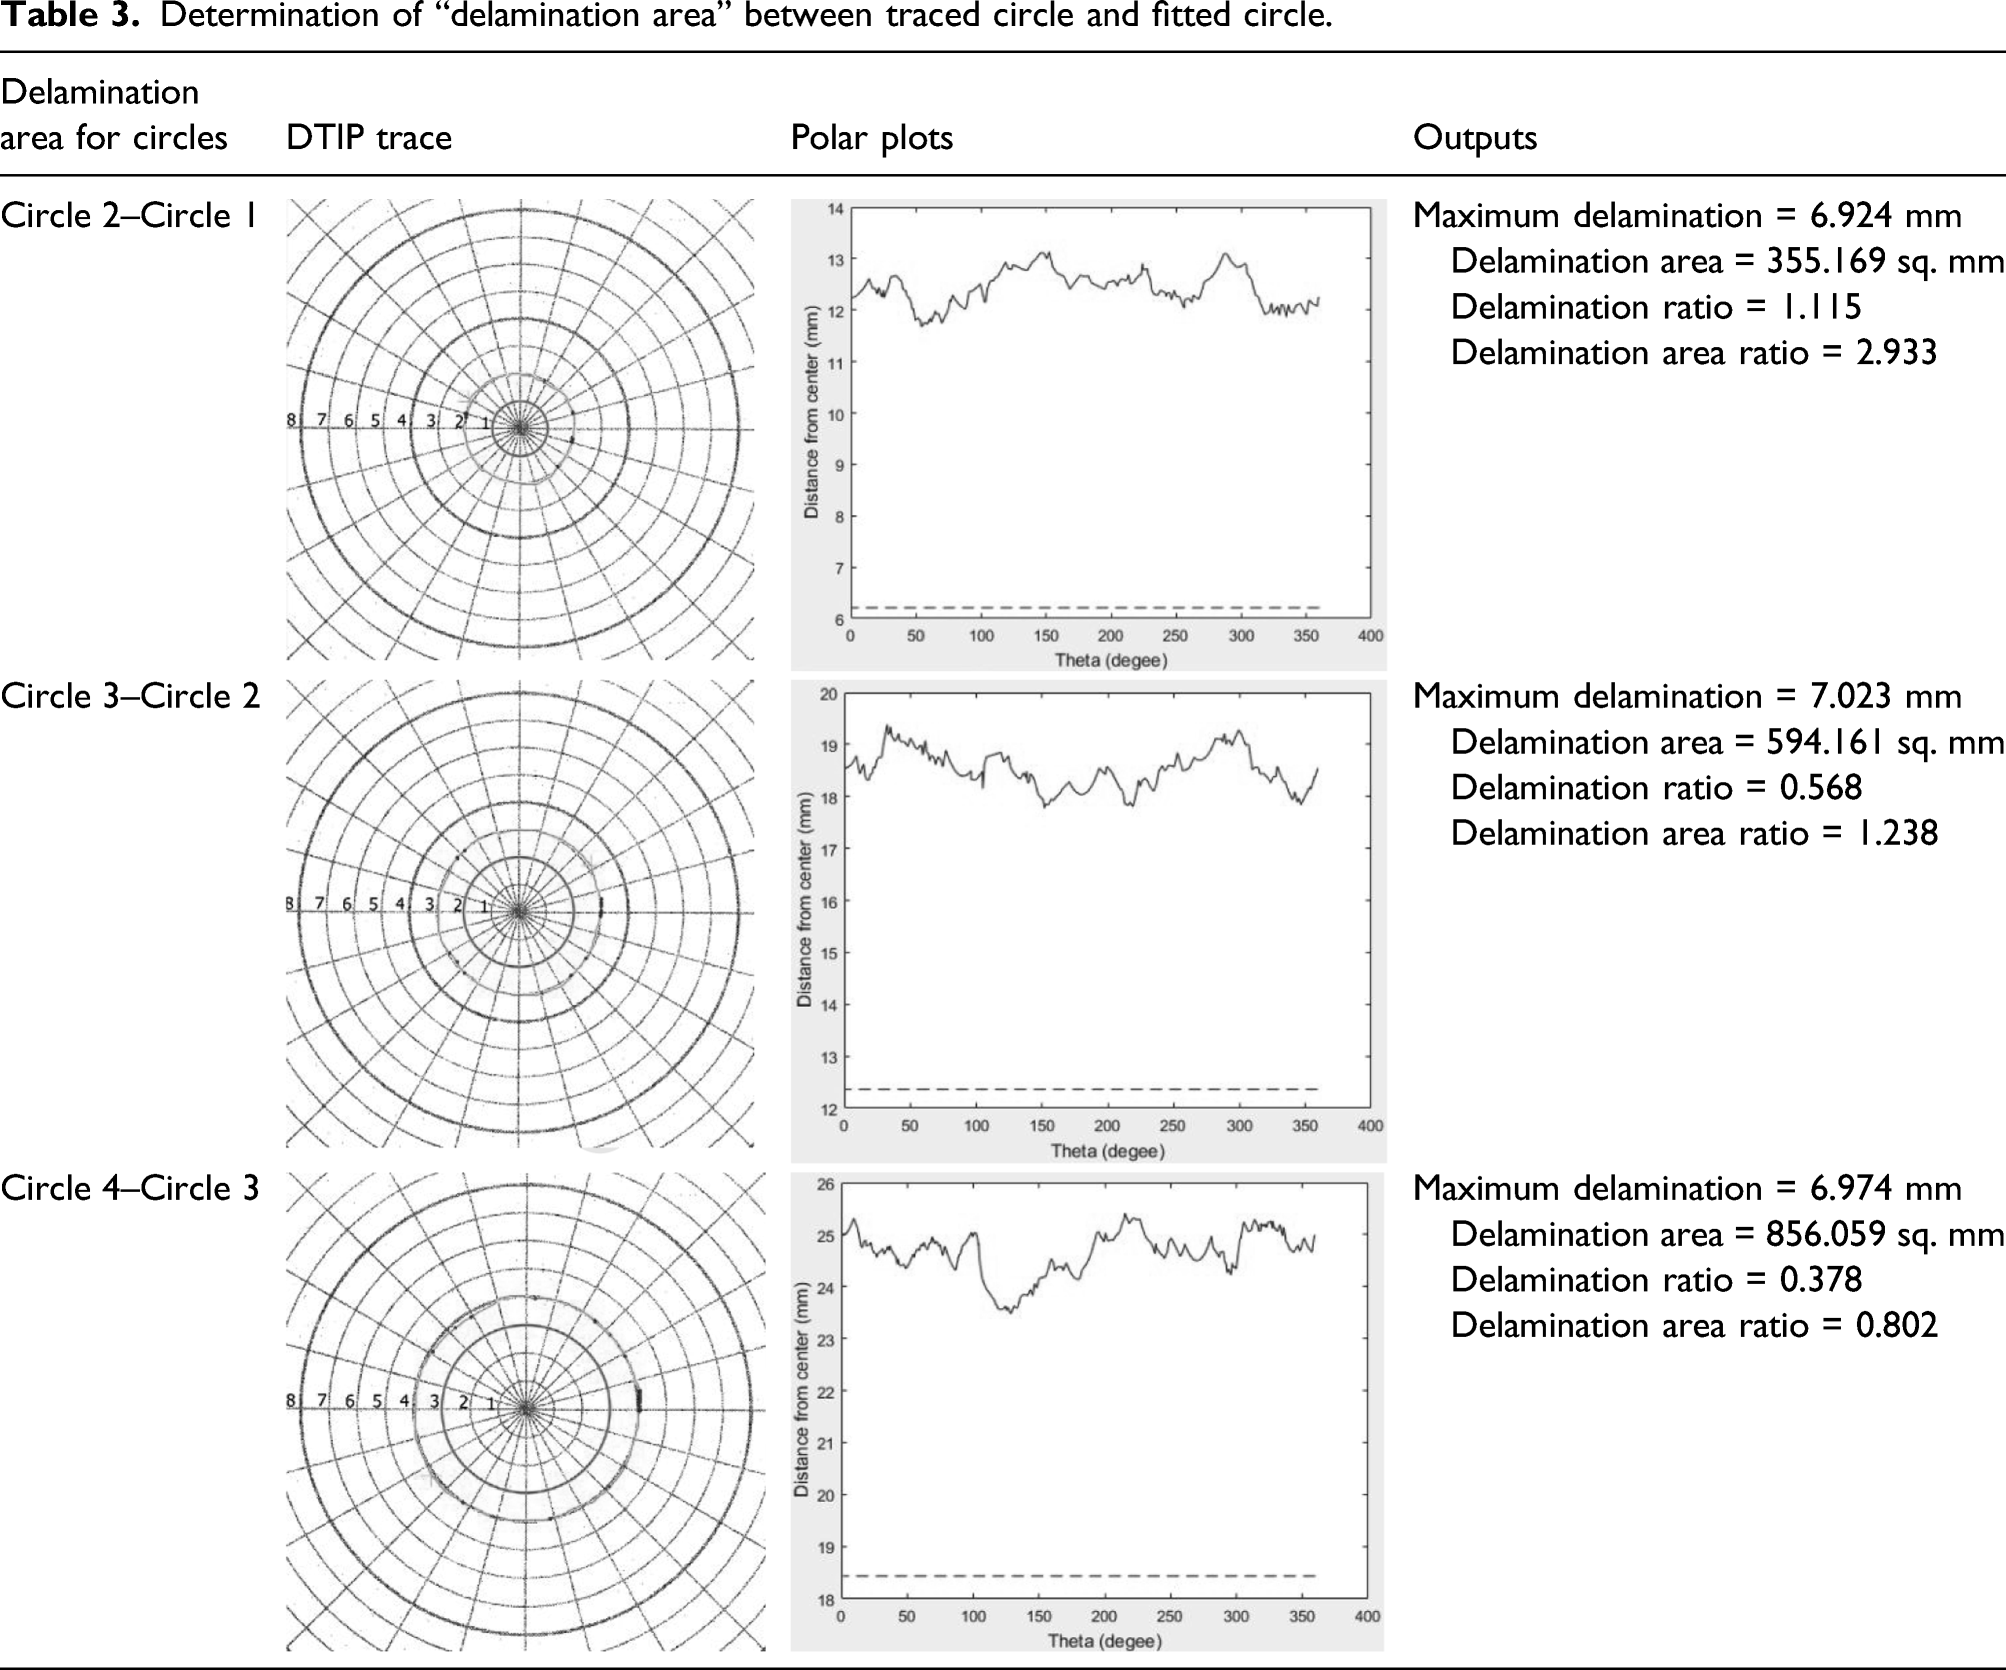
Determination of “delamination area” between traced circle and fitted circle.
Comparison of “delamination area” determined using DTIP method and by calculation.
Verification of fiber pull-out analysis GUI using simulated images
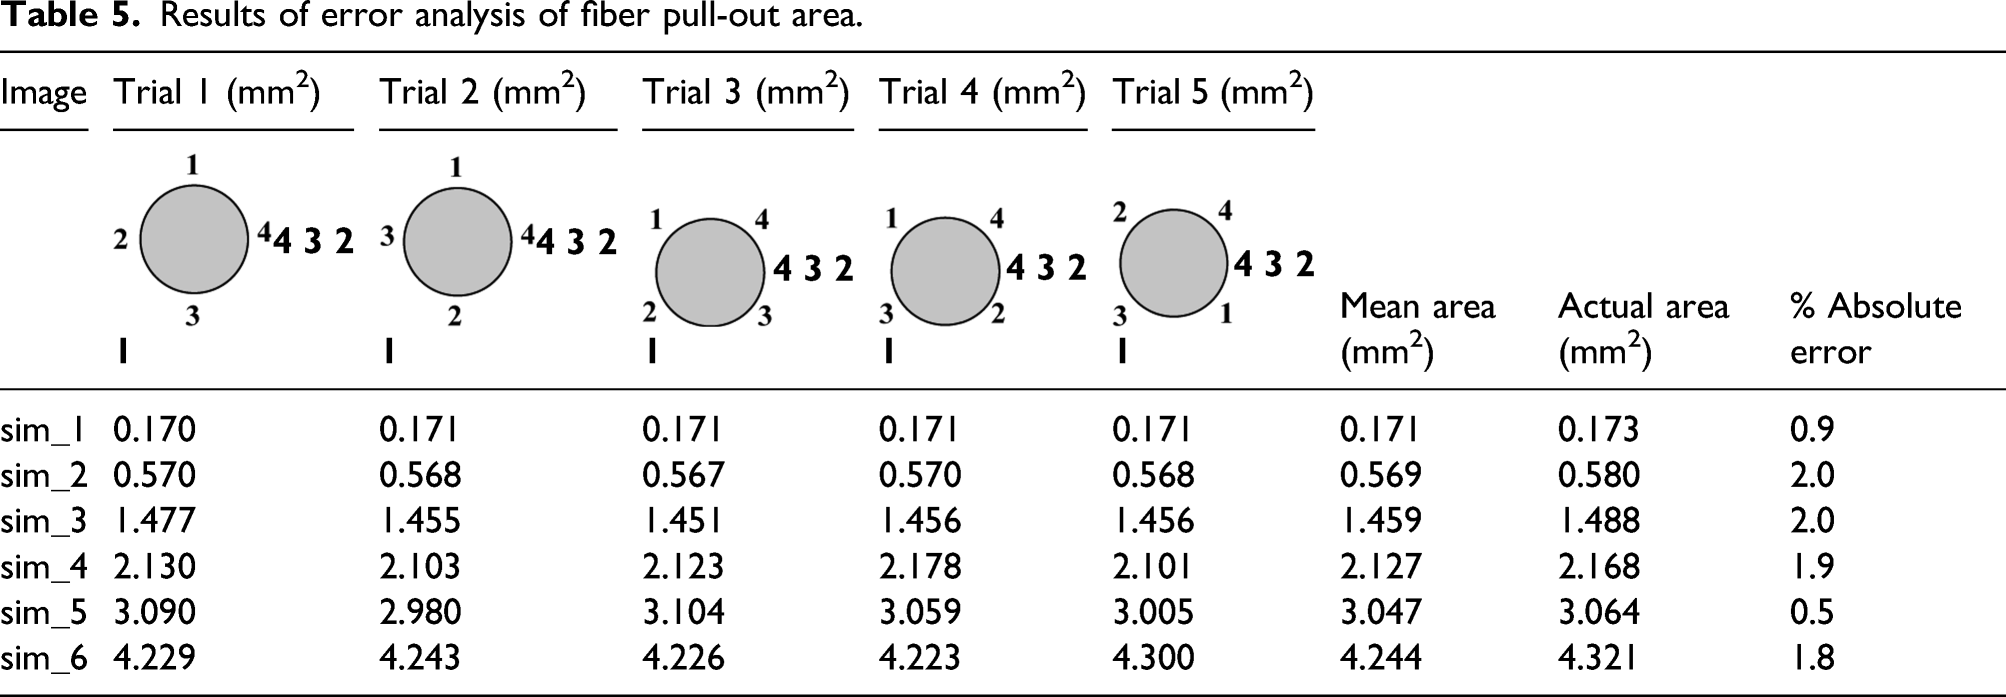
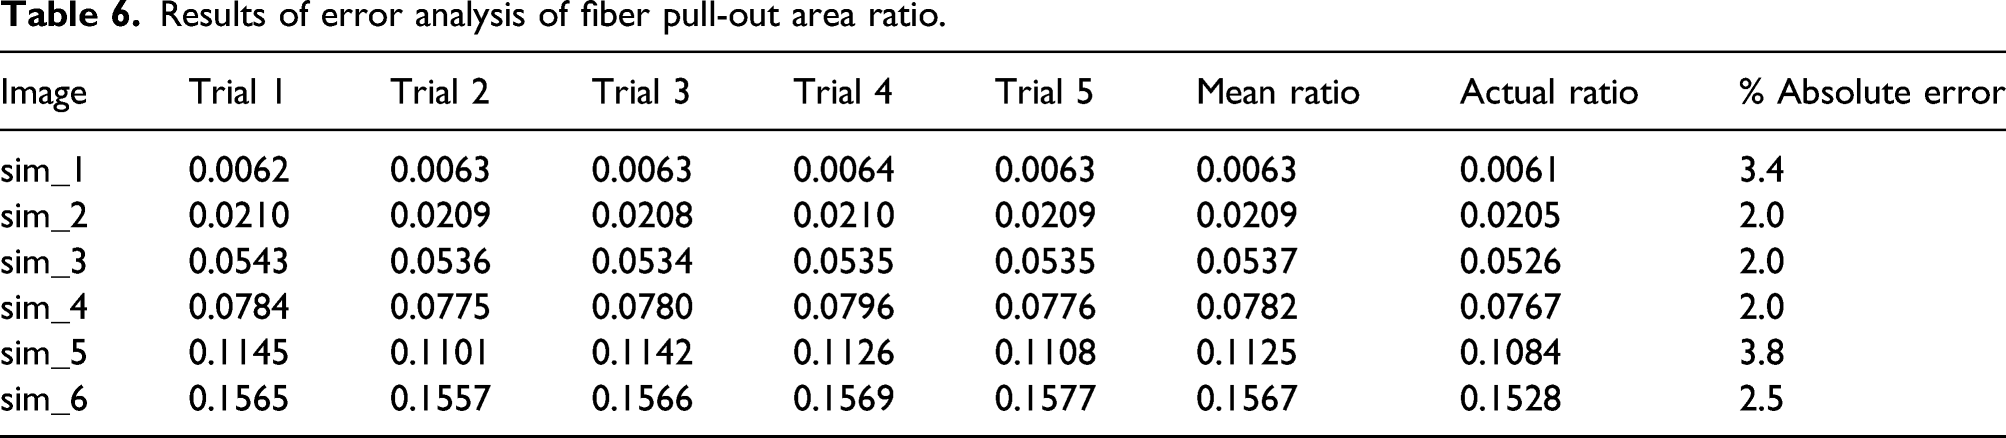
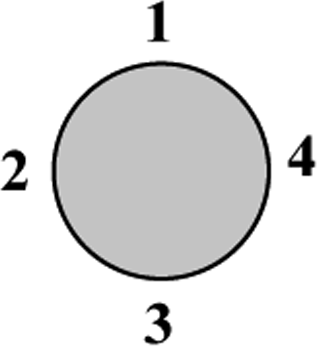
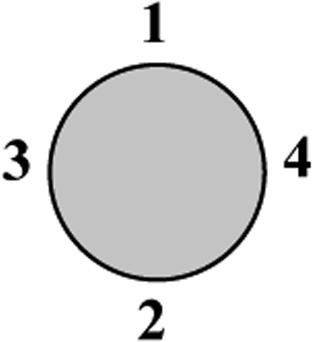
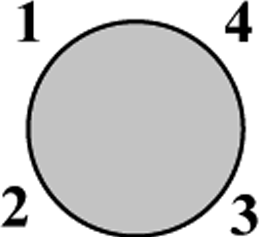
The GUI developed for finding the fiber pull-out area in the NFRCs after drilling was verified using simulated images as shown in Figure 10. These images were created using Autosketch v10 (Autodesk Inc.) software. In each image, a circle of 6 mm radius representing the hole was created. Random shapes that represent the fiber pull-out obstructing the hole were created within the hole area. Each image was cropped to 750×750 pixels using Image Analyzer v1.39 (Meesoft freeware) image editing software. The scaling factor of 0.00862 mm/pixel, determined by counting the number of pixels along a 1 mm square, was used in the software to convert pixel areas into square millimeters. Each image was read in the GUI followed by the selection of four points on the circle representing the hole. A sample output of the GUI for the last image in Figure 10 is shown in Figure 11. Five trials were attempted by changing the sequence used for selecting the four points. The results of the area analysis are shown in Table 5, together with the sequence of selecting the four points. The actual area of the simulated fiber pull-out was determined using blob analysis in a separate MATLAB code. Table 6 shows the results of pull-out area ratio analysis. The results show that the “fiber pull-out” area can be determined within absolute error of 2.0%, while the “fiber pull-out” ratio can be determined within absolute error of 3.8%. Simulated images used to verify fiber pull-out analysis GUI. Sample GUI output for last image in Figure 10 (sim_6). Results of error analysis of fiber pull-out area. Results of error analysis of fiber pull-out area ratio.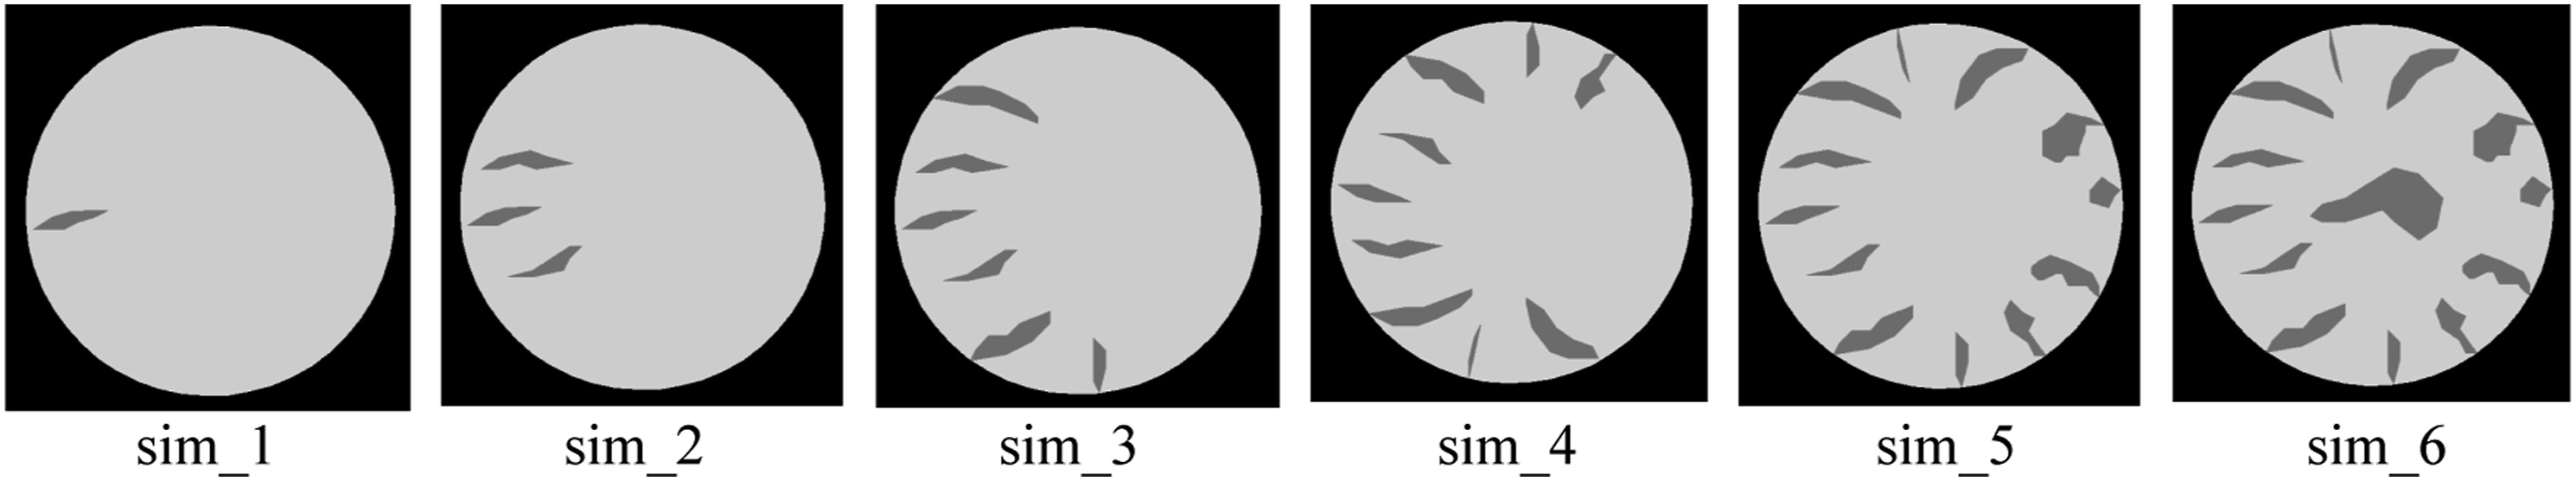
Observation of delamination on different drilling parameters
By using the new DTIP method, the drilled hole delamination can be easily measured in terms of the delamination area, delamination factors, and maximum delamination, at the hole entry and hole exit using scanned images. The data acquired from DTIP can be used to analyze the combination of drilling parameters. Figure 12 shows the drilled holes in jute epoxy composites scanned at 4800 dpi resolution, while Figure 13 shows the backlight scanned hole images. Scanned images of hole entry with designation D = hole diameter (mm), F = feed rate (mm/min) and N = spindle speed (rpm). (Example: D6F20N1000 refers to D = 6 mm, F=20 mm/min, and N = 1000 rpm): (a) D4F20N500, (b) D4F50N1000, (c) D4F100N2000, (d) D54F20N500, (e) D5F50N1000, (f) D5F100N2000, (g) D6F20N500, (h) D6F50N1000, and (i) D6F100N2000. Backlight images of hole entry with designation D = hole diameter (mm), F = feed rate (mm/min), and N = spindle speed (rpm). (Example: D6F20N1000 refers to D = 6 mm, F = 20 mm/min, and N = 1000 rpm. BL refers to backlight): (a) BL-D4F20N500, (b) BL-D4F50N1000, (c) BL-D4F100N2000, (d) BL-D5F50N500, (e) BL-D5F50N1000, (f) BL-D5F100N2000, (g) BL-D6F20N500, (h) BL-D6F50N1000, and (i) BL-D6F100N2000.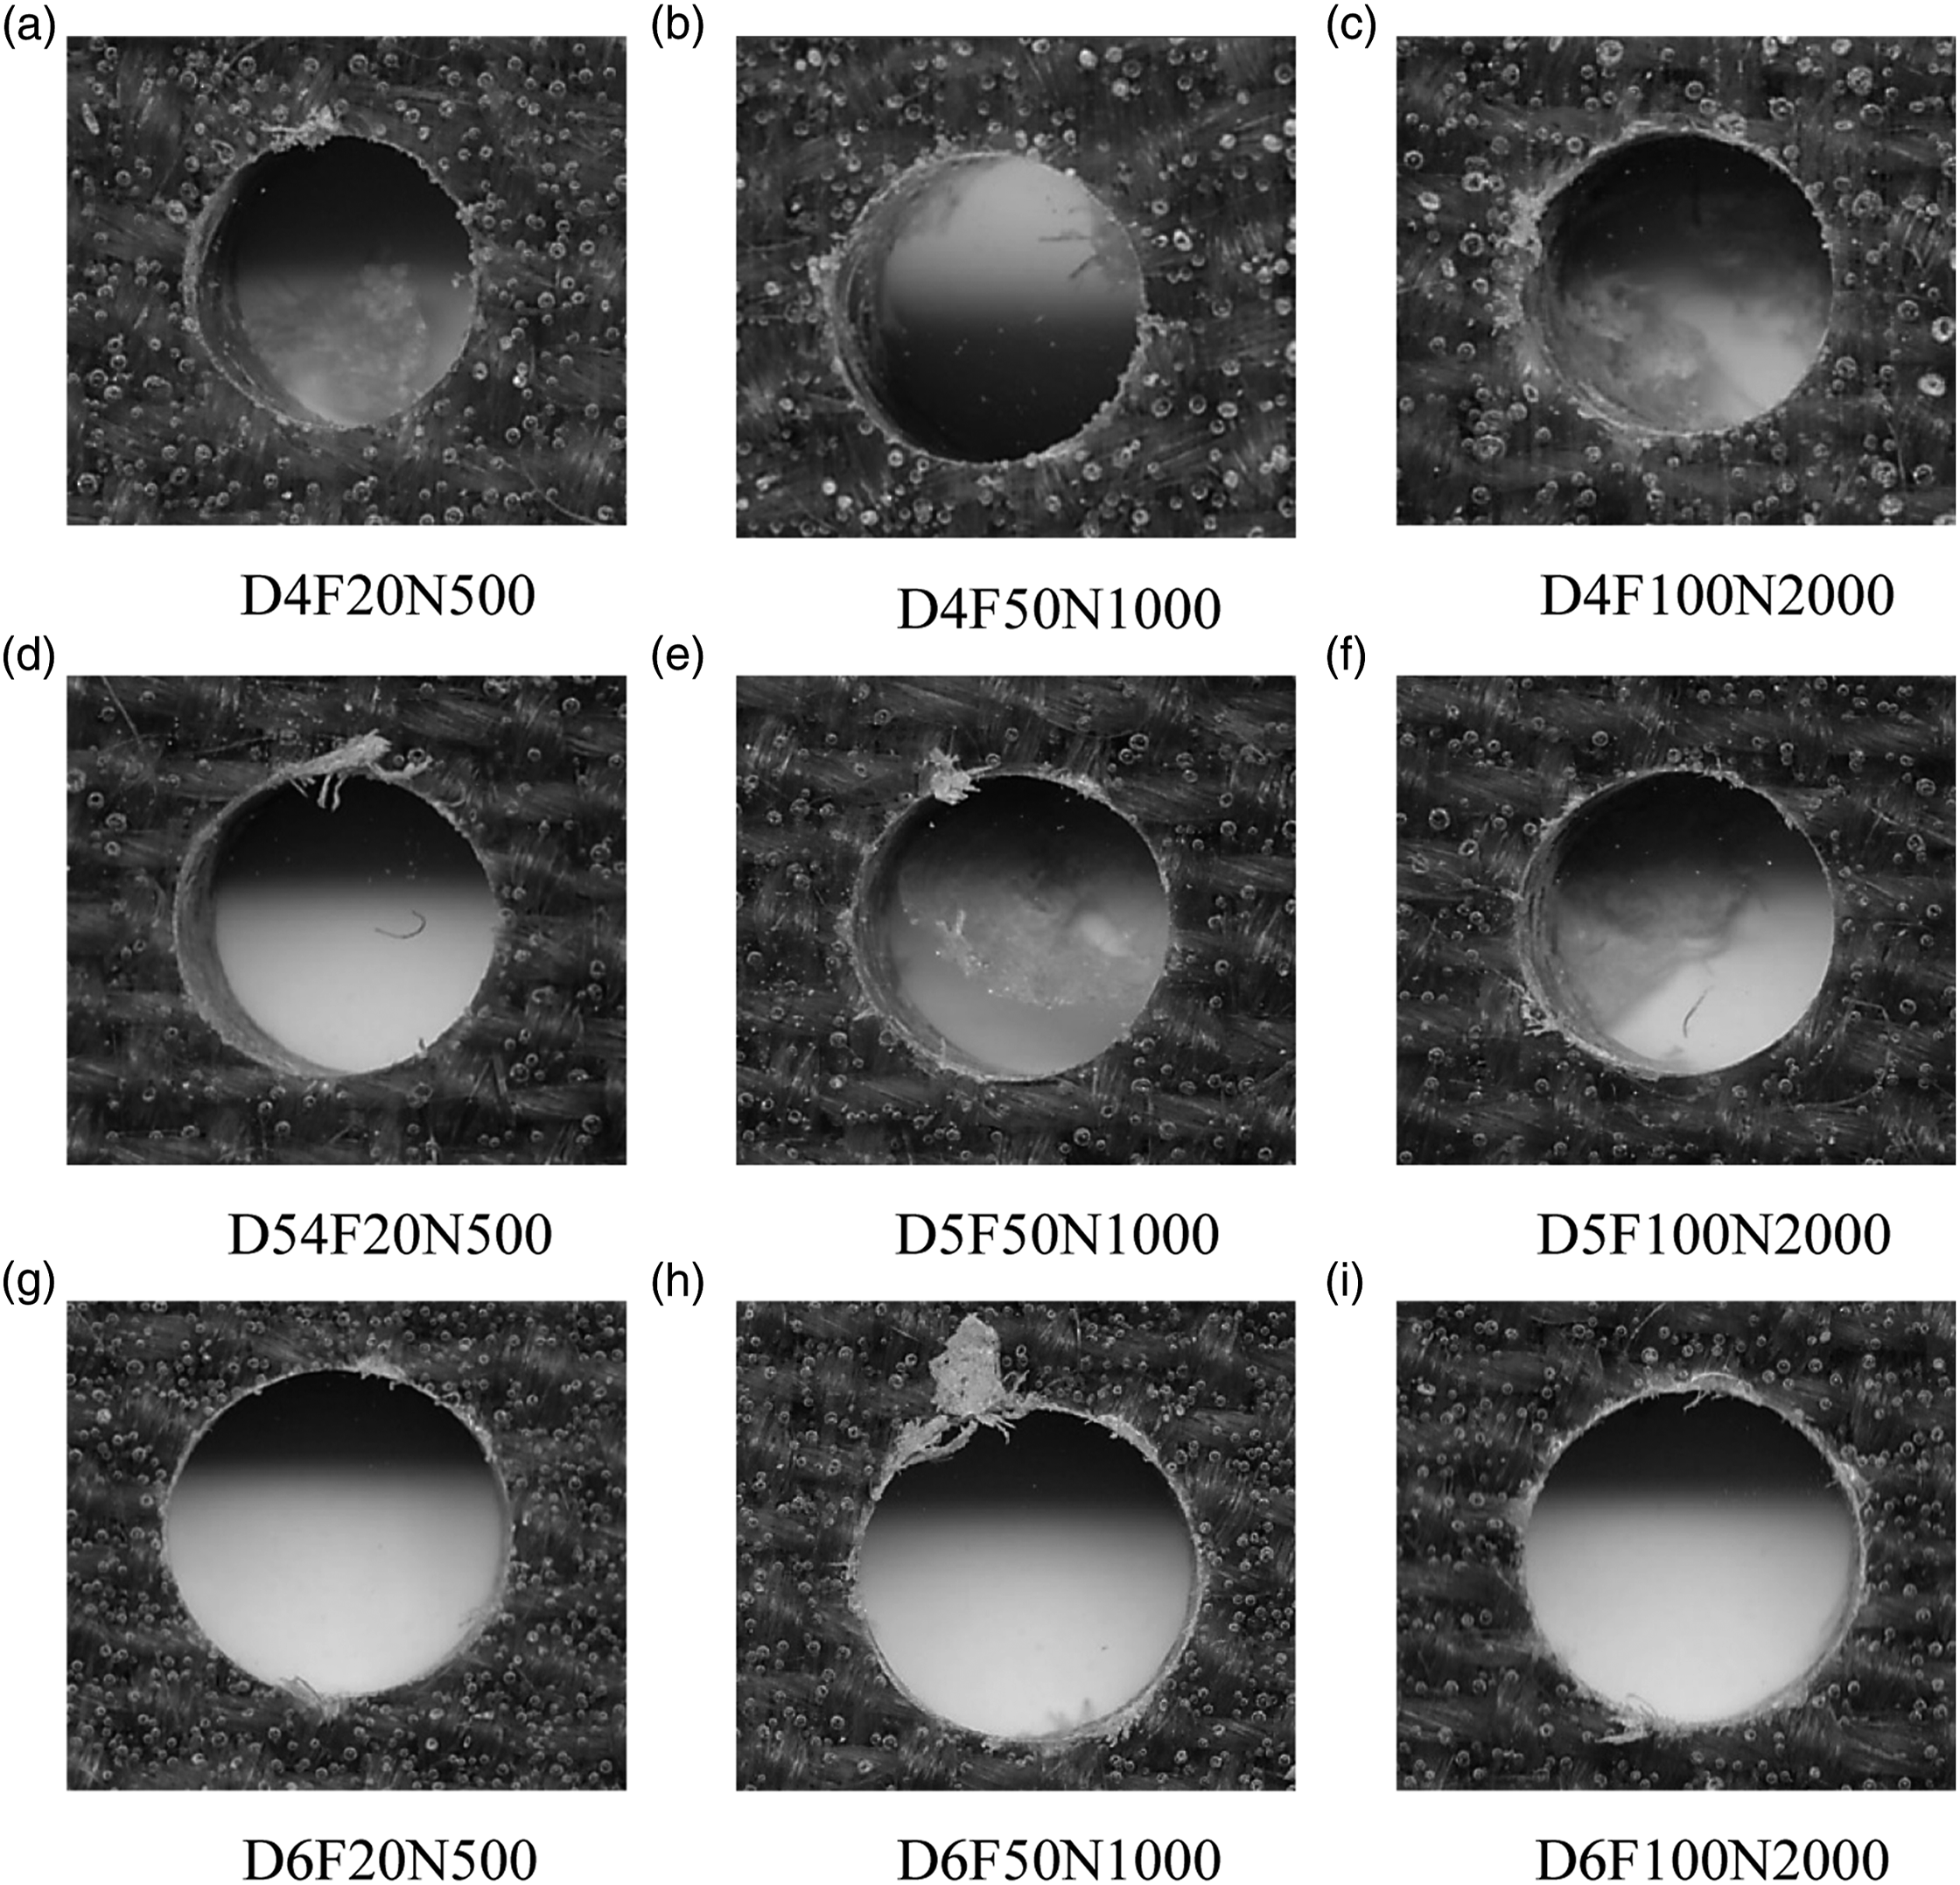
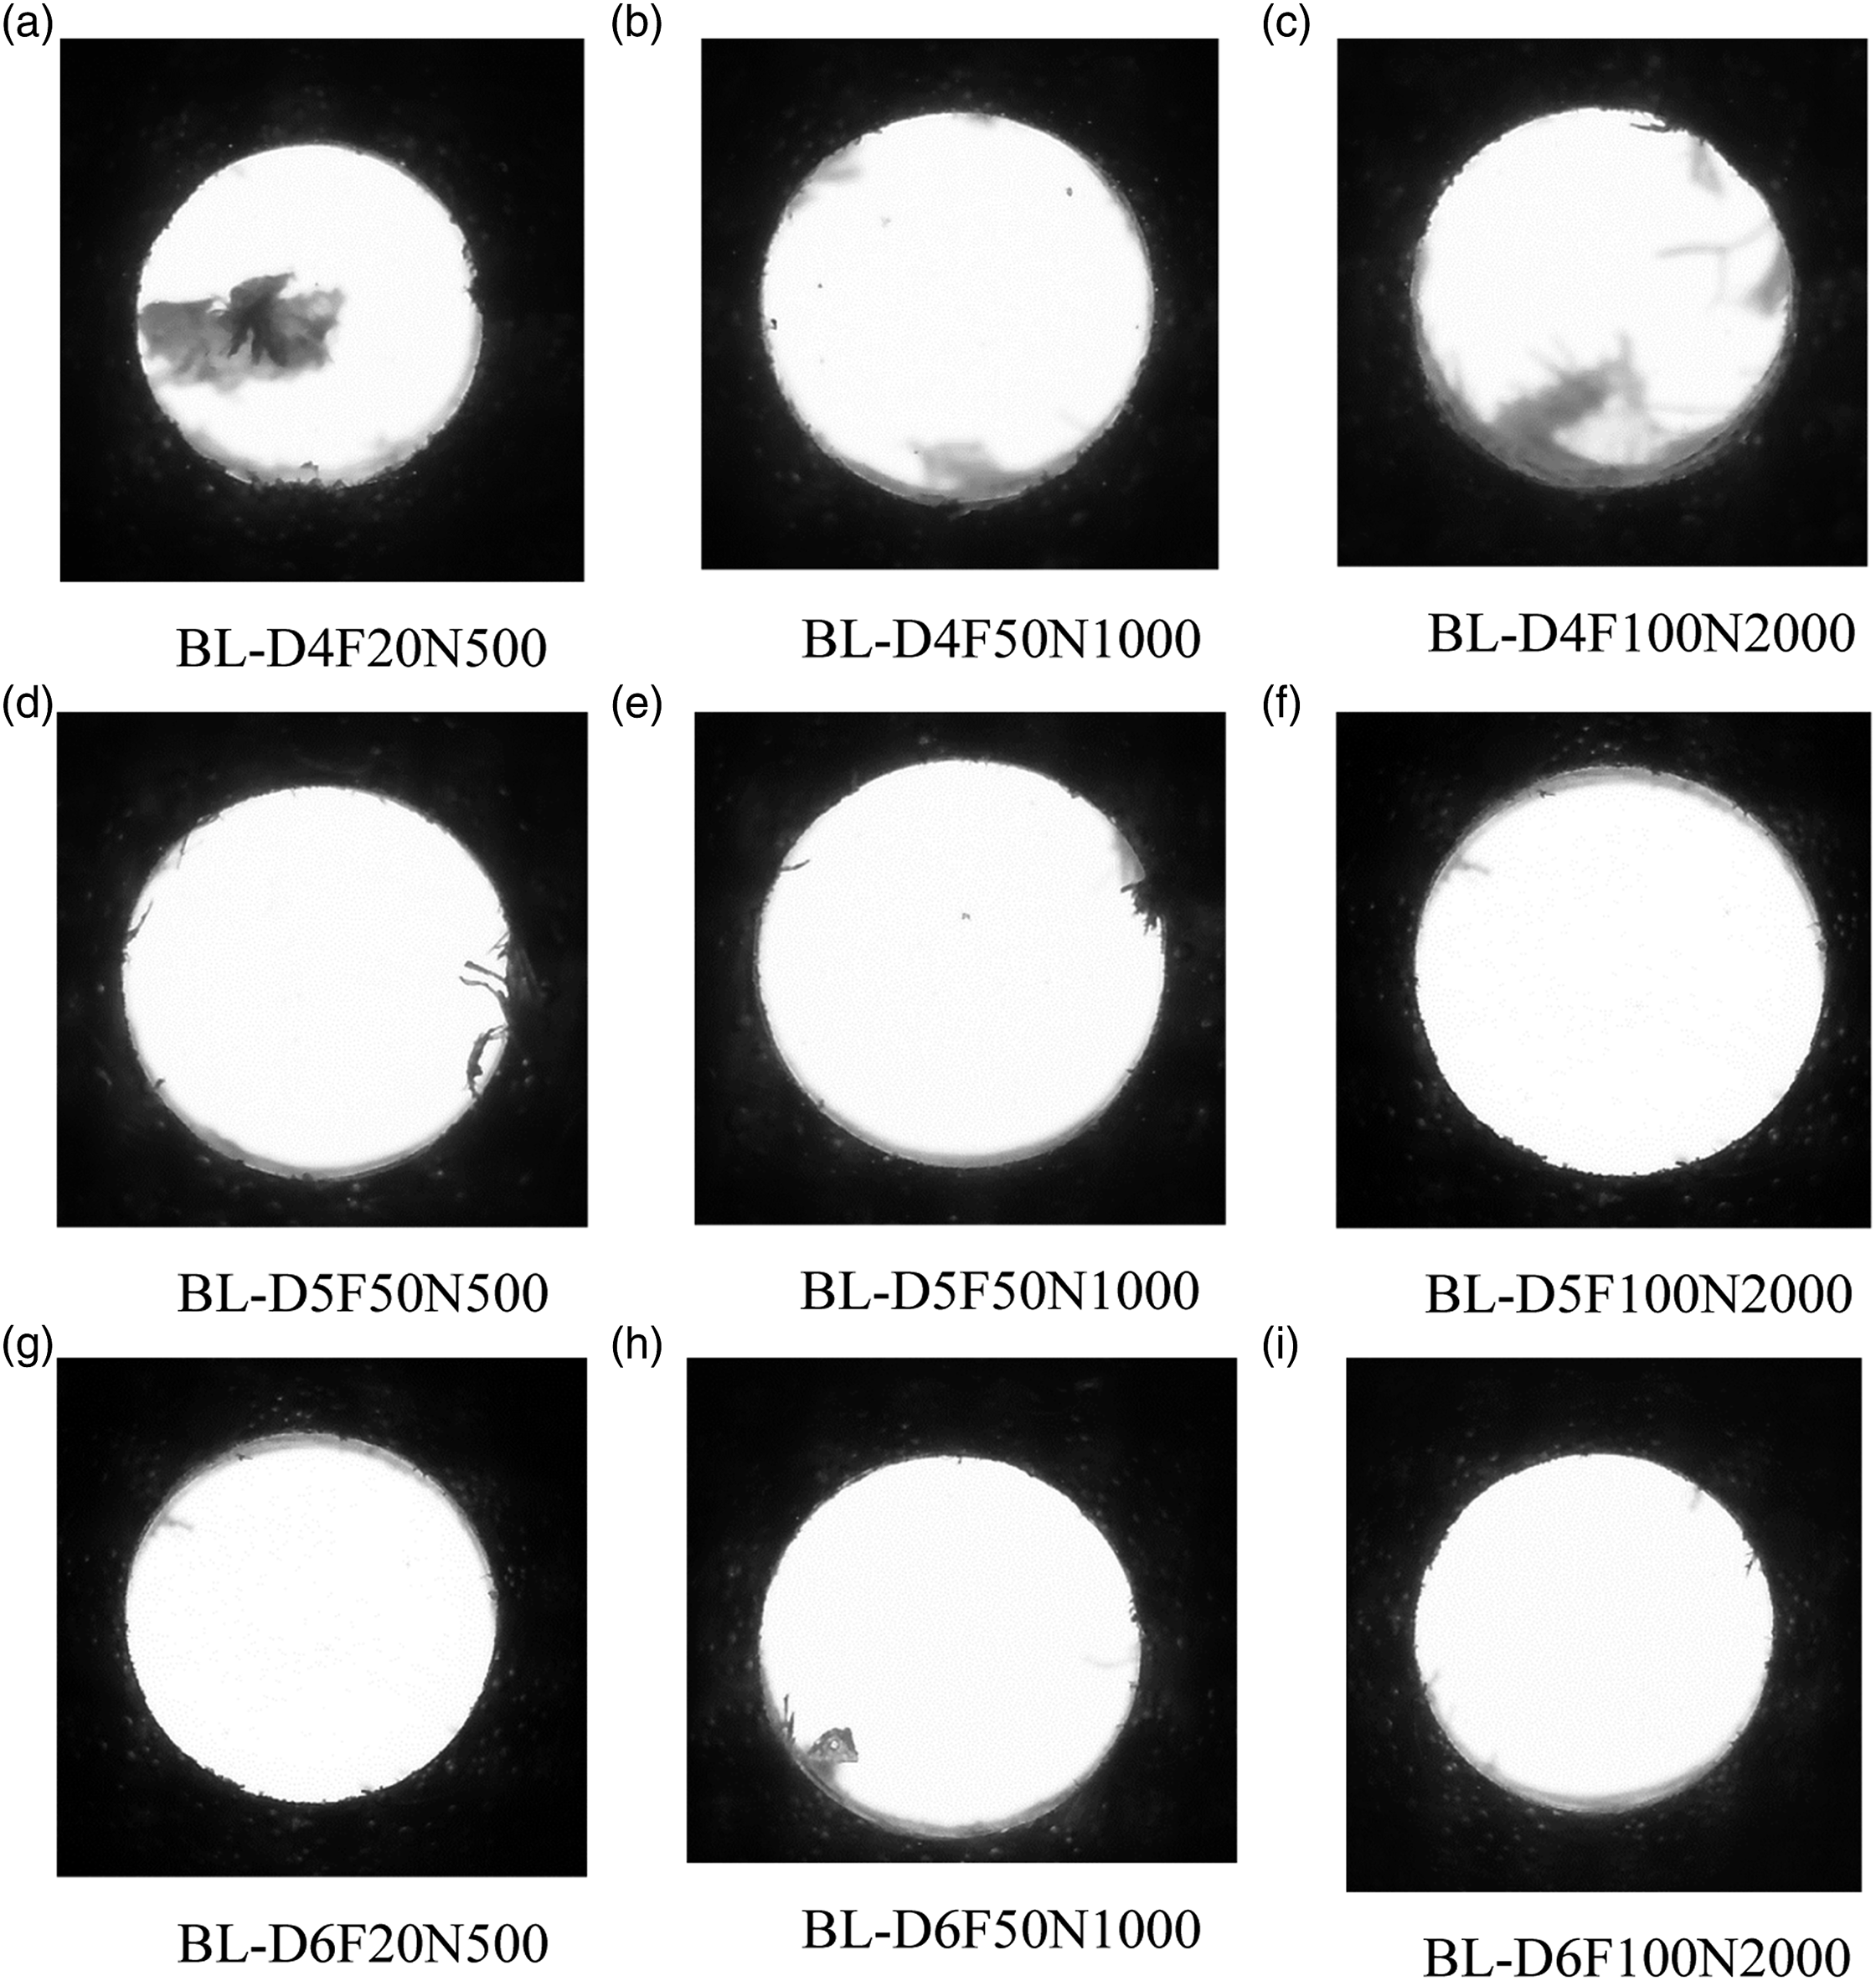
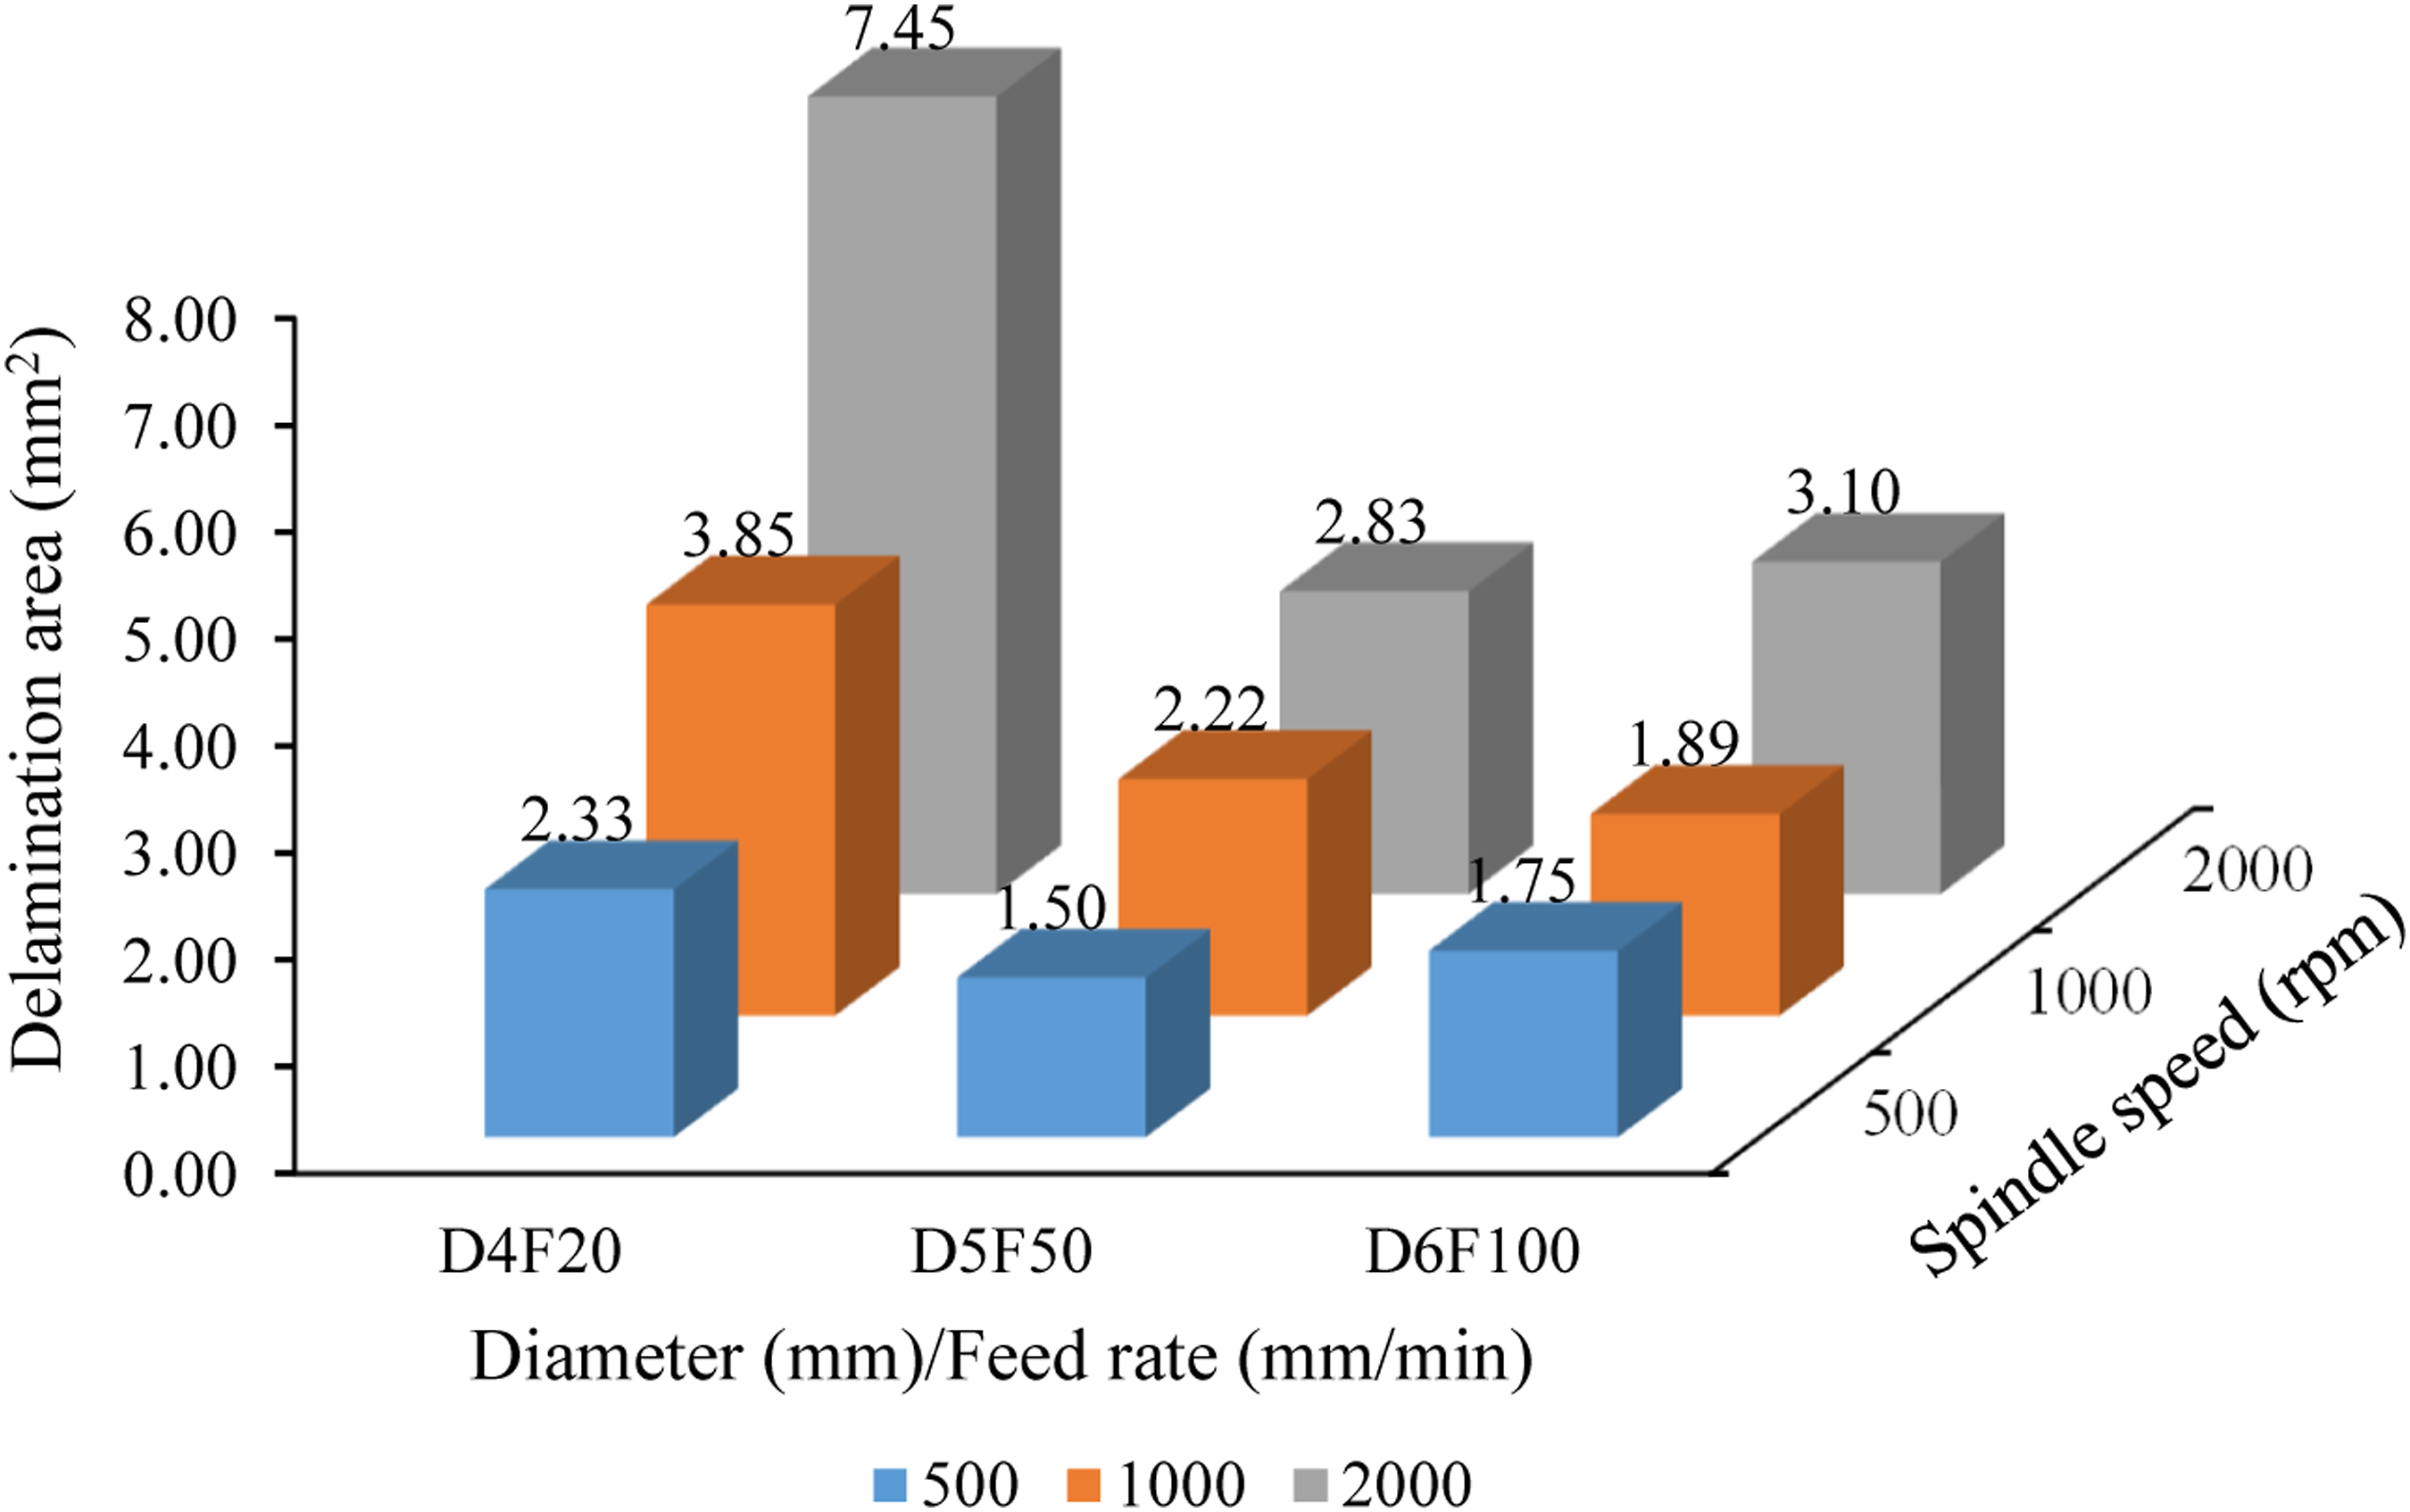
Figure 14 and Figure 15 show the delamination area at hole entry and hole exit, respectively. The delamination area seems smaller (max. delamination = 3.52 mm2) at the hole entry compared to that at the hole exit (max. delamination = 7.45 mm2). This indicates the huge damage is taken by the exit surface due to push-out delamination phenomenon, especially at a higher spindle speed.
45
Delamination area at hole entry. Delamination area at hole exit.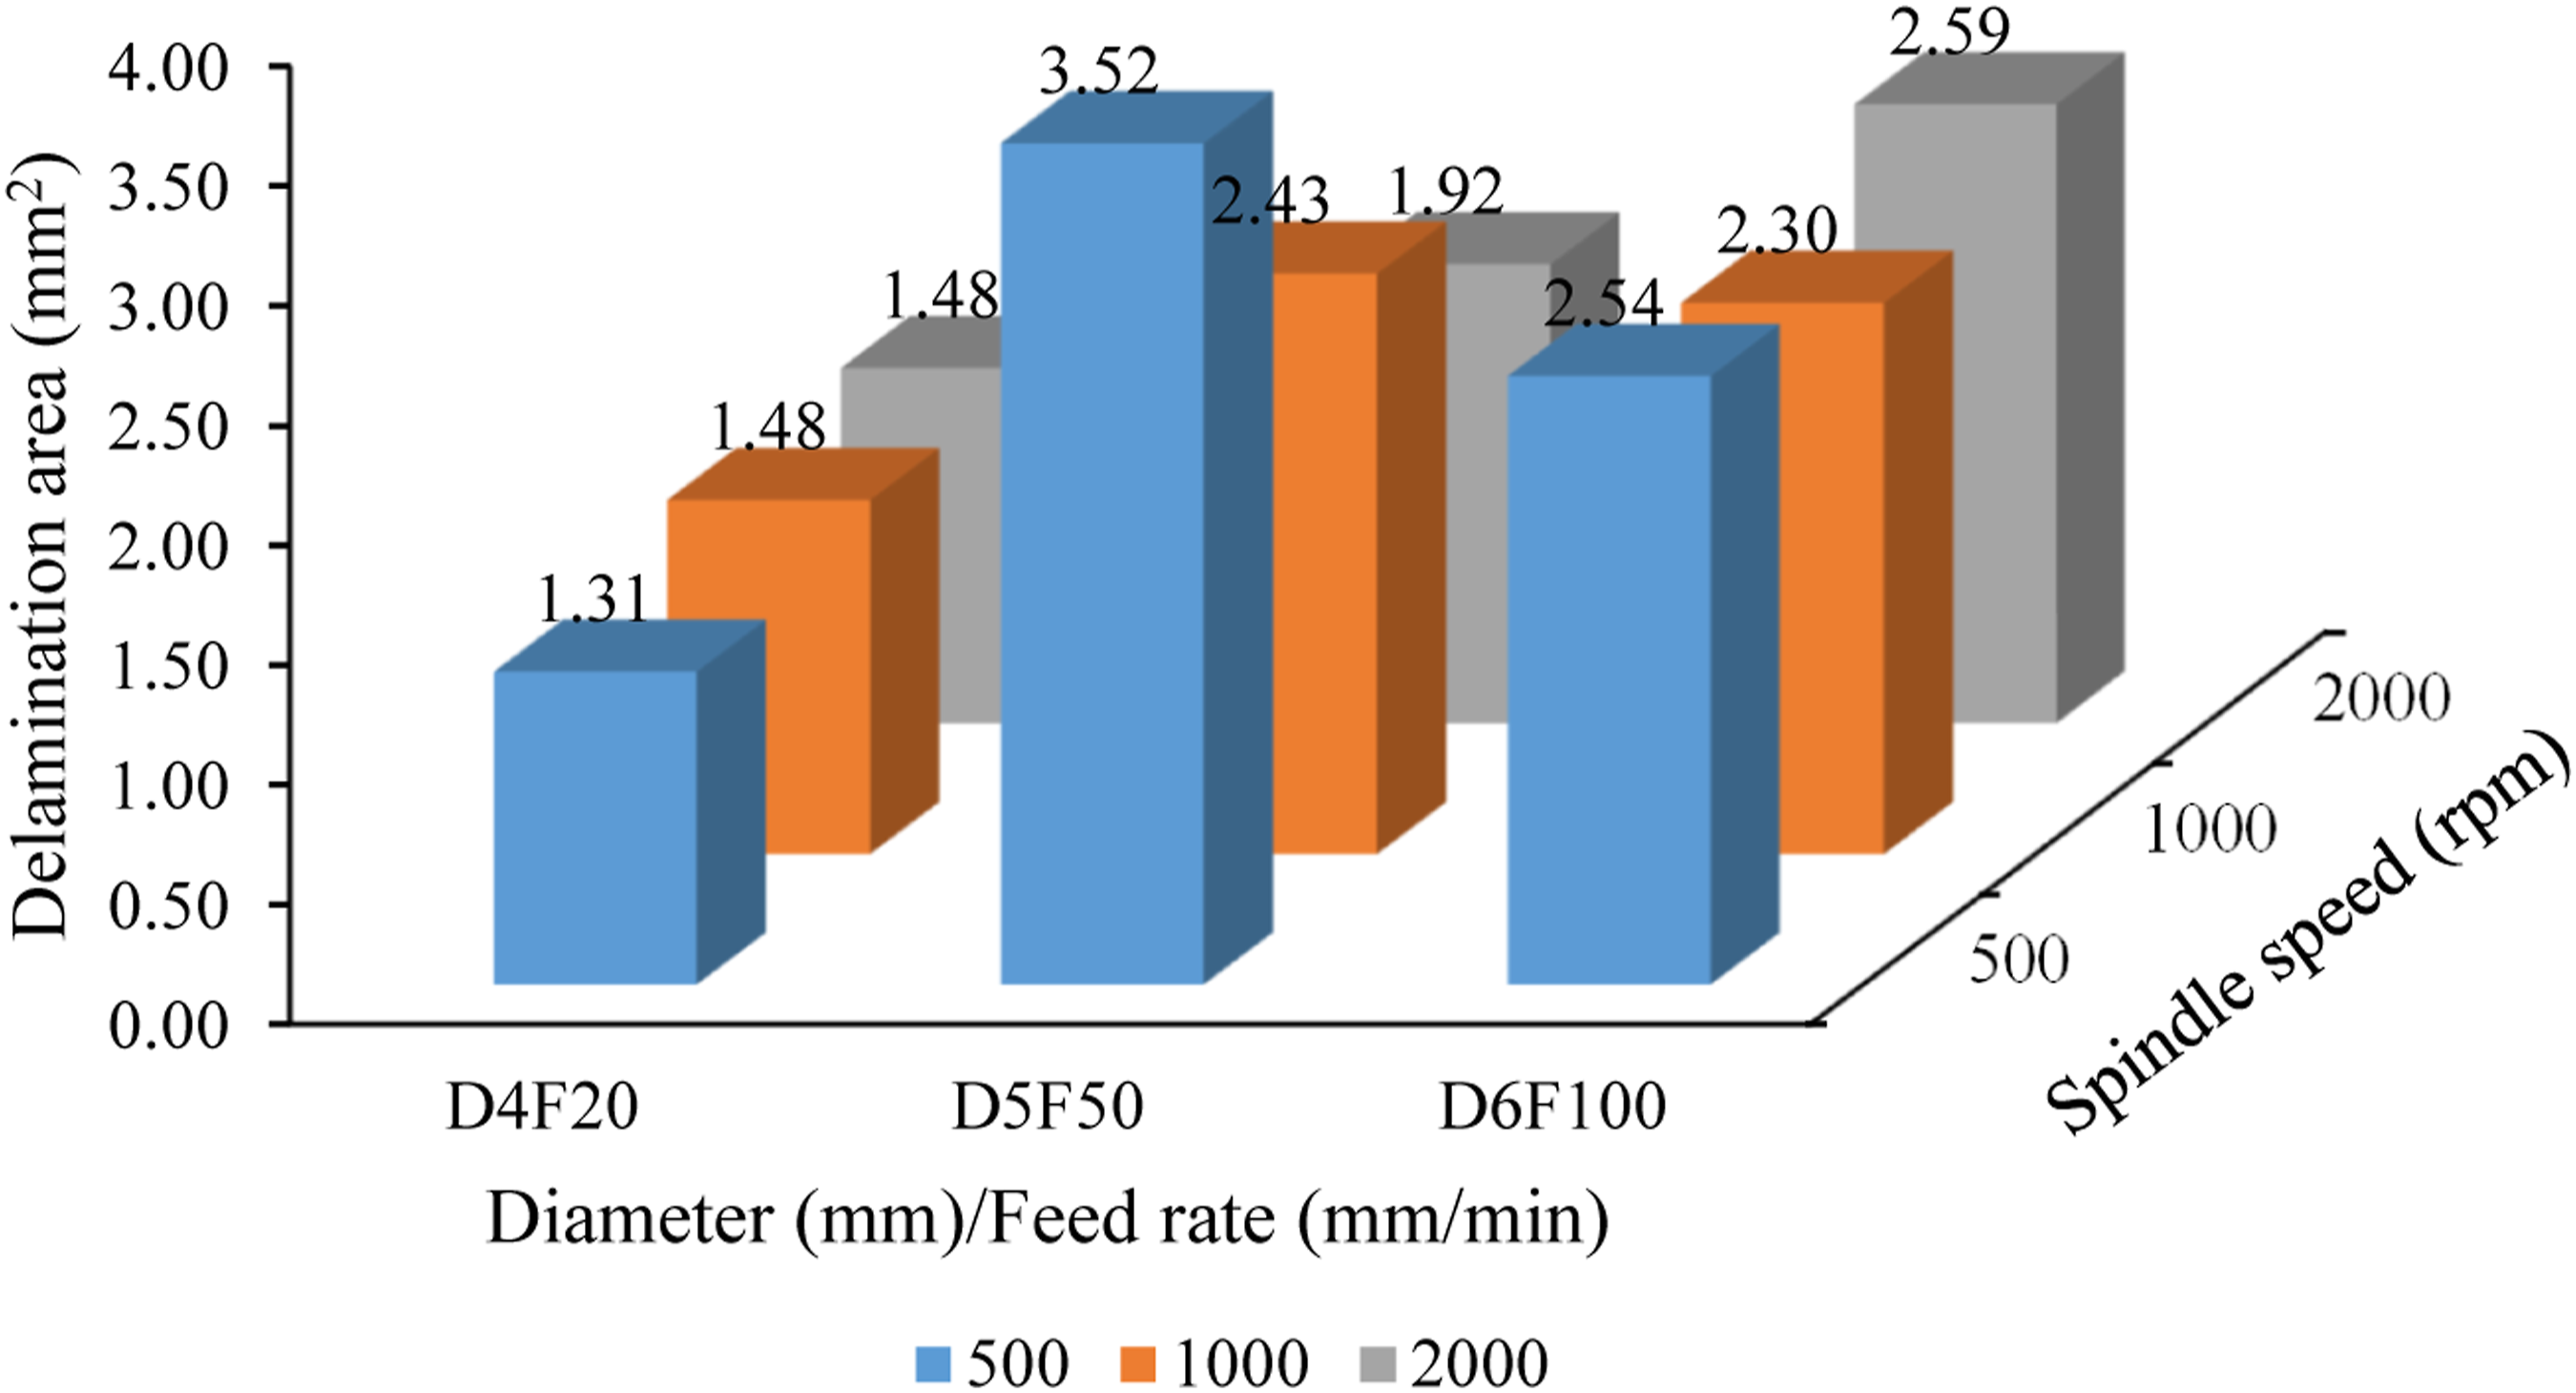
Testing of DTIP method using published data
In order to demonstrated the applicability of the DTIP method further, we used data from the work of Vaziri Sereshk and Bidhendi
21
to compare the delamination factors F
d
and F
a
. The DTIP method was used to re-analyze the images used by the researchers. The image resolution was unimportant since F
d
and F
a
are in form of ratios. Figure 16 shows the result of delamination factors obtained by Vaziri Sereshk and Bidhendi.
21
Figure 17 shows the DTIP GUI which was used to re-analyze the published result from their work. The results from DTIP are depicted in Table 7. Results from Vaziri Sereshk and Bidhendi.
21
Re-analyzed the work of Vaziri Sereshk and Bidhendi
14
by using TIPM to compare the F
d
, F
a
and F
da
. Analysis results on images of Vaziri Sereshk and Bidhendi
21
by using TIPM.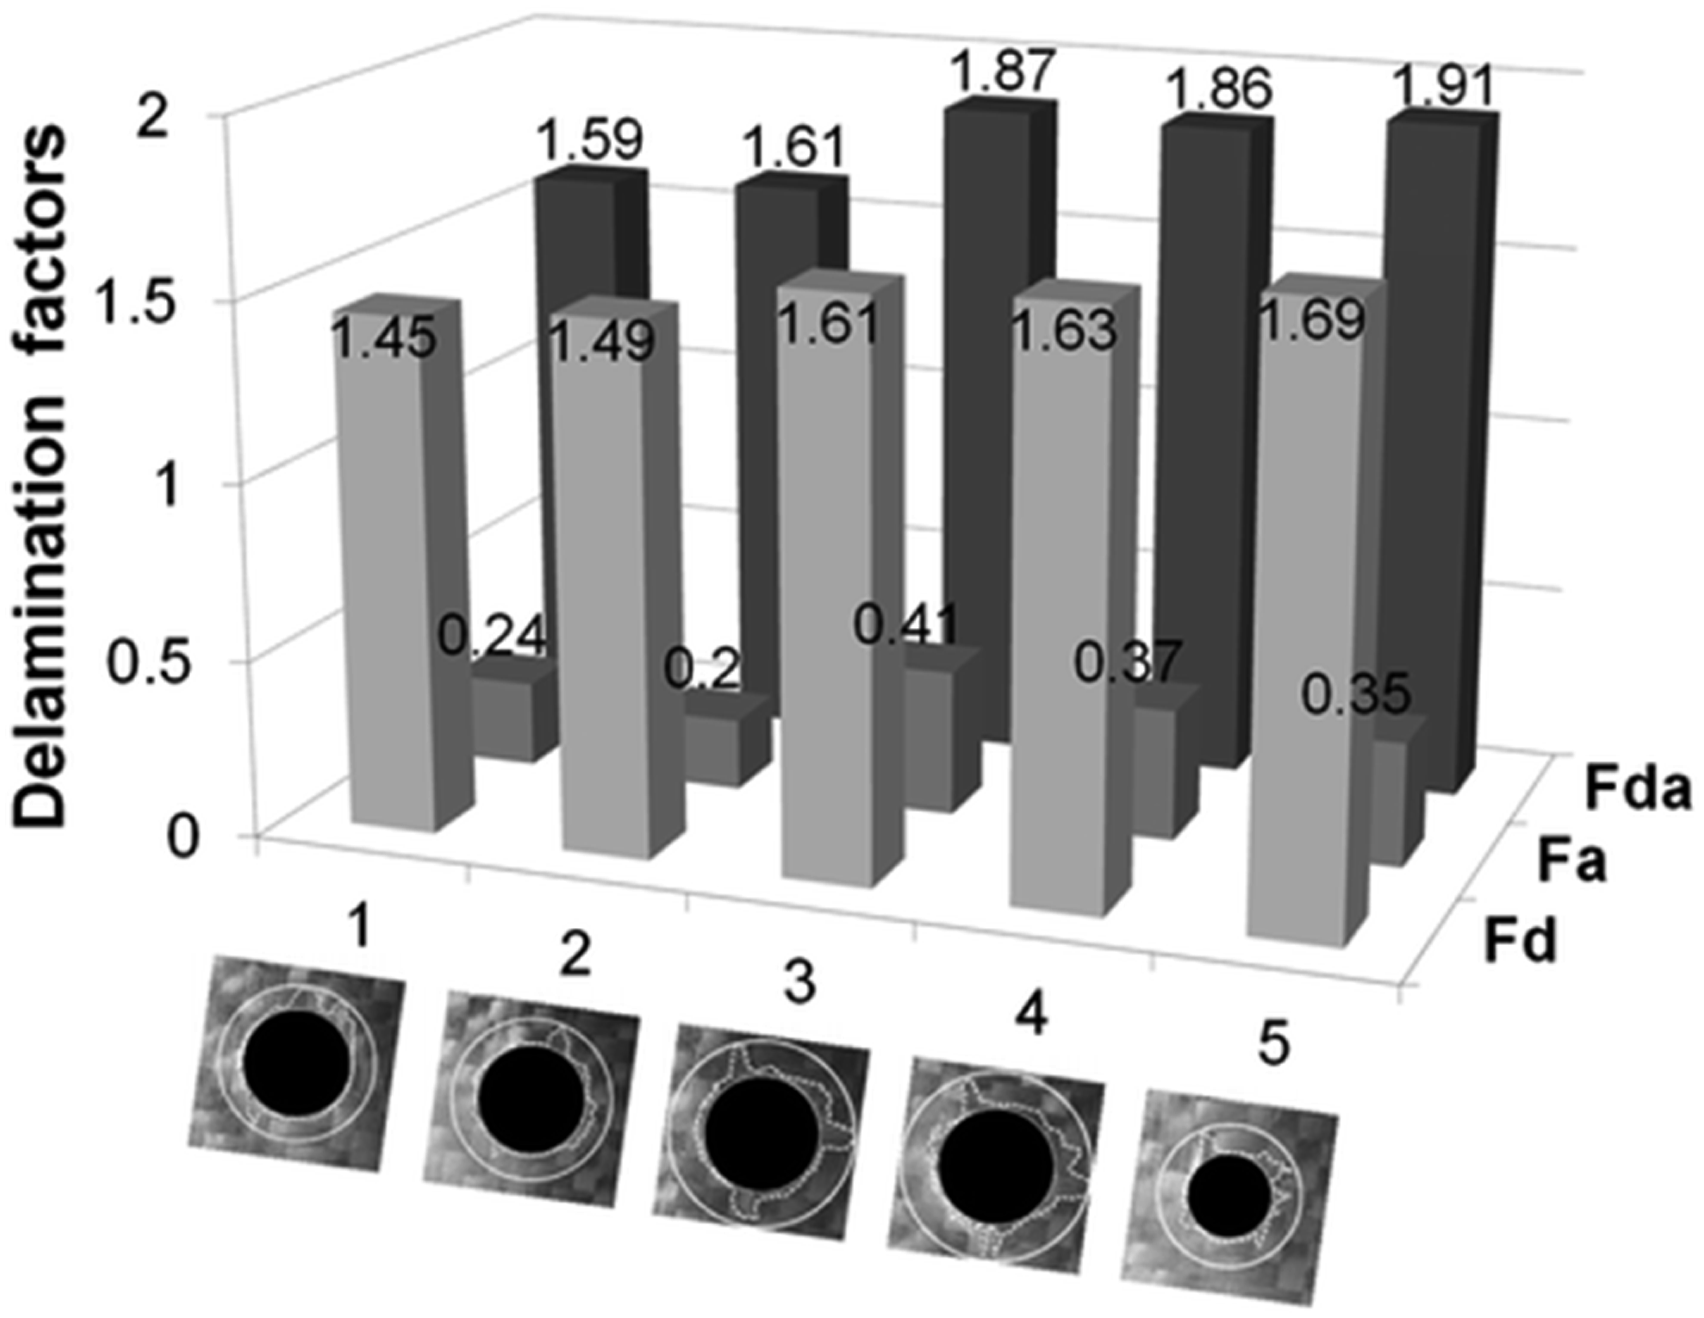
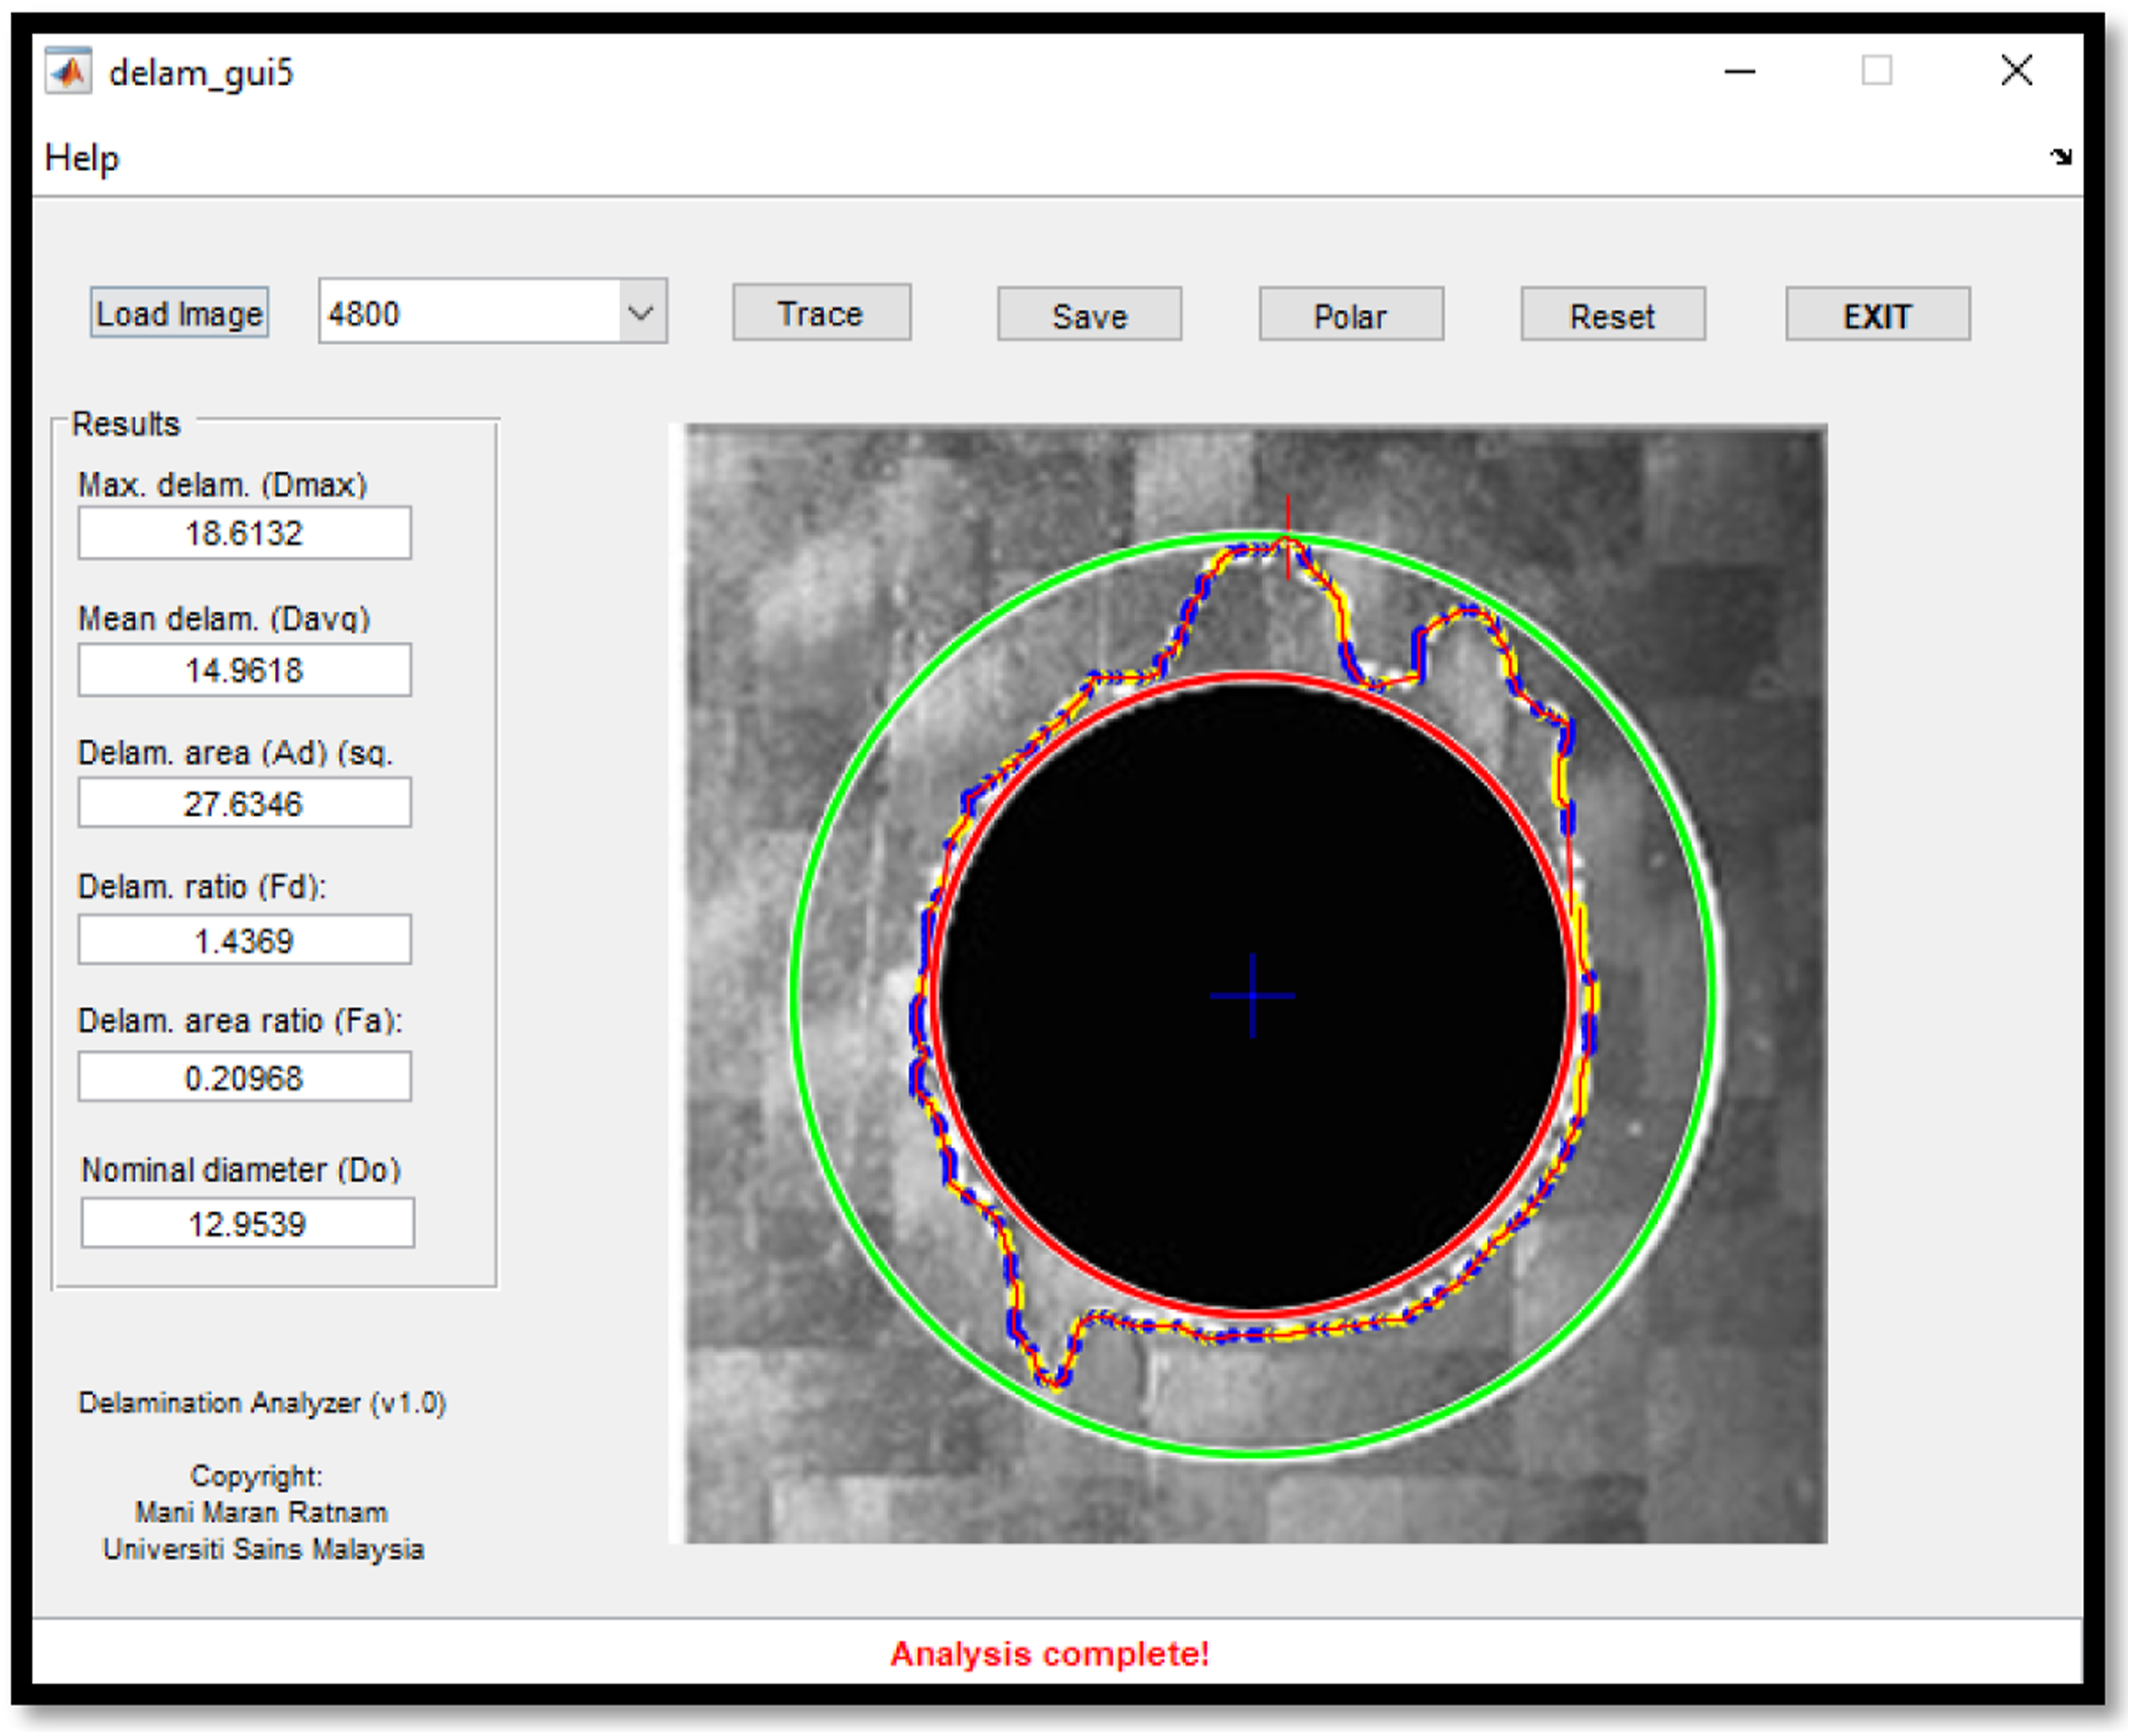
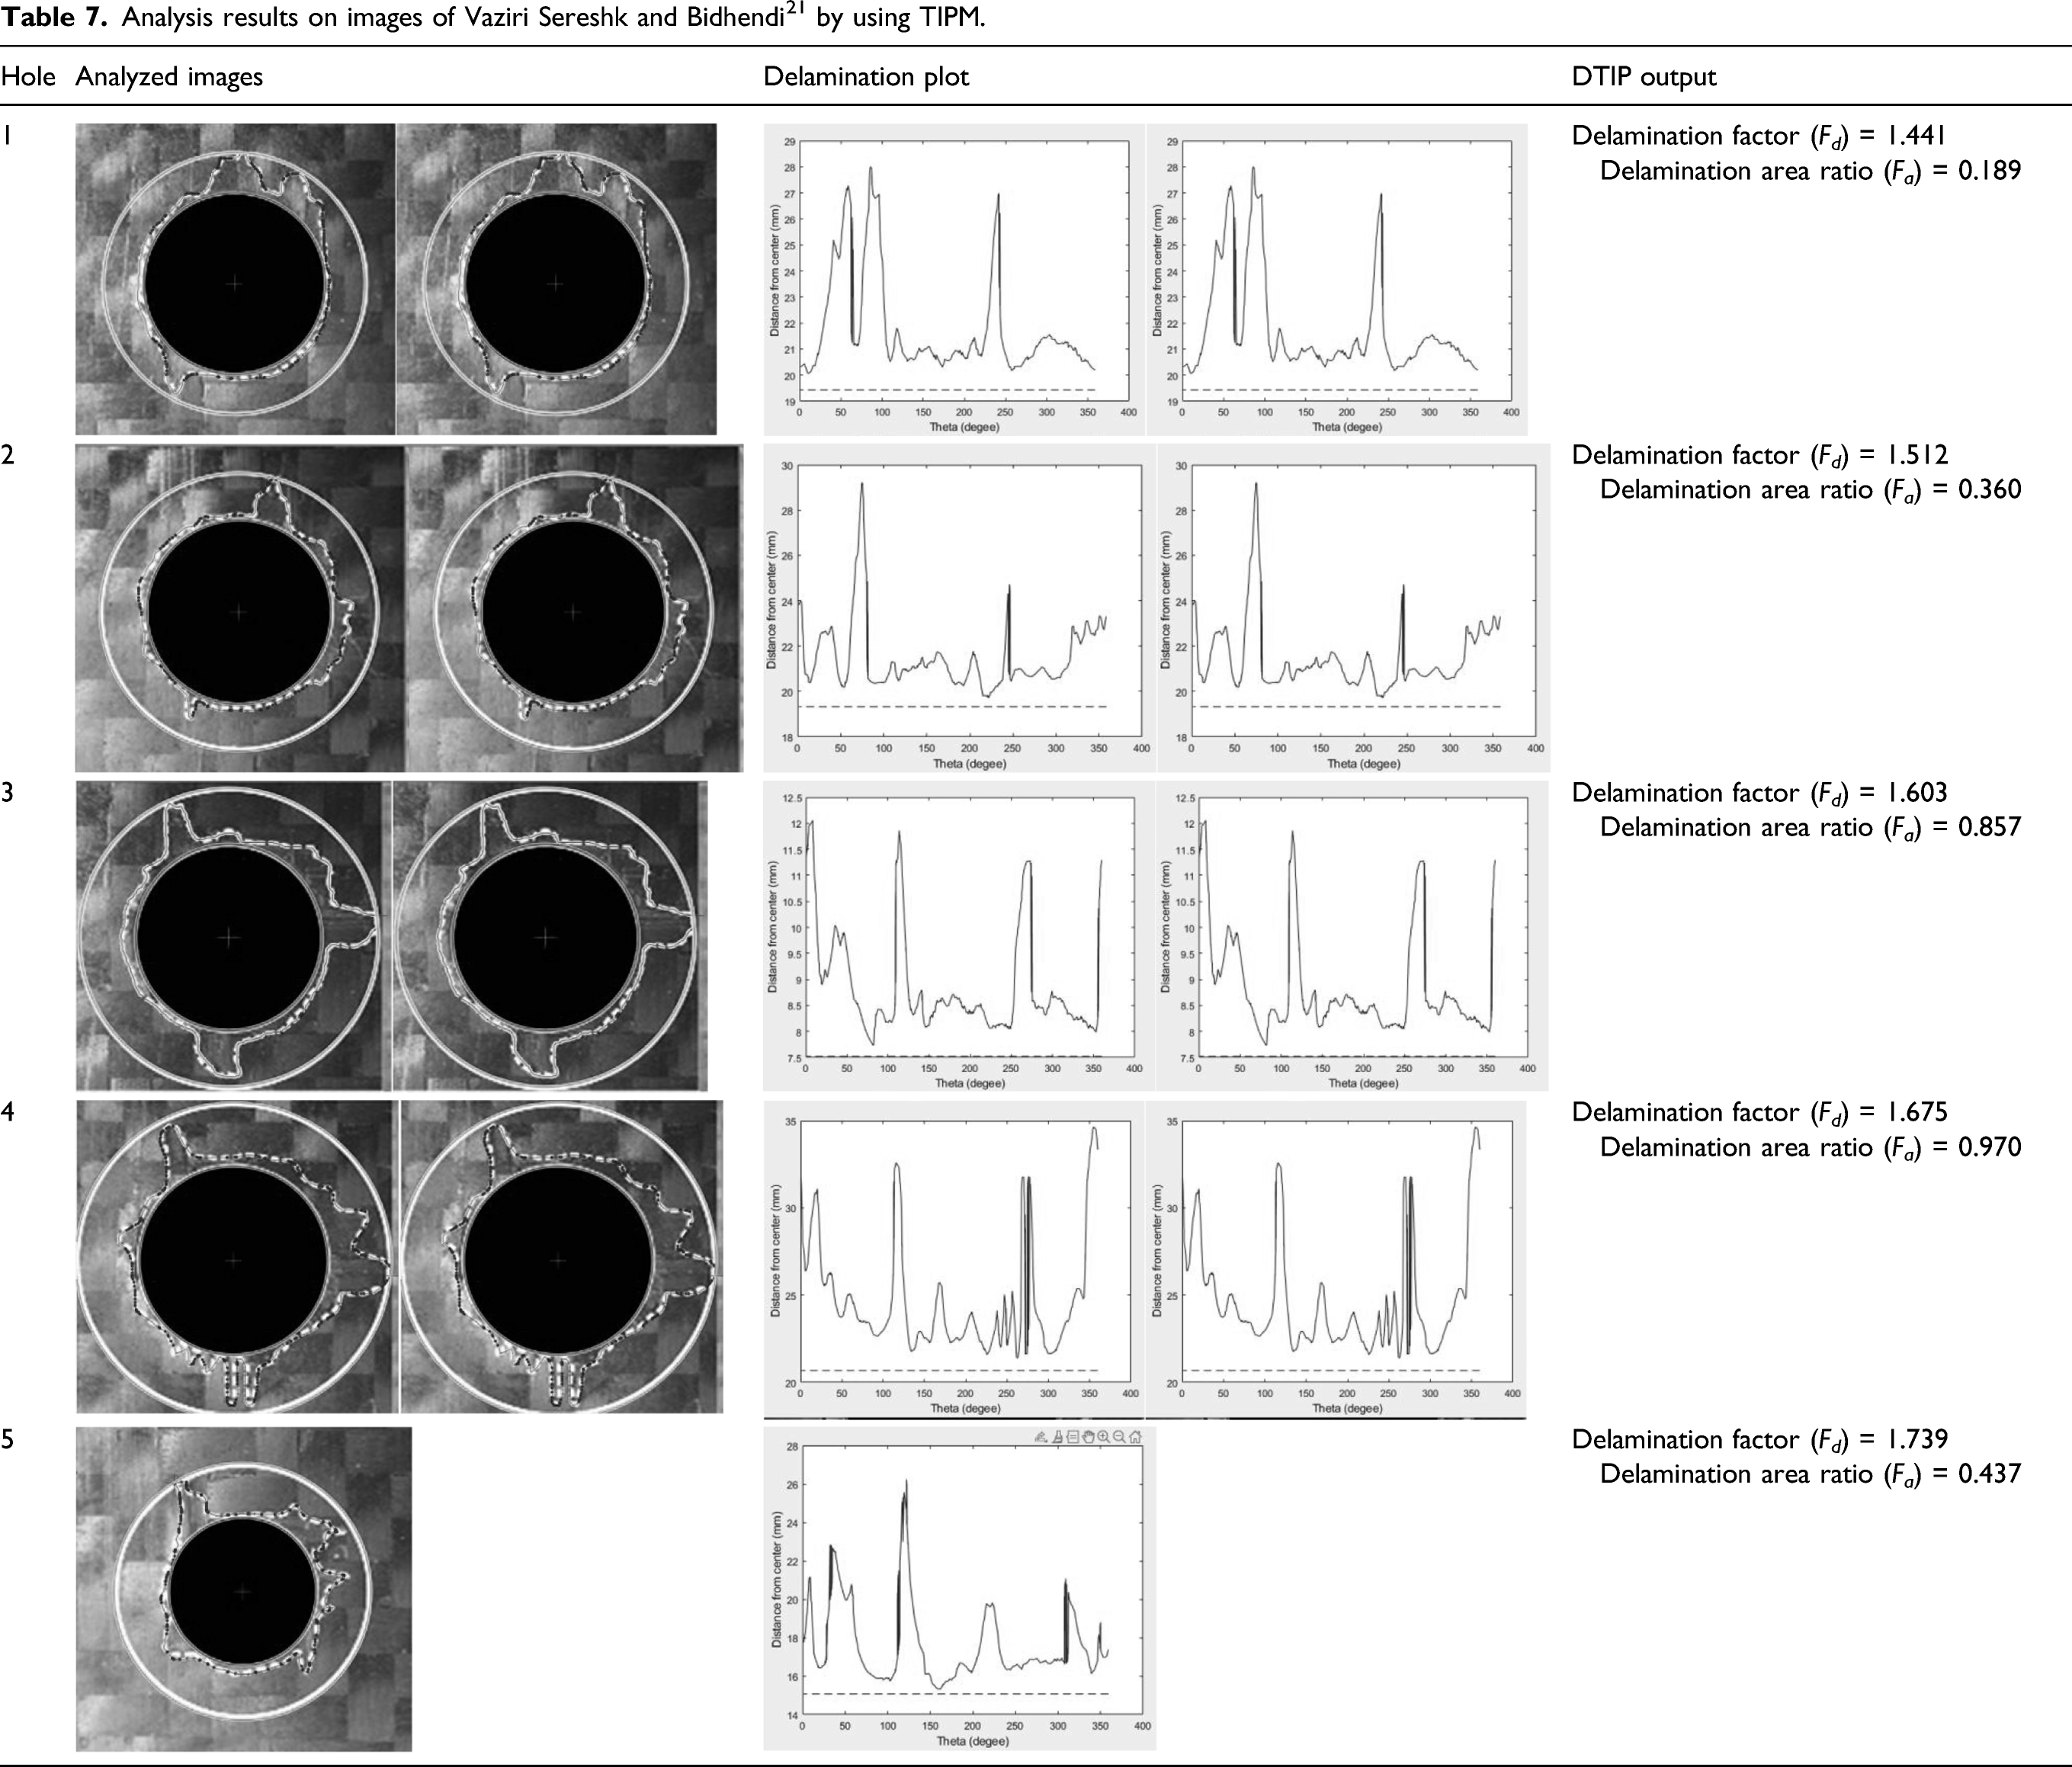
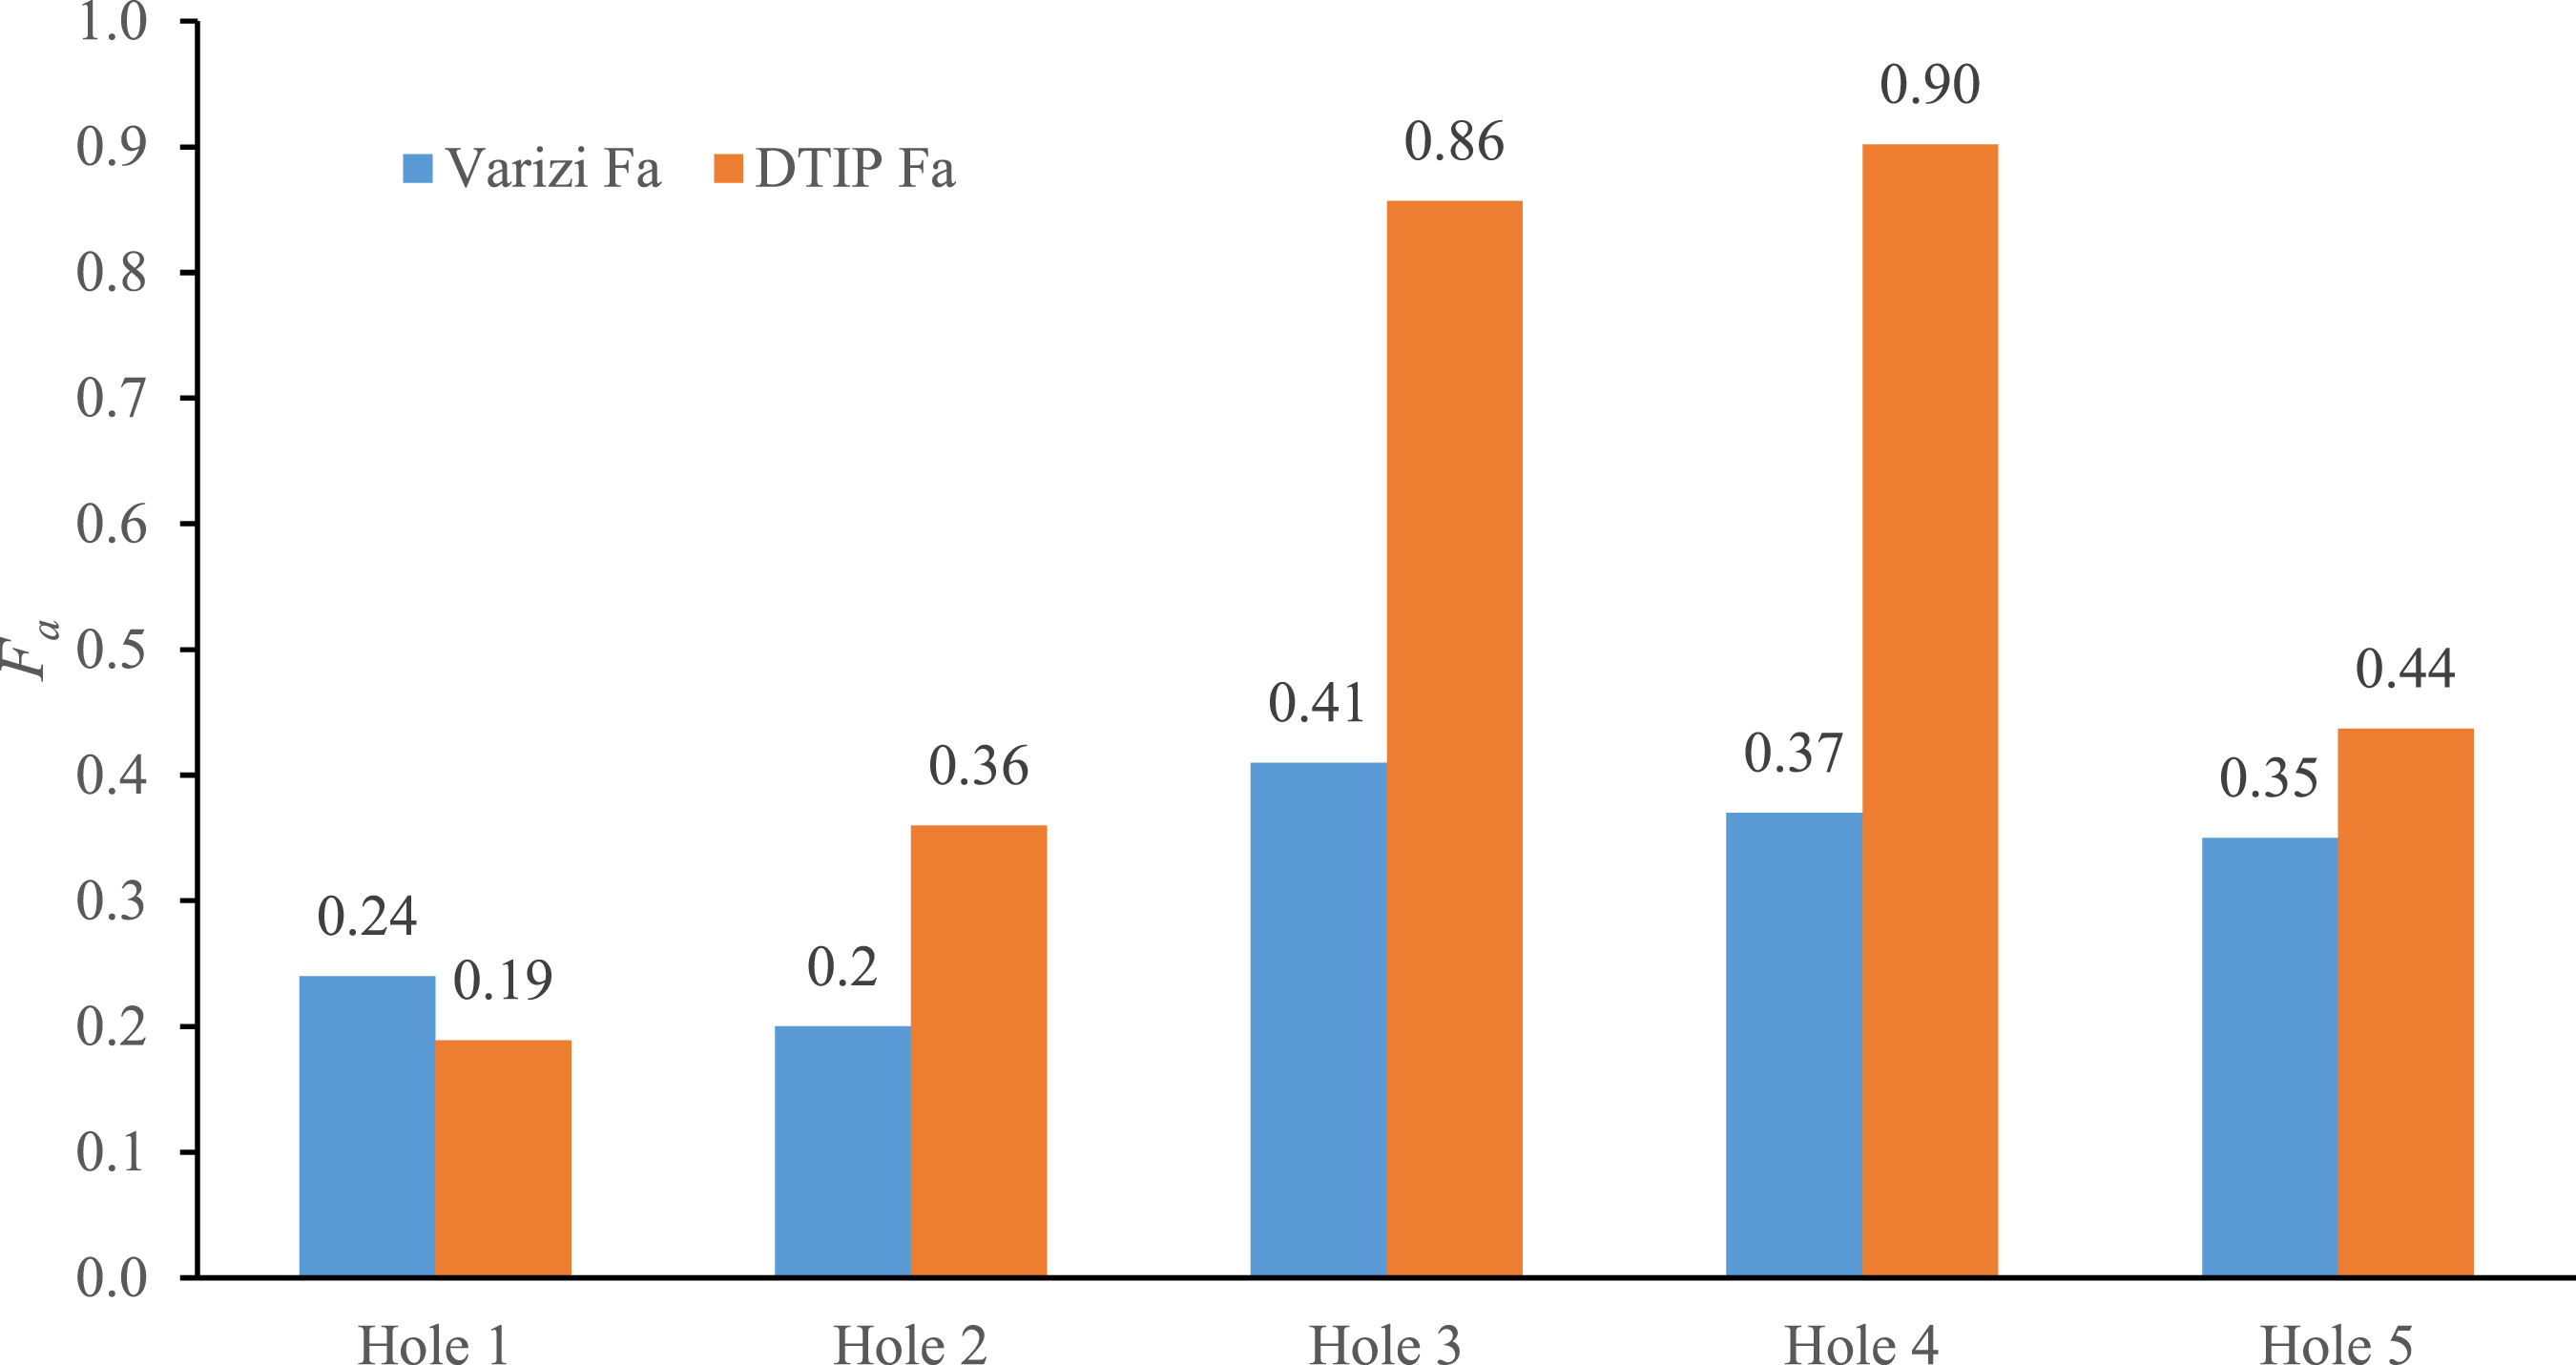
Figure 18 and Figure 19 show the comparison of F
d
and F
a
between the results from Vaziri Sereshk and Bidhendi
21
and DTIP analysis. The F
d
values are almost identical as anticipated, but F
a
values show a huge difference. The large difference in the F
a
value is because the values used by the authors were based on a single point of maximum delamination value in each image, whereas the F
a
values in the DTIP method was obtained from series of tracked points around the delamination zone. Since the actual delamination area is used in the computation of F
a
in the DTIP method, this approach gives a more accurate representation of the delamination undergone by the composite. Comparison of Fd between two methods. Comparison of Fa between two methods.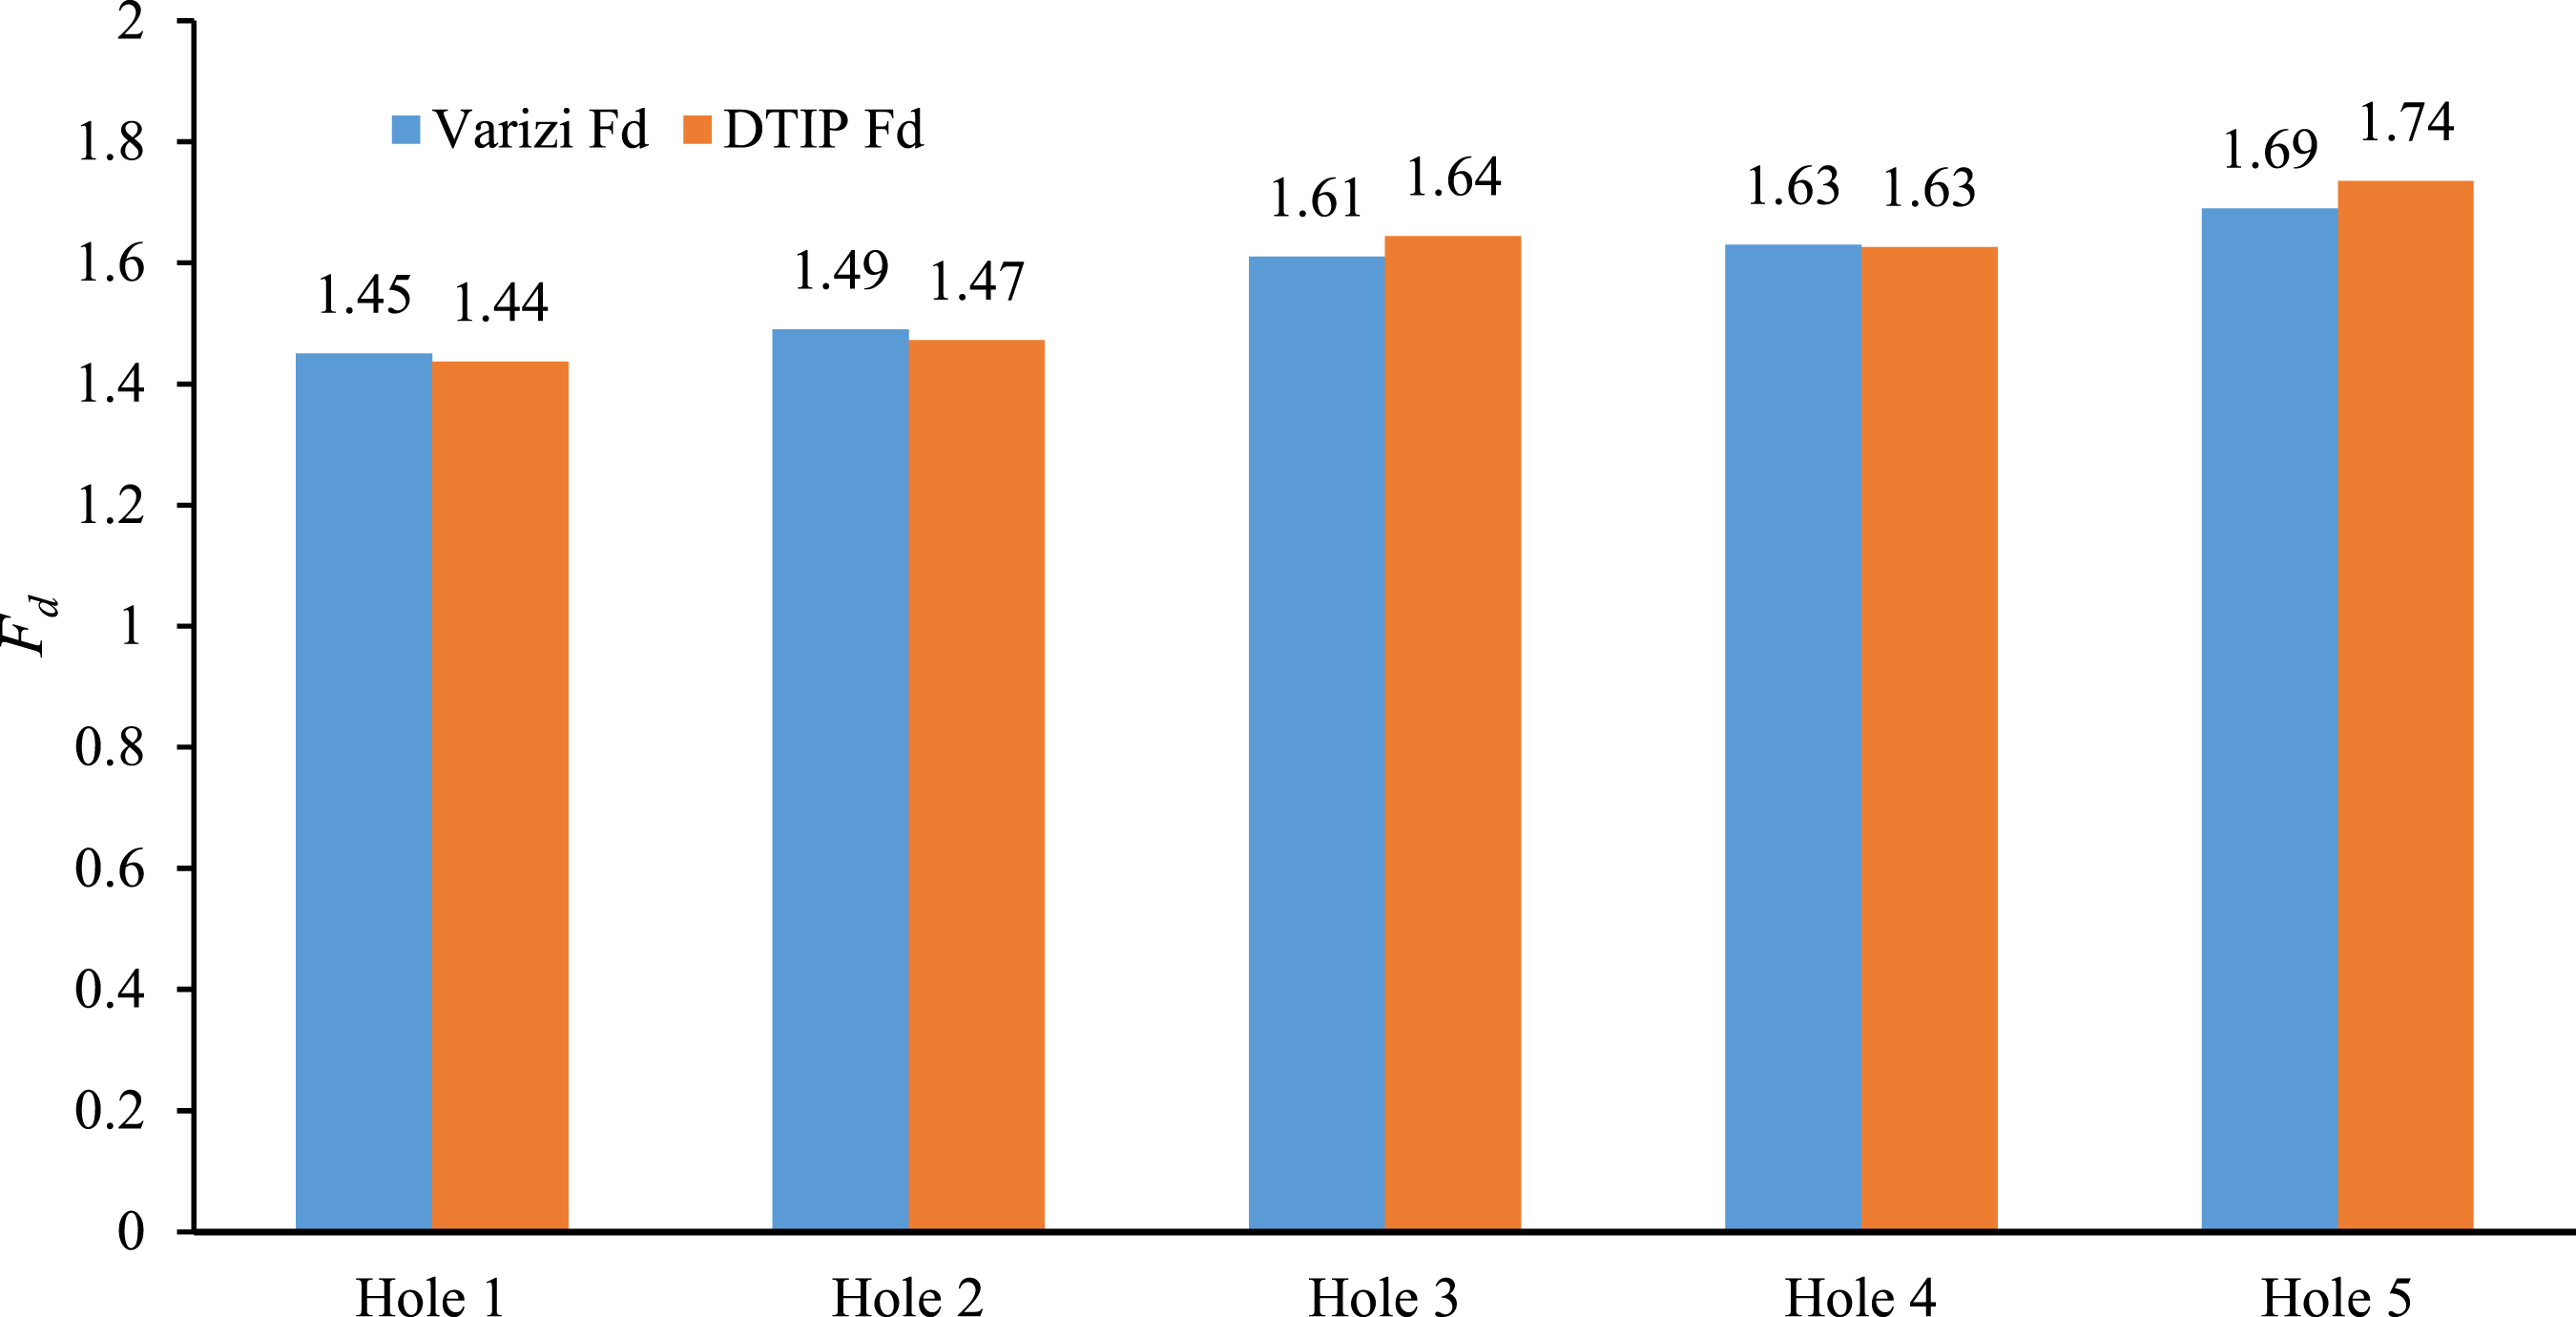
Assessment of fiber pull-out
Although fiber pull-out is an important drilled-hole damage in NFRCs, there are no specific methods available in the literature to analyze and quantify fiber pull-out. The quality of the inner hole should be determined quantitatively to identify the hole integrity. Figure 20 shows the results of the analyzed fiber pull-out area by using fiber pull-out GUI. The results show that the fiber pull-out area directly depends on drilling parameters, such as spindle speed, feed rate, and drill bit diameter. As far as the spindle speed is concerned, the fiber pullout is larger at higher spindle speed, especially at the hole exit due to push-out delamination. As the drill approaches the end of sample thickness, the uncut thickness gets smaller and decreases the resistance to deformation, whereby at some point the thrust force exceeds the inter-laminar bond strength causing an exit delamination zone as the tool pierces through the exit side.
52
This happens before the laminate is completely penetrated by the drill and sometimes leaves some uncut fibers. The finding is also in agreement with the work of Díaz-Álvarez et al. where the damage extension is reported to be greater at the hole exit in all cases for the same testing conditions.15,18 Comparison of fiber pull-out area between hole entry and hole exit for (a) D4F500, (b) D5F1000, and (c) D6F2000 holes.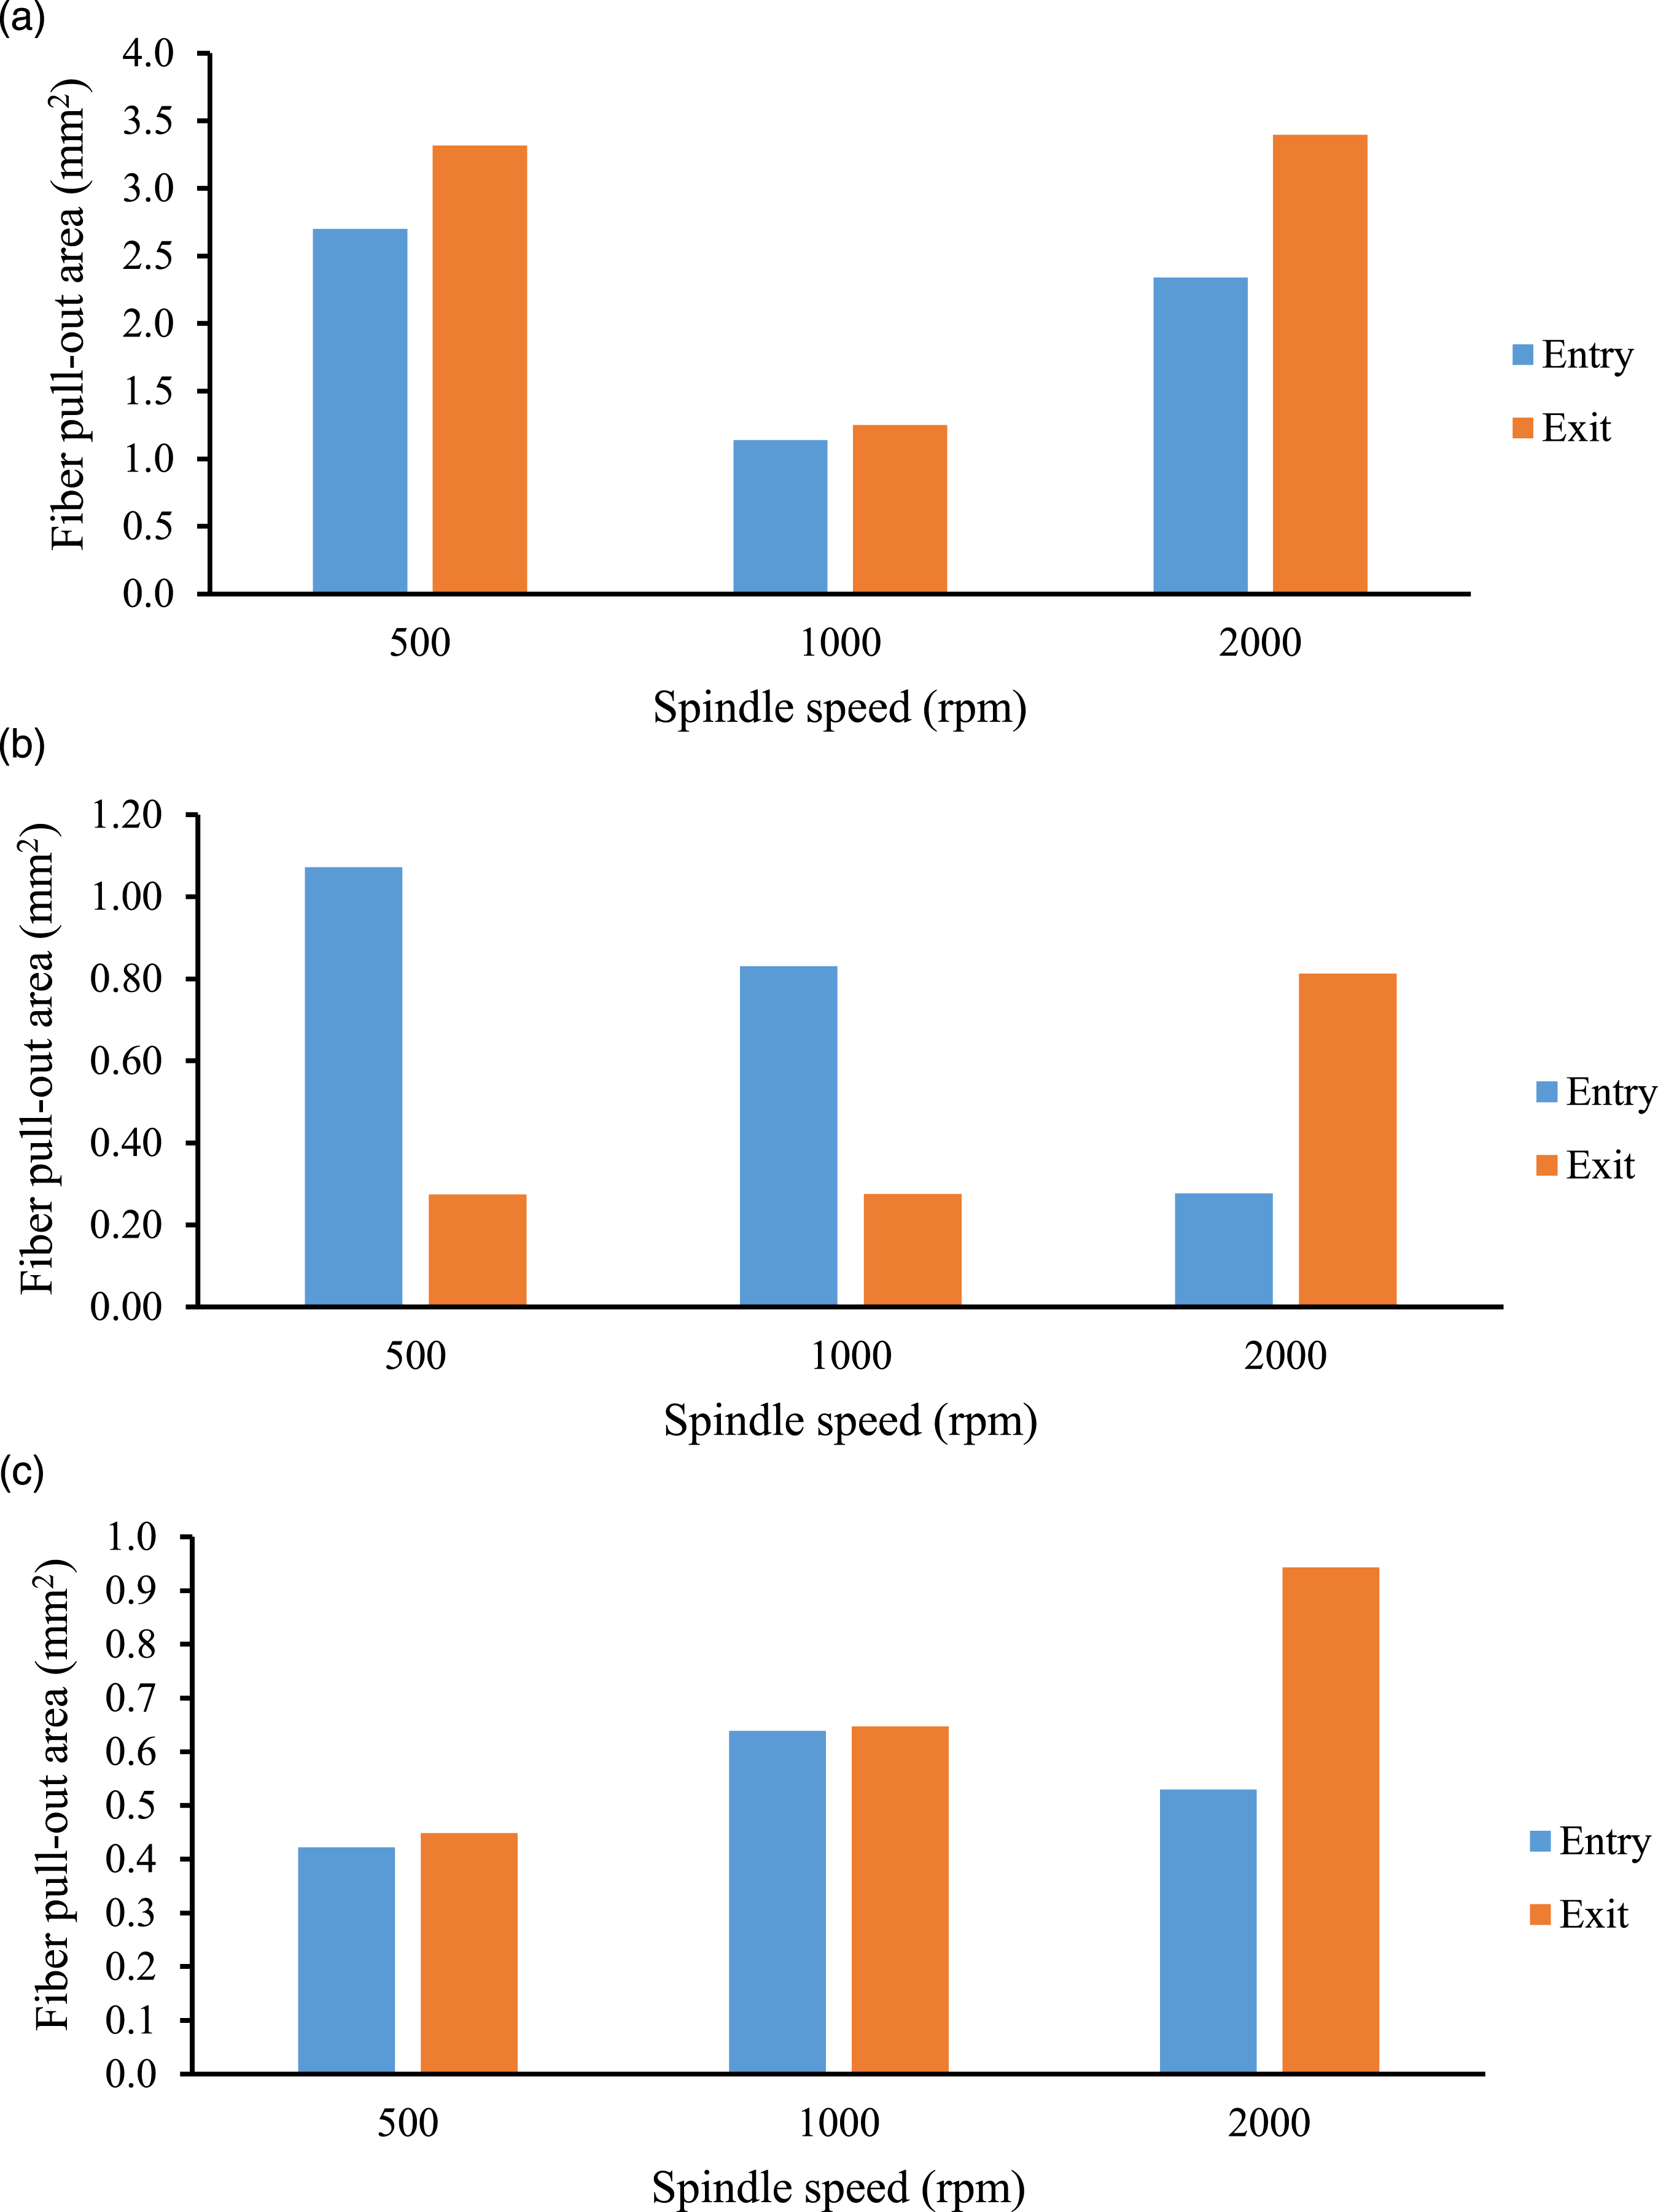
Conclusion
This work has been focused on the development of delamination and fiber pull-out analyses on holes drilled in NFRCs via image processing. The main conclusions and contributions of the proposed method are as follows: • Delamination and fiber pull-out analysis of the drilled hole can be carried out using high-resolution images scanned using a common flatbed scanner and simple image processing steps. • Delamination area around the hole at drill entry and exit can be traced precisely, thus providing a more accurate representation of the delamination compared to the conventional method of using minimum circumscribing circles.
In spite of the promising results obtained in this research, the main shortcoming of the proposed method is that it is limited to the analysis of surface delamination only, and cannot be applied to analyze sub-surface delamination. Therefore, the proposed method could be used to complement the ultrasonic C-scan method in order to obtain a comprehensive analysis of the damage to the composite caused by drilling.
Footnotes
Acknowledgements
The authors wish to acknowledge Universiti Sains Malaysia for the offer of postdoctoral fellowship, which has made this work possible.
Declaration of conflicting interests
The author(s) declared no potential conflicts of interest with respect to the research, authorship, and/or publication of this article.
Funding
The author(s) received no financial support for the research, authorship, and/or publication of this article.