
Abstract
For automated fiber placement onto molds with complex surfaces, uneven compaction pressure distribution limits tows number in a single sequence and affects layup quality. Compaction roller has a direct influence on the pressure distribution, but the relationship between the two has not been widely explored. In this paper, the segmented compaction roller is used, and a theoretical model of compaction pressure distribution for layup onto general surfaces is established by analyzing the contact between the roller and prepreg layers, followed by experimental validation. Based on the model, single-point pressure uniformity and whole-path pressure uniformity are proposed to quantitatively evaluate the pressure distribution. Furthermore, pressure distribution and pressure uniformity of segmented roller and common roller are compared, as well as the influence of the two pressure distribution on layup quality. The results show that the established model can predict pressure distribution and provide a basis for analyzing layup defects, and segmented rollers apply evener compaction pressure and help to improve layup quality.
Keywords
Introduction
In the past few decades, advanced composite materials have been increasingly used in aerospace industry and many other fields due to their higher specific strength, better corrosion resistance and improved mechanical properties over mental materials.1,2 Automated tape laying (ATL) and automated fiber placement (AFP) are important technologies to manufacture composite structures, and the latter is especially suitable for manufacturing structures with complex curved surfaces. 3 In AFP, each tow is driven individually and laid onto the mold surface or previous layers under a controlled tension using a numerical controlled robotic system. The tensioned tows coming from spools are fed through the AFP head to the compaction roller, which provides a required compaction force to make tows adhere to the mold or previous layers.4,5
Compaction force is one of the most important process parameters for AFP, and many studies have shown that appropriate compaction force helps to improve prepreg tack levels and layup quality.6–11 However, little attention has been paid to the compaction pressure (the force per unit area on prepreg layers, unit: Pa), which is more essential than compaction force (unit: N). At present, most of the researches on AFP process were carried out on flat mold, in which case the compaction pressure distribution is relatively even. However, for layup onto complex surfaces, which is where AFP is particularly suitable, the uneven deformation of the compaction rollers leads to uneven pressure distribution12–14 and further leads to uneven tack levels and layup defects.14–18 Therefore it is not enough to study the compaction force alone, but also the compaction pressure and carry out quantitative evaluation of it.
The compaction pressure is mainly influenced by three factors: the mold surface, the compaction force, and the roller structural parameters. Among them, the mold surface has already been determined before AFP and cannot be adjusted. Most studies improve the layup quality by changing the compaction force, while the effect of roller structure has not received enough attention. Bakhshi and Hojjati 6 studied the pressure distribution of five different compaction rollers in the case of placement on flat mold, and they concluded that pressure distribution plays a crucial role in achieving good layup quality. Chu et al. 19 modeled compaction pressure distribution by finite element method and analyzed the effect of roller deformation on layup quality. Cheng et al. 16 analyzed the effect of the roller attitude on the fiber pull-up by means of differential geometry. Jiang et al.12,14 modeled the pressure distribution under the common compaction rollers in AFP and optimized the roller structure. They concluded that the pressure distribution can be improved by reducing the hardness and width and increasing the outer radius of the rollers.
However, common rollers have difficulty in achieving ideal pressure distribution for layup onto complex surfaces due to their structural limitation. In recent years, a type of roller with ingenious structural form—segmented compaction roller—has been gradually applied. As shown in Figure 1, segmented roller consists of several narrow segments, each segment able to move up or down and retreat individually to conform the surface of mold.20,21 Besides, each segment is covered with a flexible rubber cover and individually subjected to an air pressure load. Denkena et al.
22
used segmented compaction roller in their research and pointed out its structural characteristics, but did not analyze it in detail. The existing studies still lack quantitative analysis of the pressure distribution under segmented roller and the adaptability of segmented roller to mold. (a) Common compaction roller (b) segmented compaction roller.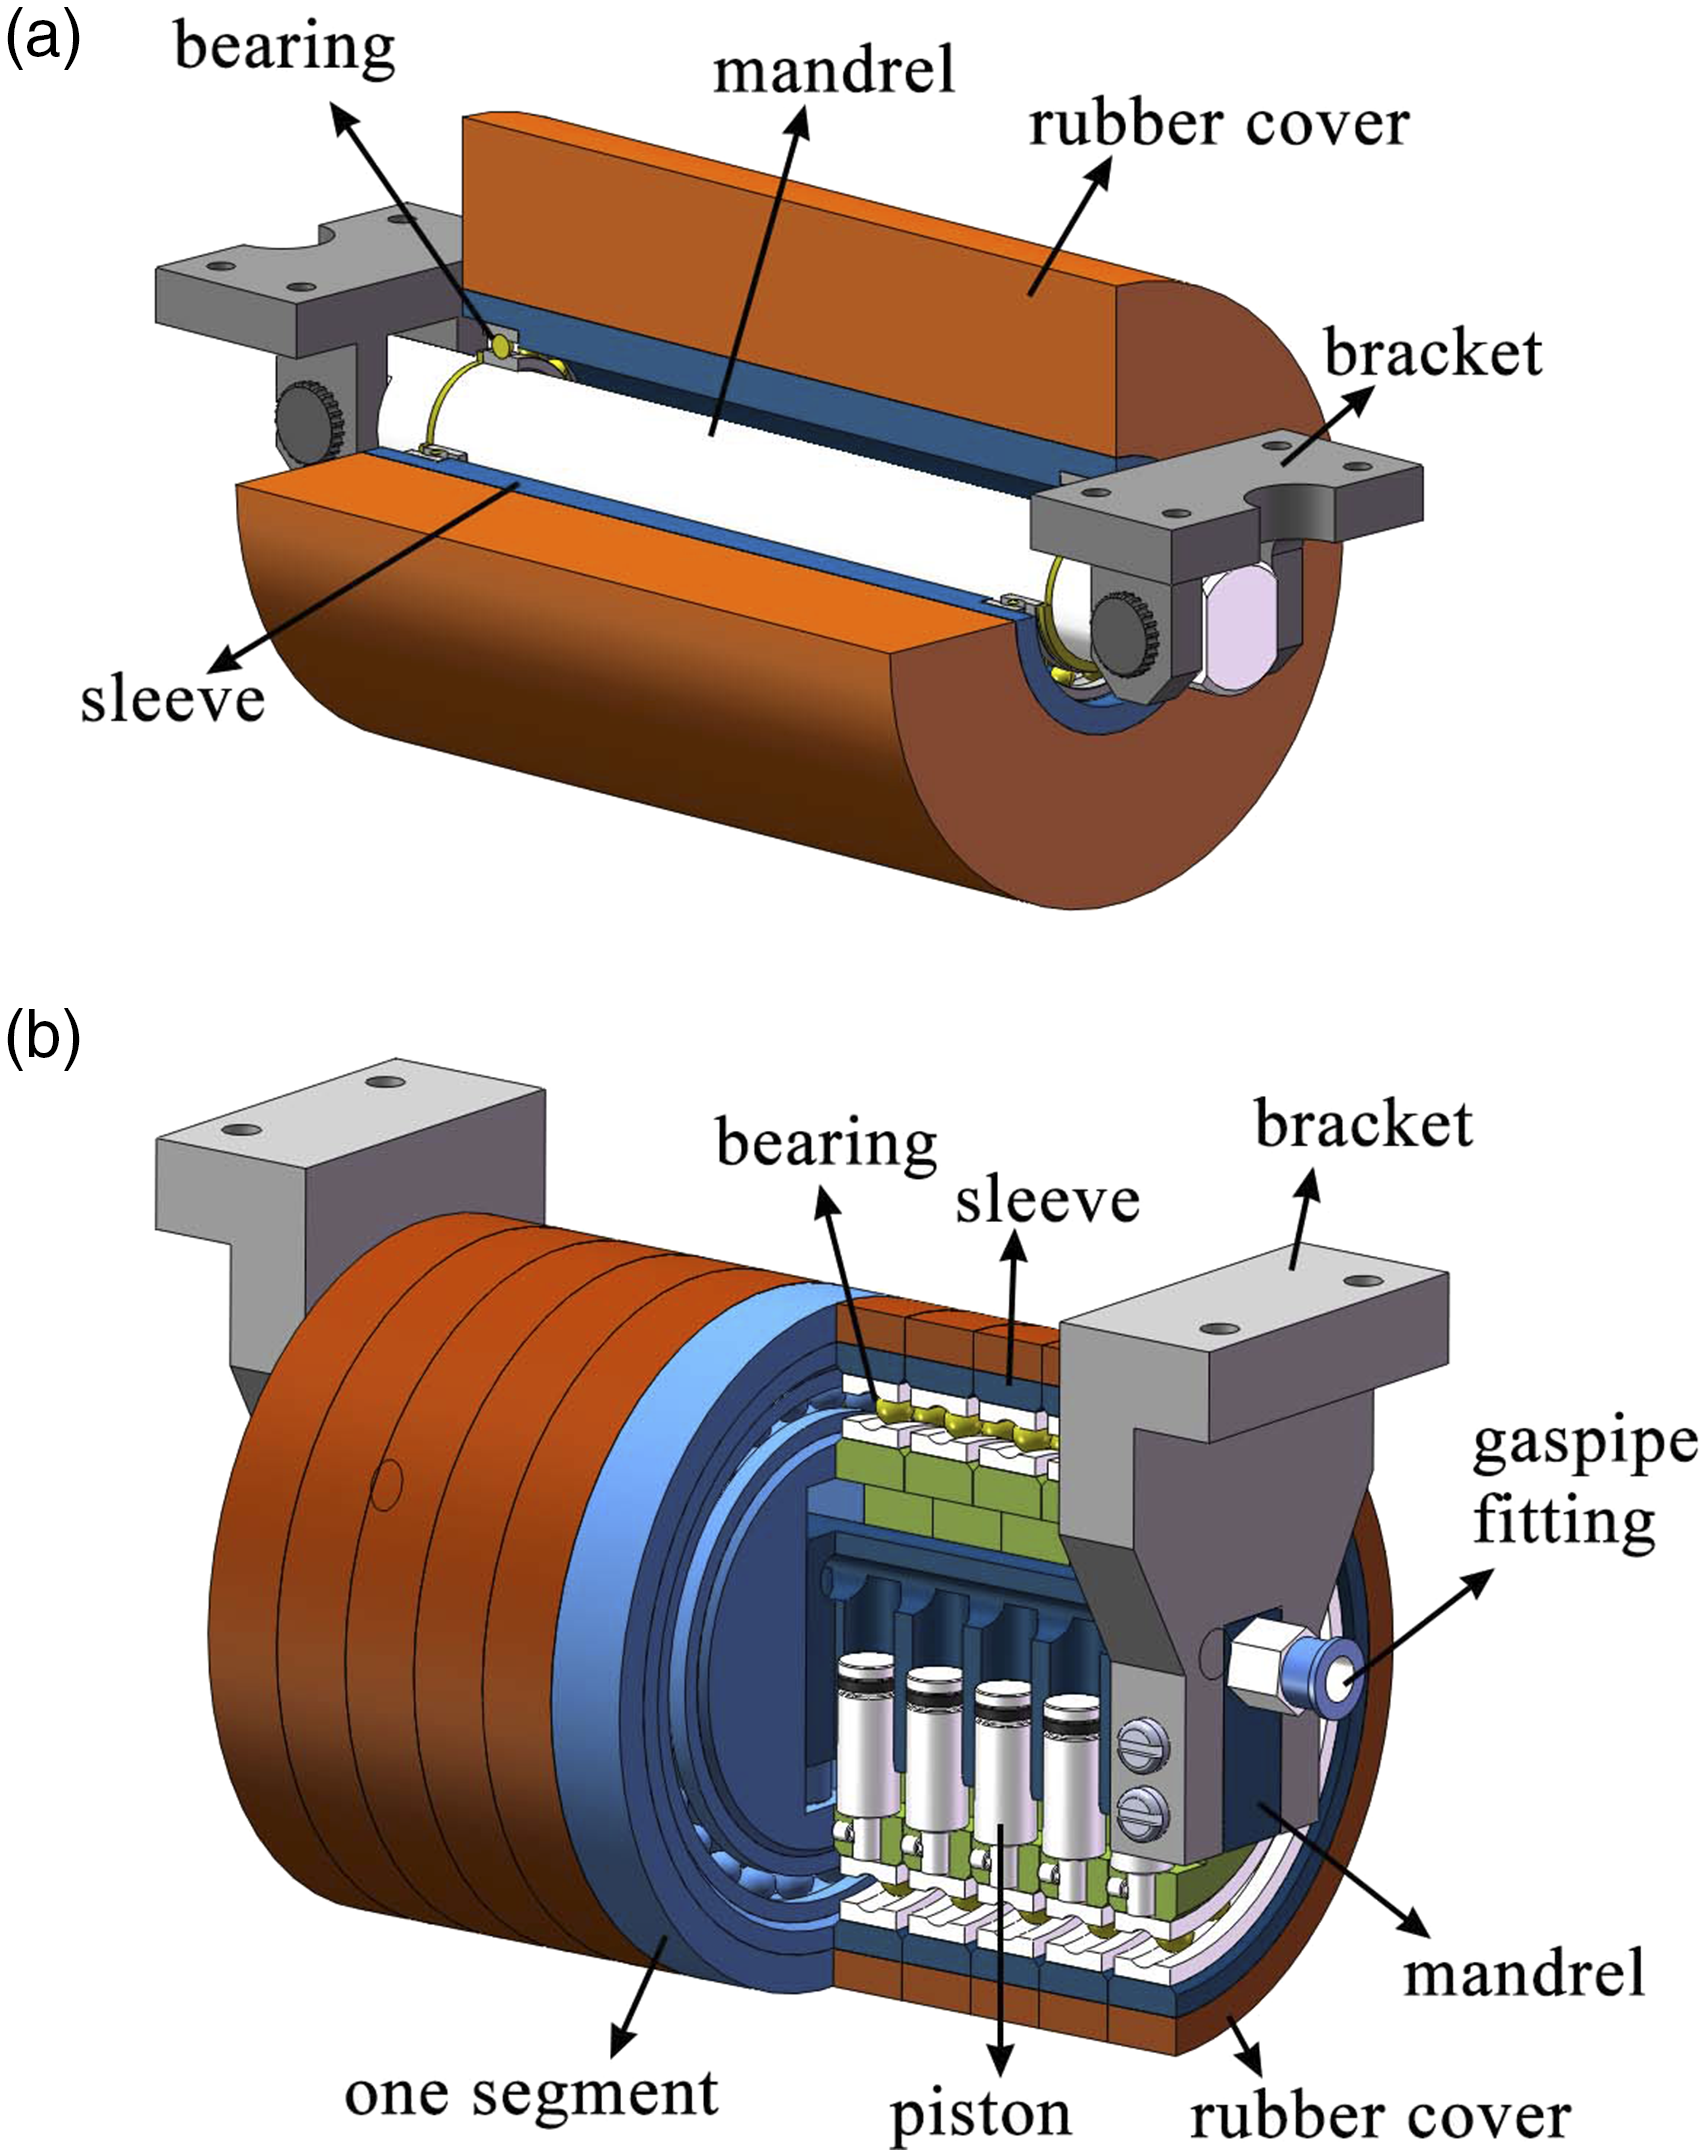
On the basis of our previous work on common roller, 14 a study on the segmented roller and compaction pressure uniformity is carried out. In this paper, a theoretical model is established to calculate compaction pressure distribution under segmented roller for layup onto general surfaces and validated by the following experiment. Based on the model, single-point pressure uniformity and whole-path pressure uniformity are proposed to quantitatively evaluate the pressure distribution. Furthermore, the pressure distribution, pressure uniformity, and layup quality of segmented roller and common roller are compared. The results show that the established model can be used to predict pressure distribution under segmented roller. Moreover, segmented rollers apply evener compaction pressure and can eliminate layup defects caused by insufficient pressure under common rollers.
Modeling and experimental validation of compaction pressure distribution under segmented rollers
Contact analysis of segmented roller and mold with general surfaces
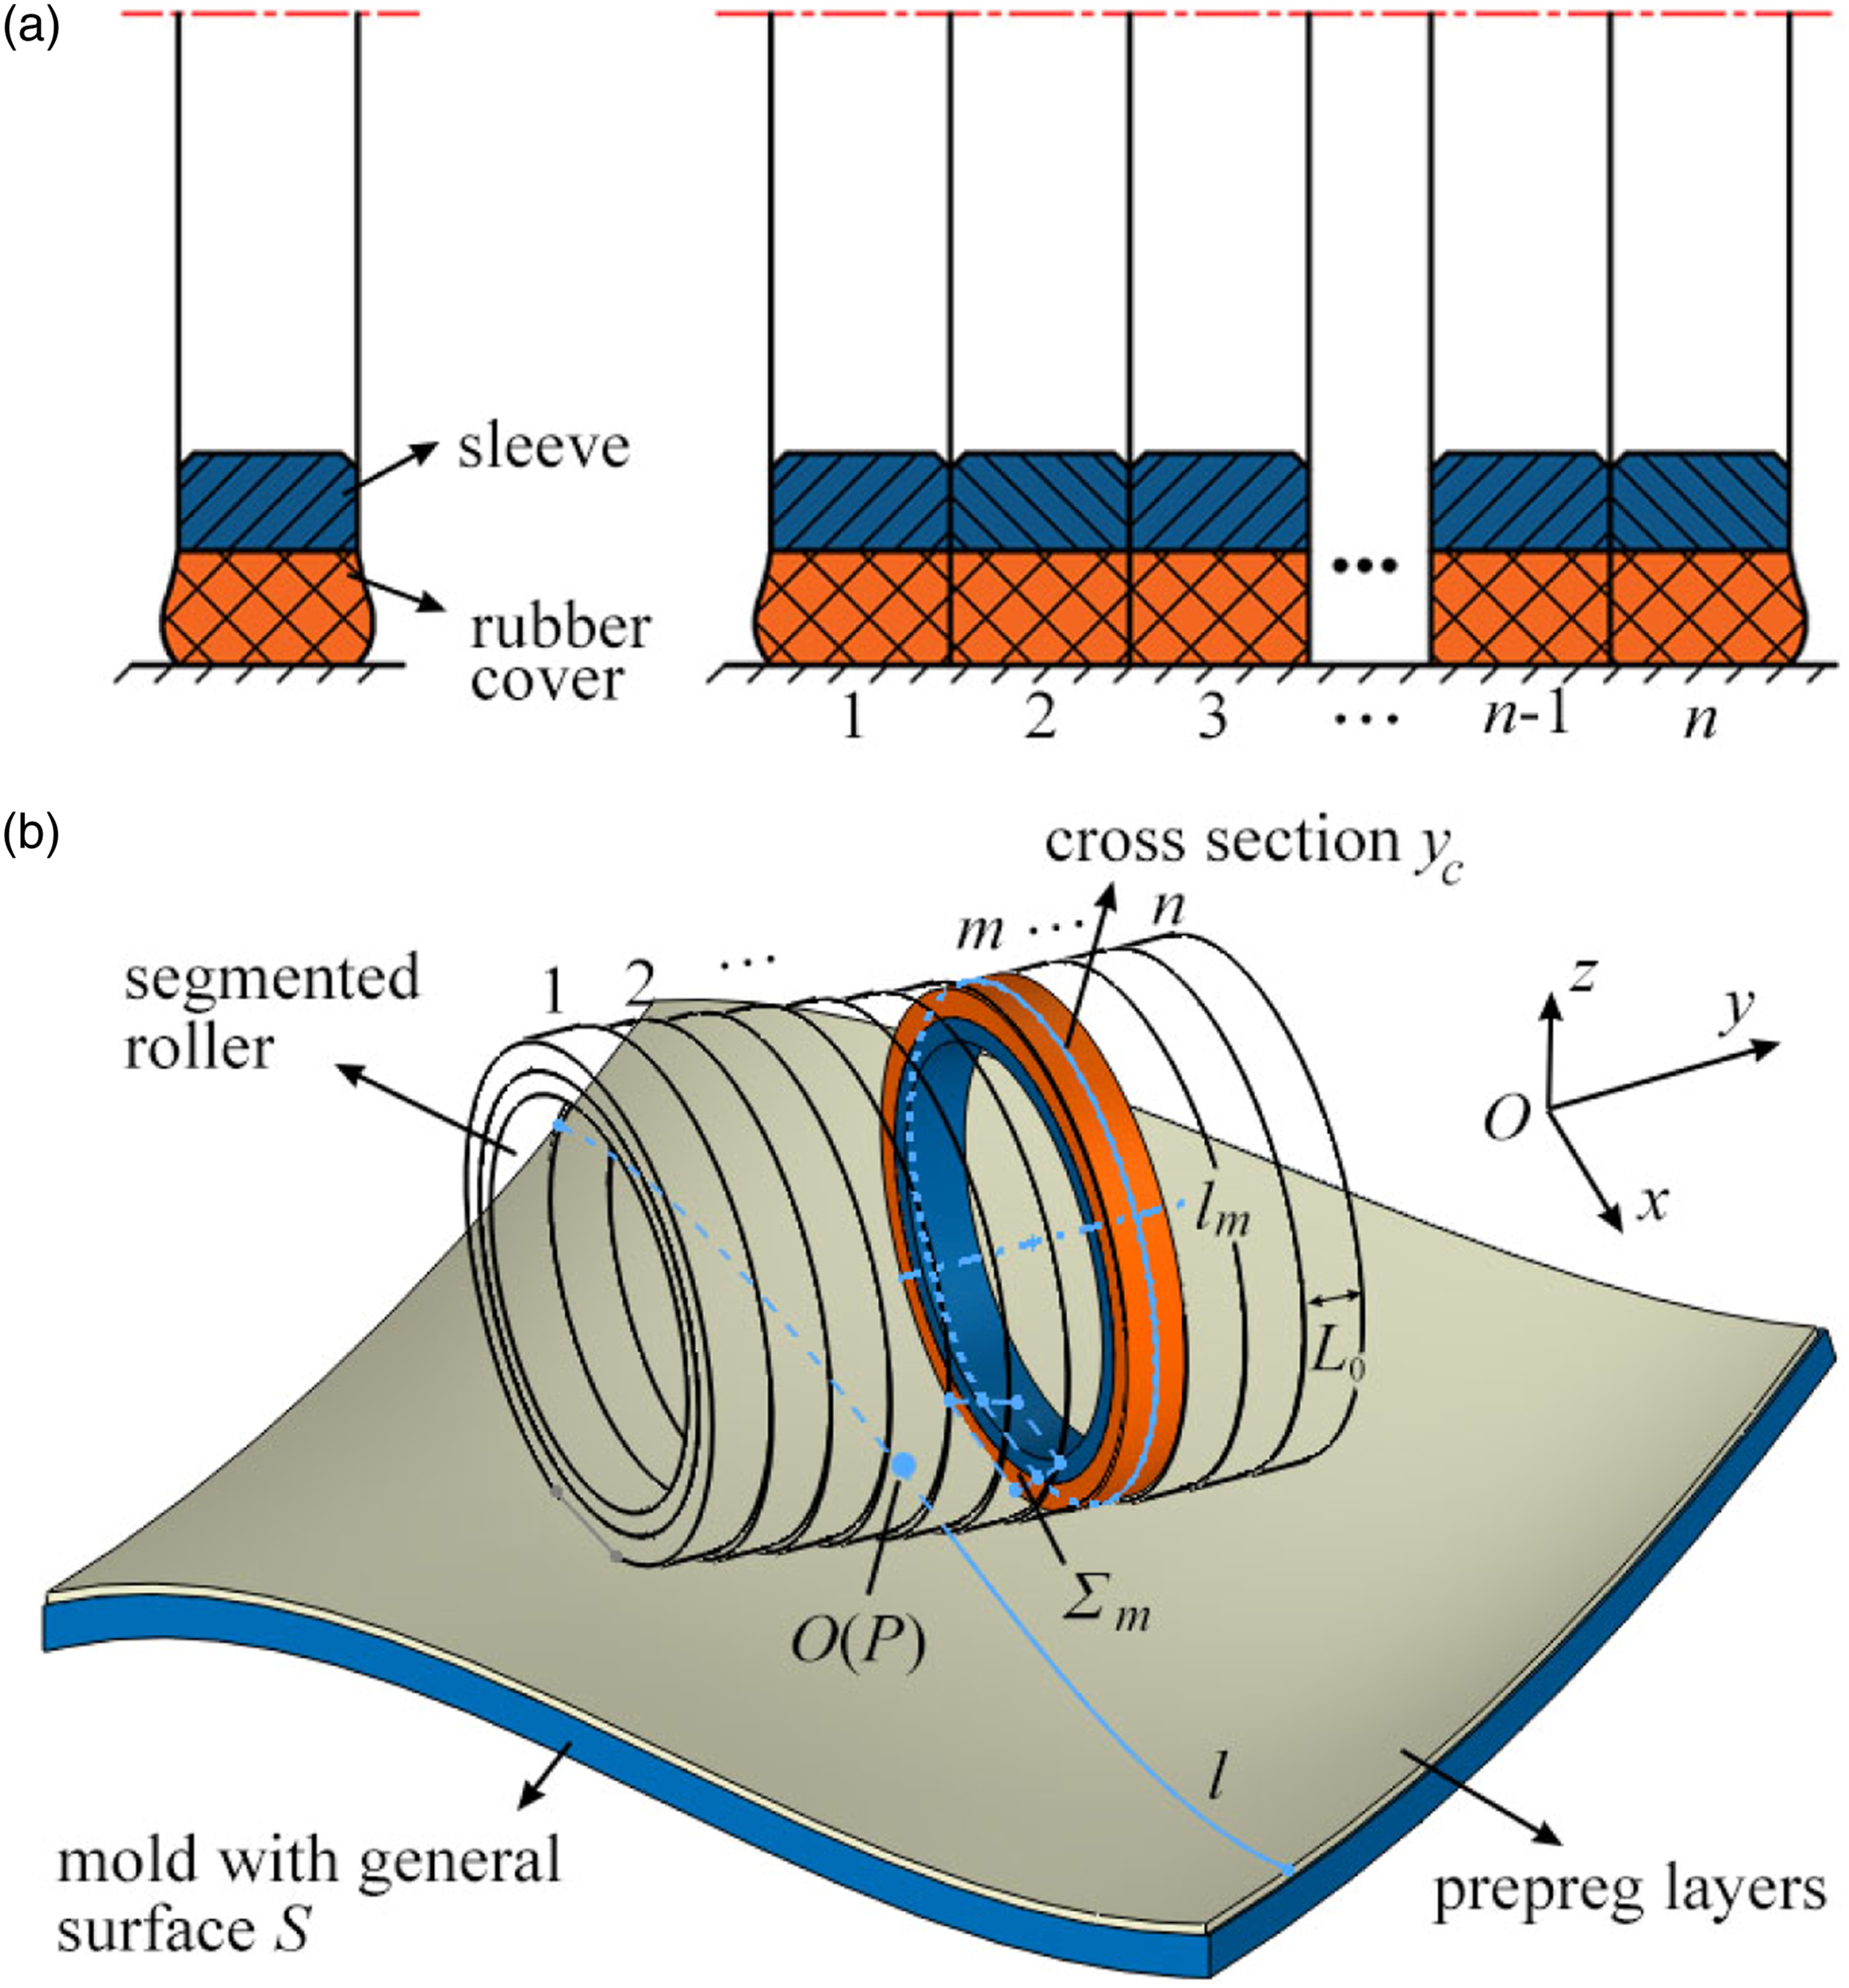
The compaction pressure is essentially the contact pressure between roller, layers, and mold. However, due to the complexity of AFP, it is difficult to obtain an accurate analytical solution for the pressure distribution. The mold surface is an irregular 3D surface without function expressions, and the rubber cover of the compaction roller is characterized as hyperelastic and exhibits large deformation. Therefore, the following simplifications are made to simplify the problem and obtain an approximate solution. (i) The compaction roller basically maintains a low speed and uniform rolling in AFP; then the rolling process can be considered as a static press process at each path point. (ii) Each segment of the segmented roller is relatively thin, but when multiple segments are placed side by side, the two sides of each segment are in close contact during deformation, as shown in Figure 2(a). Moreover, the part where the deformation occurs is concentrated in a small area at the bottom. Therefore, except for the outer side of the two outer segments, the segmented roller can be regarded as a plane strain case. (iii) The following analytical method was used. Since the main focus is on pressure, preliminary results are first obtained using the qualitative analysis method in contact mechanics
23
and Gaussian theory
24
, without considering friction and shear for the time being. The results are then corrected by finite element simulations considering friction and shear. (a) Profile of the rubber cover deformation of the segmented roller (b) the placement of segmented roller onto mold with a general surface S.
Under lubricated conditions and uniform deformation between contact surfaces, the stress–strain relationship can be predicted by Gaussian theory,
24
as shown in the first two equations in equation (1). Ignoring ε3, the simplified stress–strain relationship shown in the third equation in equation (1) can be obtained. And for non-uniform deformation, Young’s modulus E in equation (1) needs to be replaced with the effective compression modulus E
C
to modify Gaussian theory, as shown in equation (2)24
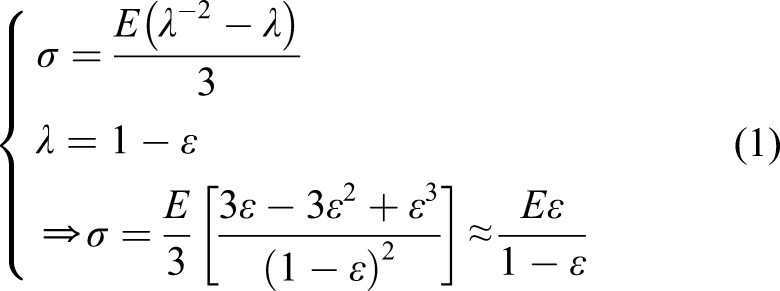
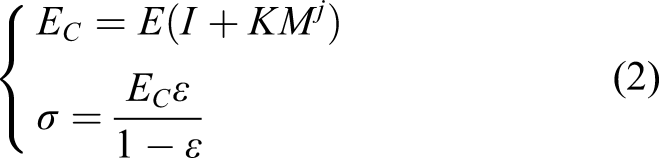
Figure 2(b) shows the placement of the segmented roller onto mold with a general surface S. The segmented roller is composed of n segments (generally n < 16). The width of each segment is L0, and the total width L = nL0. Suppose the current prepreg layer is the ith layer, S i is the surface of the ith layer, and l is a path of the ith layer. Take any path point p on path l for analysis; then the following spatial rectangular coordinate system is established: the coordinate origin O is located at p, the x-axis is the tangential direction of path l at point p, and the z-axis is the outer normal direction of surface S i at p.
Since each segment can rotate and move up or down independently and is subject to the same air pressure load, the contact between each segment and prepreg layers can be analyzed separately. Take any radial cross section y = y
c
of the mth (m =1, 2, ..., n) segment for analysis, as Figure 2(b) and Figure 3 shows. Σ
m
is the contact zone between the mth segment and layers, l
m
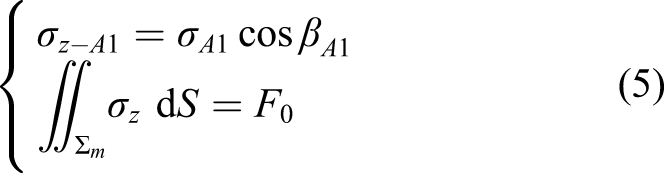
is the center line of the mth segment, R is the outer radius of the rubber cover, and r is the inner radius. F0 is the compaction force of each segment, and the total compaction force F = nF0. F0 and F are perpendicular to surface S
i
at path point p, that is, they are parallel to z-axis. h is the thickness of all layers, and h = ih0, where h0 is the thickness of a single layer. Contact analysis of the mth segment in cross section y = y
c
(a) deformation and contact stress of roller and layers (b) actual contour of the roller after deformation.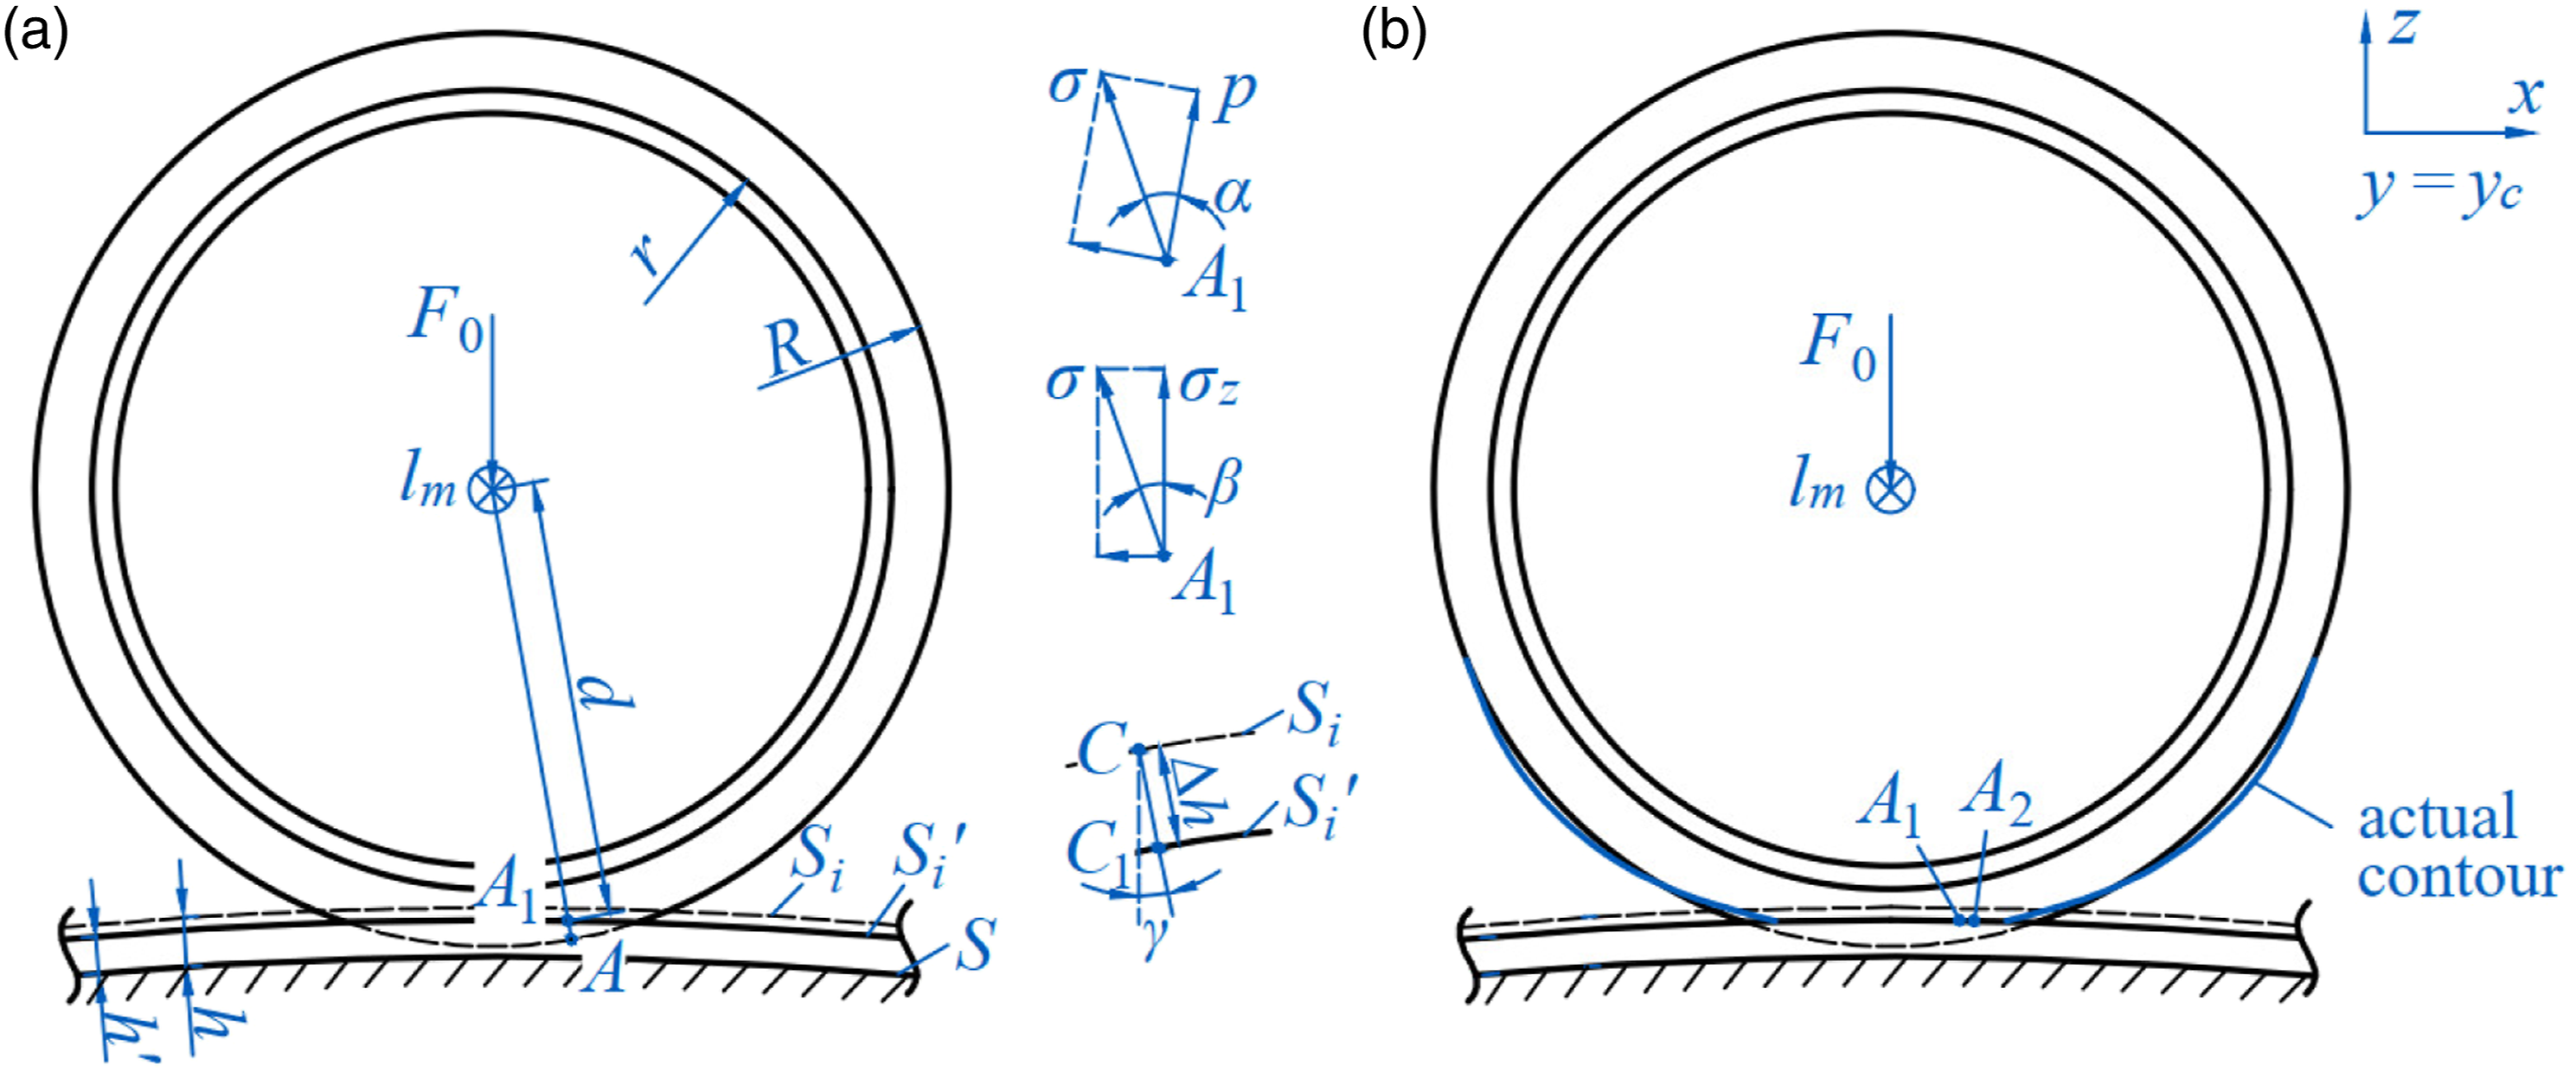
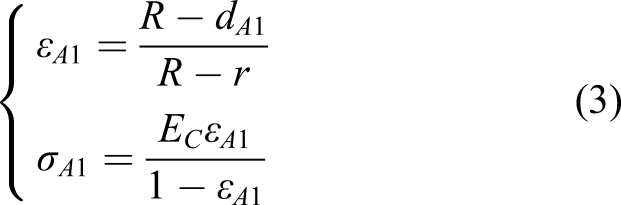
After applying F0, the original surface S
i
of the ith layer is deformed to S
i
′. For the time being, assume that the contour of the roller remains circular. Take any point A on the original contour of the roller for analysis. A moves to point A1(xA1, yA1, zA1) along the radius direction after deformation, and A1 is on the deformed surface S
i
′ of the ith layer. Therefore, the compression stress σA1 at A1 can be obtained, as shown in equation (3)

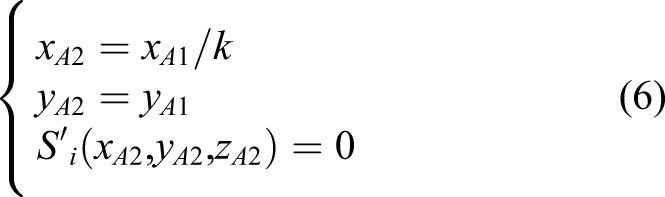
Moreover, only radial strain was analyzed previously, while circumferential strain and the presence of friction lead to a change in the contact width, as shown in Figure 3(b). To solve this problem, a scaling factor k is introduced, and move point A1 along surface S
i
′ on cross section y = y
c
to point A2. The coordinate relationship between points A1 and A2 is shown in equation (6)
After the above analysis of the deformation of the roller, the next step is to obtain the deformed surface S
i
′ of the ith layer. The mold surface S is known, and the original surface S
i
of the ith layer can be obtained by thickening S by h = ih0, where h0 is the thickness of a single layer. After being subjected to compaction pressure, S
i
deforms to S
i
′. Since the in-plane modulus of the layers is much higher than the out-plane modulus, only the deformation in the layers thickness direction is considered. Take any point C on surface S
i
in cross section y = y
c
to analyze, as shown in Figure 3(a), and the deformed point C1 on S
i
′ can be obtained as follows
The pressure distribution under the mth segment is obtained by combining equations (5)–(7). Repeat this analysis for all segments to obtain the entire pressure distribution around a certain path point. And repeat this process for all path points to obtain pressure distribution of the entire layup process.
Calculation method of E C and k
In this section, the effective compression modulus E C and the scaling factor k are determined by combining finite element simulation with MATLAB function fitting. A two-dimensional finite element model of the contact between segmented roller and flat mold is established in ABAQUS. The inner radius r, the outer radius R, and the hardness H of the rubber cover is set to 40 mm, 45 mm, and 55 HA. The element type of the rubber cover is set to CPE4RH and that of the mold and the sleeve is CPE4R.
Material parameters of each part in the finite element model. 25 .
The simulation result is shown in Figure 4(a). The CPRESS (contact pressure) of each element node of the mold surface is extracted to obtain a set of data about the pressure p and x-coordinates. And d0, distance from the center line l
m
to the mold surface after the roller deformation, is also extracted. (a) Simulation result of compaction pressure on flat mold (F0/L0 = 5 N/mm); (b) fitting result of compaction pressure distribution; (c) simulation results and predicted results.
One the other hand, according to the theoretical model in Contact analysis of segmented roller and mold with general surfaces, function expression of pressure distribution on flat mold is derived, as shown in equation (8)
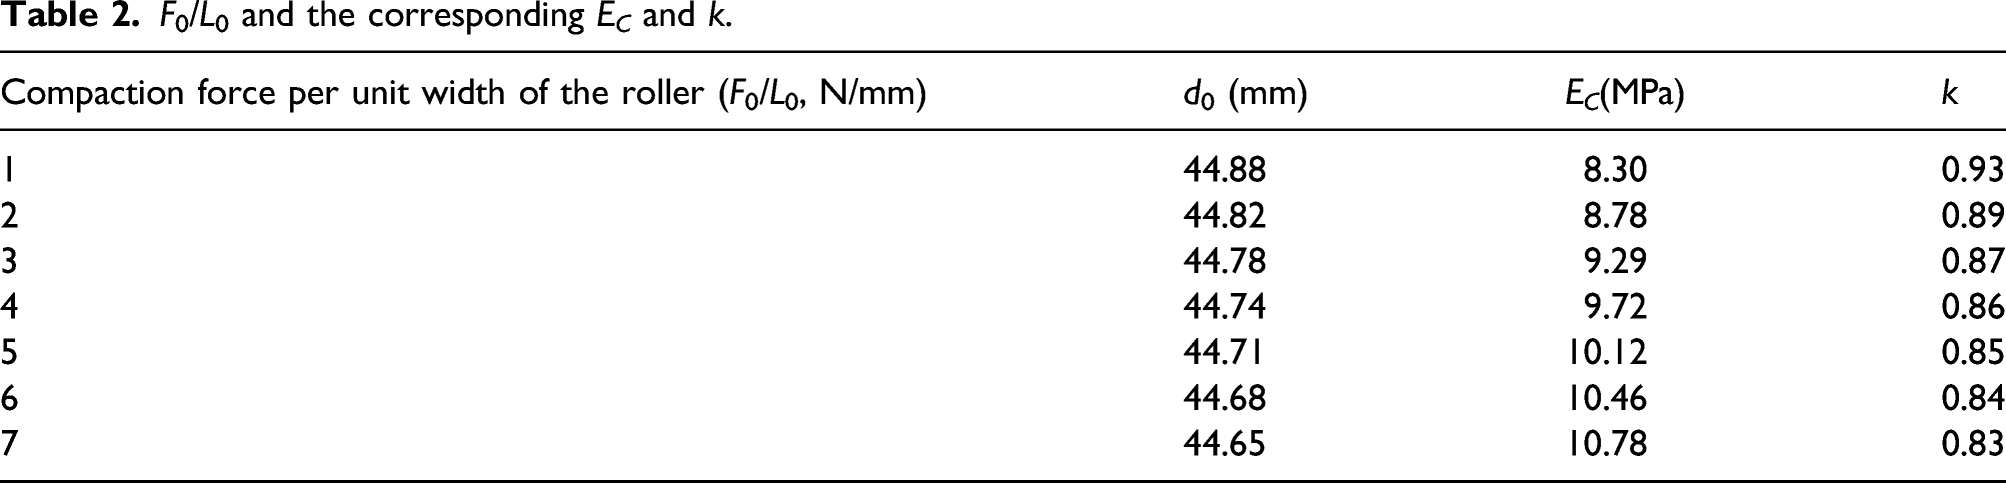
Except for E C and k, other unknowns in equation (8) can be obtained from the simulation results. Then E C and k are fitted according to the functional form of equation (8) using MATLAB function fitting tool, and the fitting result is shown in Figure 4(b). It can be seen that the simulation result and the fitting result have good similarity.
F0/L0 and the corresponding E C and k.
Case of calculating pressure distribution under segmented roller
Based on the established model, calculate the compaction pressure distribution around five path points P1 ∼ P5 of a 3D surface, as shown in Figure 5(a). The length and width of the mold are 280 mm and 130 mm, respectively. The thickness h0 of a single layer is set to 0.125 mm, and the layers number is 3; thus, the total thickness of the three layers h is 0.375 mm. Then, the third layer surface S3 is obtained by thickening the mold surface S by 0.375 mm. {O
M
} is the mold coordinate system. And the surface S3 at P1, P2, and P3 is convex and at P4 and P5 is concave. Porcupine curvature radius of S3 is obtained by CATIA, as shown in Figure 5(b). The out-of-plane modulus E3 of prepreg is 5.3 MPa. The segmented roller has 11 segments. Each segment has a width L0 = 11 mm, and the total width L = 121 mm. The inner radius r, outer radius R, and hardness H are the same as those in Calculation method of EC and k. The compaction force F0 for each segment is set to 25 N, corresponding to the total compaction force F of 275 N. (a) The curved mold and the surface of the third prepreg layer; (b) porcupine curvature radius of the third layer surface S3.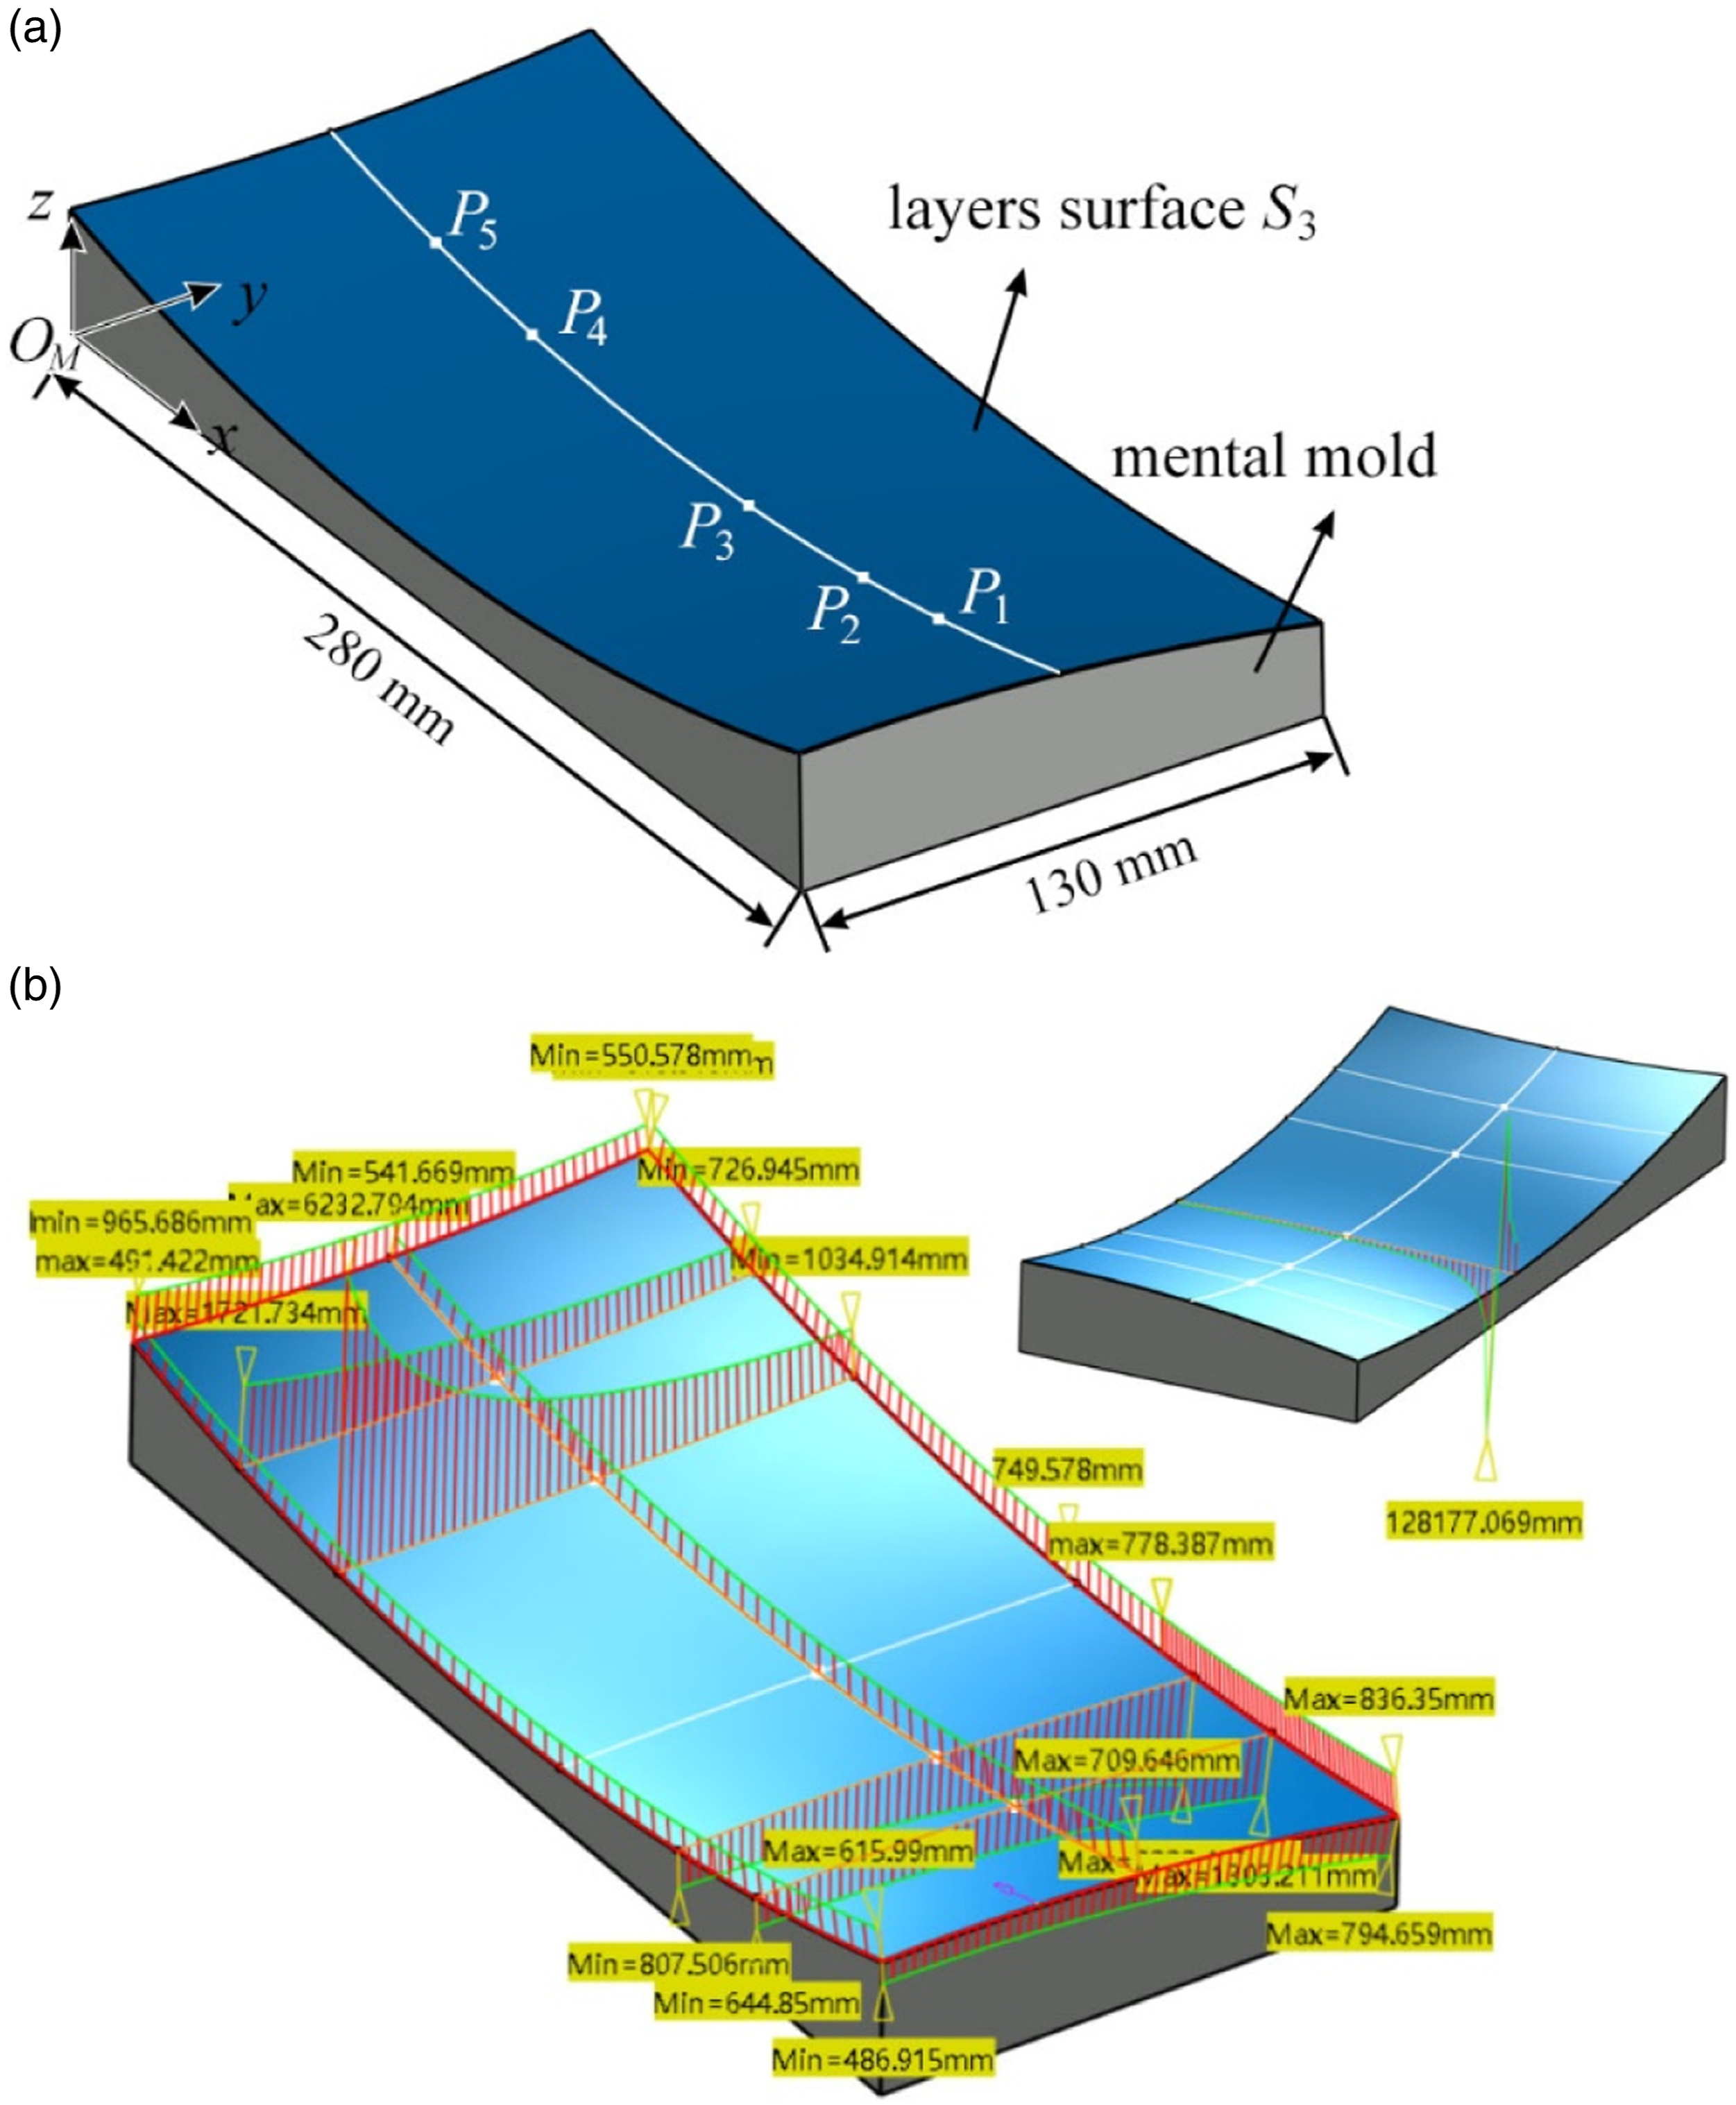
Since the profiles of most aerospace components are often irregular surfaces without specific function pressions, the function integral in equation (5) needs to be replaced by a numerical integral. Triangular meshing is performed on surface S3 and the center points of each triangular mesh are extracted. After that, calculate the product of the pressure at each center point and the area s
i
of each corresponding mesh, sum all the results, and the value is equal to F0, as shown in equation (9) Flow chart of the algorithm for calculation compaction pressure distribution under segmented compaction roller.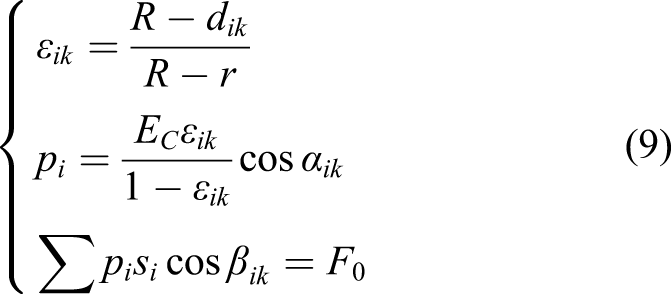
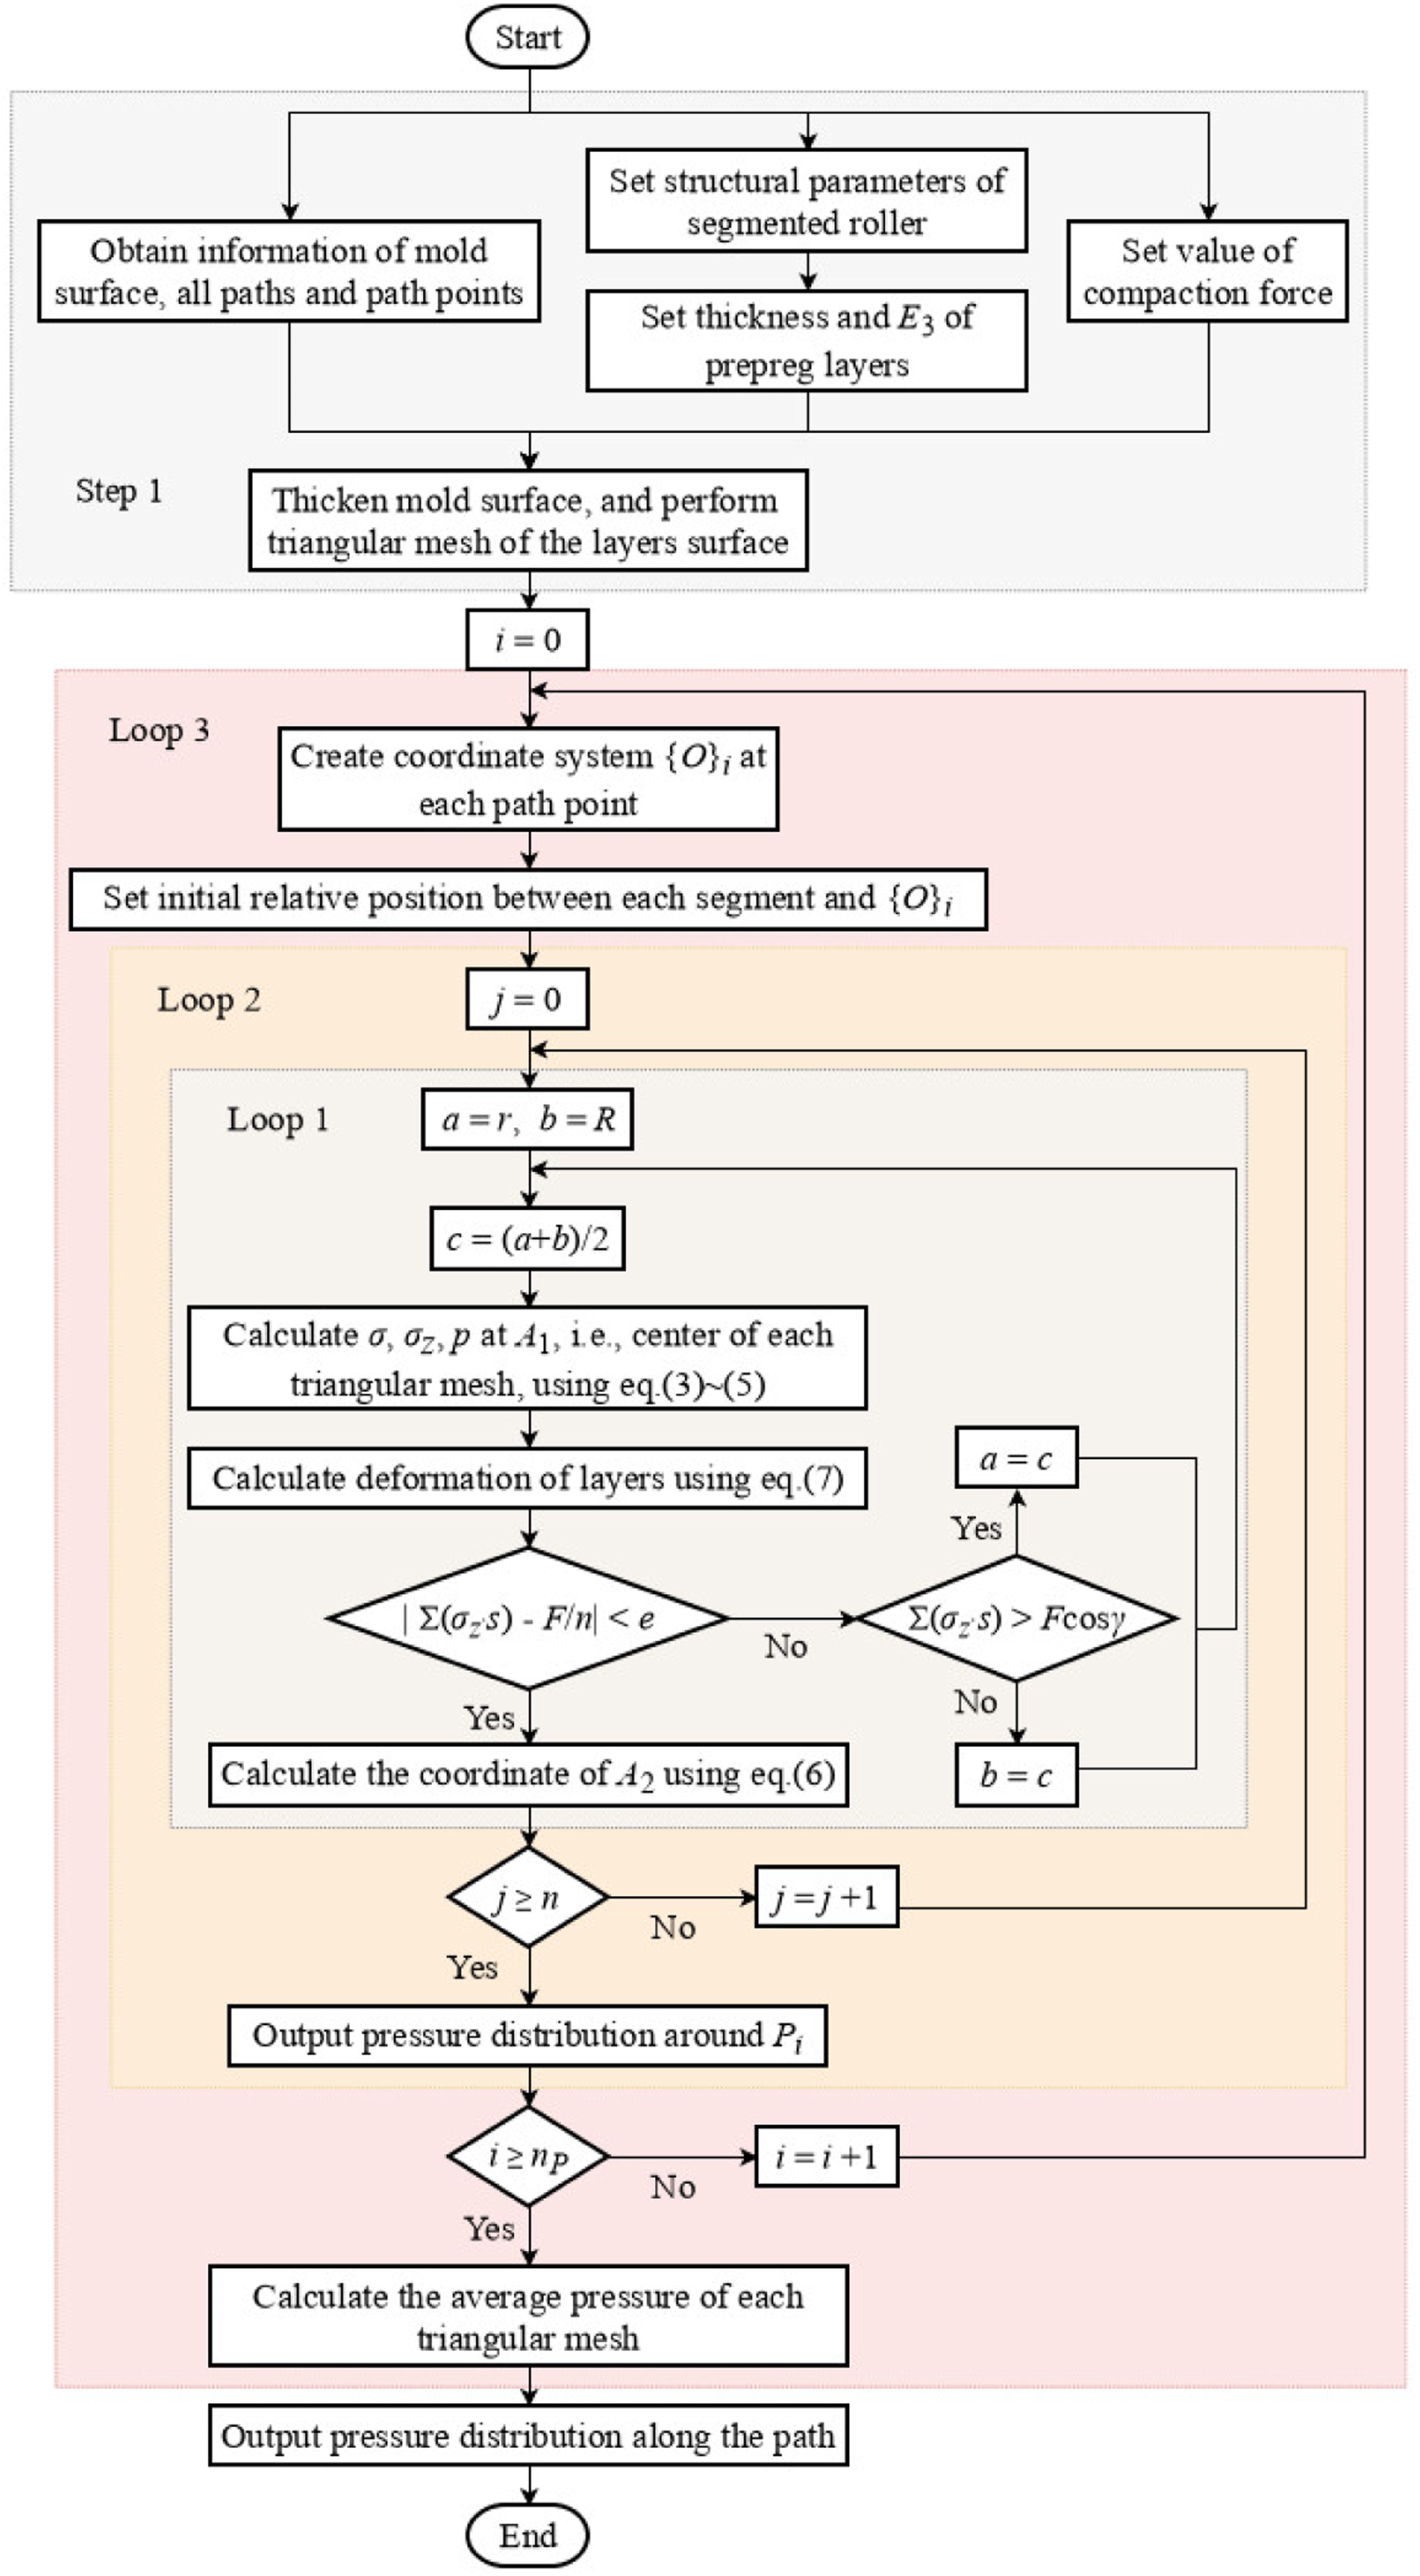
Moreover, pressure distribution around each path point is obtained in Loop 2, as shown in Figure 7(a). {O
M
} is the mold coordinate system, and {P
i
} (i = 1, 2, ..., 5) is the coordinate system at each path point. It should be noted that in order to be consistent with the experiment in Experimental validation, the z-axis of {P
i
} is in the same direction as the z-axis of {O
M
}, not along the normal vector of the surface. (a) Theoretical calculation results of compaction pressure distribution under segmented roller around path points P1 ∼ P5; (b) pressure distribution under segmented roller along the whole path l.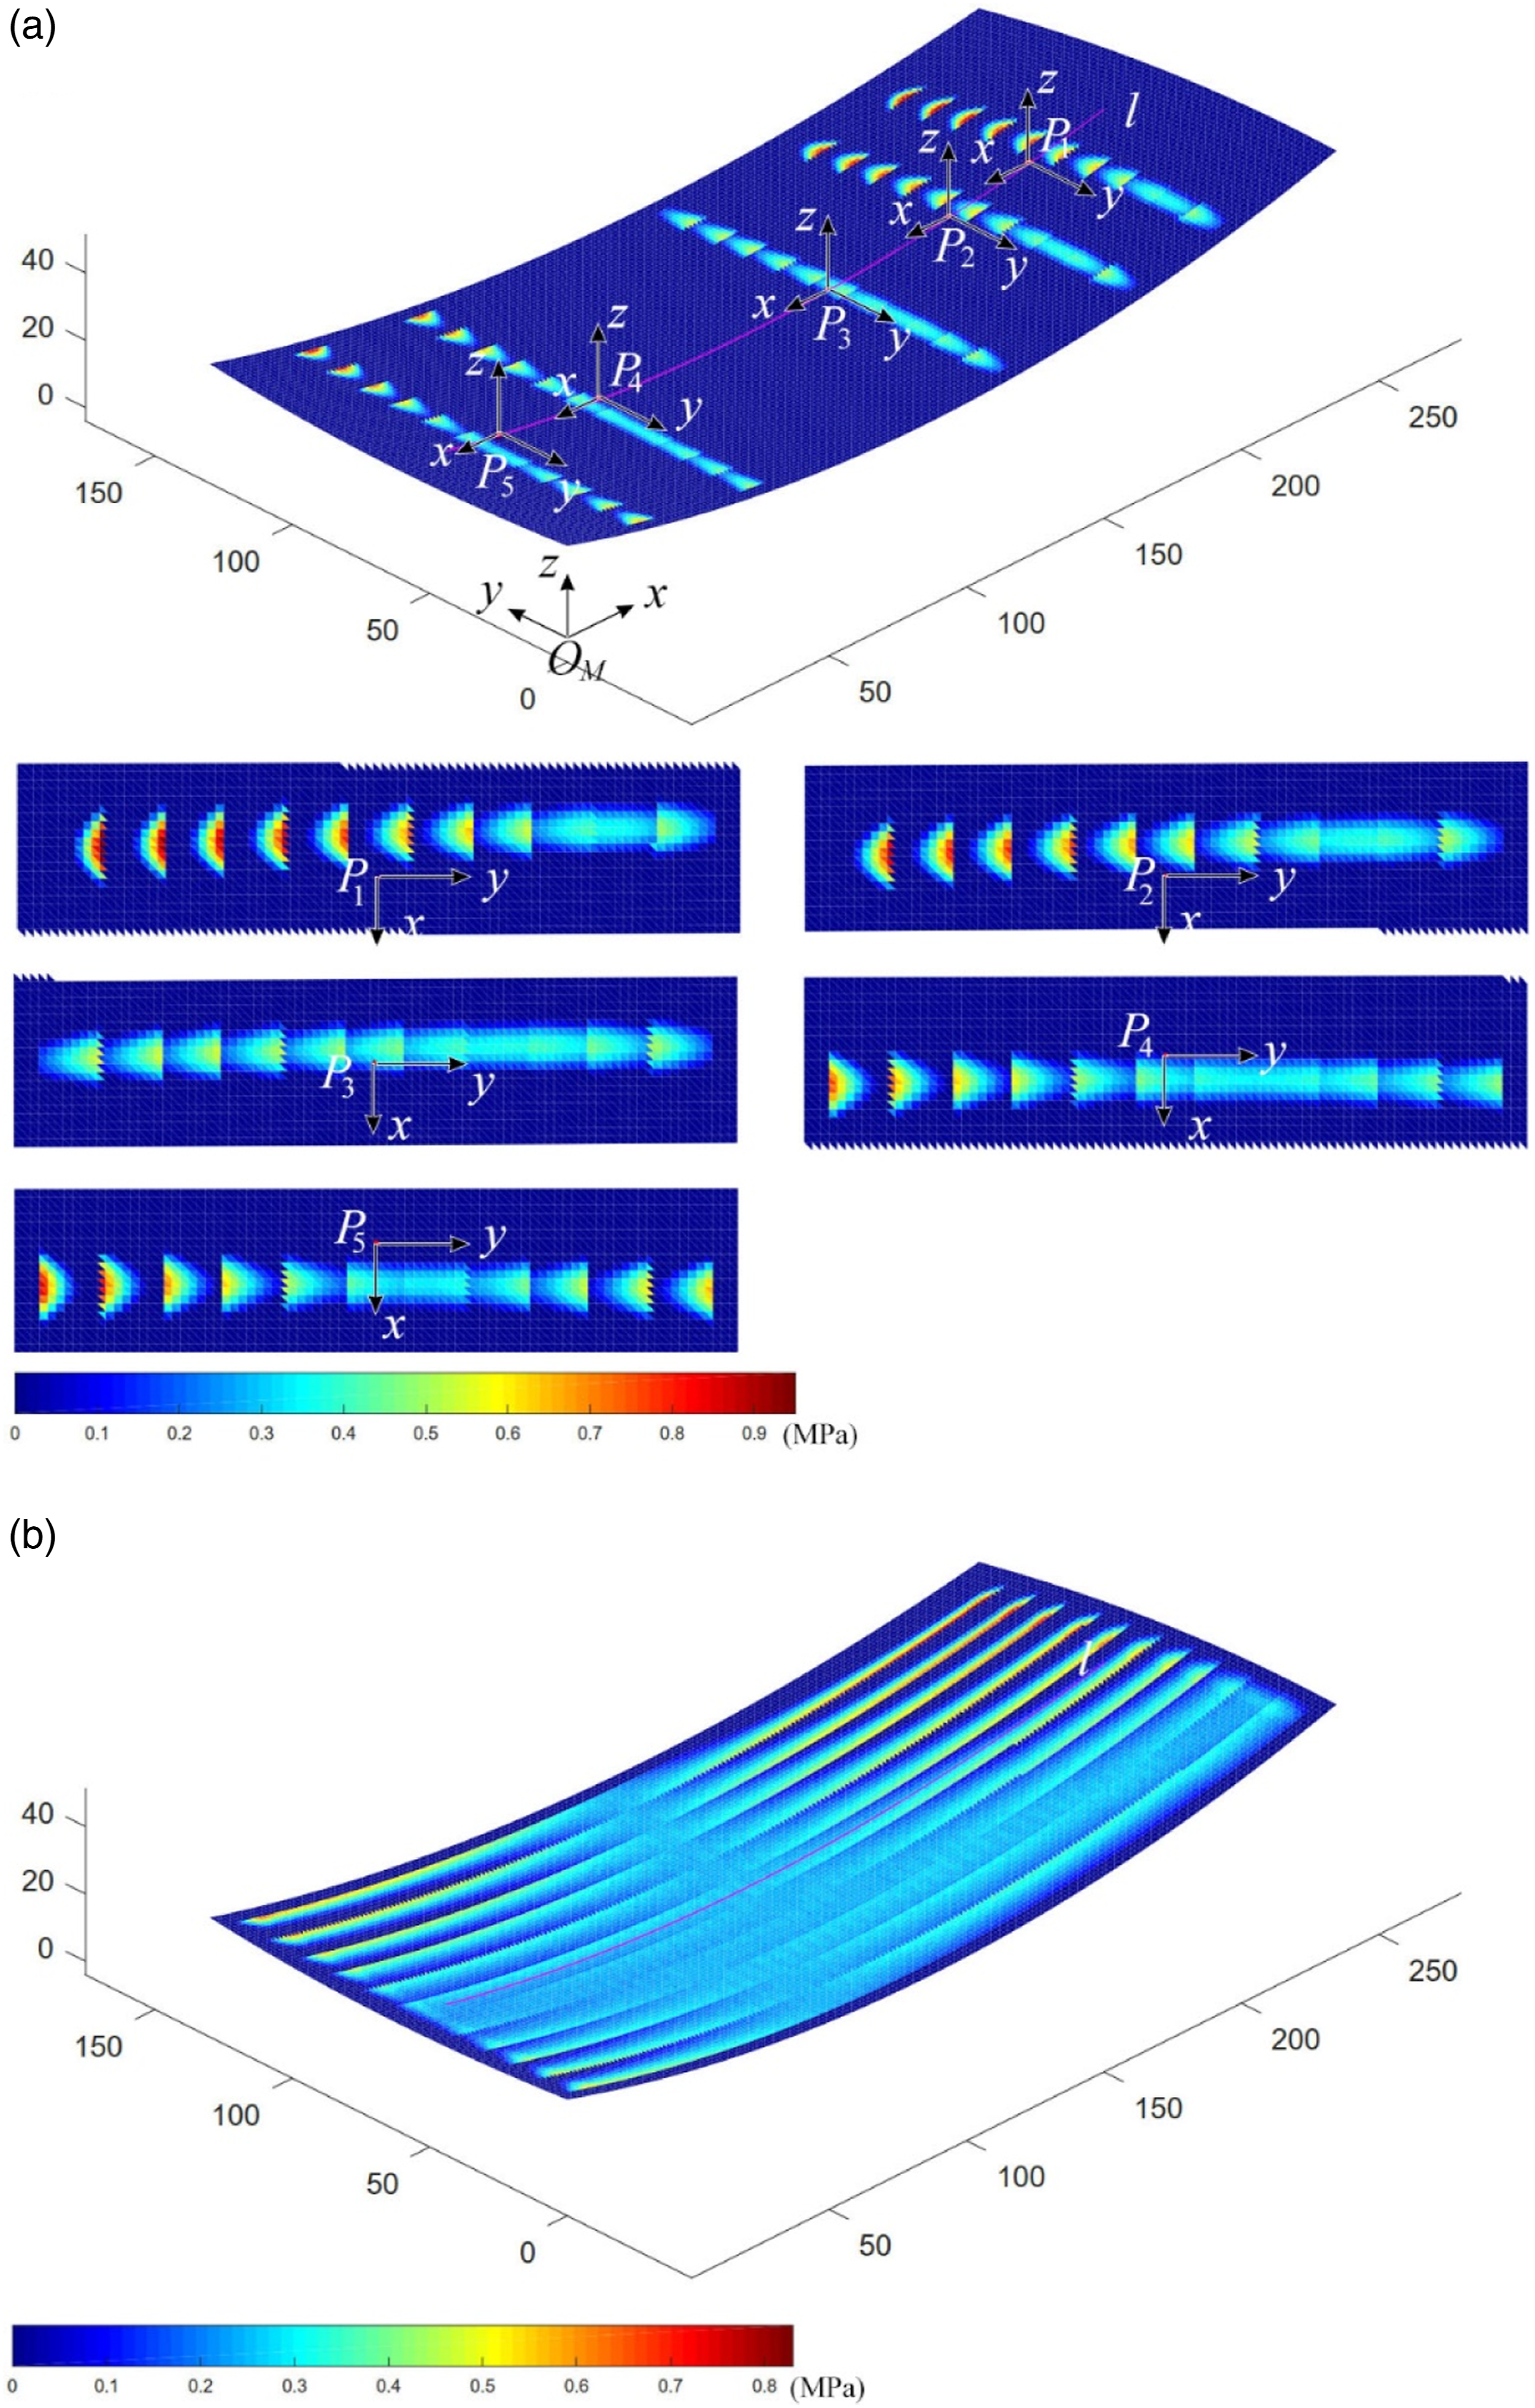
And calculate pressure distribution along the whole path in Loop 3. Since each mesh will undergo a pressure rise from zero to maximum and back down to zero in AFP process, the average pressure of each mesh is taken as the pressure along the whole path, as shown in equation (10). n
P
is the number of path points, and the value is taken to be 480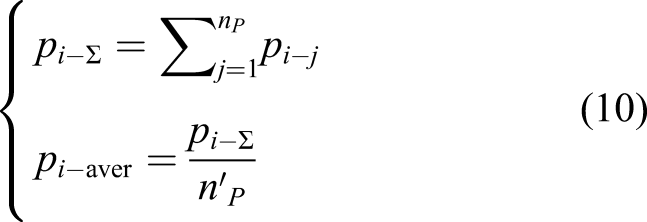
Experimental validation
Experimental setup and materials
In order to validate the established model, an experiment was carried out to measure the compaction pressure distribution. Figure 8(a) shows the experimental setup and a curved mold, which is the same as the one shown in Figure 5. The mold was fixed on the rigid plate of the experimental setup, and the plate can be moved along the guide rails according to control program. The structural parameters of the segmented roller are the same as those in Case of calculating pressure distribution under segmented roller. The gaspipe fittings on both sides of the roller are connected to pneumatic circuit, and the applied compaction force can be adjusted by controlling the compressed air pressure. (a) Experiment setup of fiber placement; (b) measurement principle of pressure measurement film; (c) the relationship between pressure and color density; (d) fitting result of the relationship between color density and gray scale.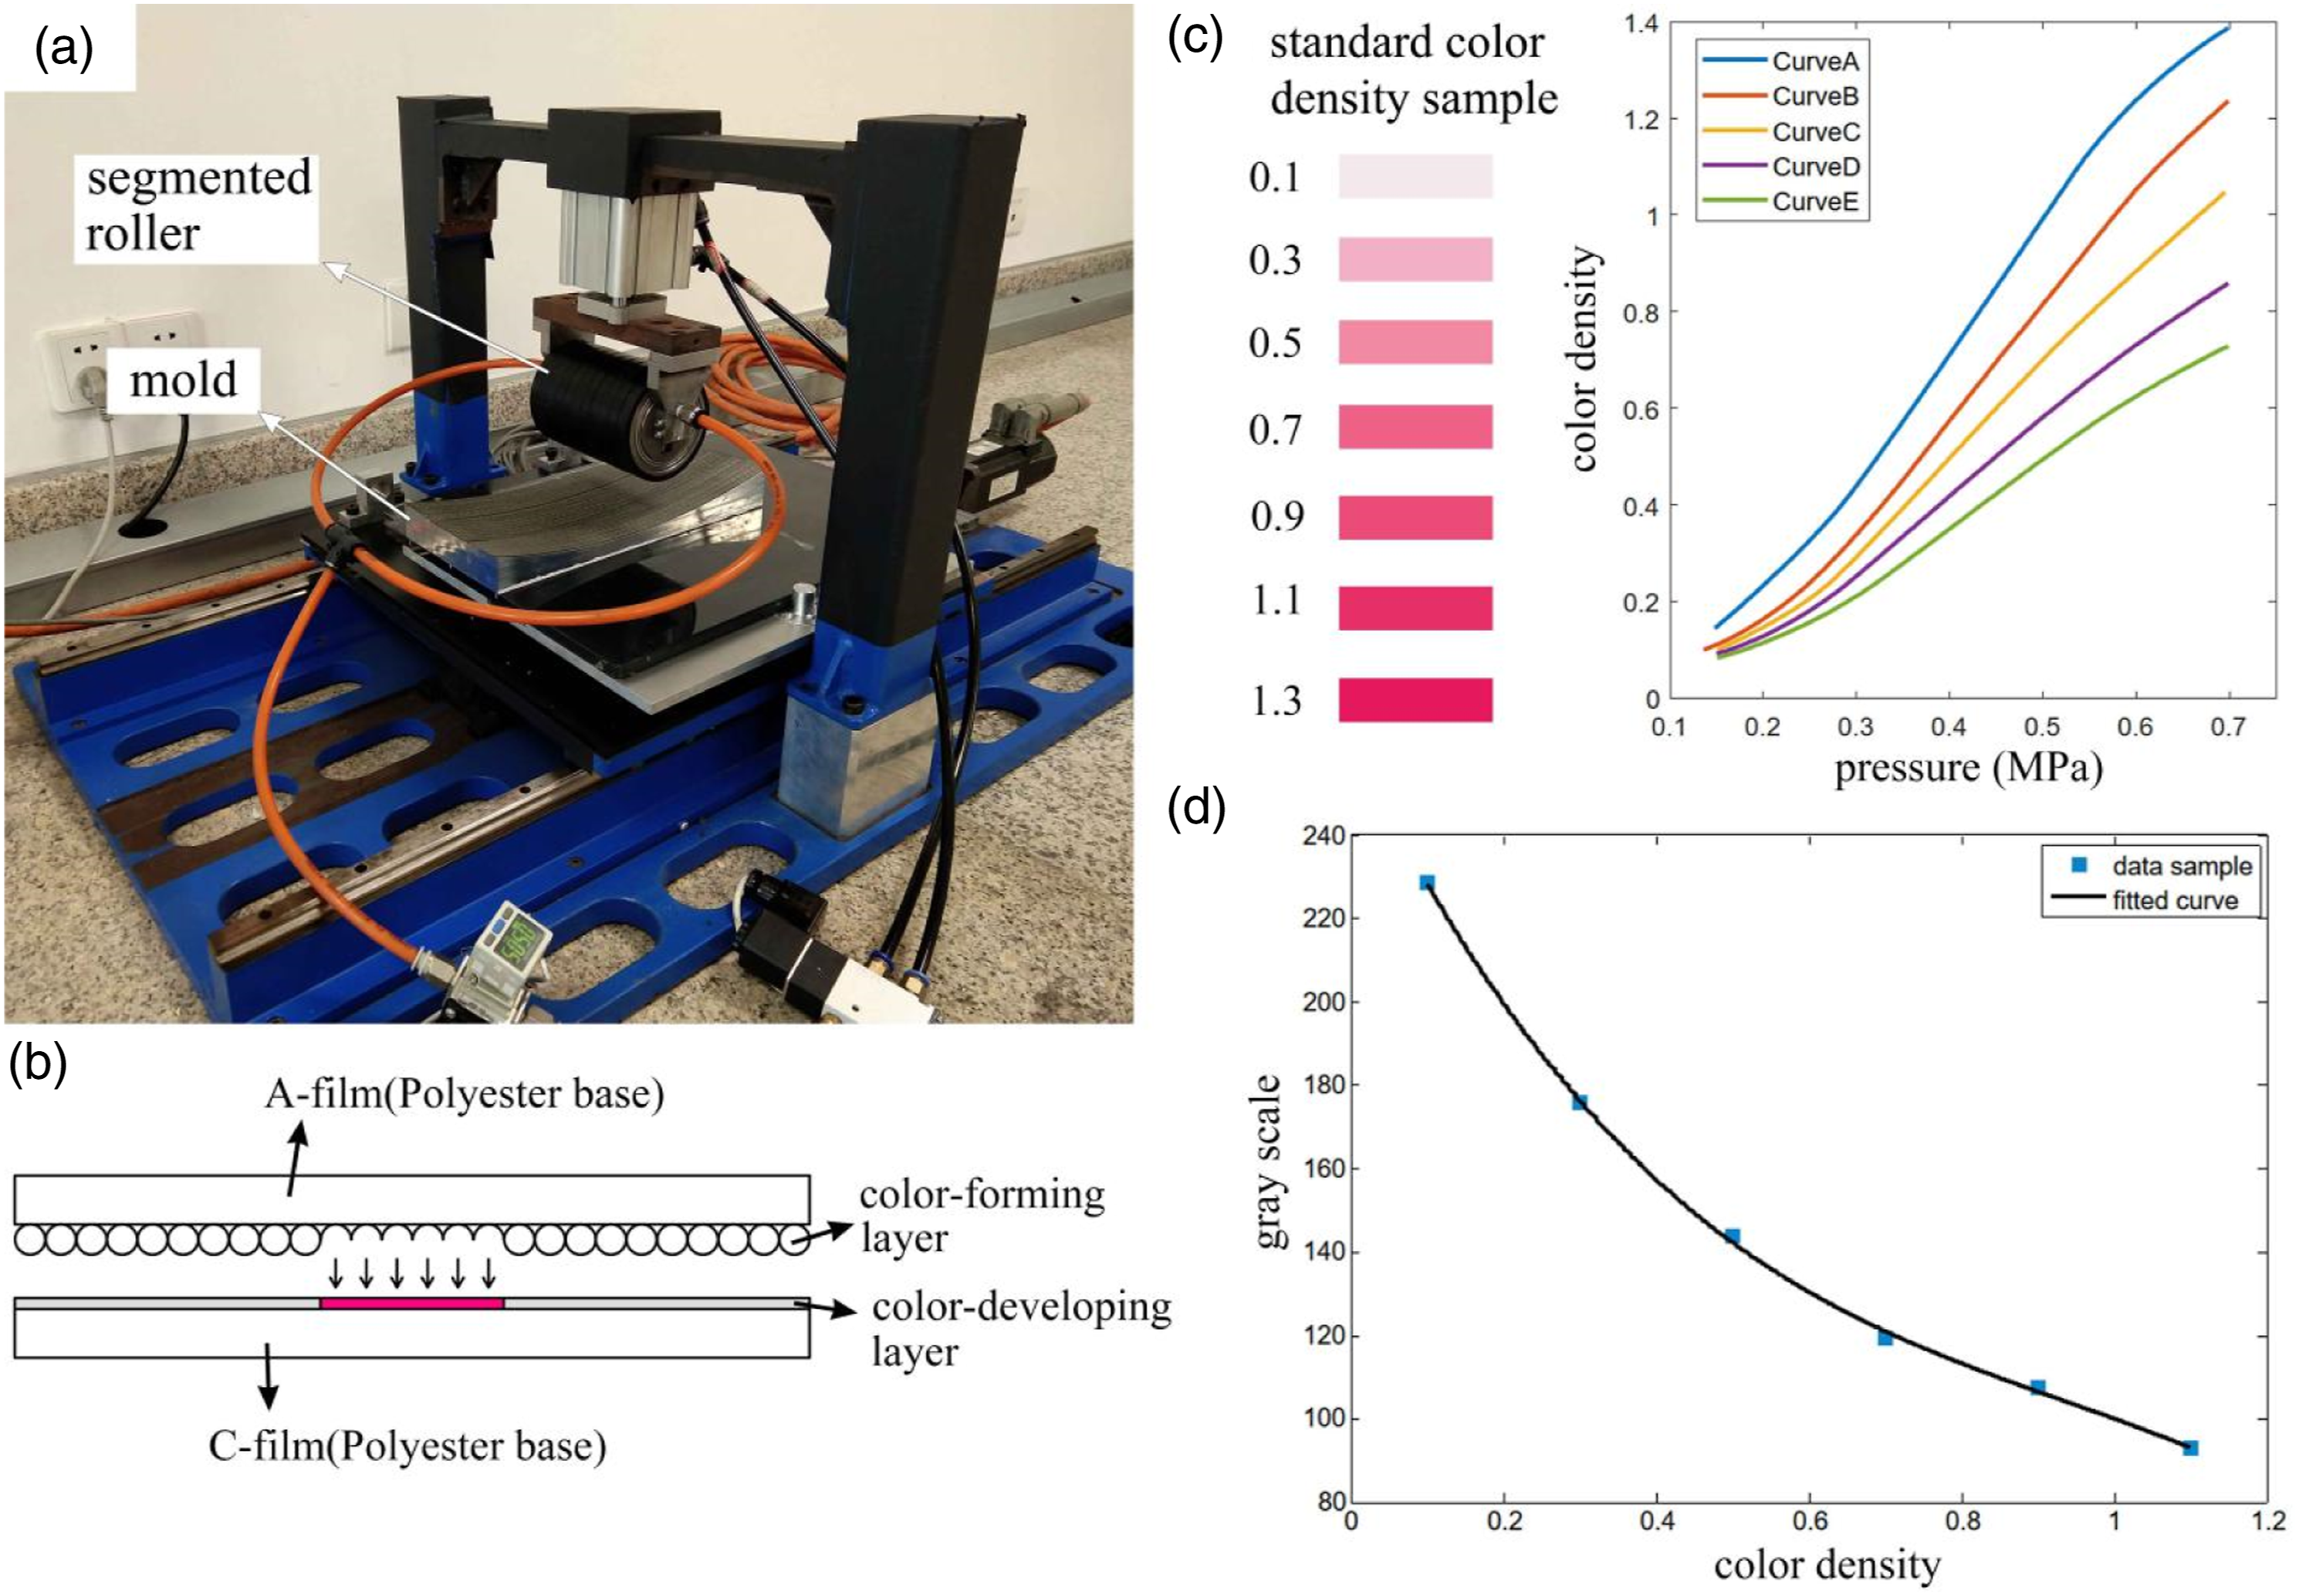
Pressure measurement film (model: LLLW, ultra super low pressure), supplied by FUJIFILM Corporation, was used to obtain the pressure distribution and accurate contact area under the roller. The film is composed of two polyester bases, one coated with a color-forming layer and the other with a color-developing layer, as shown in Figure 8(b). Both of the two bases are 90 μm thick. Place the coated side against each other, and when pressure applied, the two coatings react and produce red color in the color-developing layer. The color density corresponds to the value of the pressure, as well as ambient temperature and humidity. The relationship between color density and pressure is shown in Figure 8(c). Select one of the five curves in Figure 8(c) to use according to ambient temperature and humidity. Since the color density is hard to quantify and read, it is converted into gray scale and a curve of the relationship between them is fitted, as shown in Figure 8(d). Combining Figures 8(c) and (d), the correspondence between gray scale and pressure can be obtained.
Experimental procedure and results
Three prepreg layers were placed on the mold by hand before the experiment, and the prepreg used is AC531/CCF800H unidirectional carbon/epoxy tow with a width of 6.35 mm and a thickness of 0.125 mm. Then, prepare five pieces of pressure measurement films with the size of 130 mm ×30 mm, and laid one piece on one of the path points P1∼ P5. Adjust the air pressure in the pneumatic circuit to 0.45 MPa, corresponding to the total compaction force of 275 N. The ambient temperature was kept at 15°C with a relative humidity of (65 ± 2)%.
Control the servo motor of the experimental setup to make the mold move along the guide rails. And when the mold moves to the target path point, stop the servo motor and open the pneumatic valve connecting the roller to make the compressed air into the roller. After that, the roller applies a total force of 275 N to the mold, as shown in Figure 9(a). Then, the color density around the five path points is obtained, as shown in Figure 9(b). According to the ambient temperature and humidity, choose Curve C in Figure 8(c), then convert the color density into pressure distribution, and the results are shown in Figure 9(c). And the comparison between the theoretical results and experimental results of average pressure along x-axis is shown in Figure 10. (a) Experiment of measuring compaction pressure distribution under segmented roller; (b) color density on pressure measurement films around path points P1∼ P5; (c) experimental results of pressure distribution under segmented roller; (d) manufacturing error of the segmented roller. Comparison between the calculation results and experimental results of average pressure along x-axis.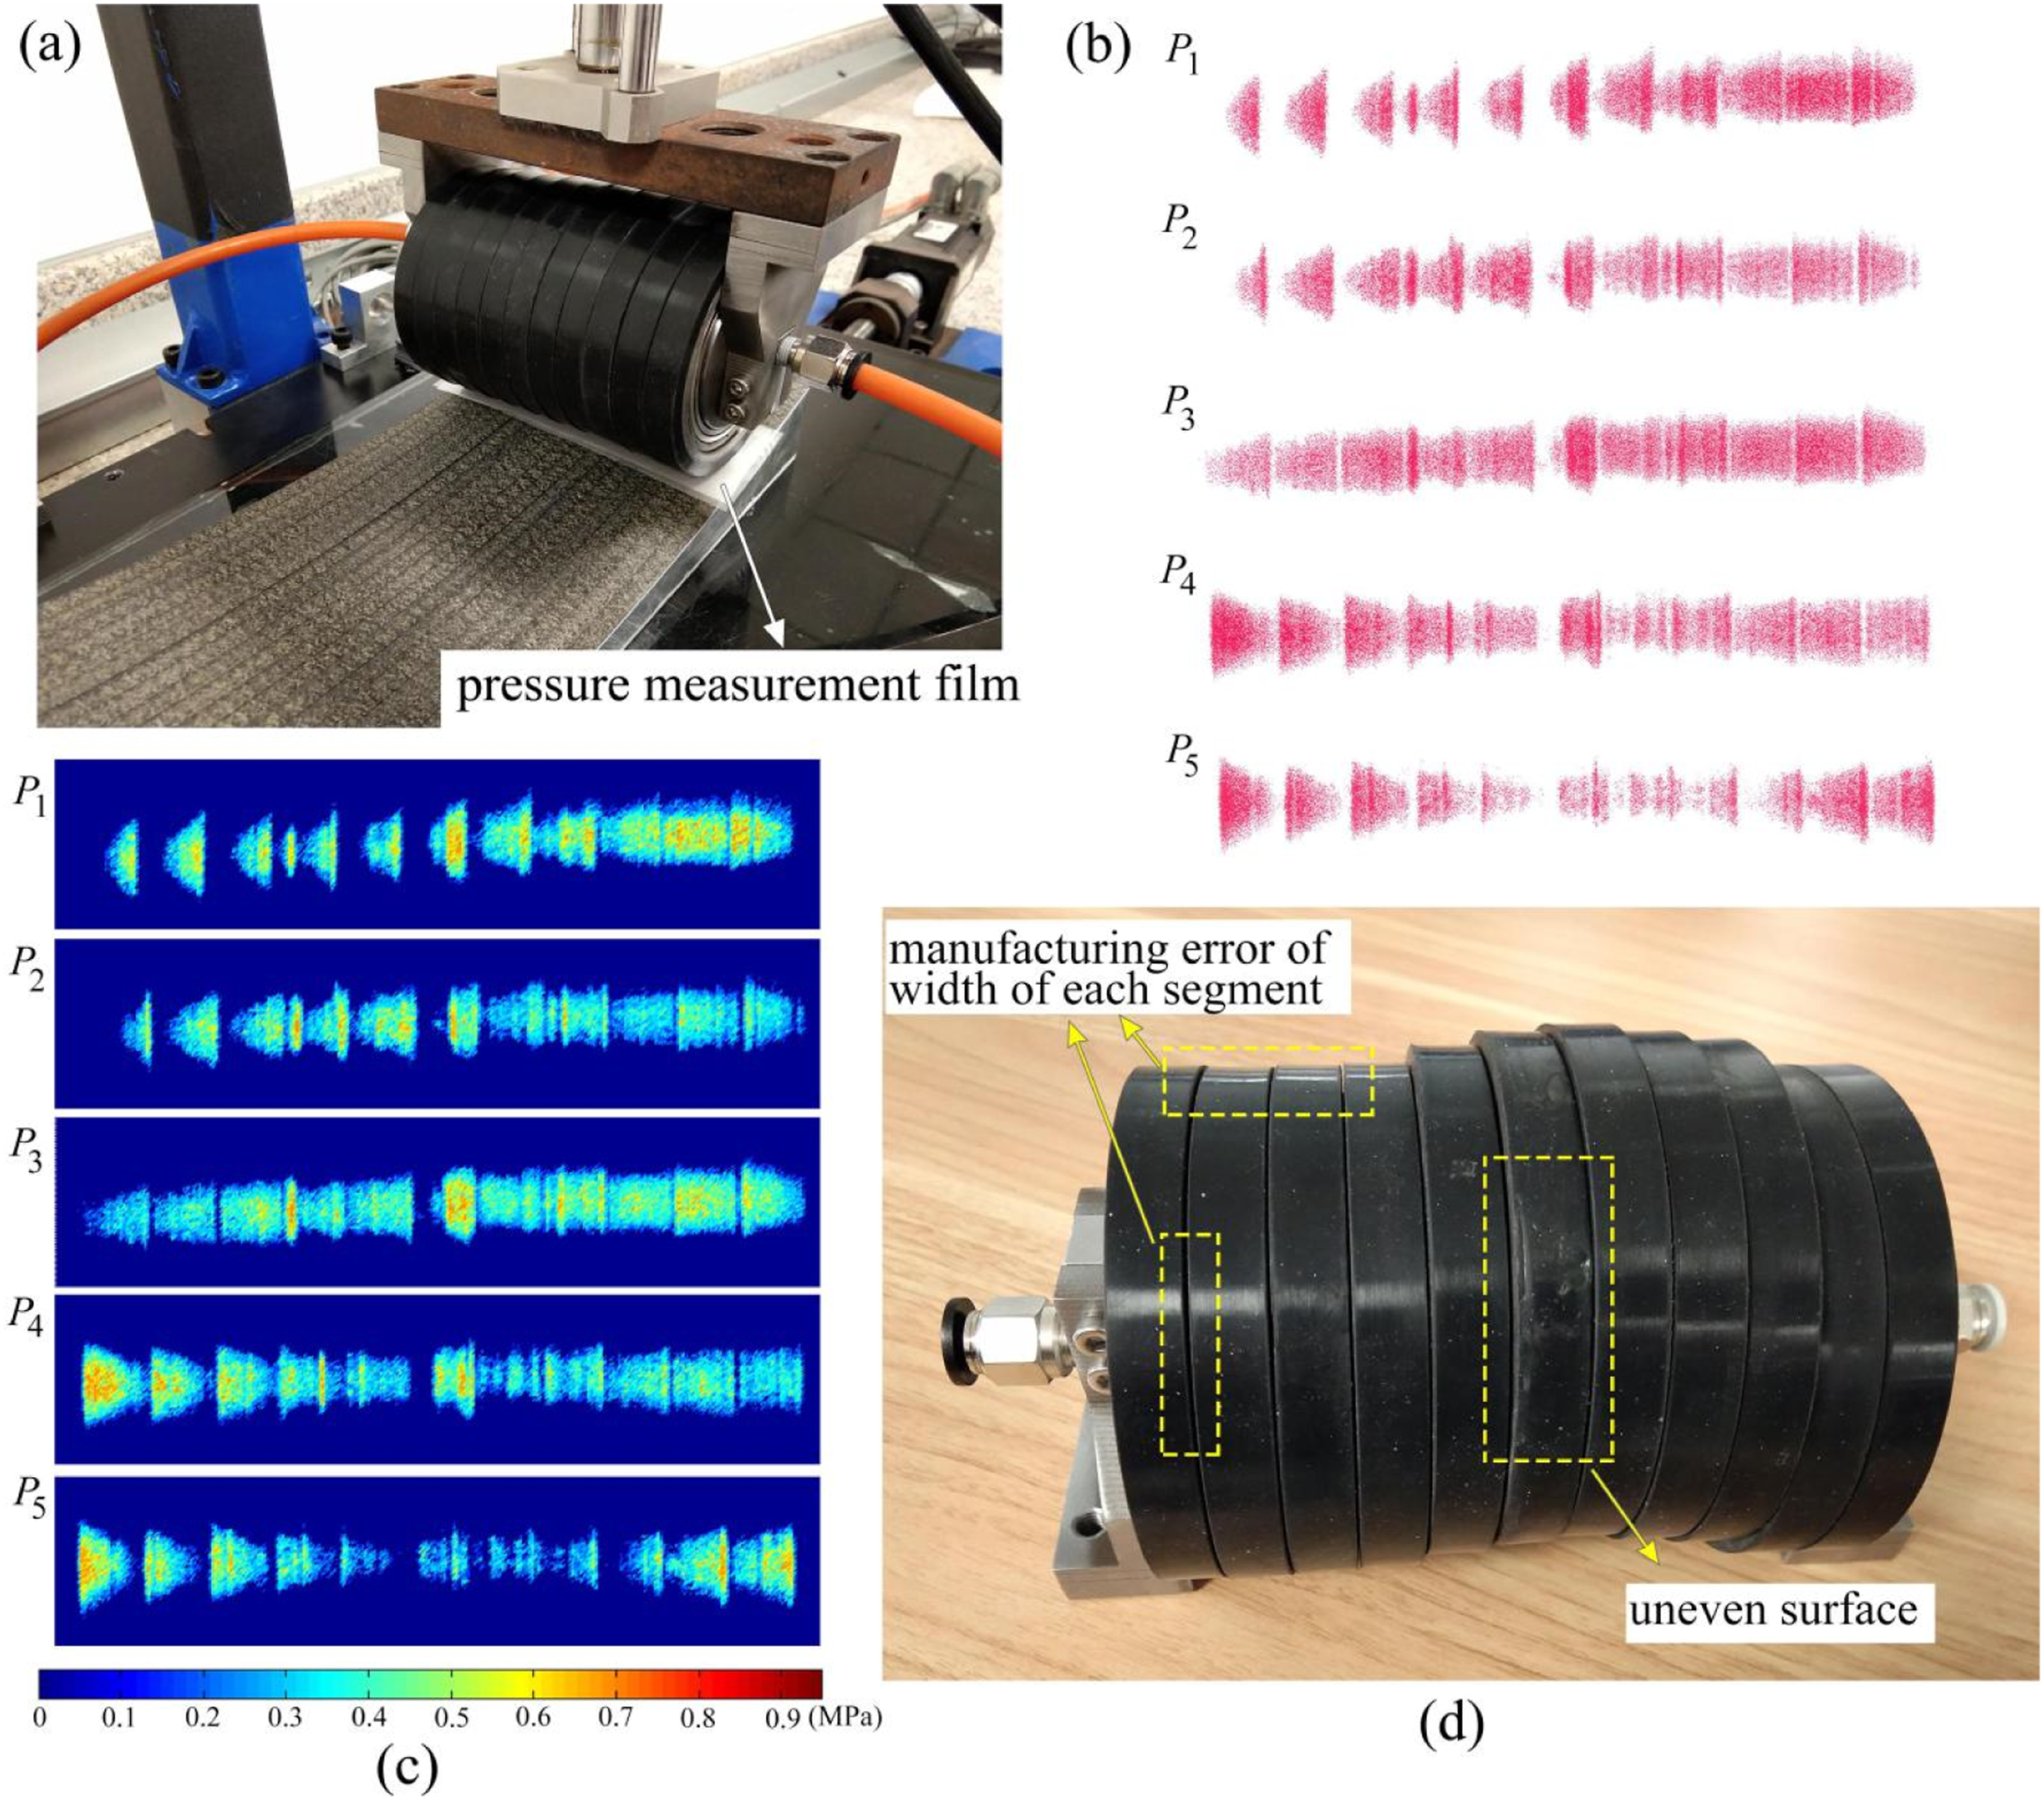
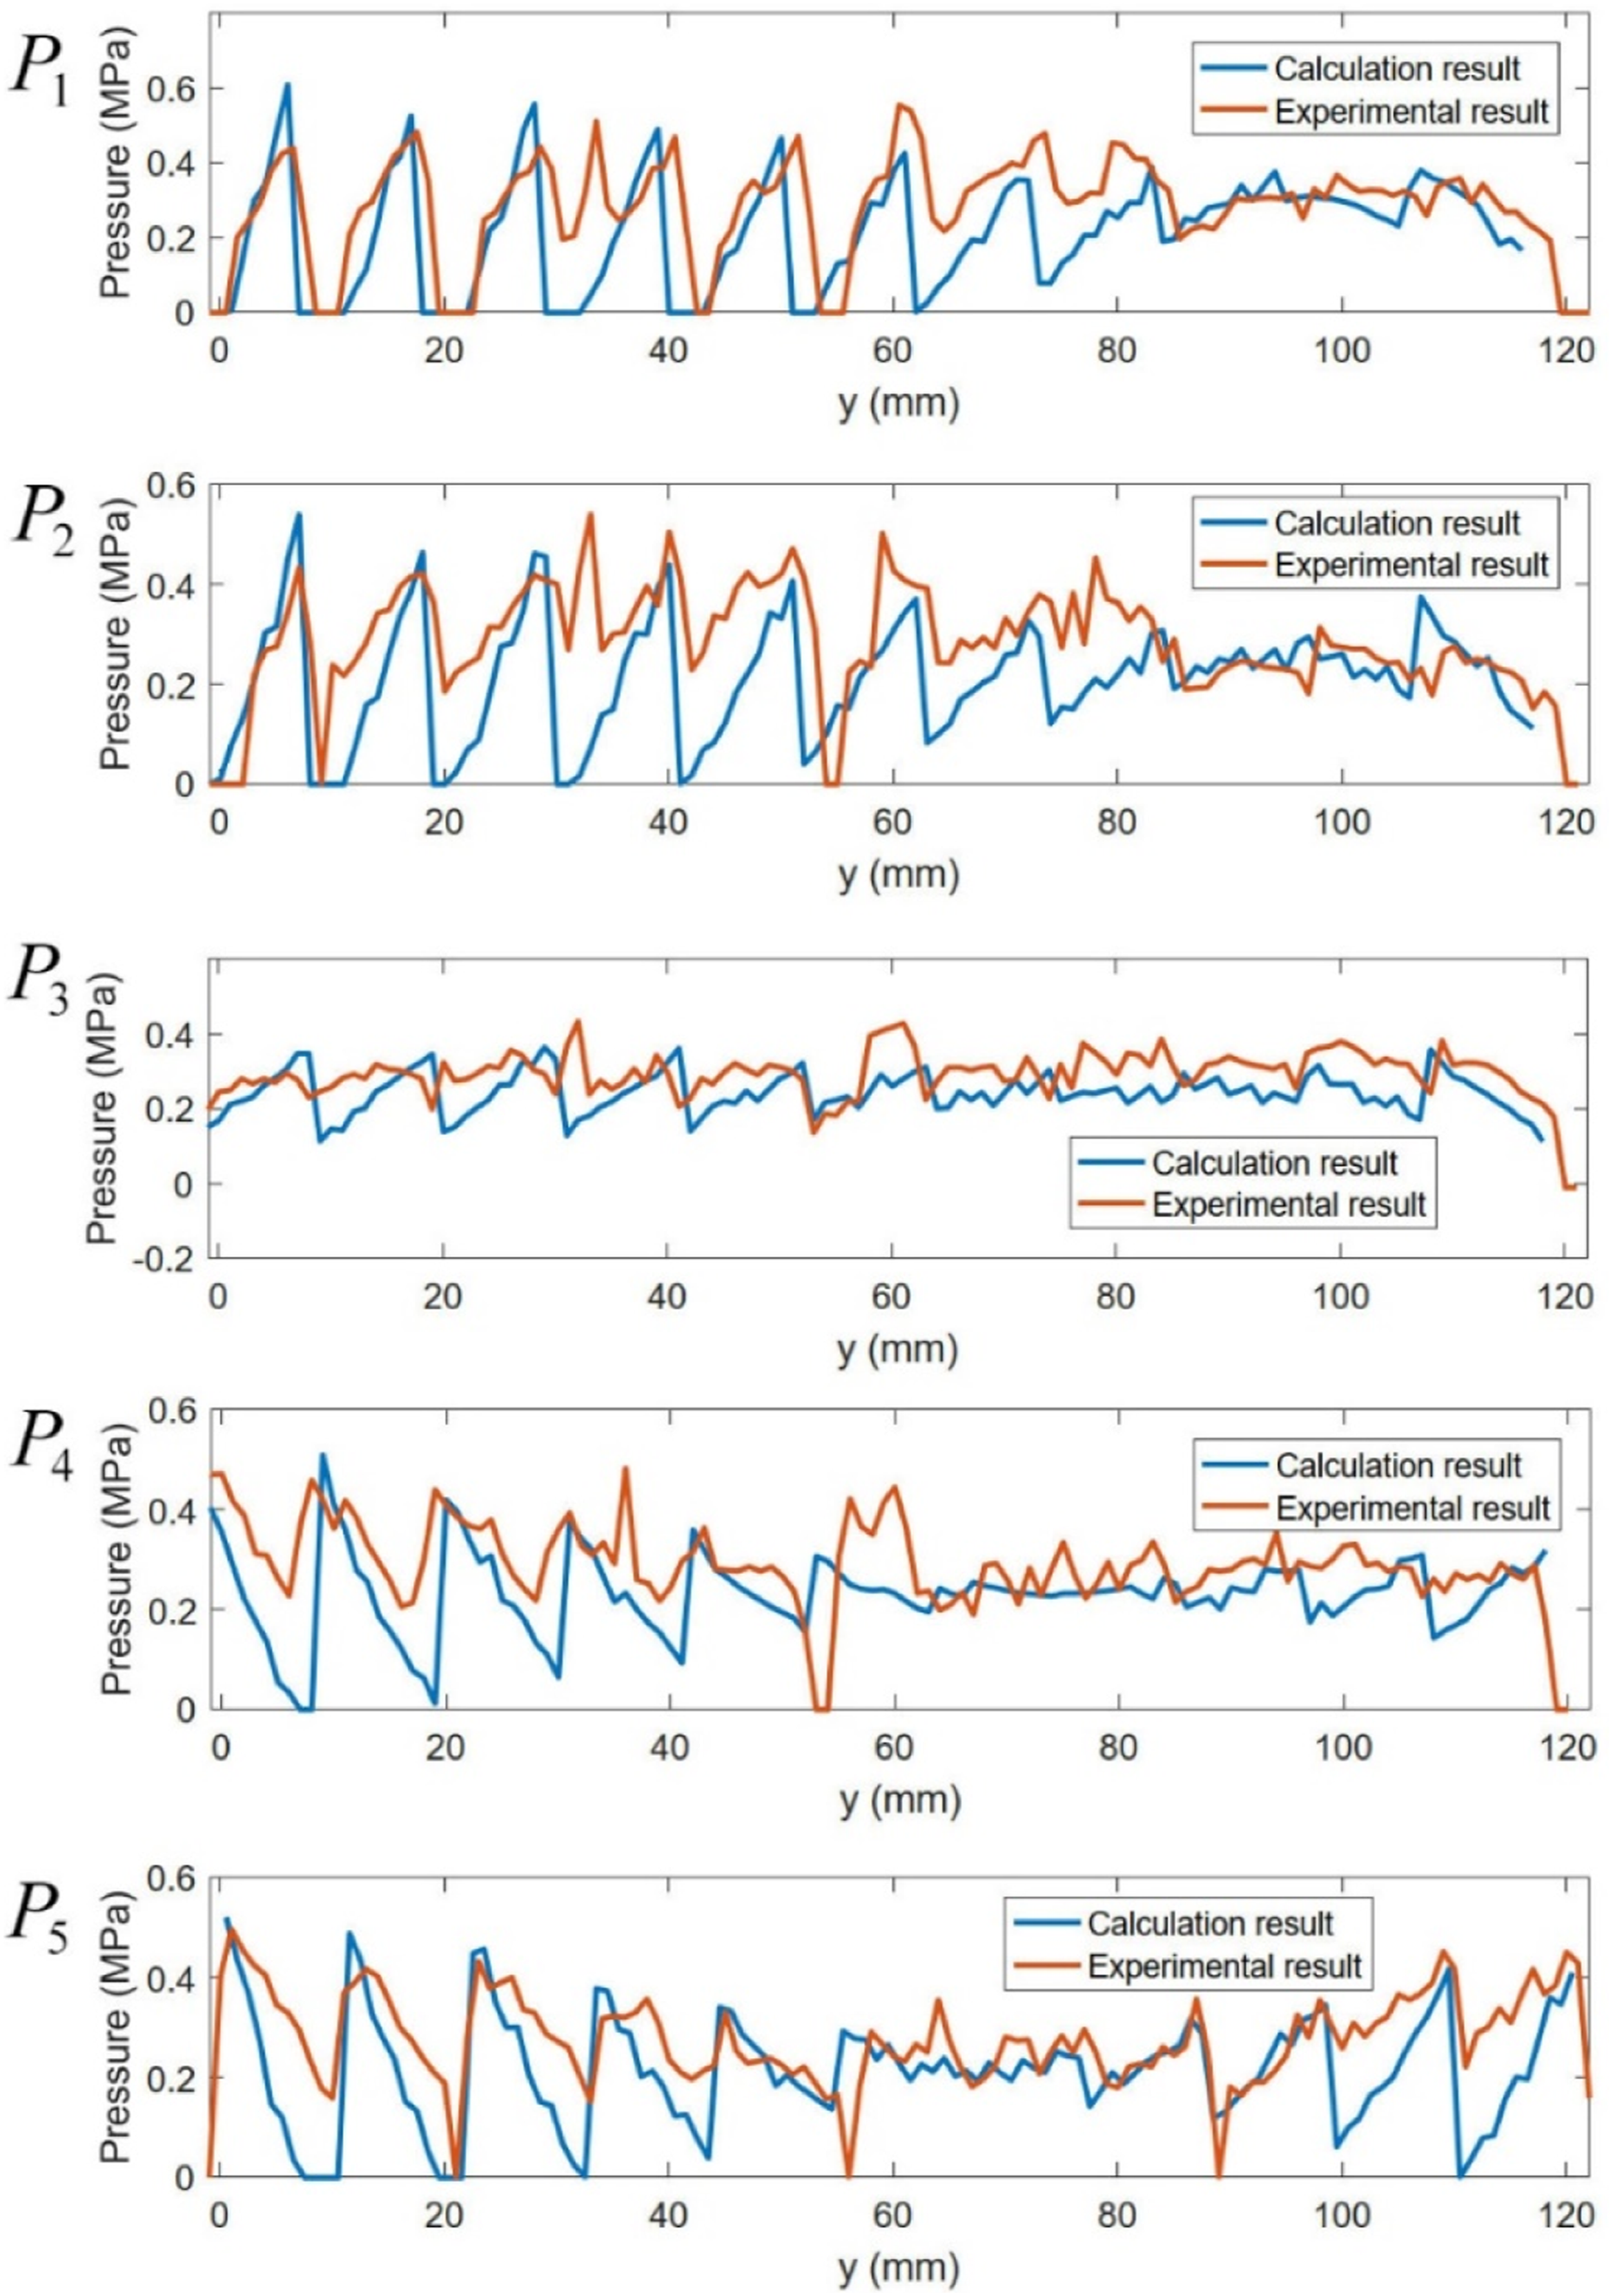
Form Figure 7(a), Figure 9(c) and Figure 10, it can be seen that the theoretical results and experimental results are relatively similar, from the viewpoint of the contact area and pressure distribution. The difference between the two results may be caused by the following reasons. (i) The gaps and overlaps of the prepreg layers cause obvious pressure fluctuations in the experimental results. However, layup defects are ignored in the theoretical model to simplify AFP process. (ii) The outer surface of rubber cover of one segment is uneven, and the segments are not close to each other but have a small gap (see Figure 9(d)), that is, the manufacturing error of the roller leads to less than ideal experimental results. (iii) The pressure measurement film itself has an error of 0.06 MPa.
Considering the above experimental errors, the established model can be considered effective.
Analysis of compaction pressure uniformity
Calculation pressure distribution under common roller
To further understand the characteristics of segmented roller, pressure distribution under common roller is also calculated according to the model proposed by Jiang et al.,
14
and the results are shown in Figure 11(a). The inner radius, outer radius, hardness, and width of the common roller are 21 mm, 42.5 mm, 45 HA, and 126 mm, respectively, and the compaction force is set as 700 N. The reason for choosing 700 N is that the average pressure and maximum pressure of the common roller under 700 N are close to that of the segmented roller under 275 N, and that would be a fair comparison. Similarly, equation (10) is used to calculate the pressure distribution along the whole path, as shown in Figure 11(b). (a) Calculation results of pressure distribution under common roller according to the model proposed in Reference 14; (b) pressure distribution under segmented roller along the whole path l.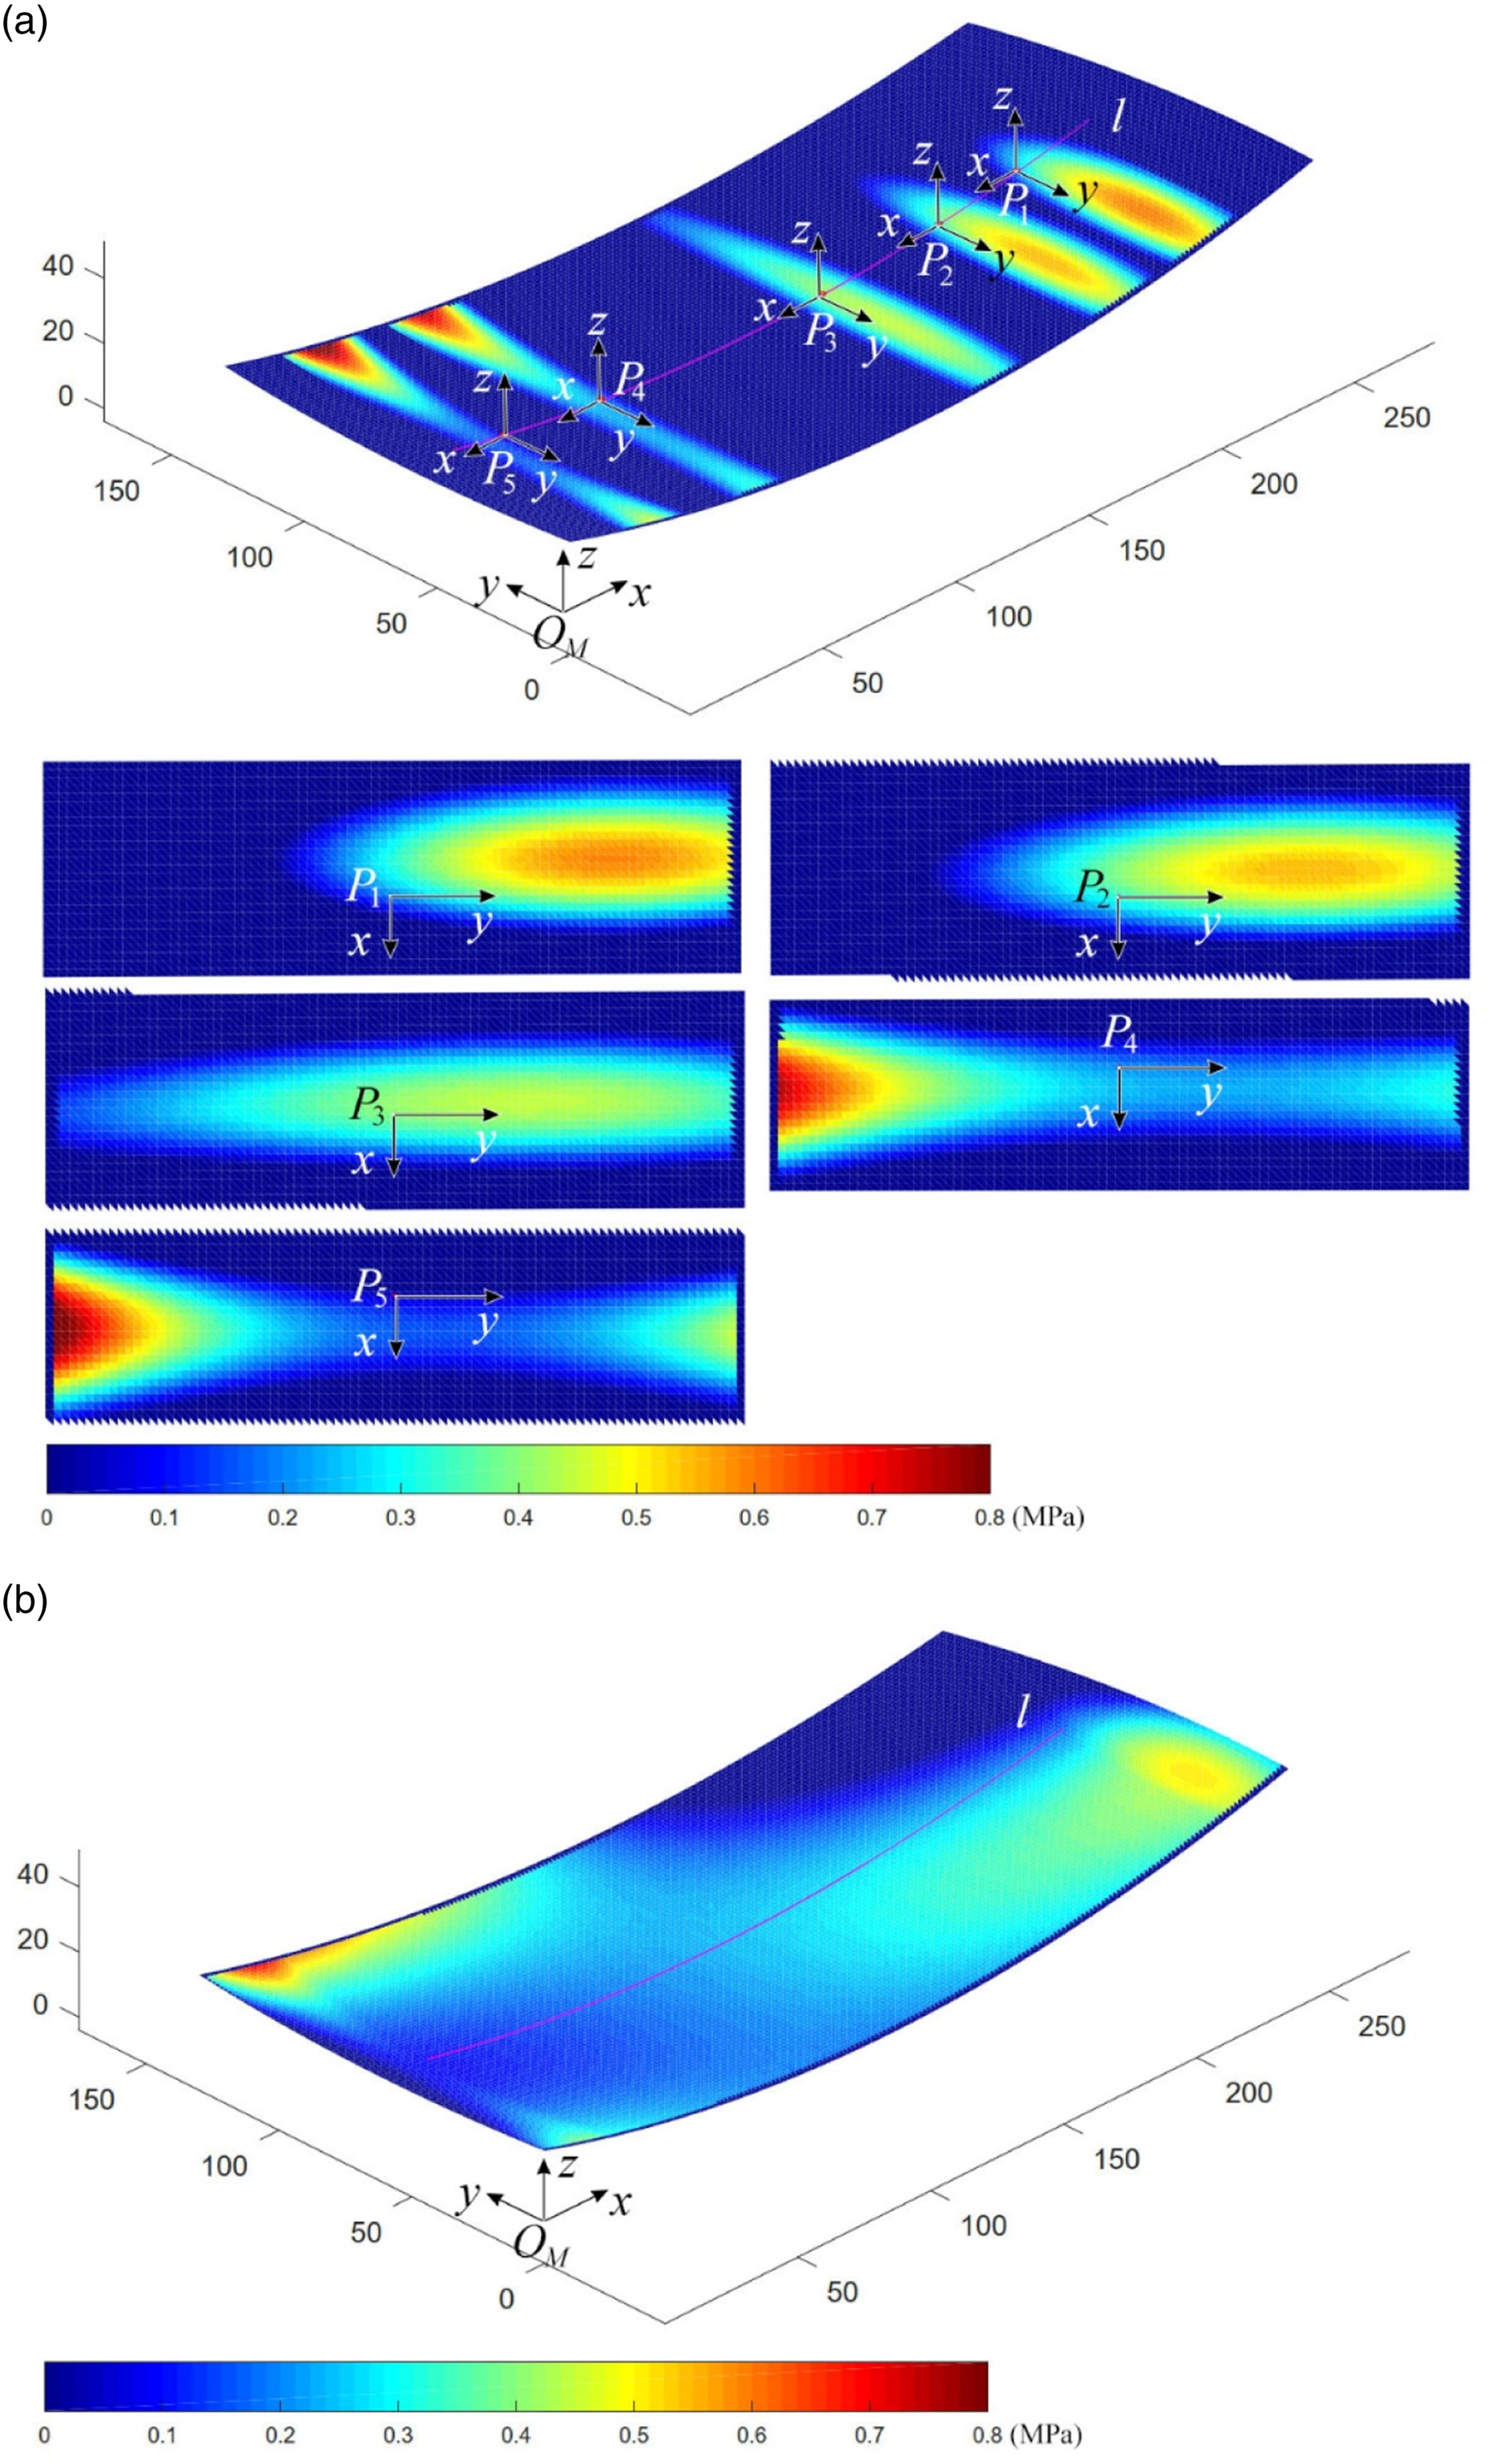
Then, the same experiment was carried out for the common roller, as shown in Figure 12. Comparing Figure 7 and Figure 11, in general, the common roller has a larger contact area along roller radial direction (i.e., path direction), but the pressure distribution along roller axis is not ideal. At point P3, both the two rollers achieve good pressure distribution. However, at P1 and P2, nearly half of the area under the common roller is not subjected to pressure. And at P4 and P5, the pressure in the central area below the roller is very small, as the two points are located in a concave position. This means that in real AFP, the tack levels will be weak at the zones where the compaction pressure is low. And for placement onto surfaces with small curvature radii, it is necessary to reduce the tows number in a single sequence to prevent defects, which will reduce placement efficiency. (a) Experiment of measuring compaction pressure distribution under common roller; (b) color density on the pressure measurement films around path points P1∼ P5; (c) experimental results of pressure distribution under common roller.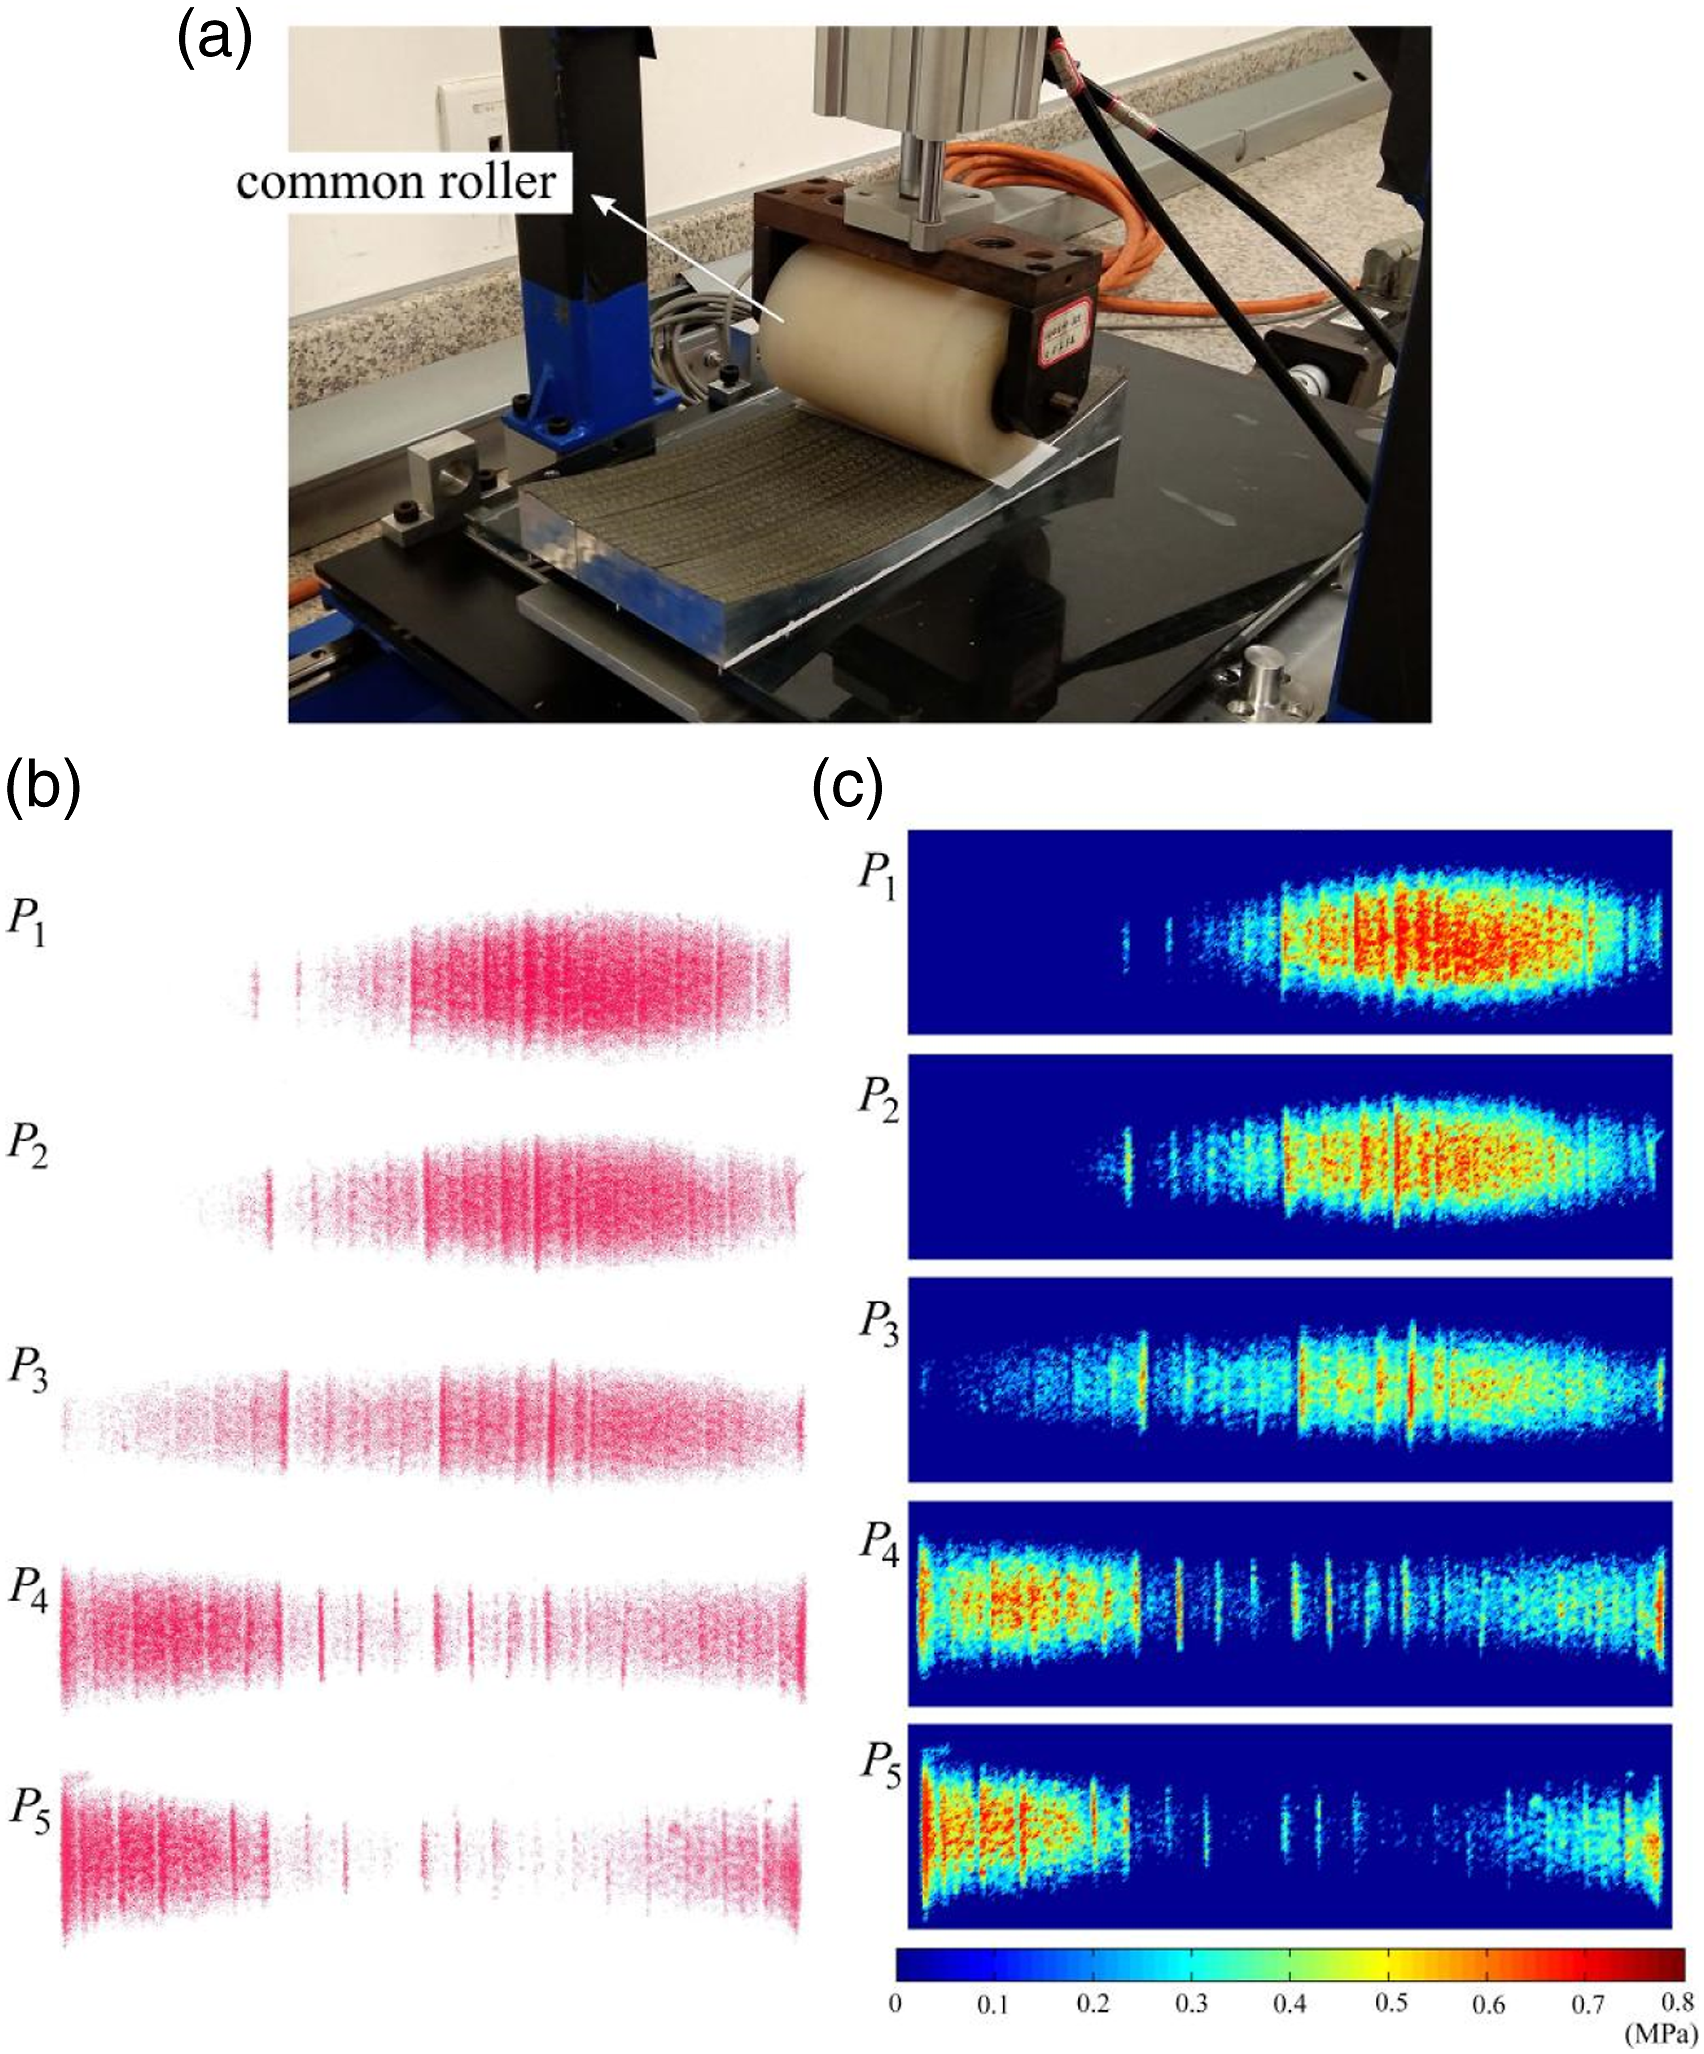
For the segmented roller, even at the large curvature positions of P1, P2, P4, and P5, the pressure along roller axis is evener, which means the pressure difference between different tows is smaller. The main reason for this is that segmented rollers have stronger deformation capacity, and evener pressure distribution can be achieved through the independent move of each segment.
Single-point pressure uniformity usp
The uneven compaction pressure distribution leads to insufficient or even no pressure on some prepreg tows and may further cause undesired layup quality. Therefore, pressure uniformity is proposed to quantify the even degree of the pressure along roller axis. Moreover, the pressure uniformity is divided into two aspects: single-point pressure uniformity usp and whole-path pressure uniformity uwp. usp characterizes the pressure uniformity around each path point, while uwp the pressure uniformity along the whole path.
Considering that there are three possible methods to select data points for calculating single-point pressure uniformity usp, the pressure distribution around point P3 under common roller is taken as an example to illustrate, as shown in Figure 13. The first method is that the data points are selected from the entire contact zone between the roller and the layers (Figure 13(a)), the second are selected from a straight line directly below the roller axis (Figure 13(b)). And the third are taken from the maximum pressure in each roller radial section and these points will form a curve (Figure 13(c)). Three methods to select data points for calculating single-point pressure uniformity: (a) select from the entire contact zone; (b) select from a straight line below the roller axis; (c) select from the maximum pressure in each roller radial section.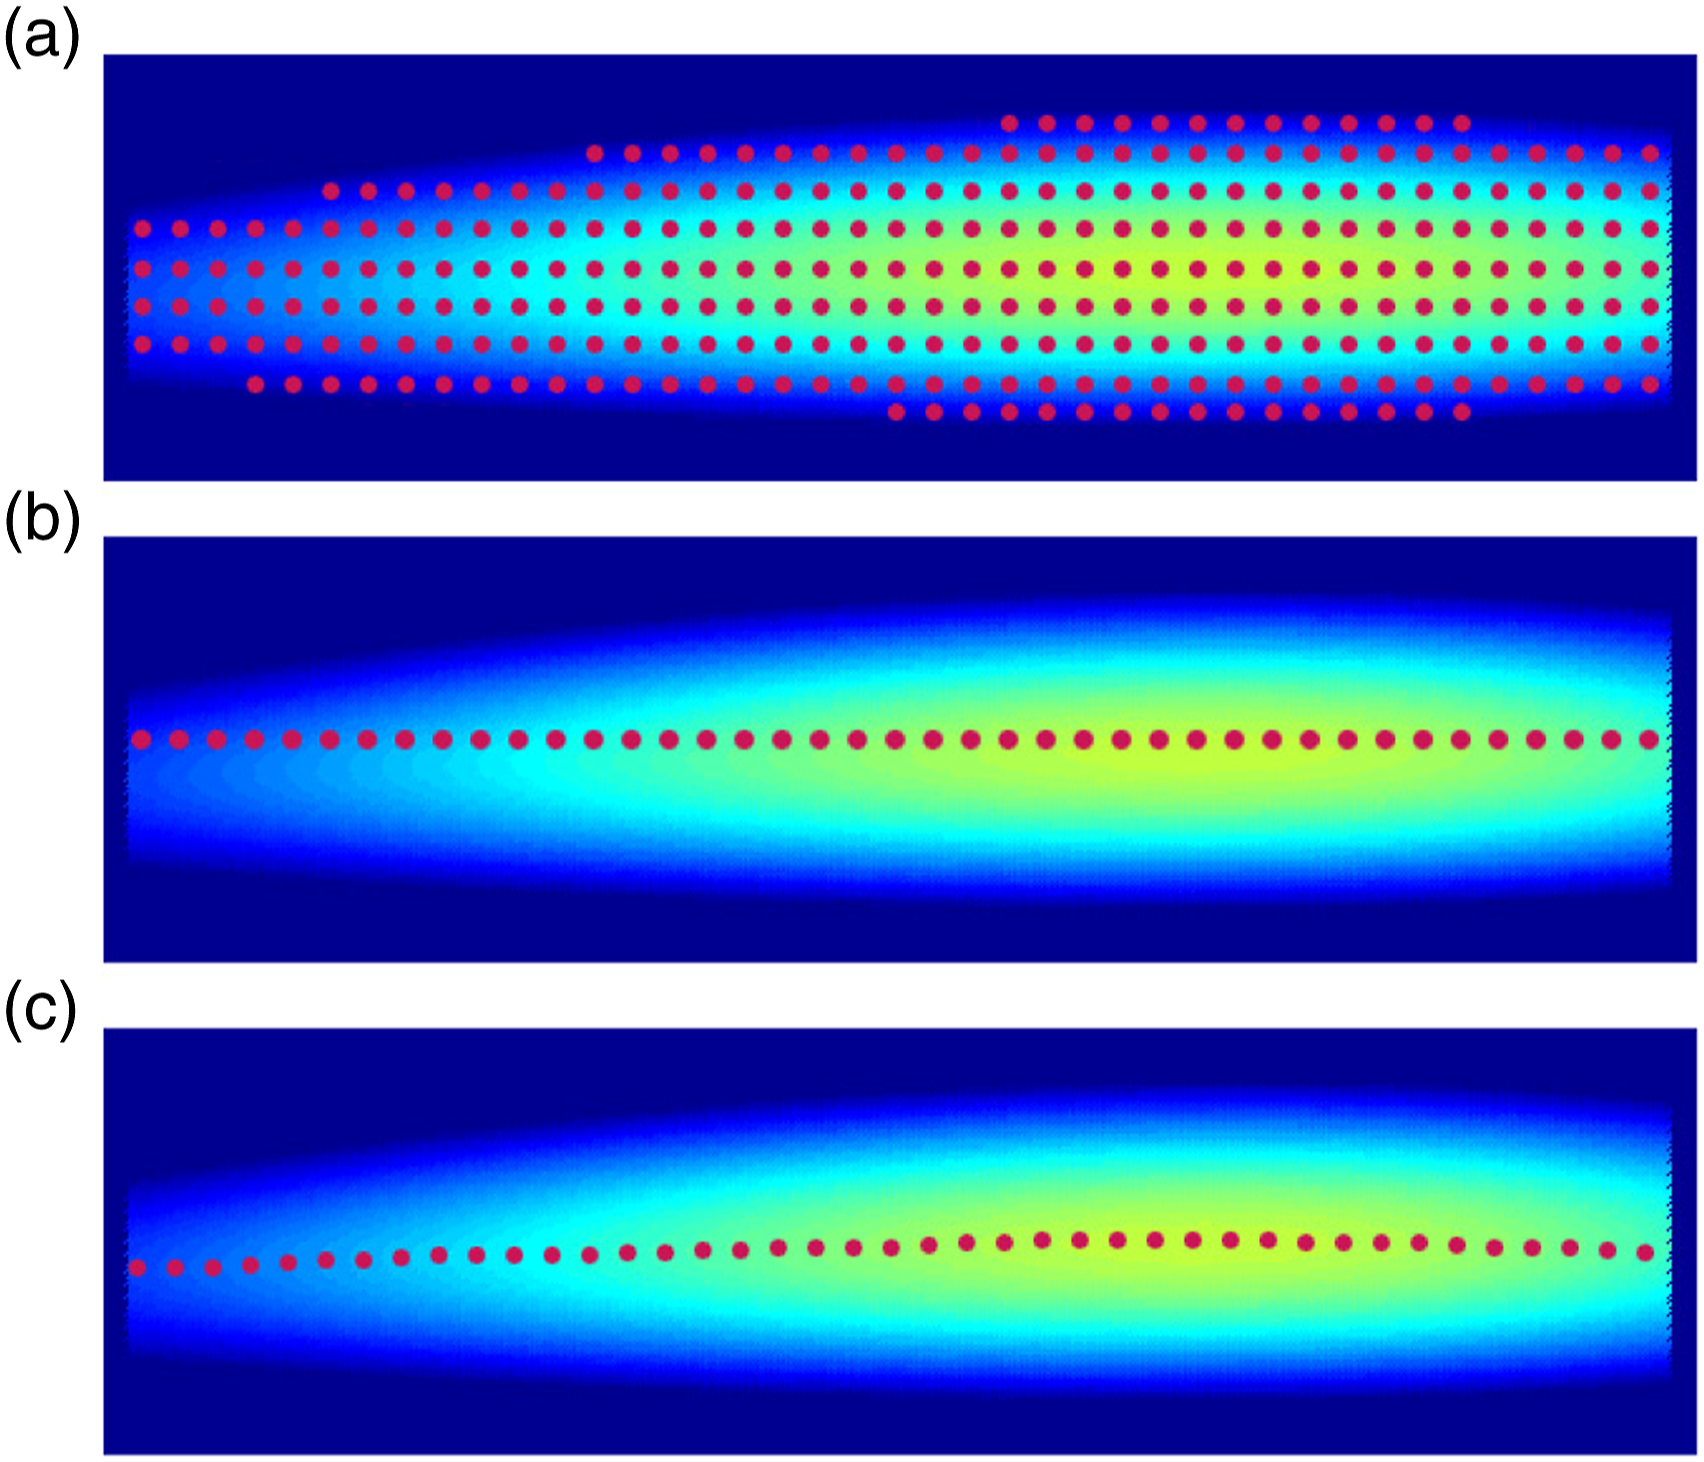
As compaction roller keeps moving along predefined paths in AFP, the pressure distribution in roller axial direction is much more important than that in roller radial direction (the path direction). On the one hand, the pressure difference in the radial direction will be compensated with the movement of the roller. On the other, pressure distribution along roller axis represents the differences of tack levels between different tows and has a greater effect on layup quality. Moreover, each point of layers undergoes a pressure rise from zero to maximum and back down to zero in AFP process. Therefore, on a comprehensive consideration, the third selection method is the most appropriate way to calculate usp.
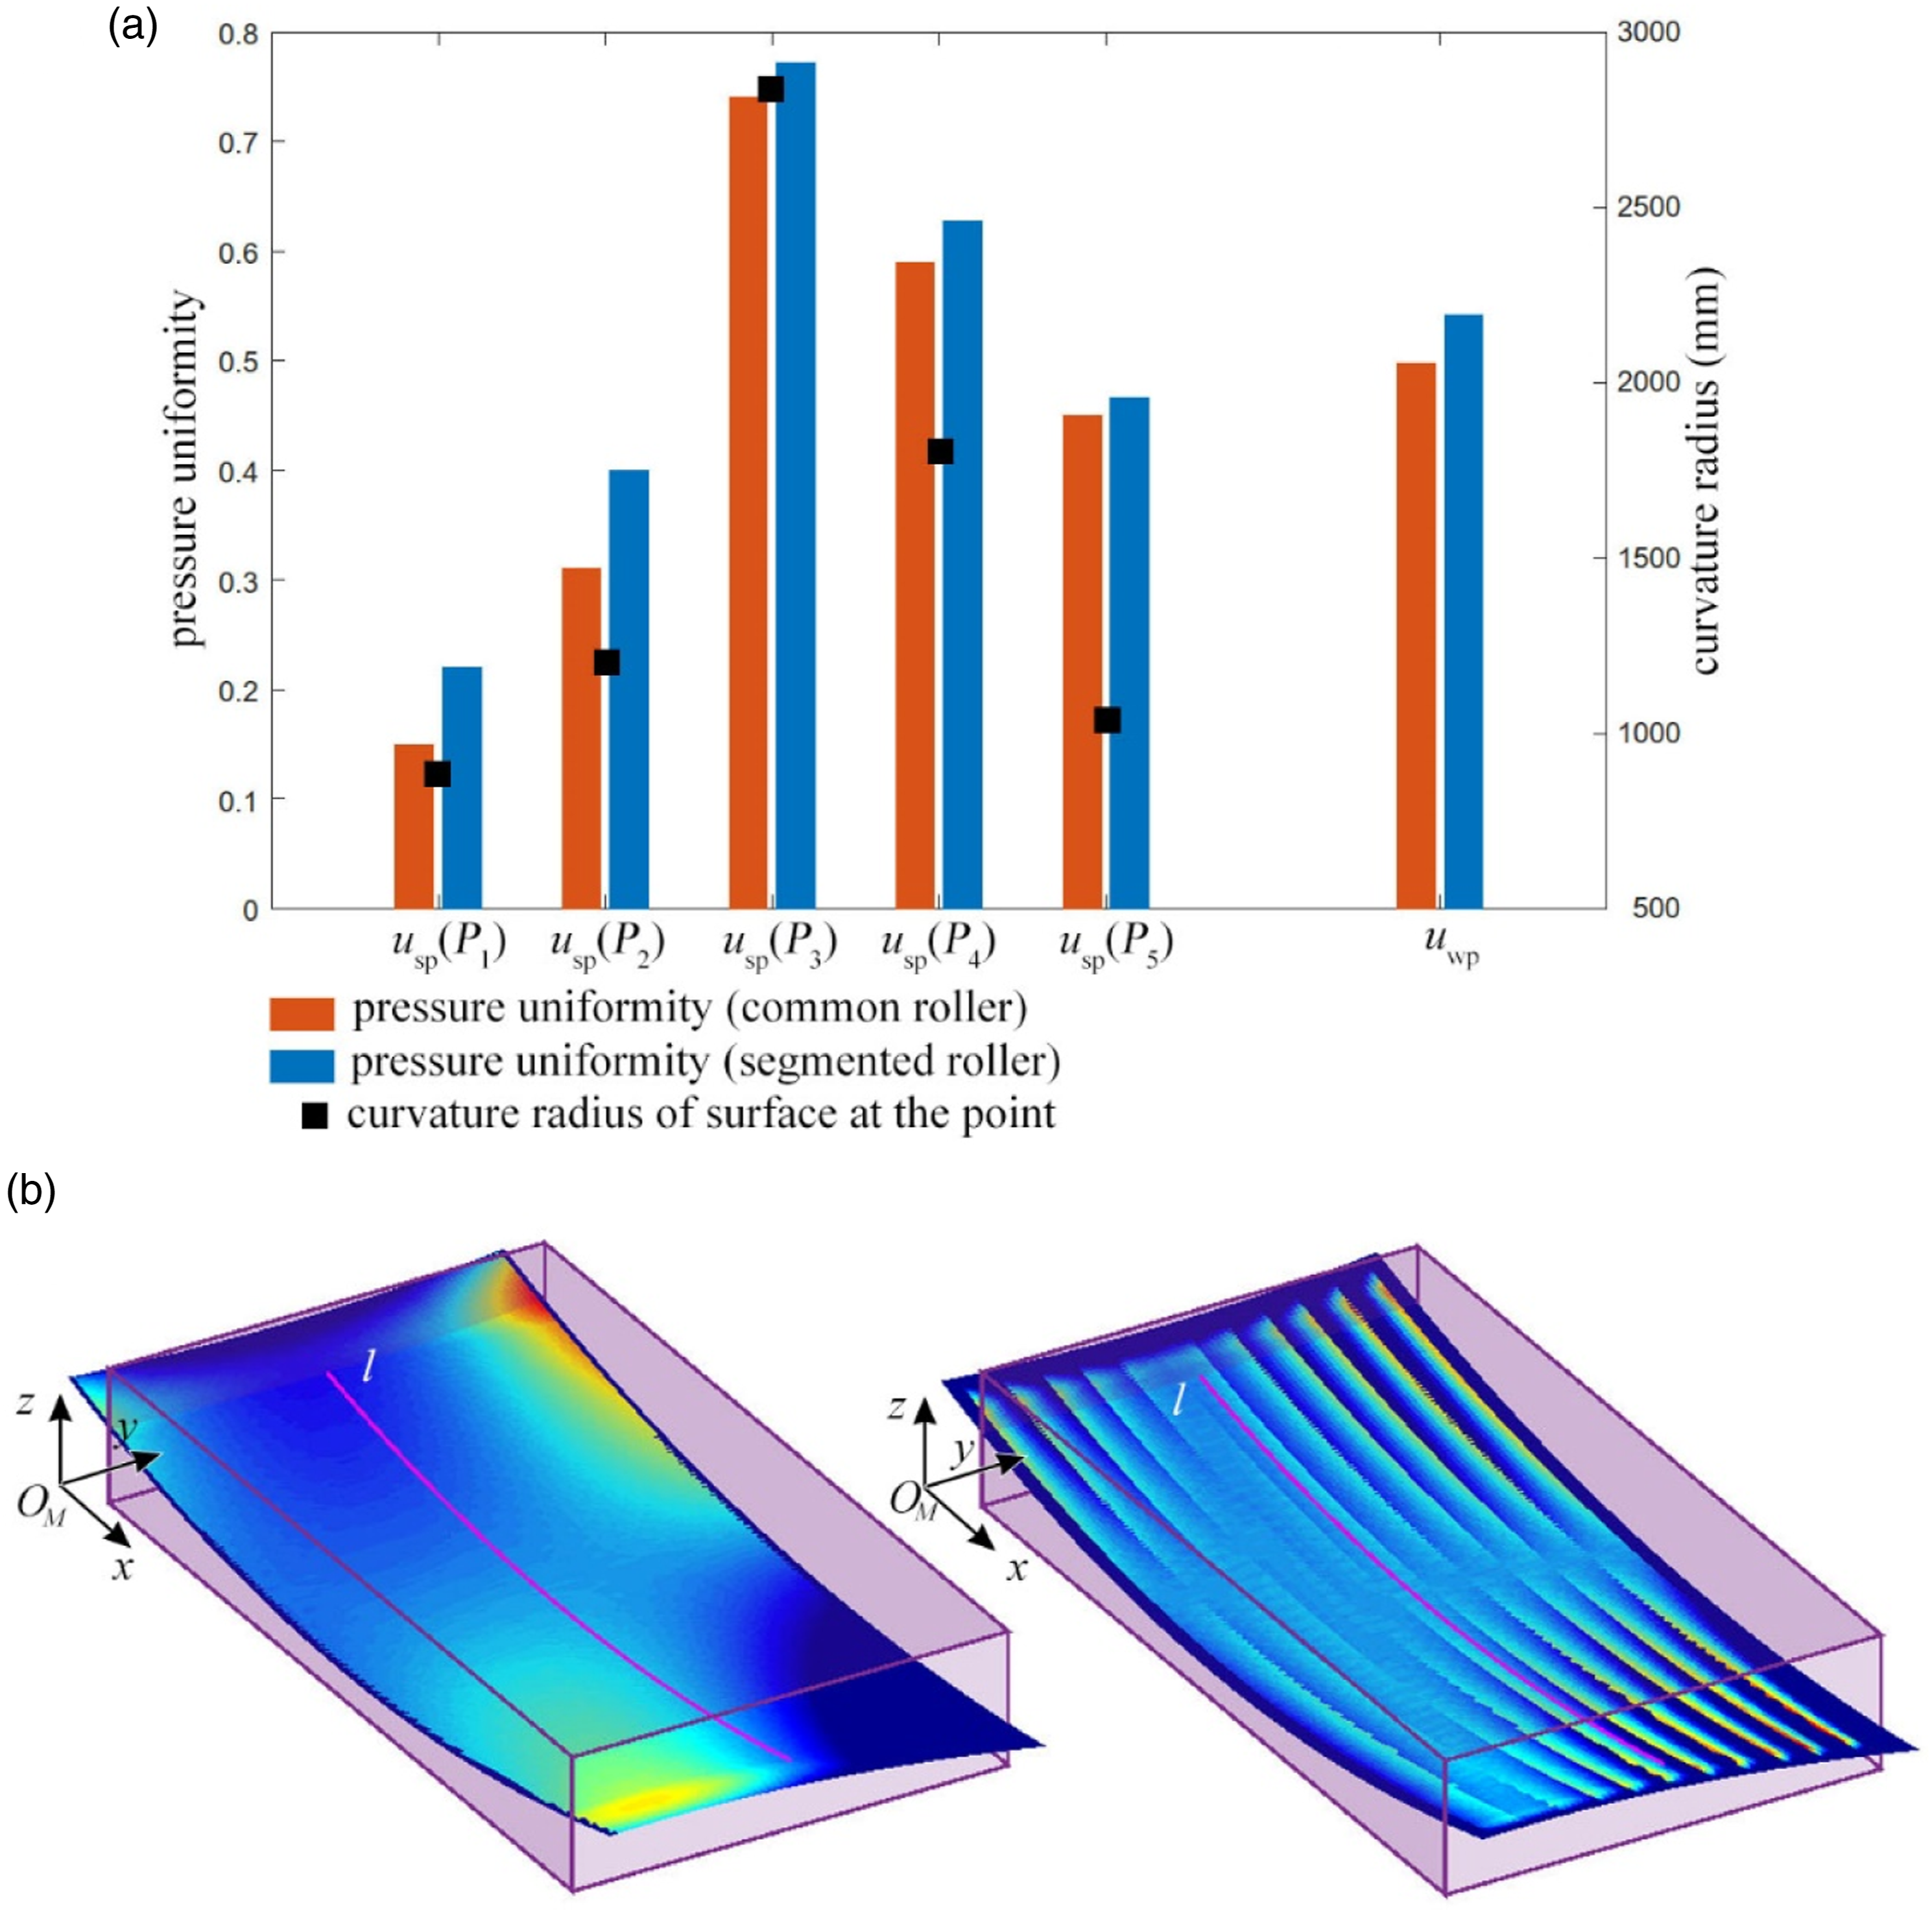
On the basis of the pressure distribution, the maximum pressure pi-max in each roller radial section is extracted, and the standard deviation of all pi-max is used to represent the dispersion degree of pressure distribution. Then, the standard deviation after normalization is subtracted from one to obtain the expression for the single-point pressure uniformity usp within the range of 0–1, as shown in equation (11). The more usp tends 1, the smaller the pressure difference between different tows, which represents the better pressure distribution (a) Single-point pressure uniformity usp and whole-path pressure uniformity uwp of common roller and segmented roller around path points P1∼ P5; (b) The position of the data points used to calculate uwp.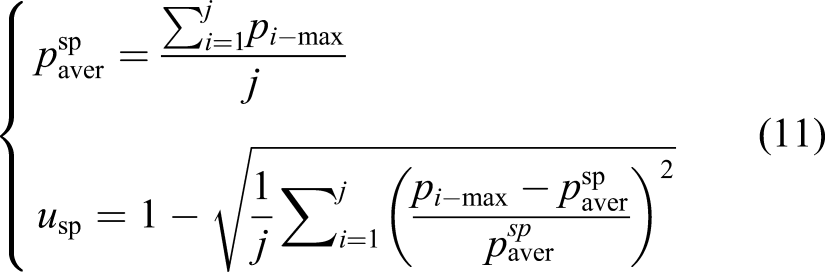
Whole-path pressure uniformity uwp
On the basis of pressure distribution along the whole path, whole-path pressure uniformity uwp is proposed to represent the pressure uniformity along the whole path, as shown in equation (12), where pi-aver is the average pressure on mesh i. The whole-path uniformity is the uniformity across roller width and layup path l at the same time. And as shown in Figure 14(b), the points surrounded by the purple box are used to calculate uwp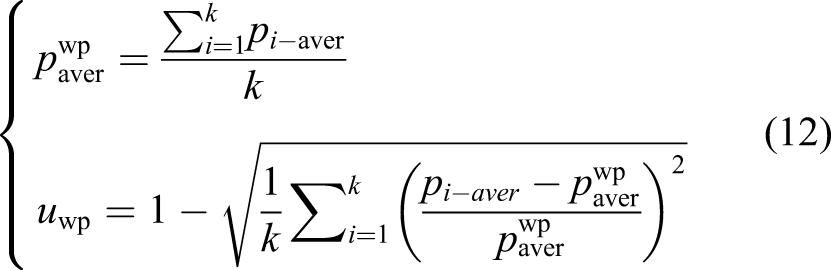
Over the whole path, due to the strong deformation ability of segmented roller, the uwp is higher than that of common roller, but it is not significant. And the usp of segmented roller at point P3, P4 and P5 is also not significantly higher than that of common roller. One reason for this is that the mold surface is still relatively simple, and the advantages of segmented rollers can be better highlighted for layup onto complex surfaces. And another reason is that the segmented roller still needs to be optimized. Jiang et al. 12 concluded that decreasing the hardness and increasing the thickness of the cover rubber helps to improve the deformation capacity of common rollers. The hardness and thickness of the rubber cover of the common roller are 45 HA and 21.5 mm, while for that of the segmented roller are 55 HA and 5 mm. Thus, there is still room for further improvement of the structural parameters of the segmented roller.
Additional placement experiment
The pressure uniformity of the common roller at P1 and P2 is relatively low, and nearly half of the area under the roller is not subjected to pressure. And at P4 and P5, the pressure in the central area below the roller is very small. These above problems may lead to layup defects. In order to investigate the application value of the compaction pressure analysis, 3-tows placement experiments were carried out using the common roller and the segmented roller, as shown in Figure 15(a). The tow’s tension is provided by weights at the end of each tow with a mass of 0.2 kg, corresponding to a tension of 2 N. The placement temperature is provided by a heater, maintained at 35°C, and the placement speed is kept at 15 mm/s. The compaction force is 275 N for the segmented roller and 700 N for the common roller. In addition, the ambient temperature was kept at 15°C with a relative humidity of (65 ± 2)%. (a) Additional 3-tows placement experiment; (b) wrinkles appeared after the placement of segmented roller; (c) bridging appeared after the placement of common roller.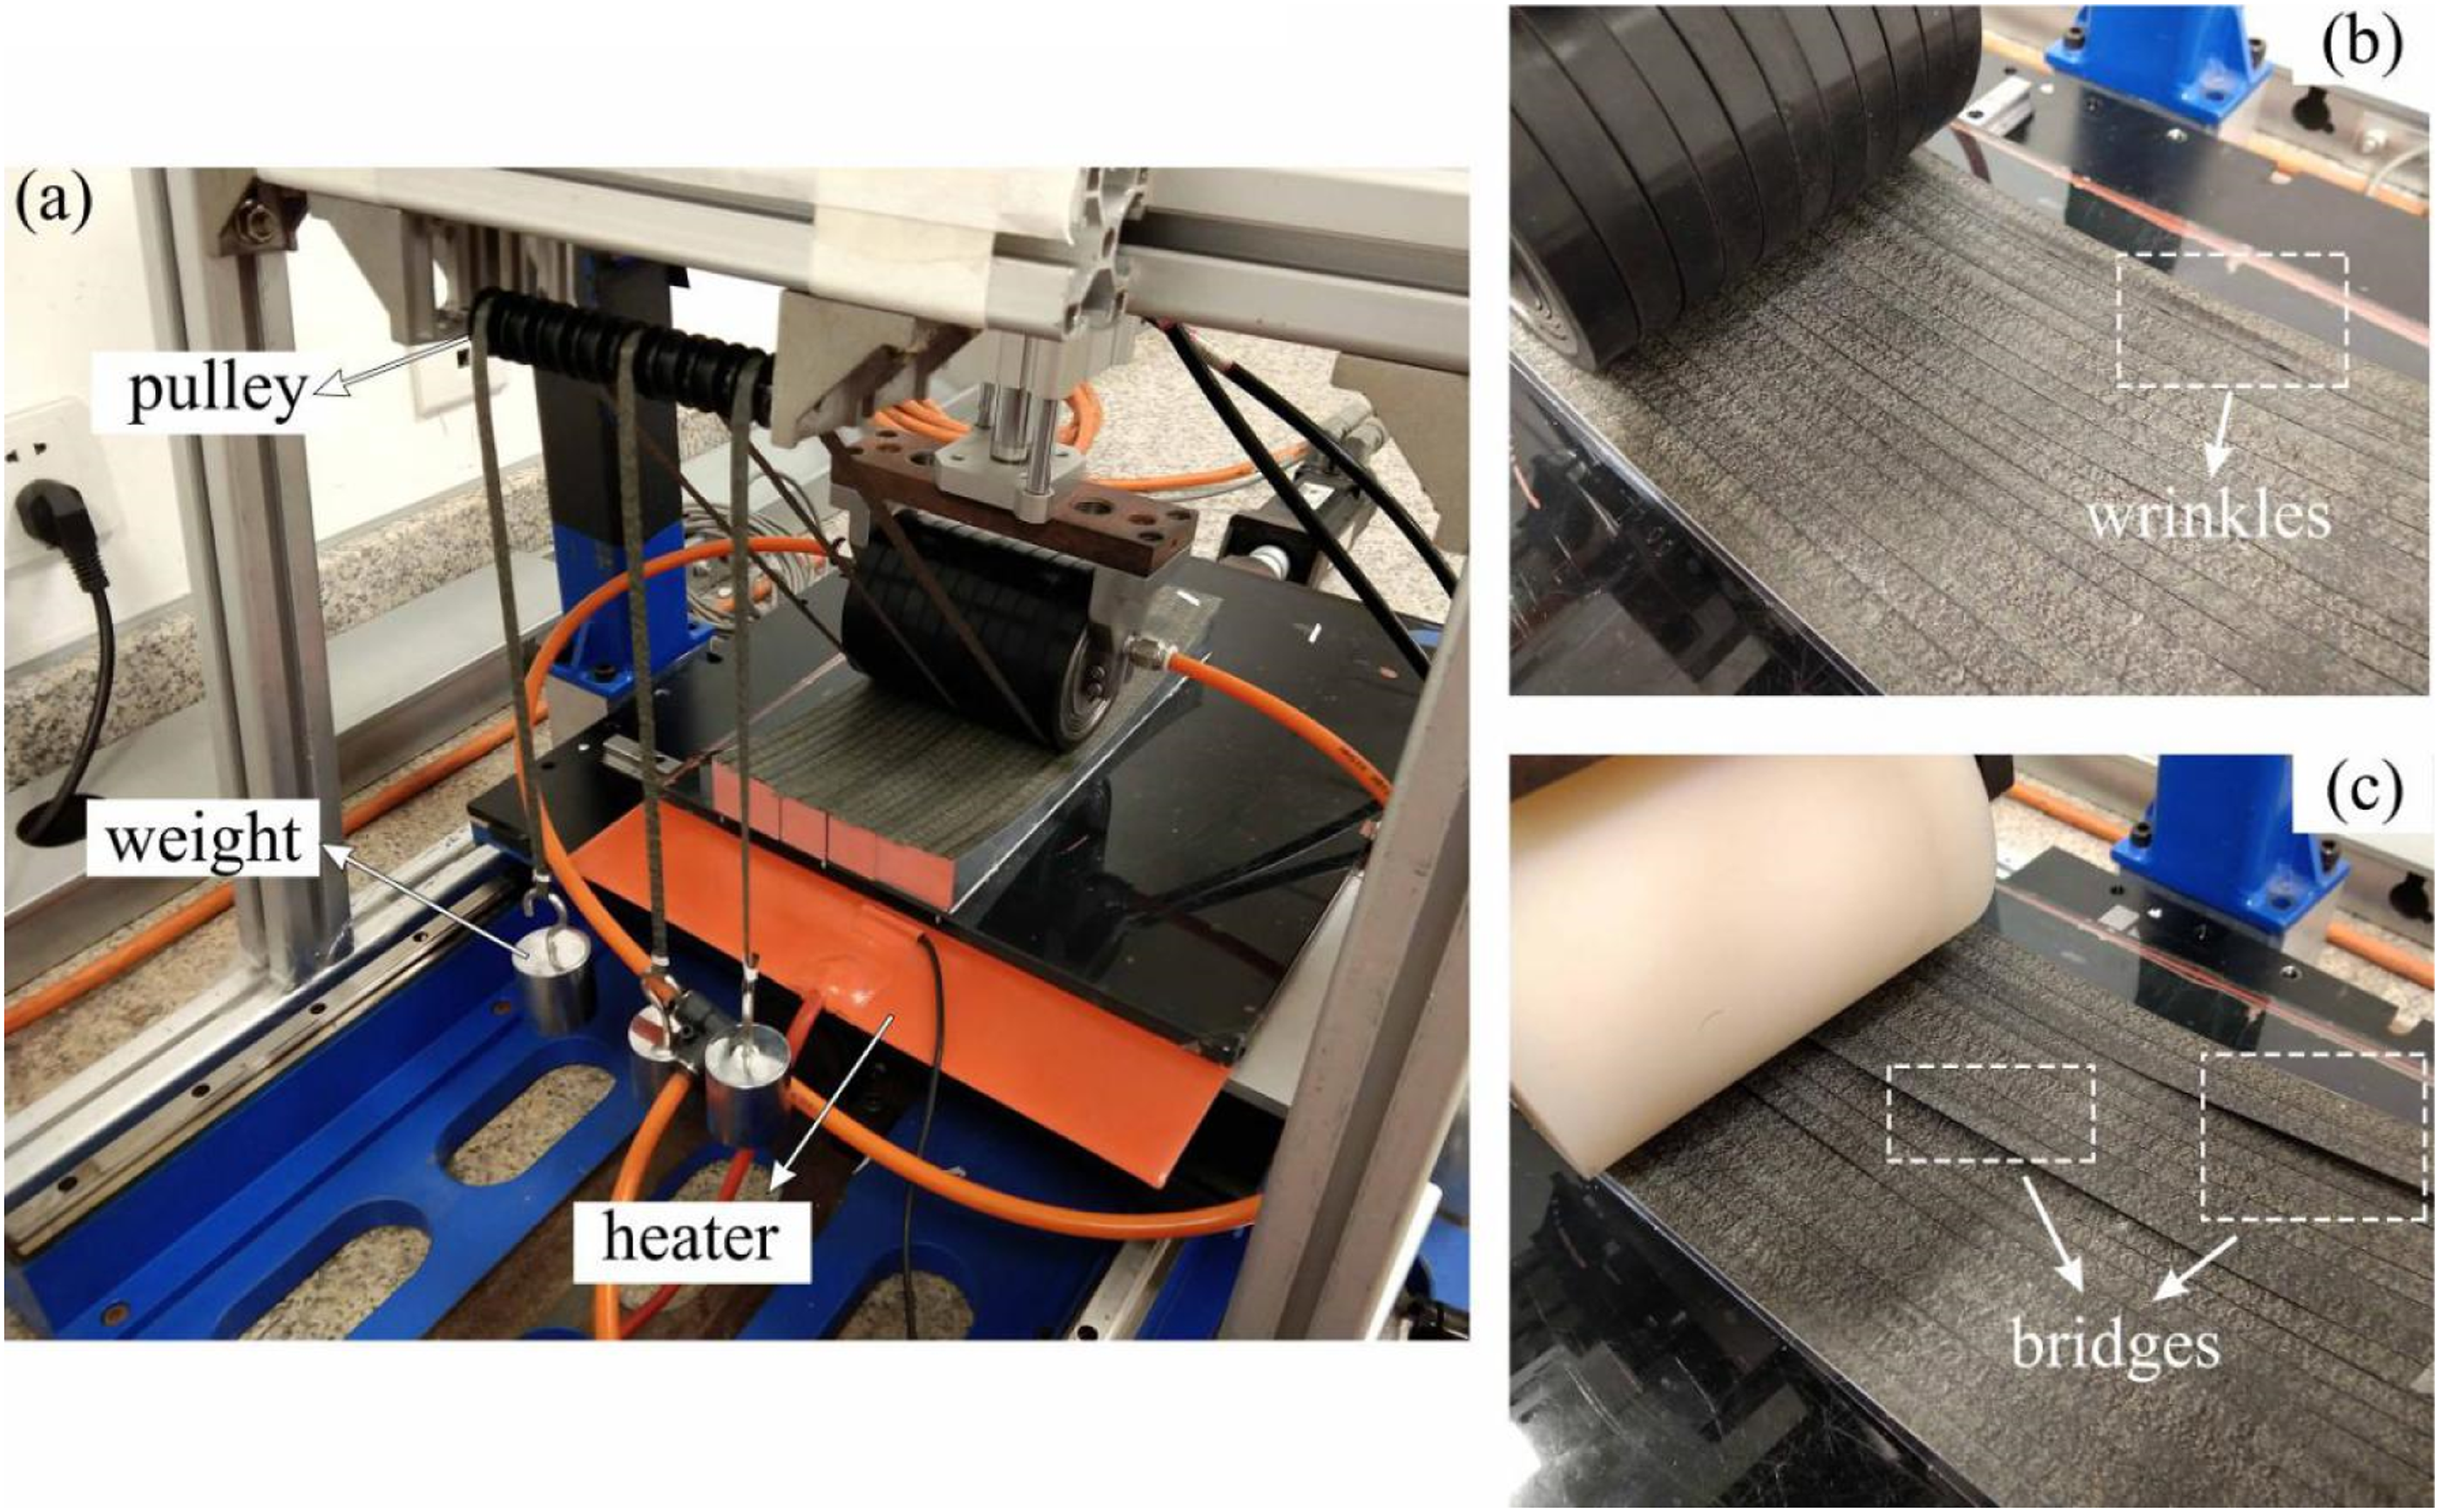
The results are shown in Figure 15(b) and (c). For the segmented roller, there are still some wrinkles around path points of P1 and P2, as some areas are not subjected to pressure. And for the common roller, obvious bridging appeared due to weak tack level. For these two rollers, the process parameters are almost the same except for the pressure distribution; thus, it can be concluded that the difference of layup quality is mainly caused by the difference of pressure distribution.
Conclusion
In this paper, by analyzing the structural characteristics of segmented compaction roller and the contact stress between roller and prepreg layers, the model of compaction pressure distribution under segmented roller for layup onto general surfaces is established. Two unknown parameters in the model are obtained by combining finite element simulation with MATLAB function fitting. Based on the model, pressure distribution around five path points of a curved surface is obtained. Then, the model is validated by the following pressure measurement experiment. In addition, pressure distribution under the segmented roller and the common roller is compared, and the pressure difference of the segmented roller along roller axis is smaller.
Based on the pressure distribution model, single-point pressure uniformity usp and whole-path pressure uniformity uwp are proposed, and the calculation methods of them are given. Then, usp and uwp for both rollers are calculated. Furthermore, additional placement experiment was carried out to understand the practical value of the established model. In general, the pressure uniformity of the segmented roller is higher than that of the common roller, especially for the mold with large curvature surface. And higher pressure uniformity is beneficial to achieve better layup quality.
The pressure distribution model and the pressure uniformity proposed in this paper provide a basis for analyzing the layup quality from the perspective of compaction pressure distribution. Future work need to be done to optimize the structural parameters of segmented rollers, as well as model layup defects such as wrinkles and bridging based on the obtained compaction pressure.
Footnotes
Declaration of conflicting interests
The author(s) declared no potential conflicts of interest with respect to the research, authorship, and/or publication of this article.
Funding
The author(s) received no financial support for the research, authorship, and/or publication of this article.