
Abstract
Prestressed fit is a new type of composite and metal connection. Compared with the traditional connection, it has the advantages of maintaining fiber continuity, high controllability, and high stability. According to the analytical model, the important parameters of the prestressed joint such as friction coefficient, lap length and winding tension are proposed. The influence of the parameters on the joint performance and stress distribution is studied by the finite element method. The abnormal end phenomenon, the stress relaxation phenomenon, and the stress mutation phenomenon caused by demolding during the joint forming process are explained, and the design of the layering method is optimized. The results show that the end effect makes the relationship between the lap length and the peak torque of the joint nonlinear, and increasing the lap length is beneficial to reduce this effect; before and after demolding, the end stress increases sharply; reducing the winding tension and selecting high modulus core mold materials are conducive to reducing stress relaxation; 90°inner ply angle and ± 45°outer ply angle are ideal layup methods for joint composite materials.
Introduction
Fiber-reinforced polymer matrix composites are being used more and more widely in all aspects of industrial production due to their high performance, lightweight, and strong designability. In recent years, due to the gradual popularity of automobile energy saving and lightweight design, more and more people are focusing on composite materials. Among them, there are many researches on composite drive shafts.1–3
The joints of composite drive shafts will have stress concentration due to geometric features and material discontinuities. Studies have shown that 60%–80% of damage occurs at the joint. At present, most of the composite drive shaft joints are mechanically connected. The mechanical connection has strong reliability and is easy to detect, but it is heavy, prone to serious stress concentration and will damage the fiber continuity.4,5 Glued bonding has small stress concentration and simple operation, but it is difficult to detect and is greatly affected by the environment.6,7 In order to meet different working conditions, new connection methods such as welding are gradually being used. Based on the characteristics of composite drive shafts, this paper studies a new type of connection that is prestressed connection. It is a connection form in which a certain prestress is generated between the composite material and the metal through winding and other methods, and the load is transferred through the friction between the two. This connection method is more stable than glued connection, has more advantages than mechanical connection in reducing stress concentration, and is less affected by the environment. It is a connection method with great potential.
In the prestressed joint forming process, there are mainly two factors that affect the strength of the connection. The first factor is the geometric characteristics of the surface of metal and composite materials, which determine the efficiency of load transfer. The second factor is the final prestress level generated between the composite material and the metal, which determines the amount of transferable load before the joint slides. Since the prestressed joint adopts the winding forming method, there are many researches on the influence of the winding prestress on the final prestress level for reference. Mertiny and Ellyin focused on the effect of winding tension on the physical and mechanical properties of composite pipes. 8 Cohen et al. used the experimental design method to prove that the composite material winding layer, winding tension, winding tension gradient, winding time and their interaction will significantly affect the structural strength, and found the reason: increasing the winding tension will significantly increase the fiber volume ratio in the product, thereby increasing the structural strength.9–11 Xiong et al. applied carbon fiber composite materials to the design of the mortar barrel and found that increasing the winding tension within a certain range can improve the joint performance, while excessive tension will cause damage to the joint. 12 These studies are based on the continuous structure, so they are not completely applicable to the discontinuous structure at the joint of the composite drive shaft. Luo et al. studied the stress distribution characteristics of the thermosetting composite drive shaft joint under the toothed connection 13 ; Lee et al. studied the factors affecting the performance of the drive shaft joint under the press-fit interference connection. 14 Although these involve discontinuous structures, they are not suitable for thermoplastic composites under high prestress. Under high prestress conditions, the stress concentration of joints is more obvious, and stress relaxation has to be taken into consideration.
In this paper, the finite element analysis method is used to explore the influence of surface friction coefficient, lap length, core material, and winding tension on the peak torque, prestress level and stress distribution of the thermoplastic composite material-metal prestressed winding joint. The article explains the abnormal end stress, the abnormal demolding stress and the stress relaxation during the finite element simulation joint forming process, and analyzes their influence on the joint performance. The winding sample is prepared to measure the peak torque and prestress level, which verified the applicability and correctness of the analytical model and finite element analysis.
Analytical model
When the composite material is wound, the core mold can be roughly regarded as a thick-walled cylinder. When a composite material is used to wind a part, the winding tension of the positive winding layer will generate pressure on the wound layers and the core mold to shrink it radially, resulting in changes in the hoop and radial stress of the wound layers. Therefore, the process of directly solving the radial residual stress is complicated. Based on the elastic deformation of anisotropic winding layer and the theory of isotropic lining thick-walled cylinder, Kang Chao et al.
15
gave a model of the radial stress and hoop stress of the winding layer under external pressure. This article refers to this model as the basis of the analytical model. Figure 1 is a schematic diagram of the cross section of the winding model. Cross section of winding model.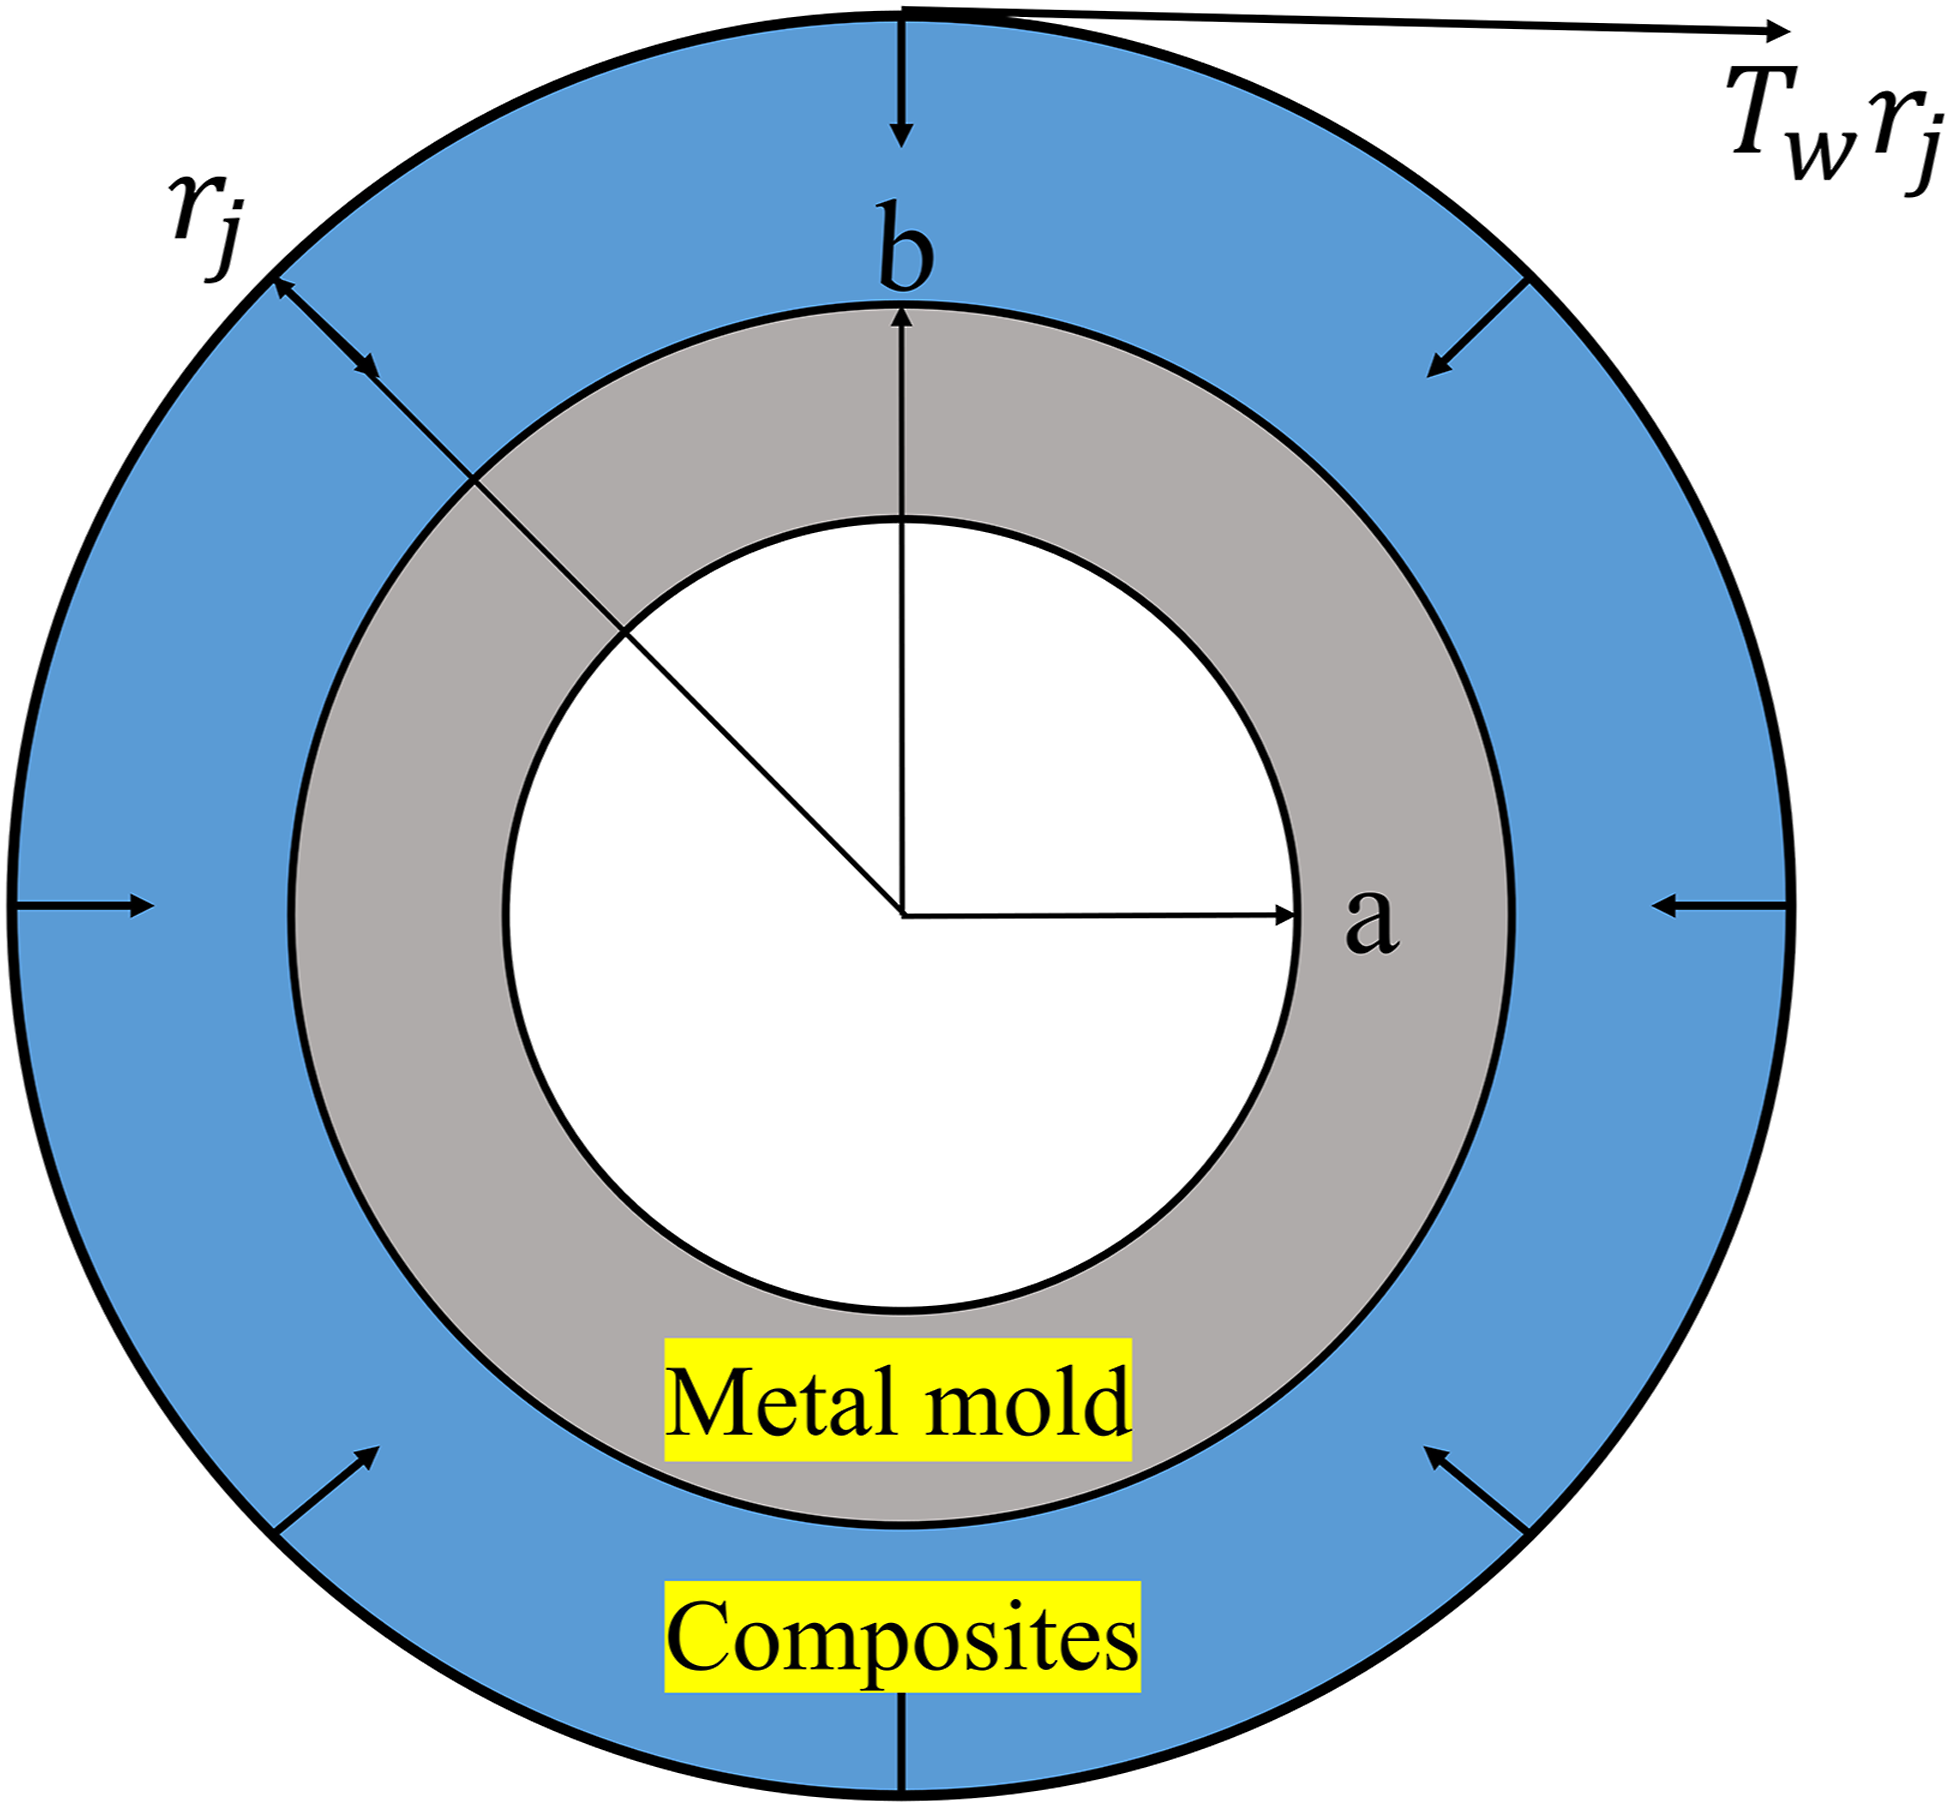
Boundary conditions of the inner and outer walls of the mold

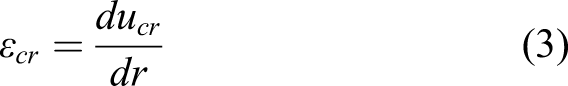
Introduce the radial stiffness of the mandrel and put the boundary conditions into the equation to obtain
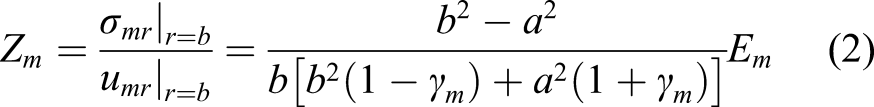
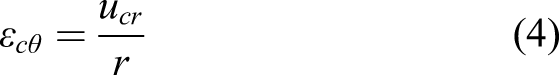
In the case of small deformation, the radial displacement and strain of the composite winding layer satisfy
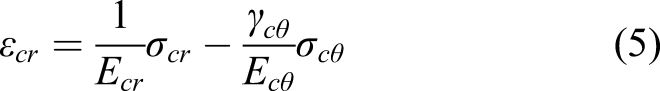
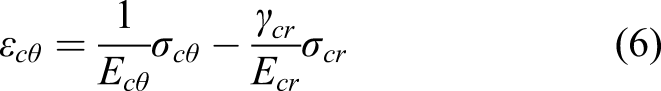
From equations (3) (5) and (7) can be derived
From equations (4) (6) and (8) can be derived
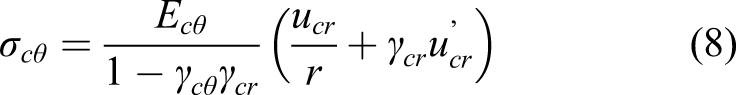
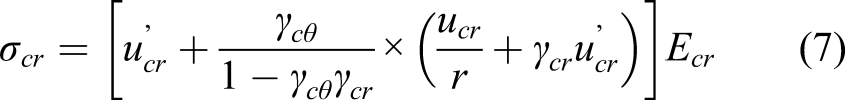
The composite winding layer satisfies the balance equation
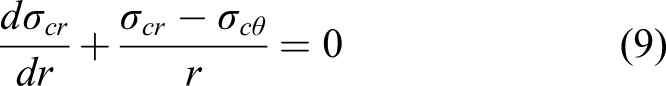
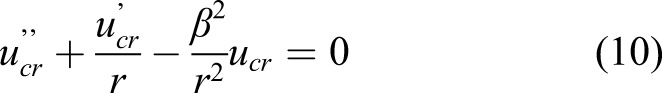
Substitute equations (7) and (8) into equation (9)
Where
Solve equation (10), get a general solution

Where
Substitute equation (11) into equations (7) and (8)


Where,
During the winding process, the outer surface of the core mold closely adheres to the fiber winding layer, and the radial displacement and radial stress on the contact surface meet the continuous condition. The boundary conditions of the inner and outer walls of the winding layer are

The core mold and the winding layer meet the continuous condition at the radius b

From equations (2) and (15), transform equation (14) into


Substitute equations (2) and (12) into equation (16)
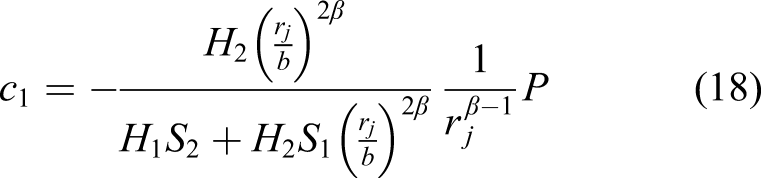
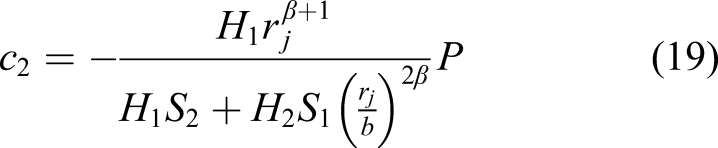
Where,
Substitute equations (18) and (19) into equation (12)
The friction between the composite material and the metal adopts the Coulomb friction law, and the critical sliding torque

Finite element model
Use ABAQUS finite element software for modeling. The main features of the model are as follows.
Material property settings

Metal material property.
Elastic properties of composite materials.
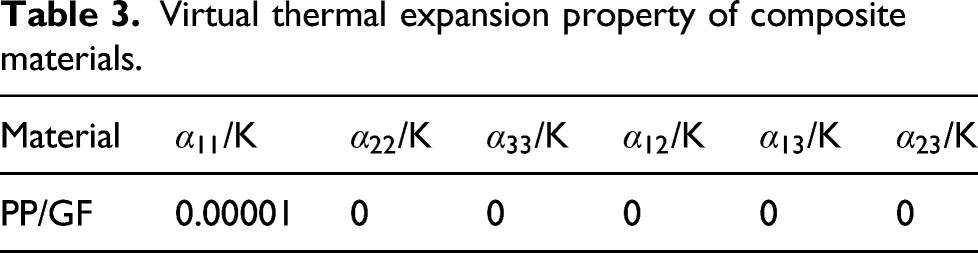
Virtual thermal expansion property of composite materials.
The 10-layer composite material was established by composite layup, and the layup angle (angle between fiber direction and core die axis) was 90°.
Contact attributes and loads and boundary conditions
The C3D8R three-dimensional eight-node solid element is used to model the metal core mold. A quarter of the model after demolding is shown in Figure 2. A quarter of the finite element model after demolding.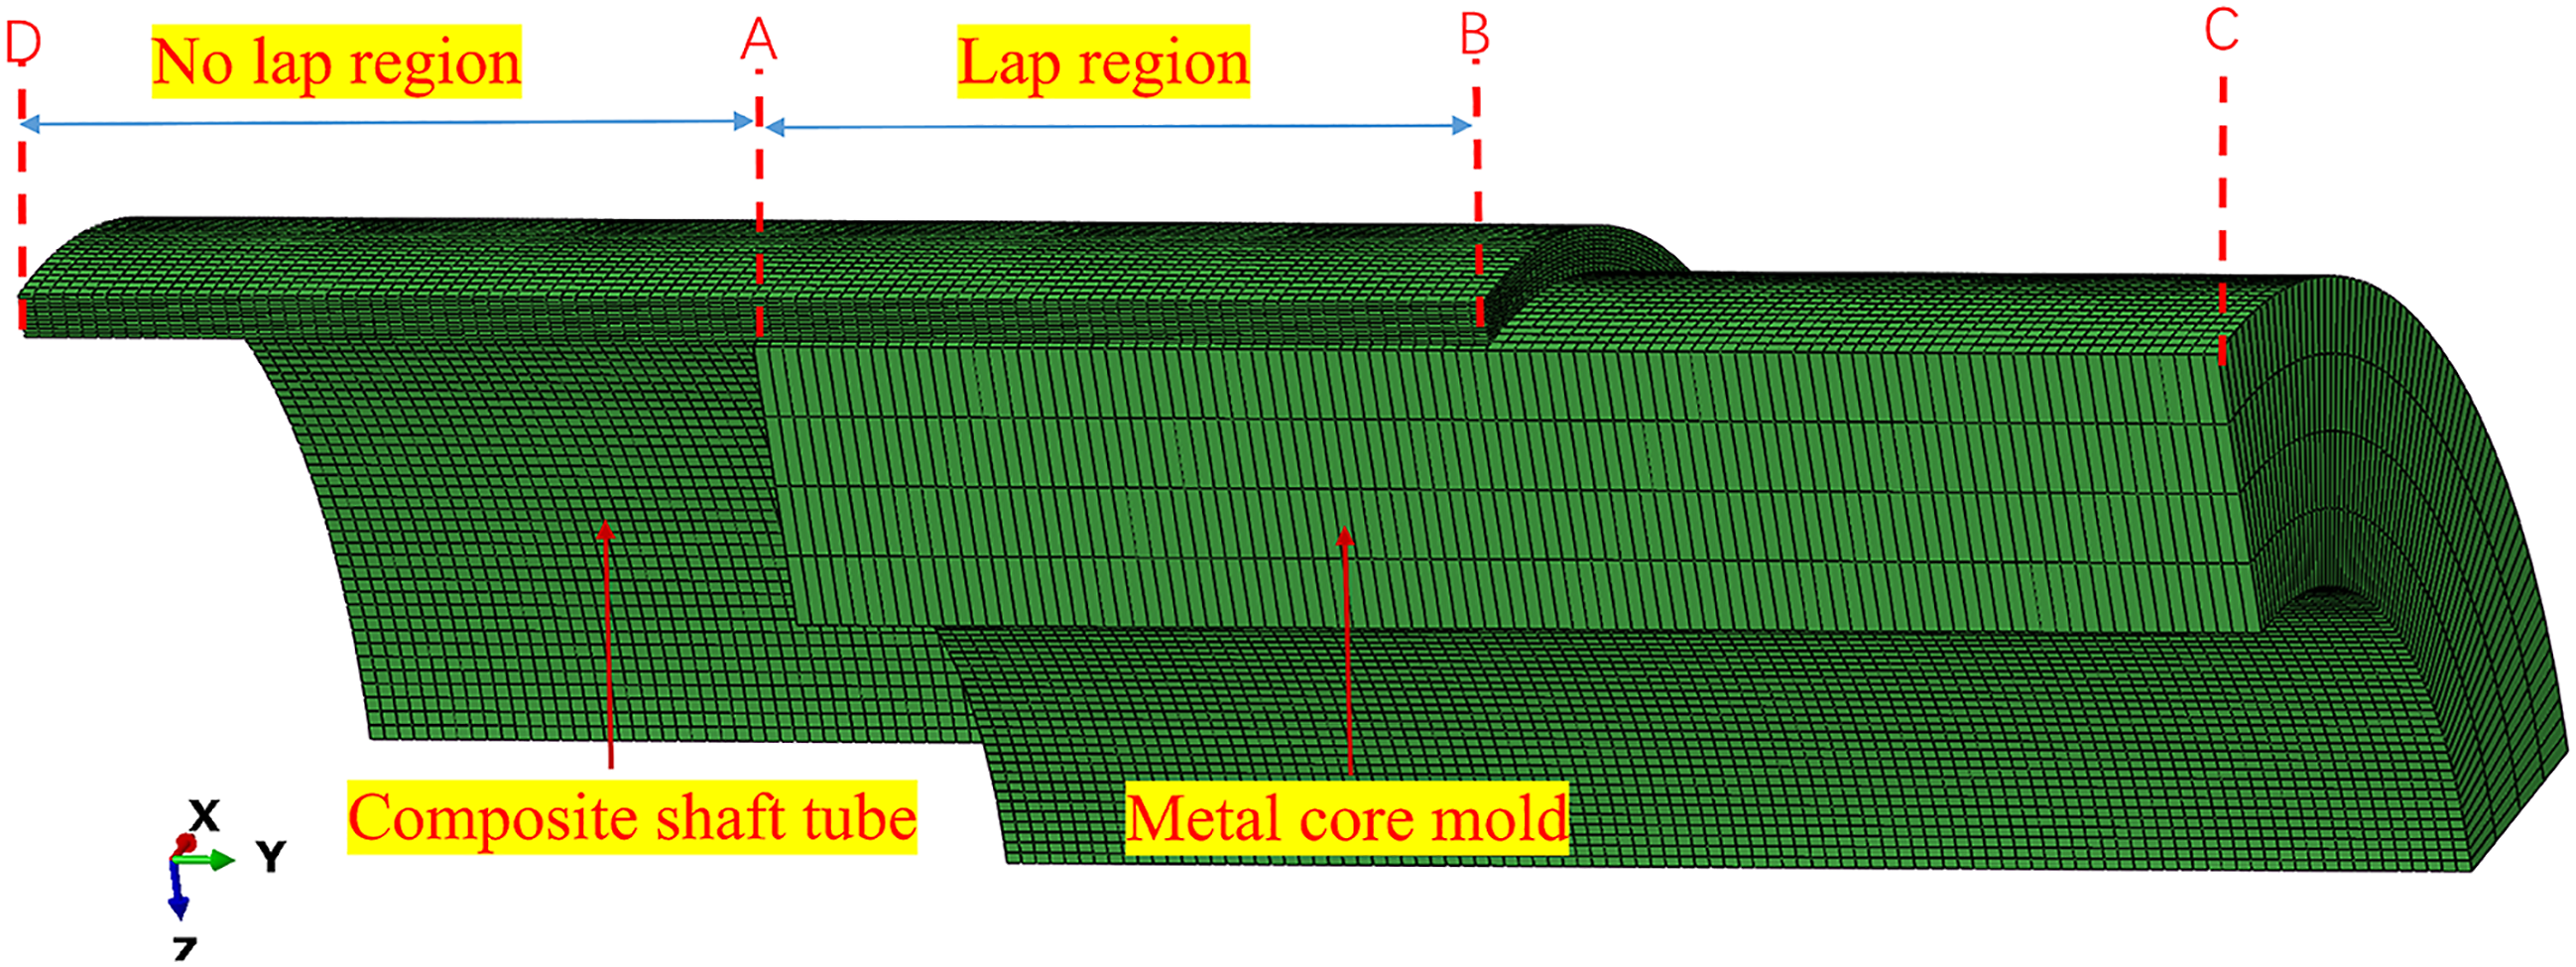
Three analysis steps of winding process, demolding process and loading process are set successively. Birth and death element method are adopted to simulate the winding process. Before the start of winding deactivated all 10 layers of composite elements, after each step analysis from the inside out to activate a layer element. Since the composite layers are tied together, the inactive layers move with the activated layers without stress, which is consistent with the winding process.
During the winding process, a temperature field was set for each layer of composite material, and the temperature drop value was given in the analysis step of the activation of the layer element. An axially symmetric boundary condition was applied to the D terminal of each layer of activated elements. The reference point was established and coupled with the C end face of the core mold, and the completely fixed constraint was imposed on it. A part of the core mold was set between A and D, and this part of the core mold elements were deactivated in the demolding process. During the loading process, angular displacement was applied to the reference point to separate the core mold from the composite material.
Experimental verification
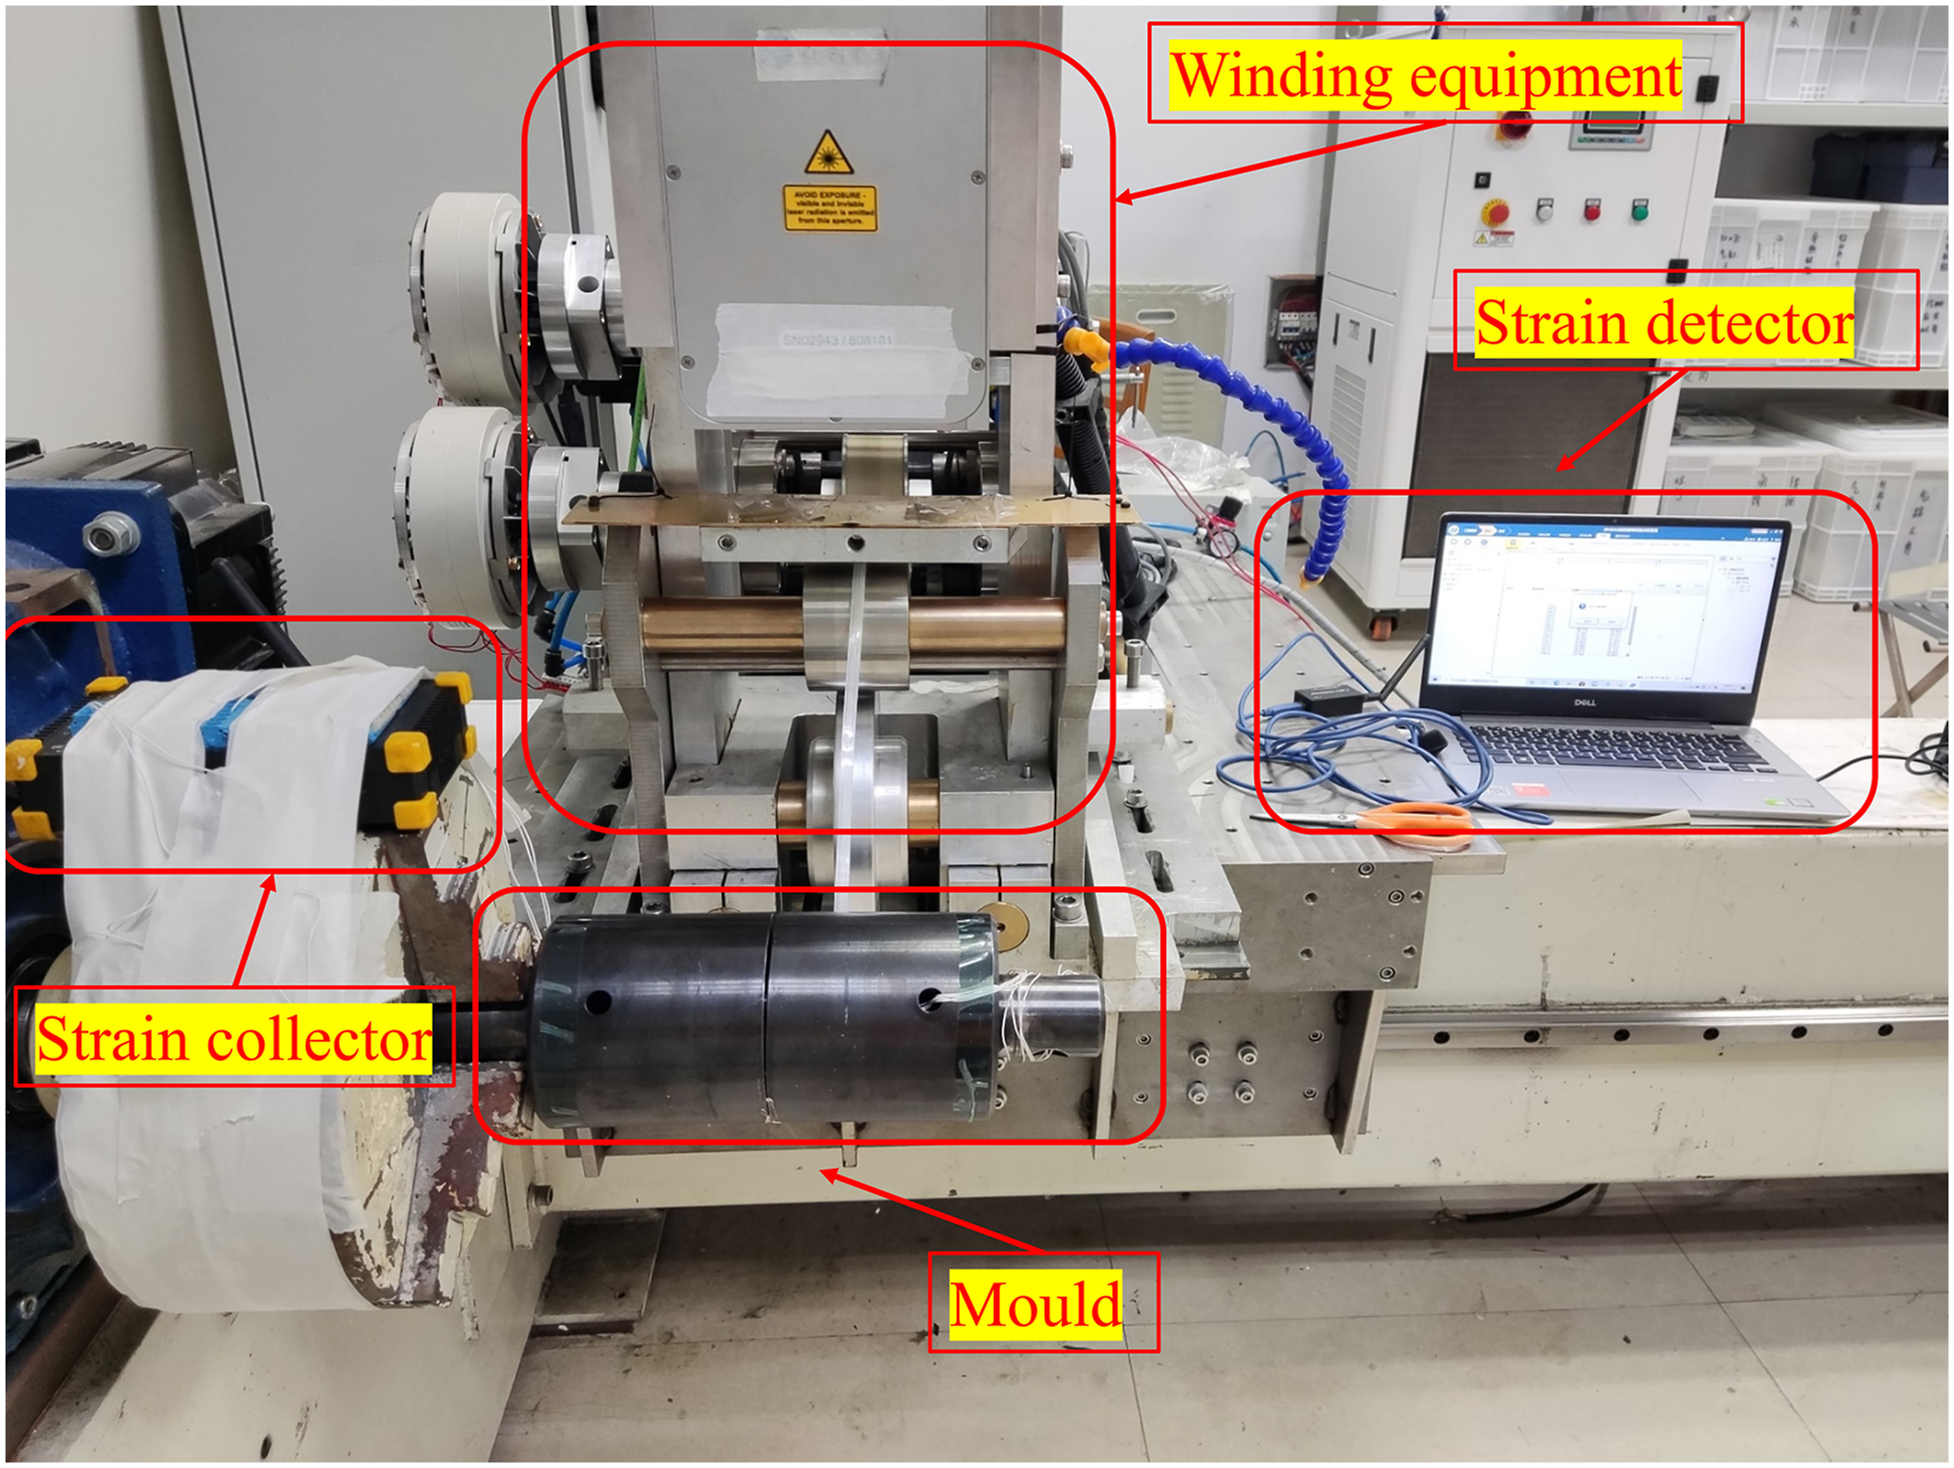
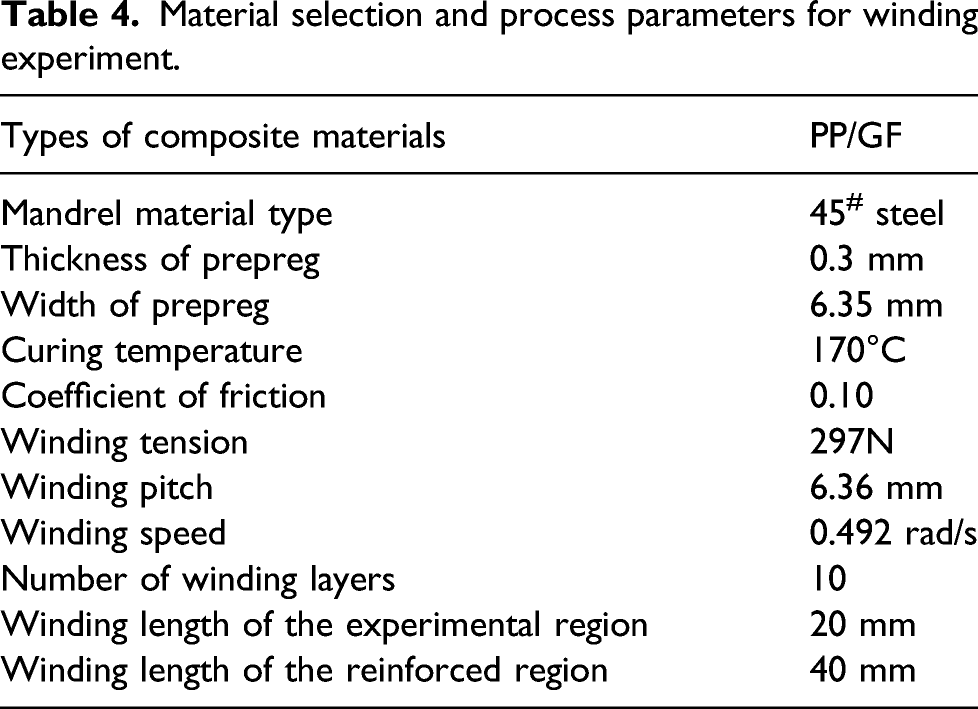
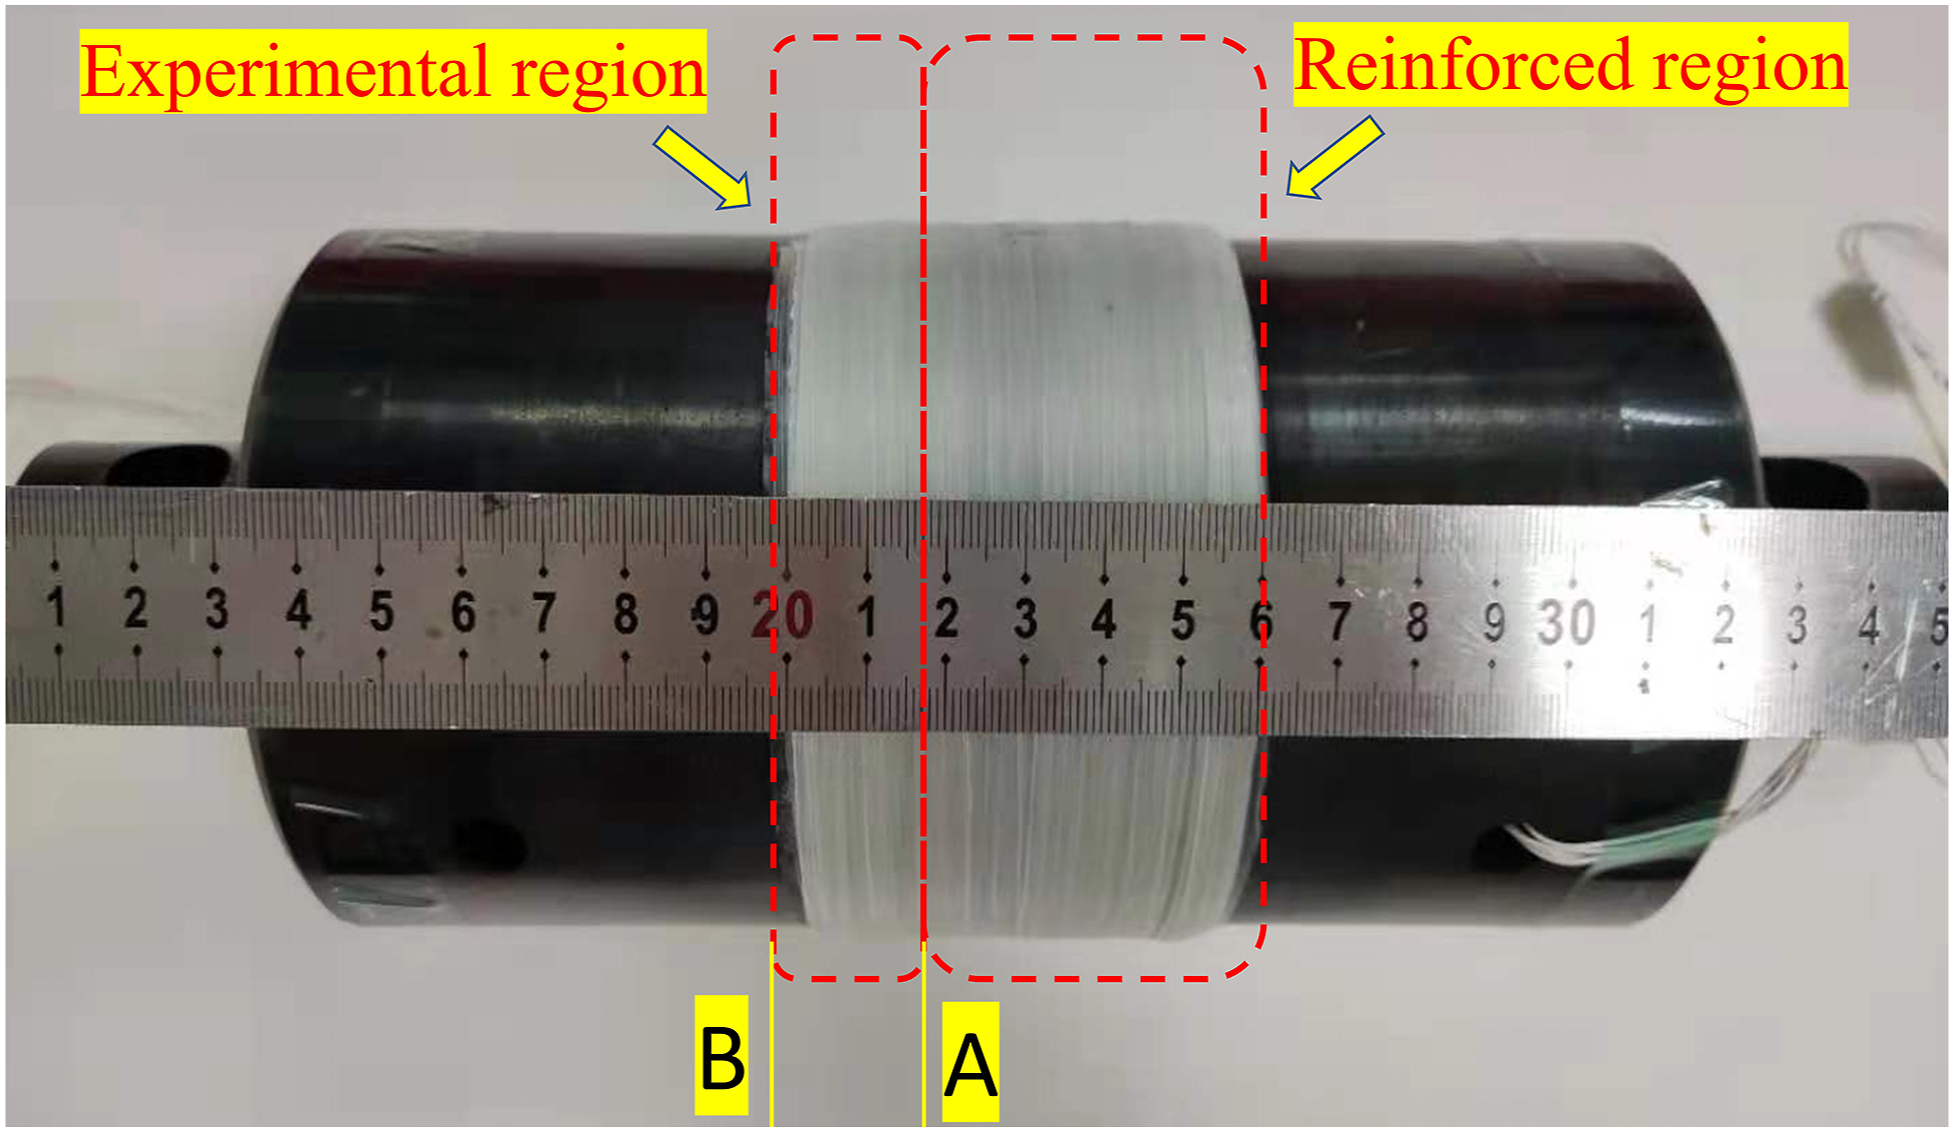
In order to verify the validity of the analytical model and the finite element model, the prestressed joint winding forming experiment was carried out. The schematic diagram of the winding experiment is shown in Figure 3, and the equipment used in the winding experiment is shown in Figure 4. Before the experiment, the strain gauge (model: BE120-4AA-P500, AVIC Electric Measuring Instruments Co., Ltd.) was attached to the inner side of the mold along the ring direction. During the experiment, strain data was collected by the wireless static strain collector (model: DH3819, Donghua Testing Technology Co., Ltd.) and the strain data was synchronized to the computer to monitor the strain situation in real time. Set up the automatic winding program for continuous reciprocating winding. After the experiment, it was cooled to room temperature, and the final strain was recorded. The curing temperature of the experiment was provided by the hot gas torch. The experimental materials and parameters are shown in Table 4. The sample made by winding is shown in Figure 5. The experiment measured the friction coefficient of 45# steel and PP/GF prepreg to be 0.10. Schematic diagram of winding experiment. Experimental equipment. Material selection and process parameters for winding experiment. Winding sample.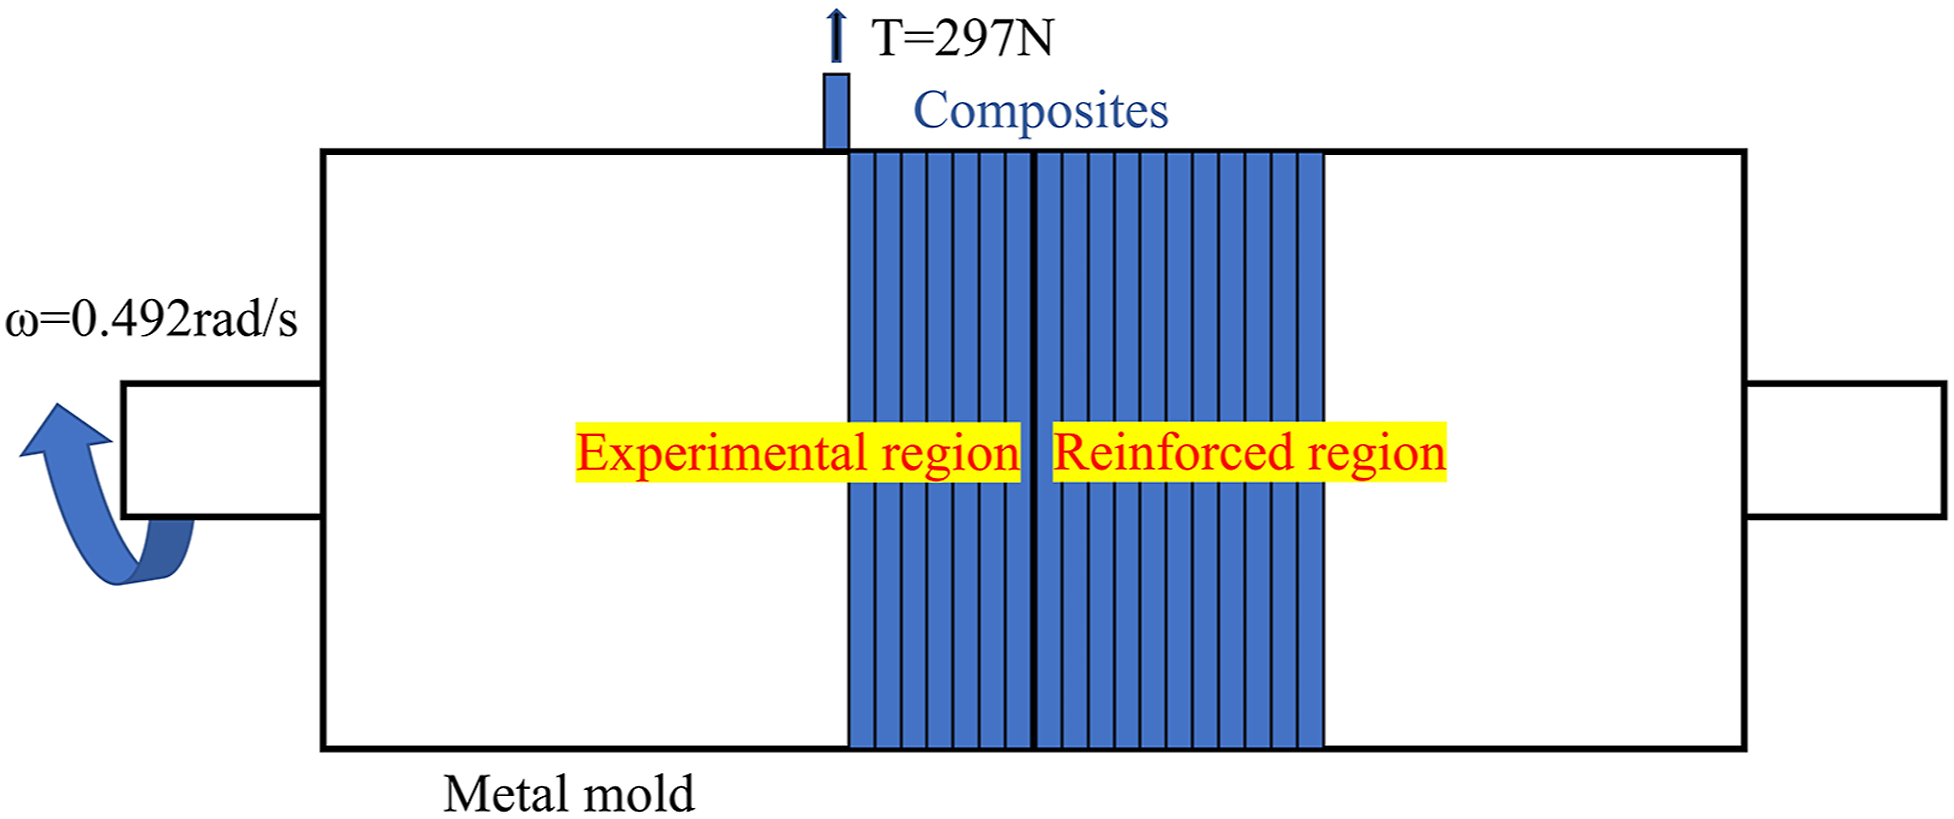
After obtaining the sample, it was subjected to a tensile demoulding experiment. The equipment used in the experiment was the electronic universal testing machine, CMT5150, from Shenzhen New Sansi Company. The tensile rate was 1 mm/min, and the sampling frequency was 1 Hz.
Results and discussion
Influence of geometric features on joint performance
Under the tension of 297N, different lap lengths and different friction coefficients were assigned to the finite element model, and the changes of peak torque and contact stress at different positions were obtained by simulation. The results are shown in Figure 6. Influence of lap length and friction coefficient on analytical and simulated peak torque and contact stress. (a) peak torque and (b) contact stress.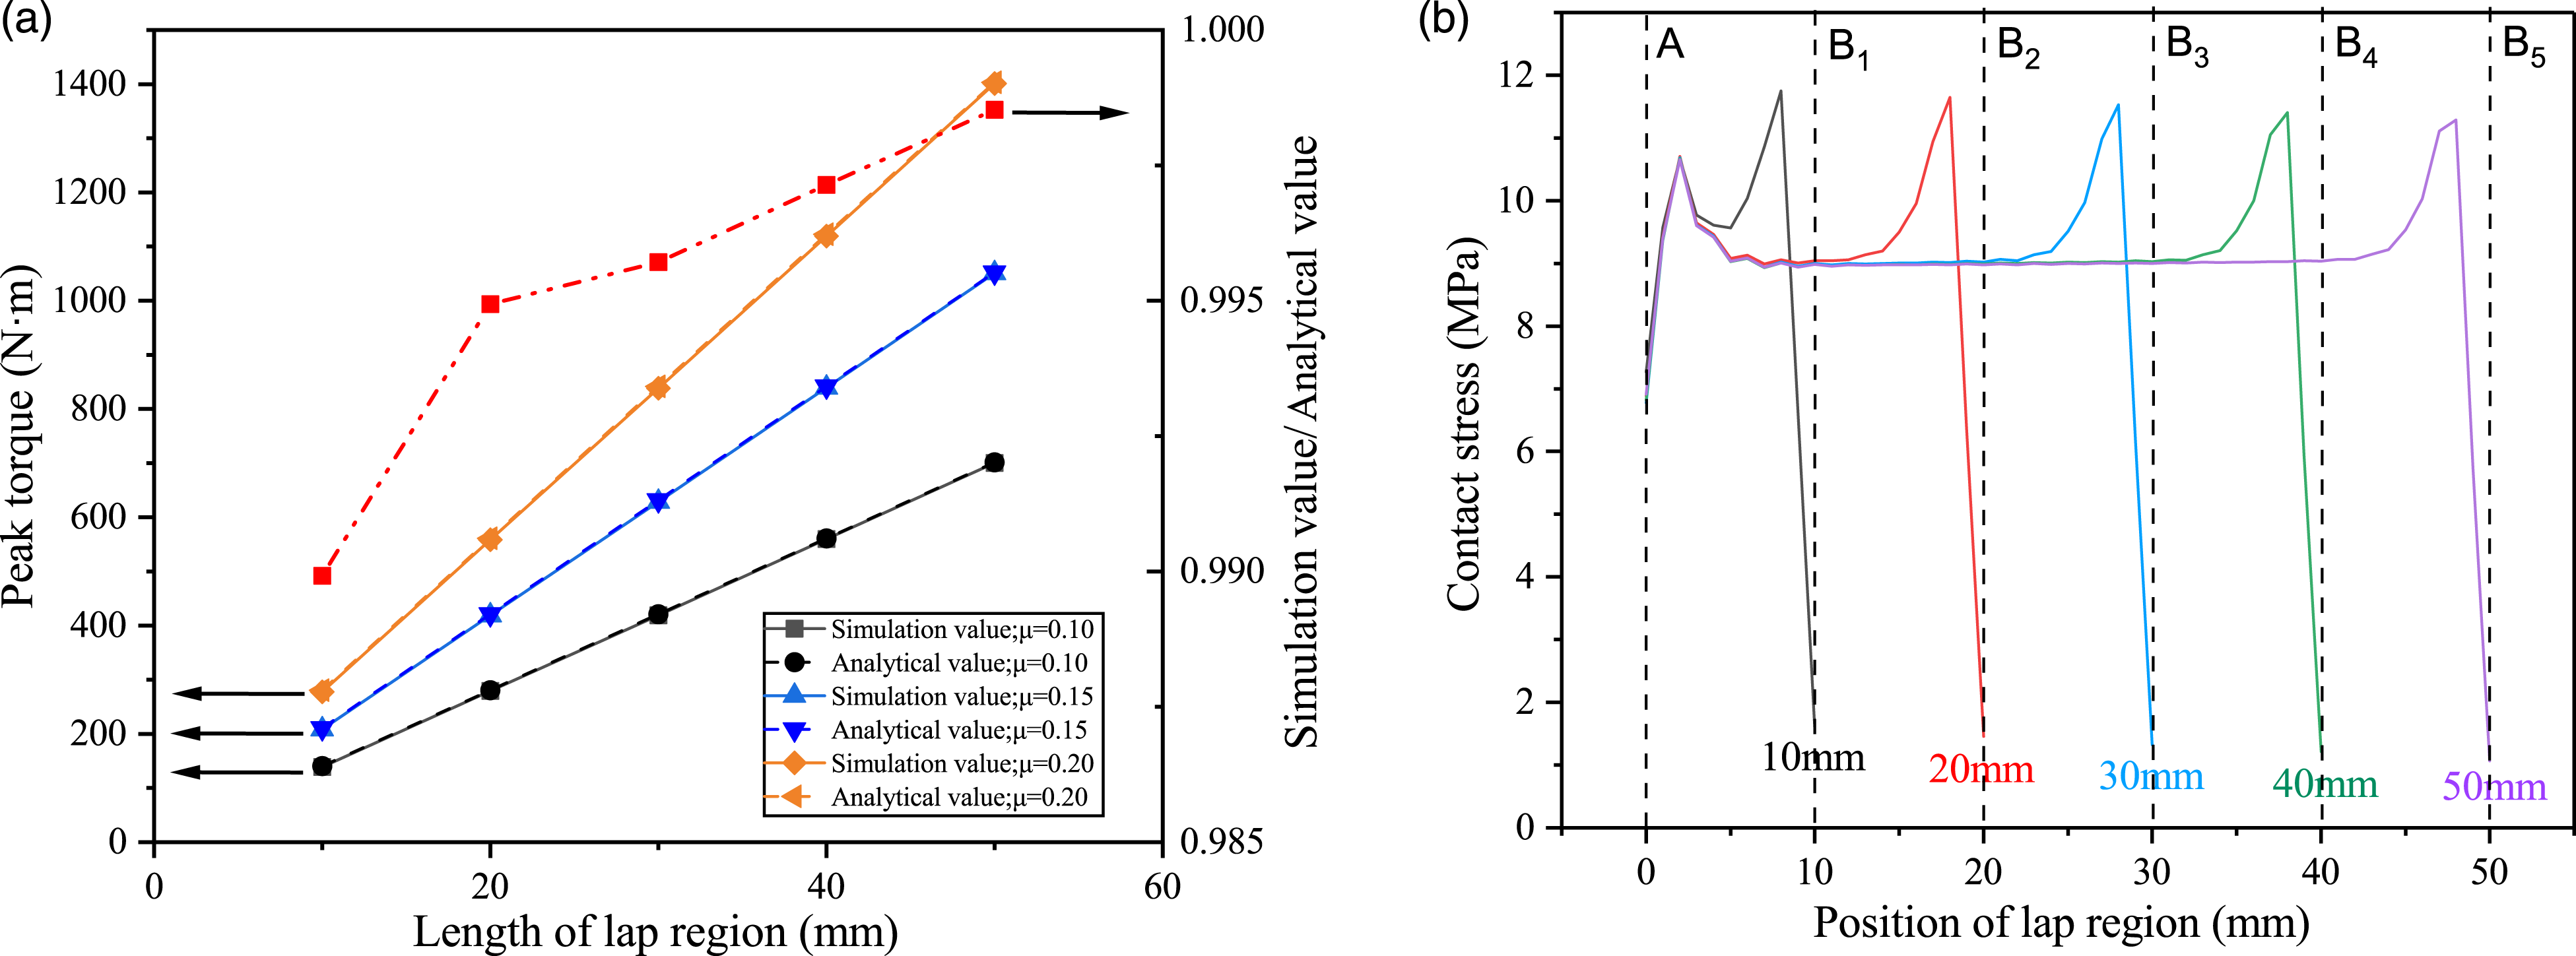
It can be seen from Figure 6(a) that when the lap length is small, the simulated value deviates greatly from the analytical value, and with the increase of the lap length, the gap between the simulation value and the analytical value is reduced from 1.01% to 0.15%. For the same lap length, both the analytical and simulated peak torques increase linearly with the increase of the friction coefficient, because both the analytical and the simulated satisfy the Coulomb friction law.
It can be seen from Figure 6(b) that the contact stress is not uniformly distributed along the axial direction, and the stress near the A and B ends fluctuates greatly compared with the middle part. This “end anomaly” is derived from the structural discontinuity in the model, that is, the geometric characteristics of the joints at the A and B ends have abrupt changes.
In addition, Figure 6(b) shows that the relative positions and values of the regions generated by stress mutation are basically the same, which leads to the decrease of the impact of the end anomaly on the overall lap region as the lap length increases, which also explains the phenomenon that the simulated value and the analytical value in Figure 6(a) gradually approach with the increase of the lap length. Studies have shown that in the region far from the end, the simulated value has a higher coincidence with the analytical value, which is also verified in Figure 6(b).
The influence of winding prestress on contact stress
The core of the process of composite prestressed winding joints lies in the level of winding prestress. By winding, prestress is applied to the prepreg, so that contact stress is generated between the composite material and the core mold.
Figure 7 shows the circumferential stress cloud diagram of the composite after winding. Figure 8 shows the contact stress and circumferential stress of composite materials under different conditions of prestress and core mold materials Hoop stress. (a) hoop stress of each layer of composite and (b) composite hoop stress. Contact stress and the hoop stress of the composite material. (a) contact stress and (b) composite hoop stress.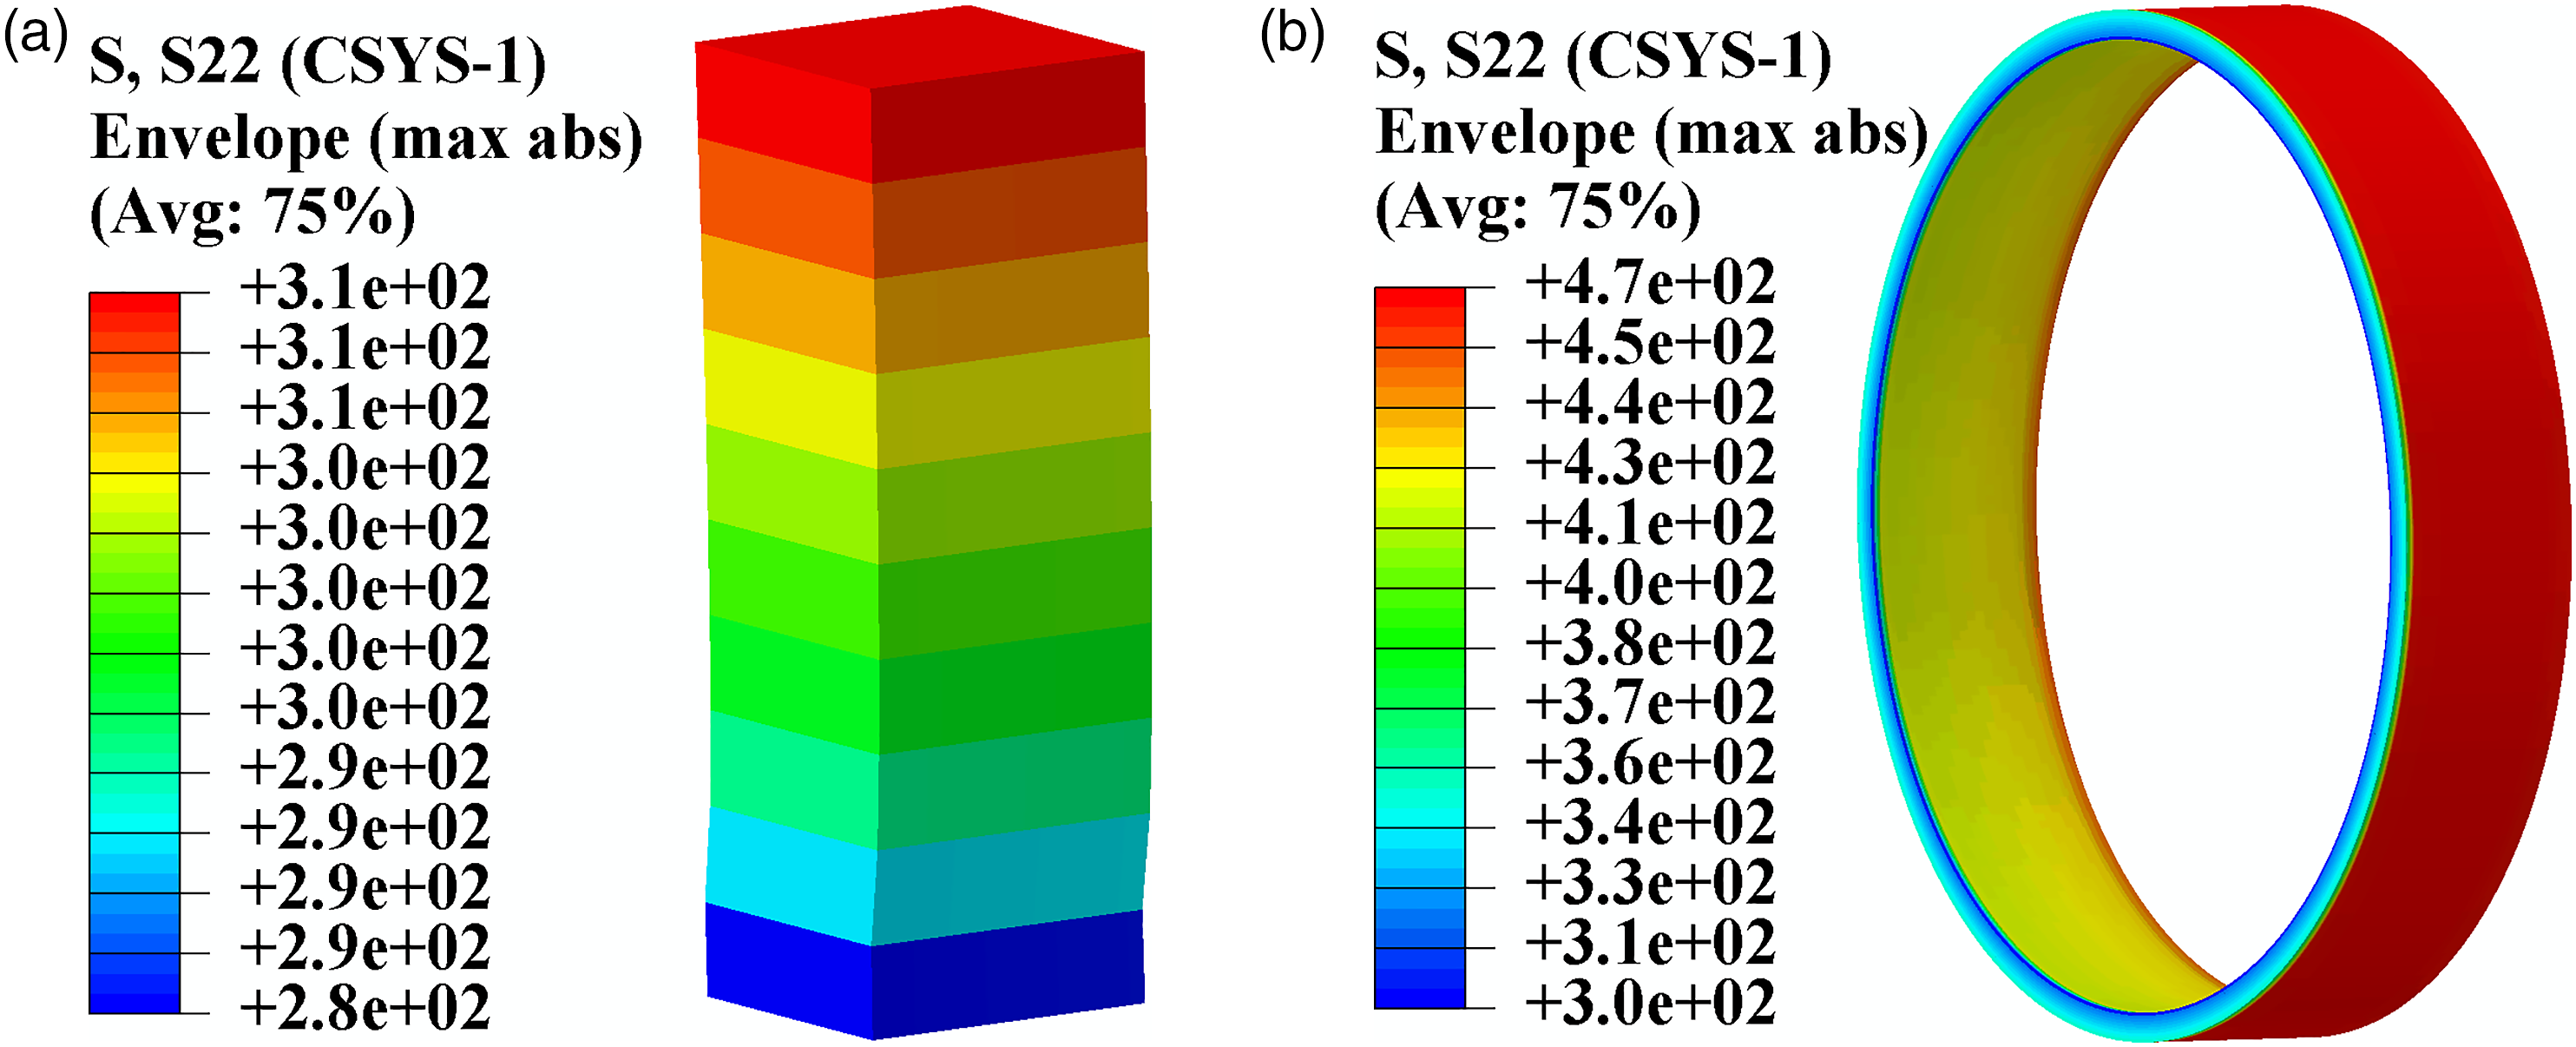
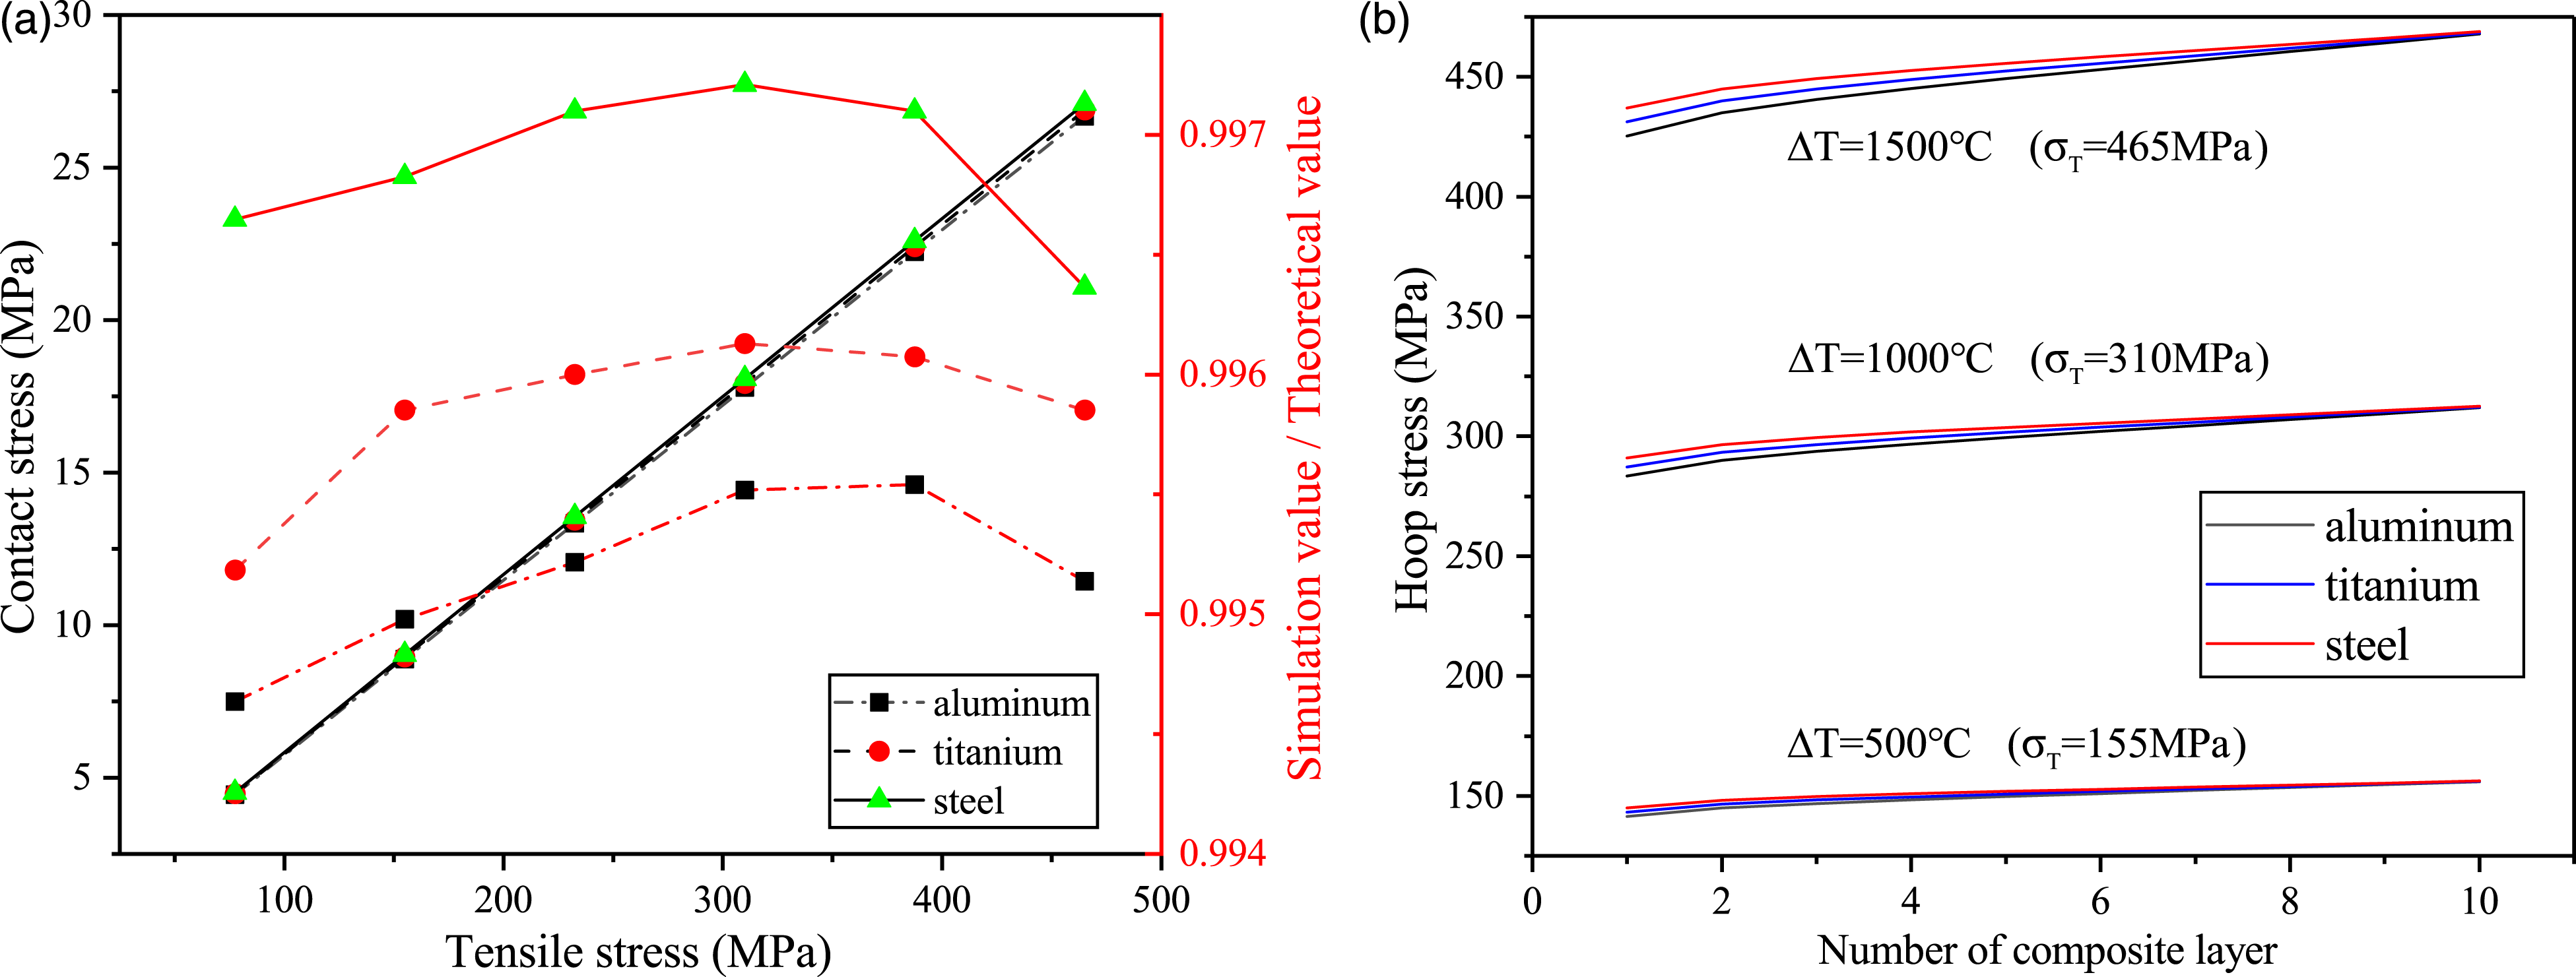
Figure 7 shows the stress relaxation effect during the winding process of composite materials. In the case of constant prestress winding, the winding composite layer will generate radial pressure on the wound layers and the core mold, which makes the core mold further shrink, so that the prestress of the wound layers will have a certain relaxation, and the more obvious the relaxation phenomenon of the inner layer of the composite material. This relaxation effect makes the stress of the composite material uneven. On the one hand, the performance of the inner layer composite material is not fully utilized, and on the other hand, it also reduces the bonding performance between the composite material layer and the layer. Therefore, there are also some algorithmic researches on taper tension winding. The purpose is to make the hoop stress of each layer of the composite material consistent after the winding is completed, so as to reduce or eliminate the effect of stress relaxation.17,18
As shown in Figure 8(a), as the prestress increases, the contact stress increases, but in the actual molding process, the higher the prestress, the more obvious the stress relaxation phenomenon, and the more microscopic defects produced in the composite material. Therefore, the prestress needs to be controlled within a certain range. Under the same prestress, the contact stress of aluminum is the smallest and that of steel is the largest. This is because the greater the modulus of the mandrel material, the smaller the shrinkage of the mandrel under the same prestress, the less obvious the hoop stress relaxation of the composite material, and the greater the contact stress. It can also be seen in Figure 8(a) that the prestress level does not significantly affect the degree of agreement between the simulated value and the analytical value.
Figure 8(b) shows the hoop stress of each layer of composite material under different winding prestress and different core mold material conditions. It can be seen that the hoop stress of the composite material layer gradually decreases from the outside to the inside. This is also caused by tension relaxation. The composite material wound later produces a certain radial compressive stress on the core mold, causing it to shrink, so that the hoop stress of the composite material wound first is reduced. The more the number of winding layers, the more obvious the relaxation of the composite material of the inner layer.
Figure 8(b) shows the hoop stress of each layer of composite material under different winding tensions and different mandrel materials. Under the same pretension level, among the three core mold materials, the relaxation of steel is the least obvious, while the relaxation of aluminum is the most obvious. Under the action of the pre-tightening stress of 465 MPa, the hoop stress relaxation rate of the composite material in the inner layer of the steel core mold is 6.80%, while the relaxation rate in the aluminum material reaches 9.08%; And for the same core mold material, the greater the prestress, the more obvious the relaxation. This is because the smaller the modulus of the core mold material or the greater the prestress, the greater the radial shrinkage of the core mold and the more severe the stress relaxation.
The influence of demolding process on joint stress distribution
The contact stresses of the joints with an lap length of 50 mm after being wound without demolding and after demolding were extracted respectively, and the results are shown in Figure 9. Change of contact stress before and after demolding.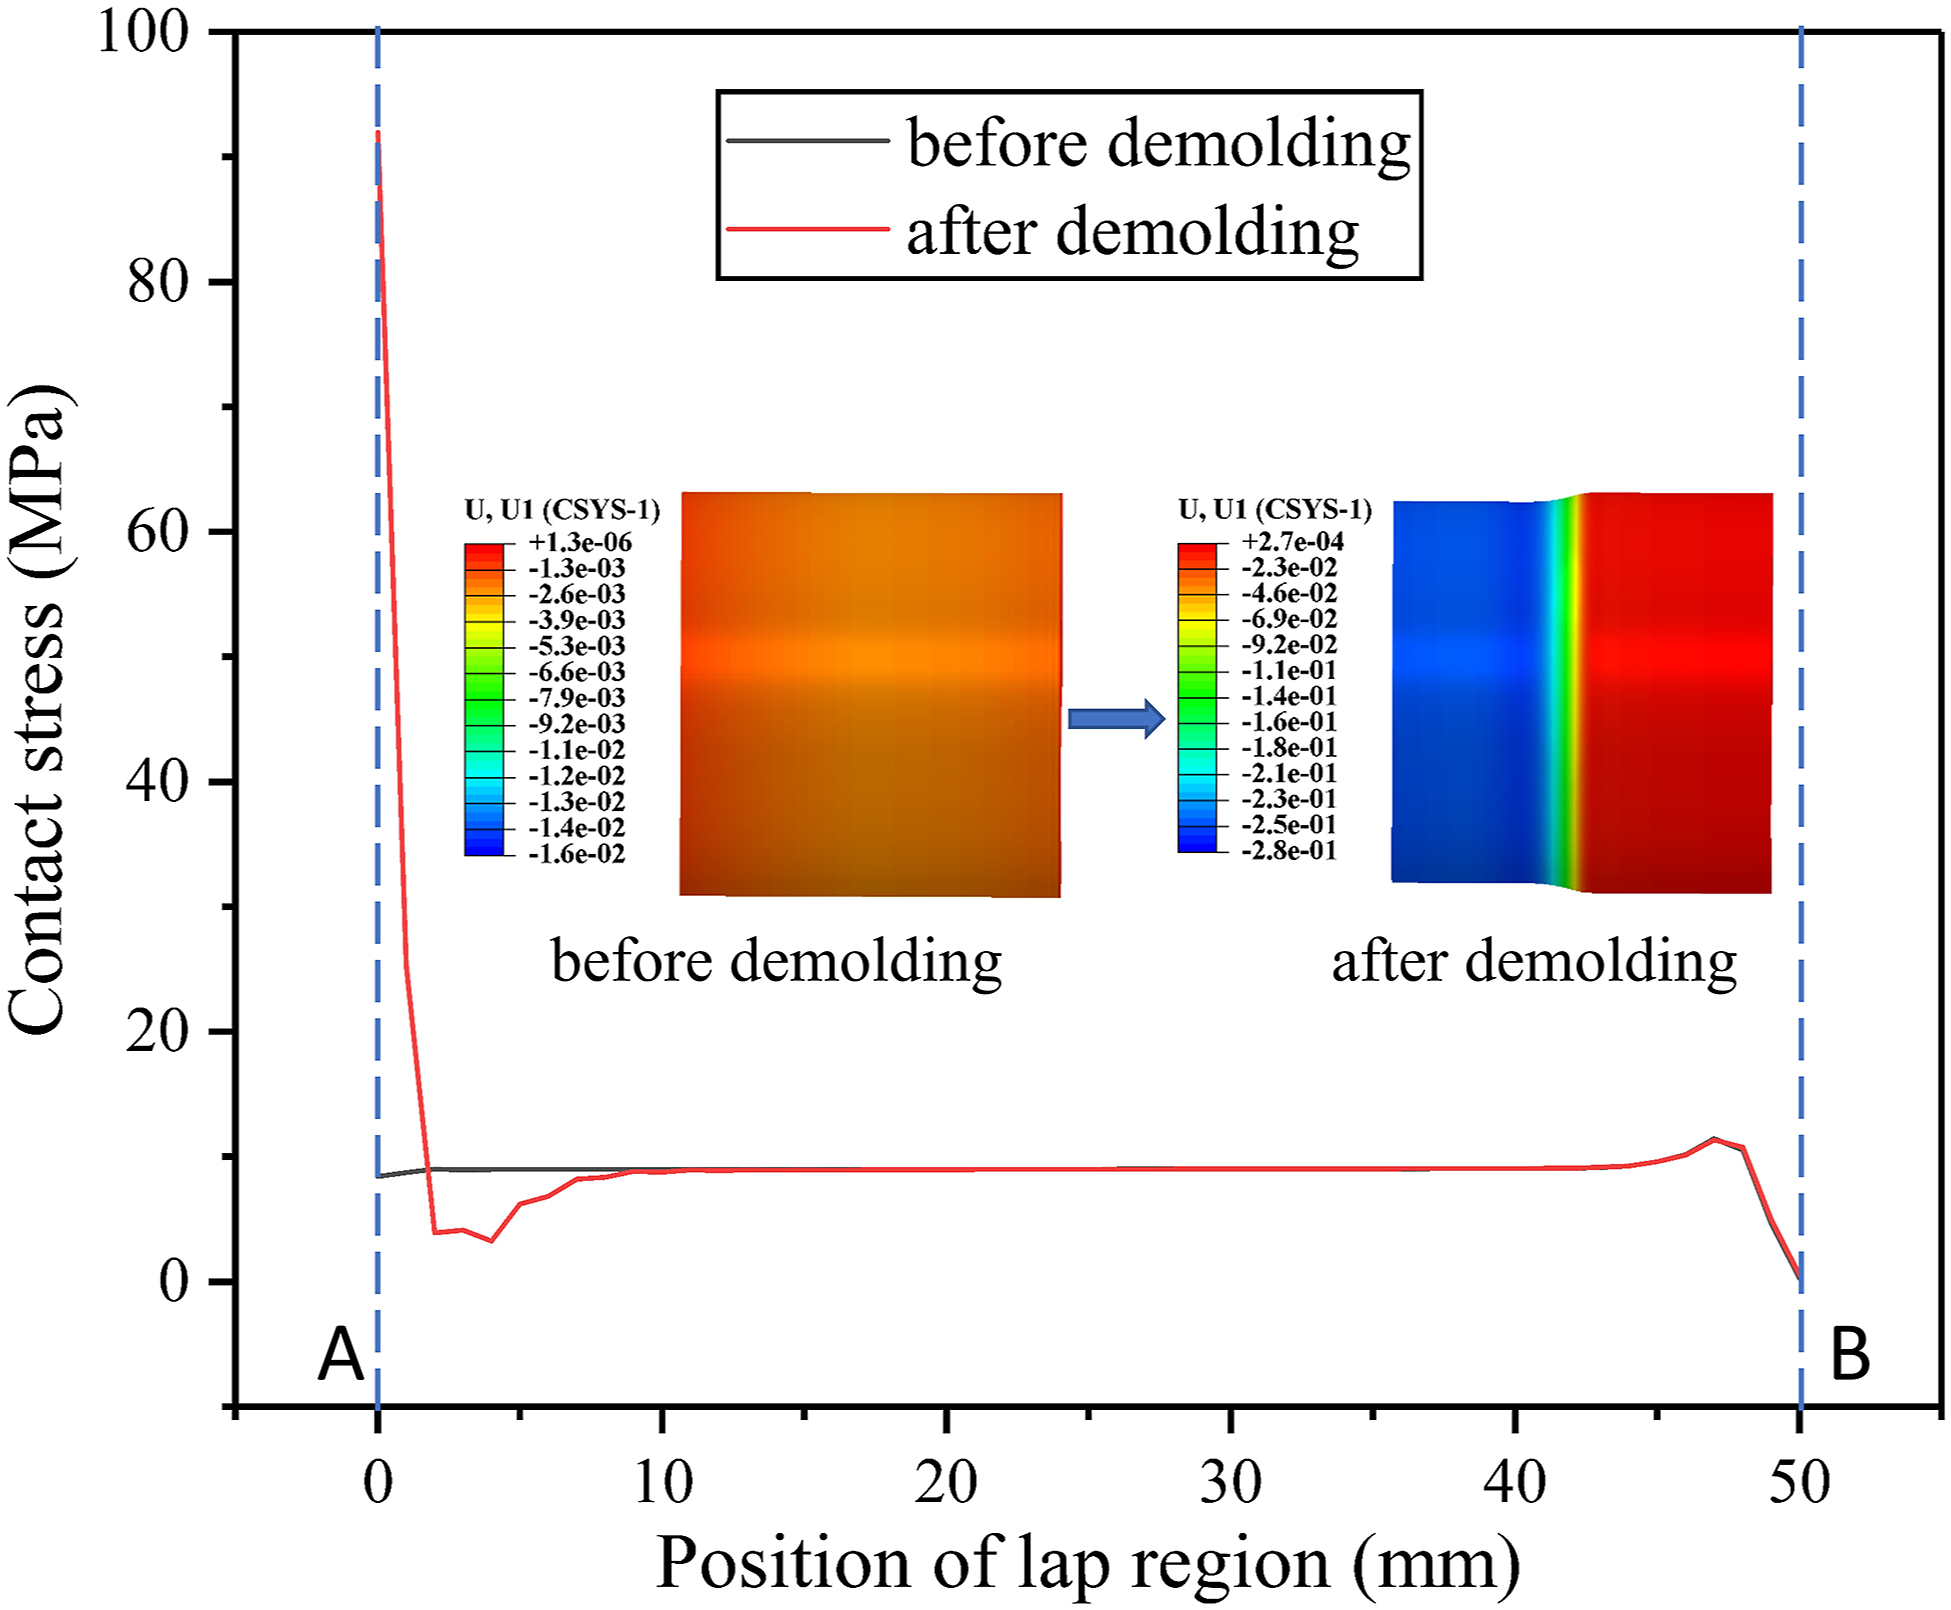
It can be seen from Figure 9 that after demolding is completed, the contact stress near the A end increases up to 9.92 times while the stress in other positions is basically unchanged. This is because the demolding process takes place near the A end, so it has a greater impact on the A end. Near the A end, the contact stress increases sharply after demolding. Figure 9 shows that after demolding, the shaft tube in the demolding zone loses the support of the mandrel. Under the action of the composite material in the lap zone, a negative radial displacement is generated, resulting in a sharp increase in the contact stress near the A end. The local deformation and sudden stress changes during the demolding process are likely to cause delamination failure of the composite material or affect the load-bearing and load transfer stability of the joint.
Characteristics of shear stress distribution in lap zone
The prestressed joint transmits torsion load. When the contact stress between the core mold and the composite shaft tube meets the conditions, in order to rationally optimize the joint structure and layup method, the shear stress in the lap zone of the shaft tube, especially the distribution of Shear stress distribution of composite materials in lap zone. (a) 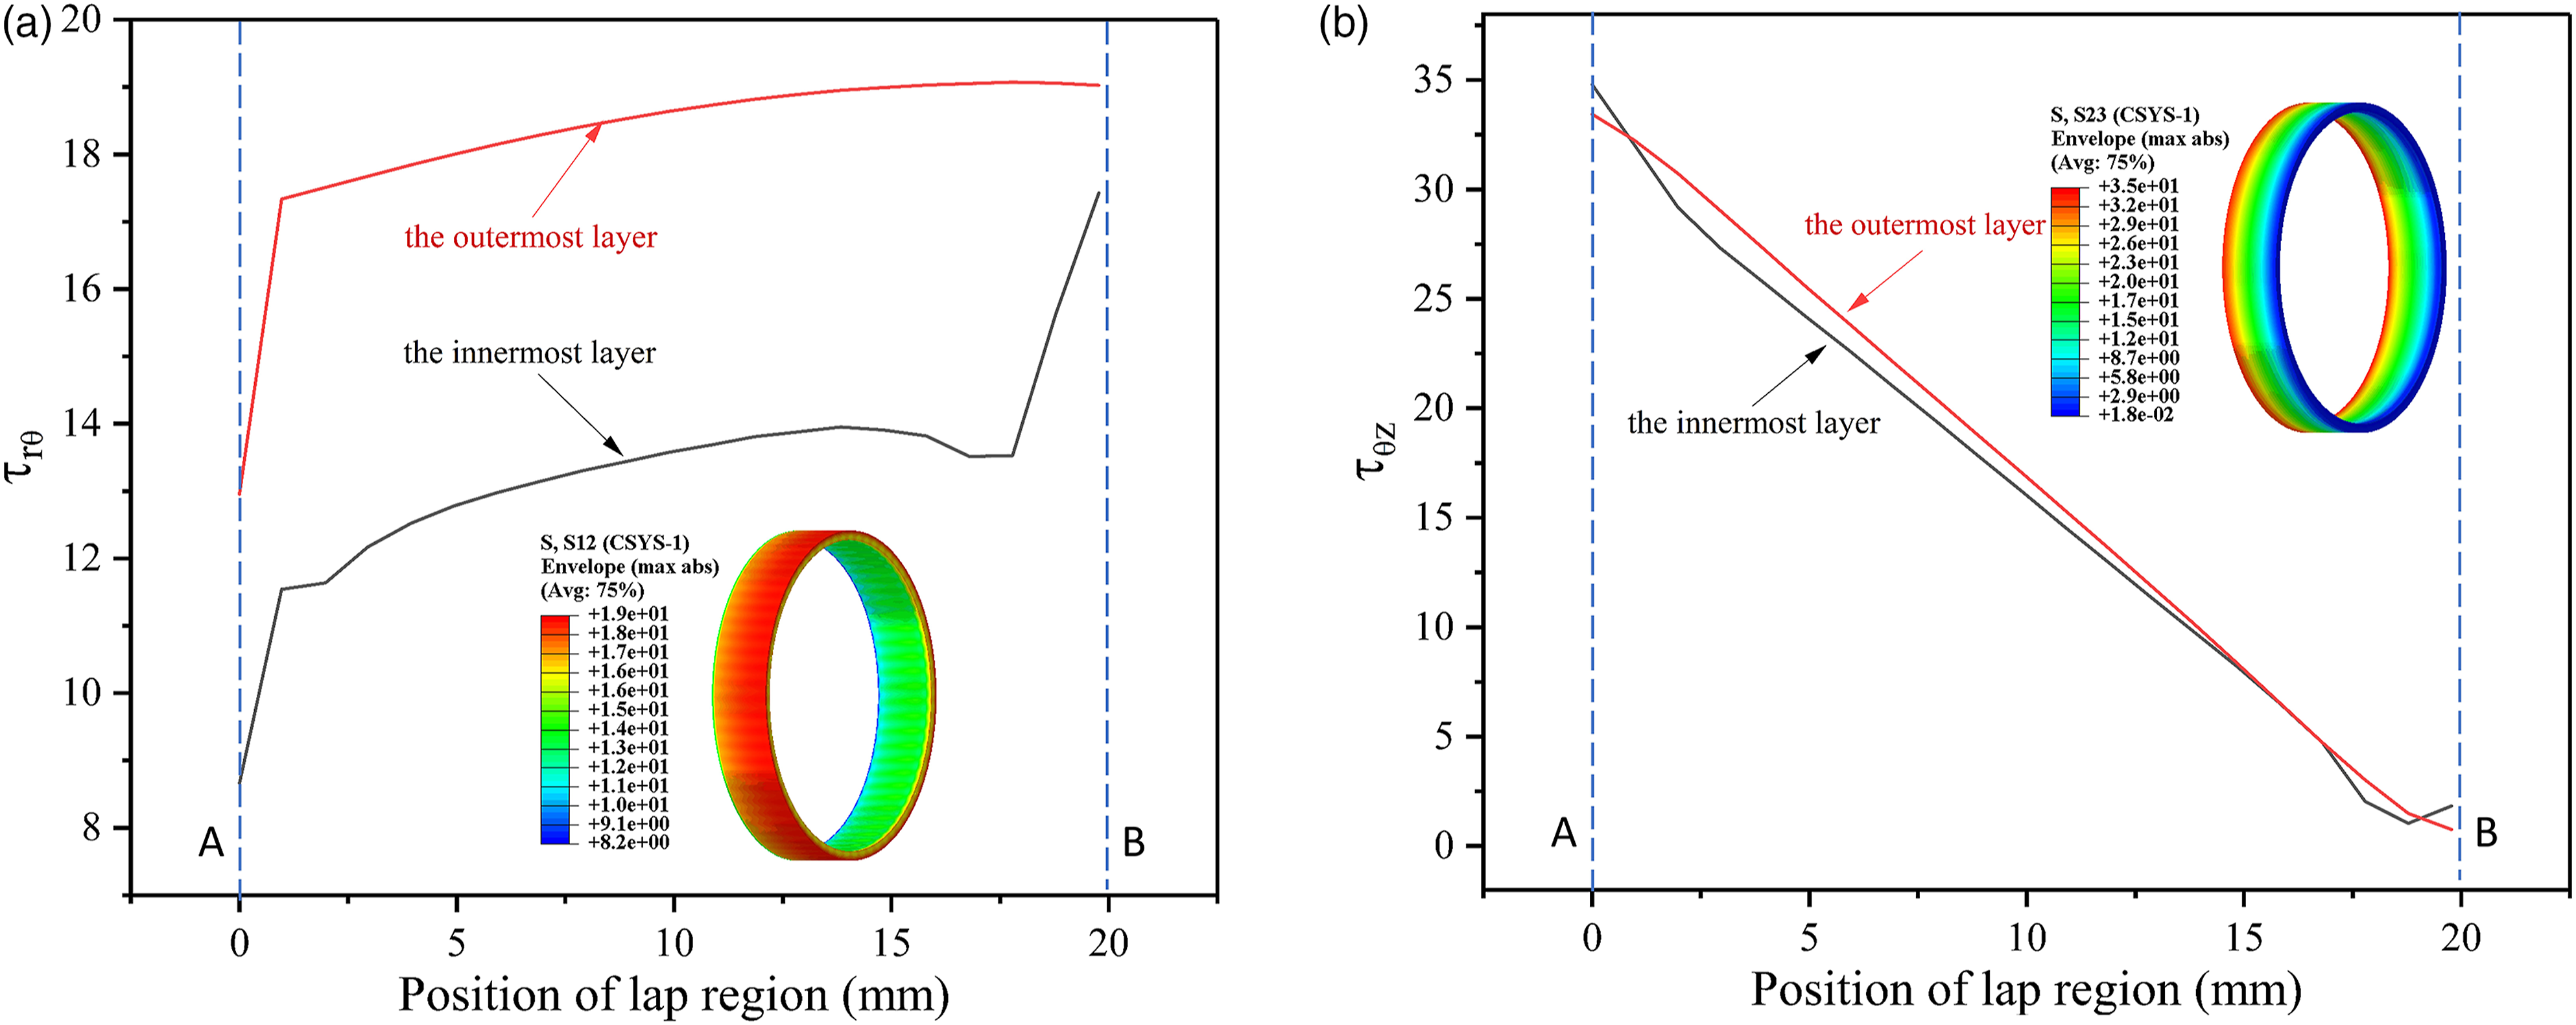
From Figure 10(a), the innermost and outermost composite materials in the lap zone all reach the peak value of
Experimental results and verification
In order to verify the reliability of joint torque transfer, the shear strength of composite-metal interface was measured by tensile method, and the load-displacement curve was obtained.
The experimental verification is divided into two parts. The first part is the verification of the winding process. By sticking strain gauges along the inner side of the mold along the circumferential direction, the strain data is recorded in real time during the winding process, and finally the radial stress on the outer side of the core mold is derived from the inner circumferential strain data of the core mold and compared with the analytical and simulated values. Figure 11 is a comparison diagram of analytical contact stress, simulated contact stress, and experimental contact stress after winding. Radial stress comparison.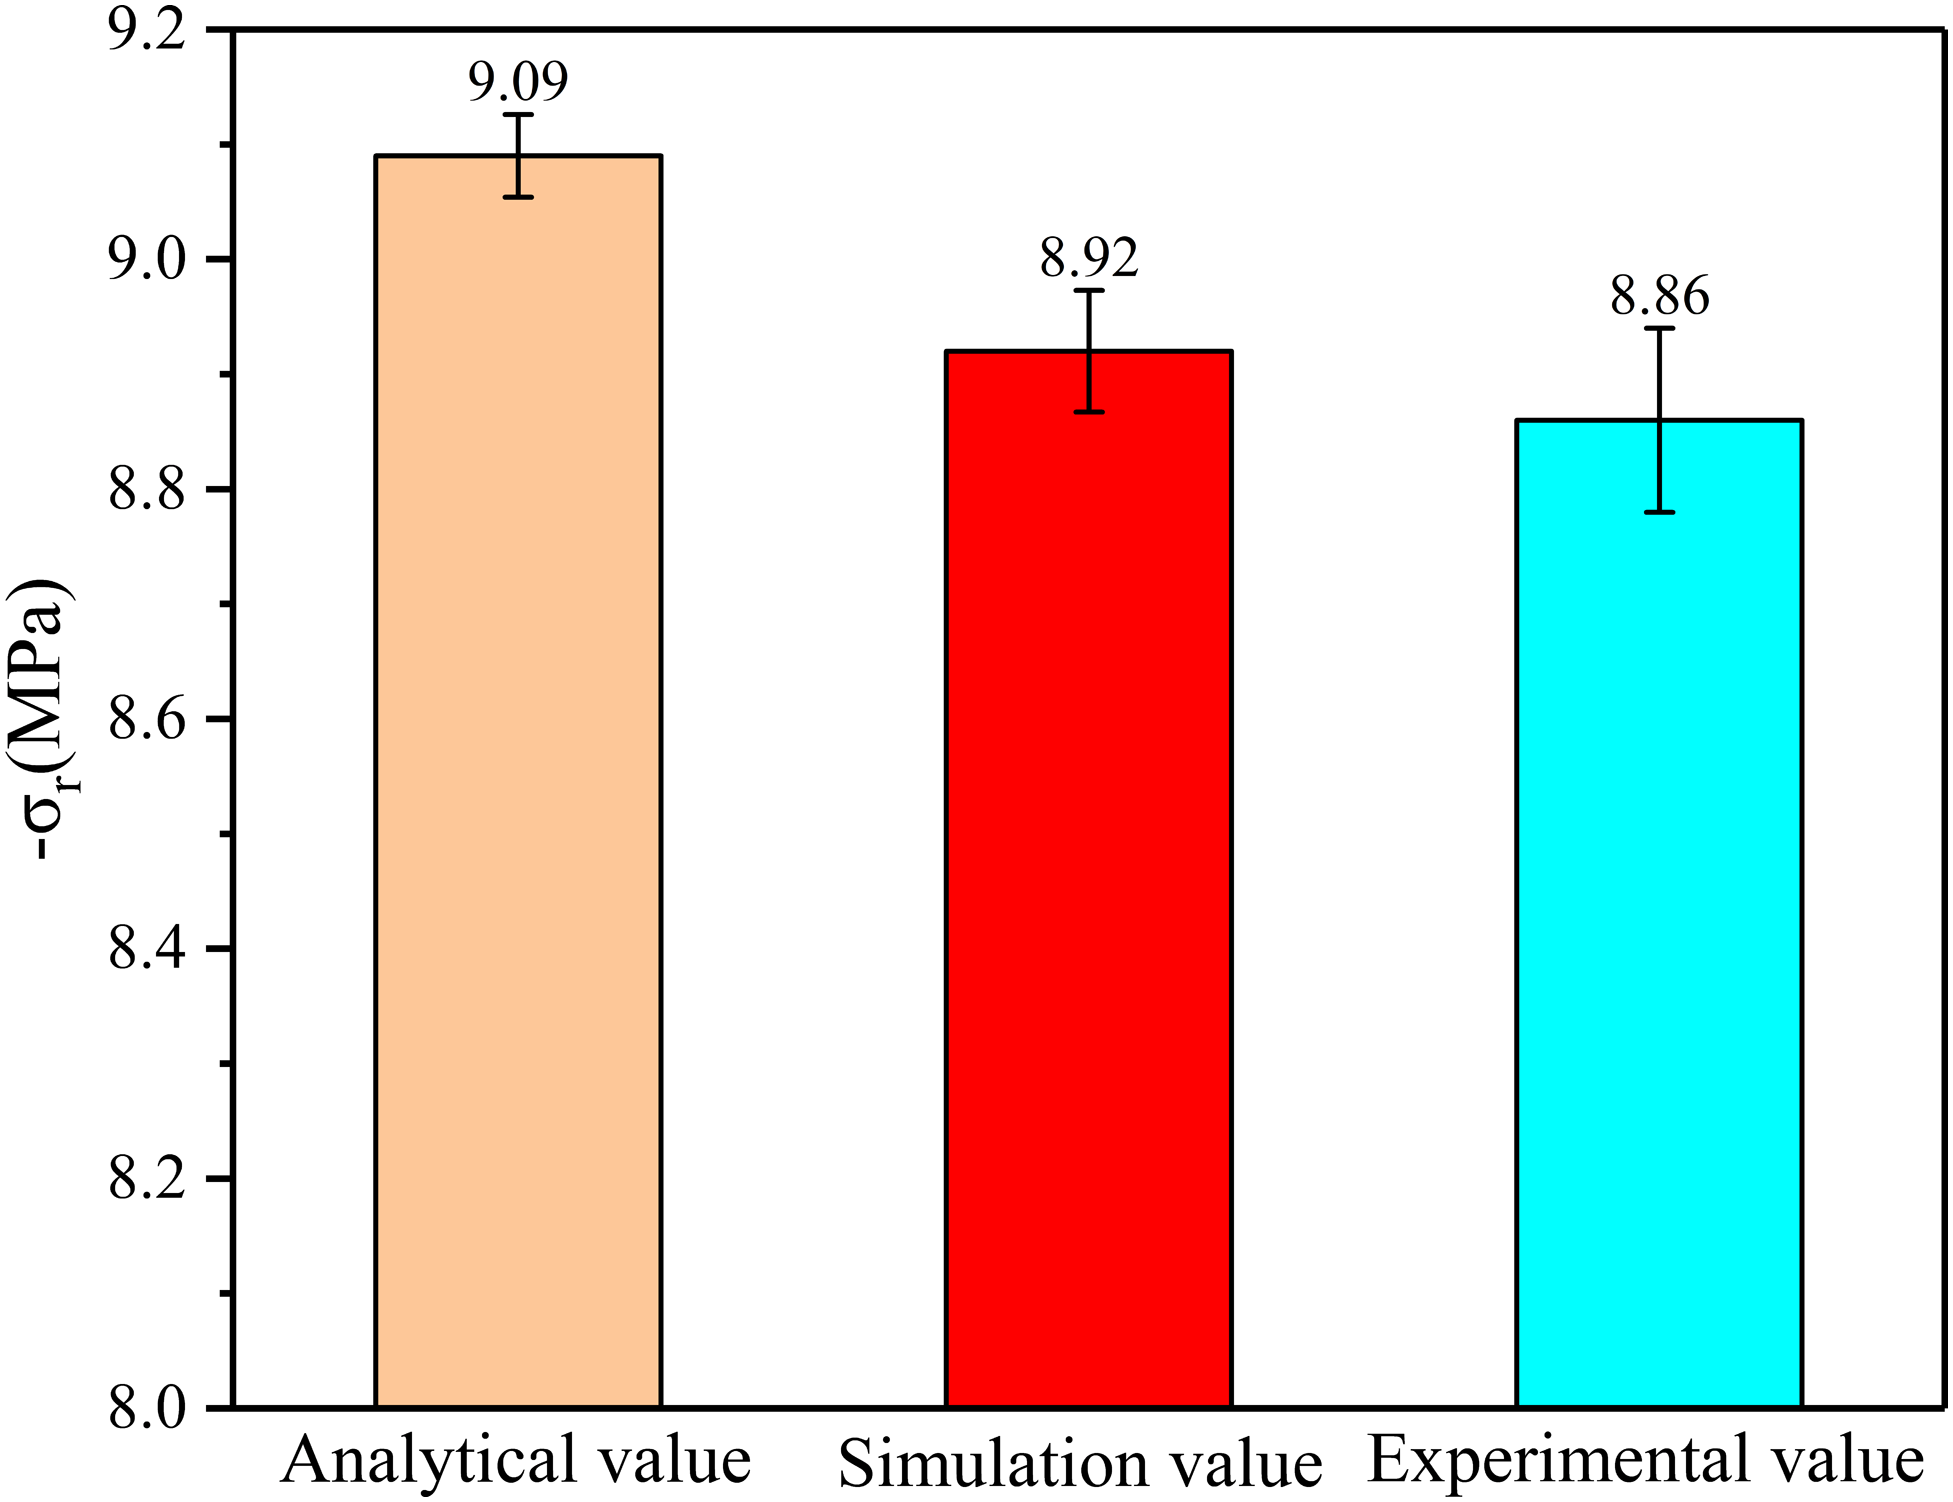
From Figure 11, we can get that the deviation between the experimental value and the simulated value is 0.67%. The deviation between the experimental and analytical values is 2.53%. This is because the analytical model does not consider the end effect, which makes the contact stress higher, while the simulation and experiment are both affected by the discontinuity of the end structure. The average contact stress of the two is very close and slightly lower than the analytical value. This indirectly proves that the end effect exists and has a certain influence on the joint performance.
The second part is the verification of the stretching process. Through the tensile test of the sample, the peak force and load-displacement curve of the sample failure are obtained, and compared with the analytical curve and the simulation curve. The result is shown in Figure 12. Load-displacement curve comparison.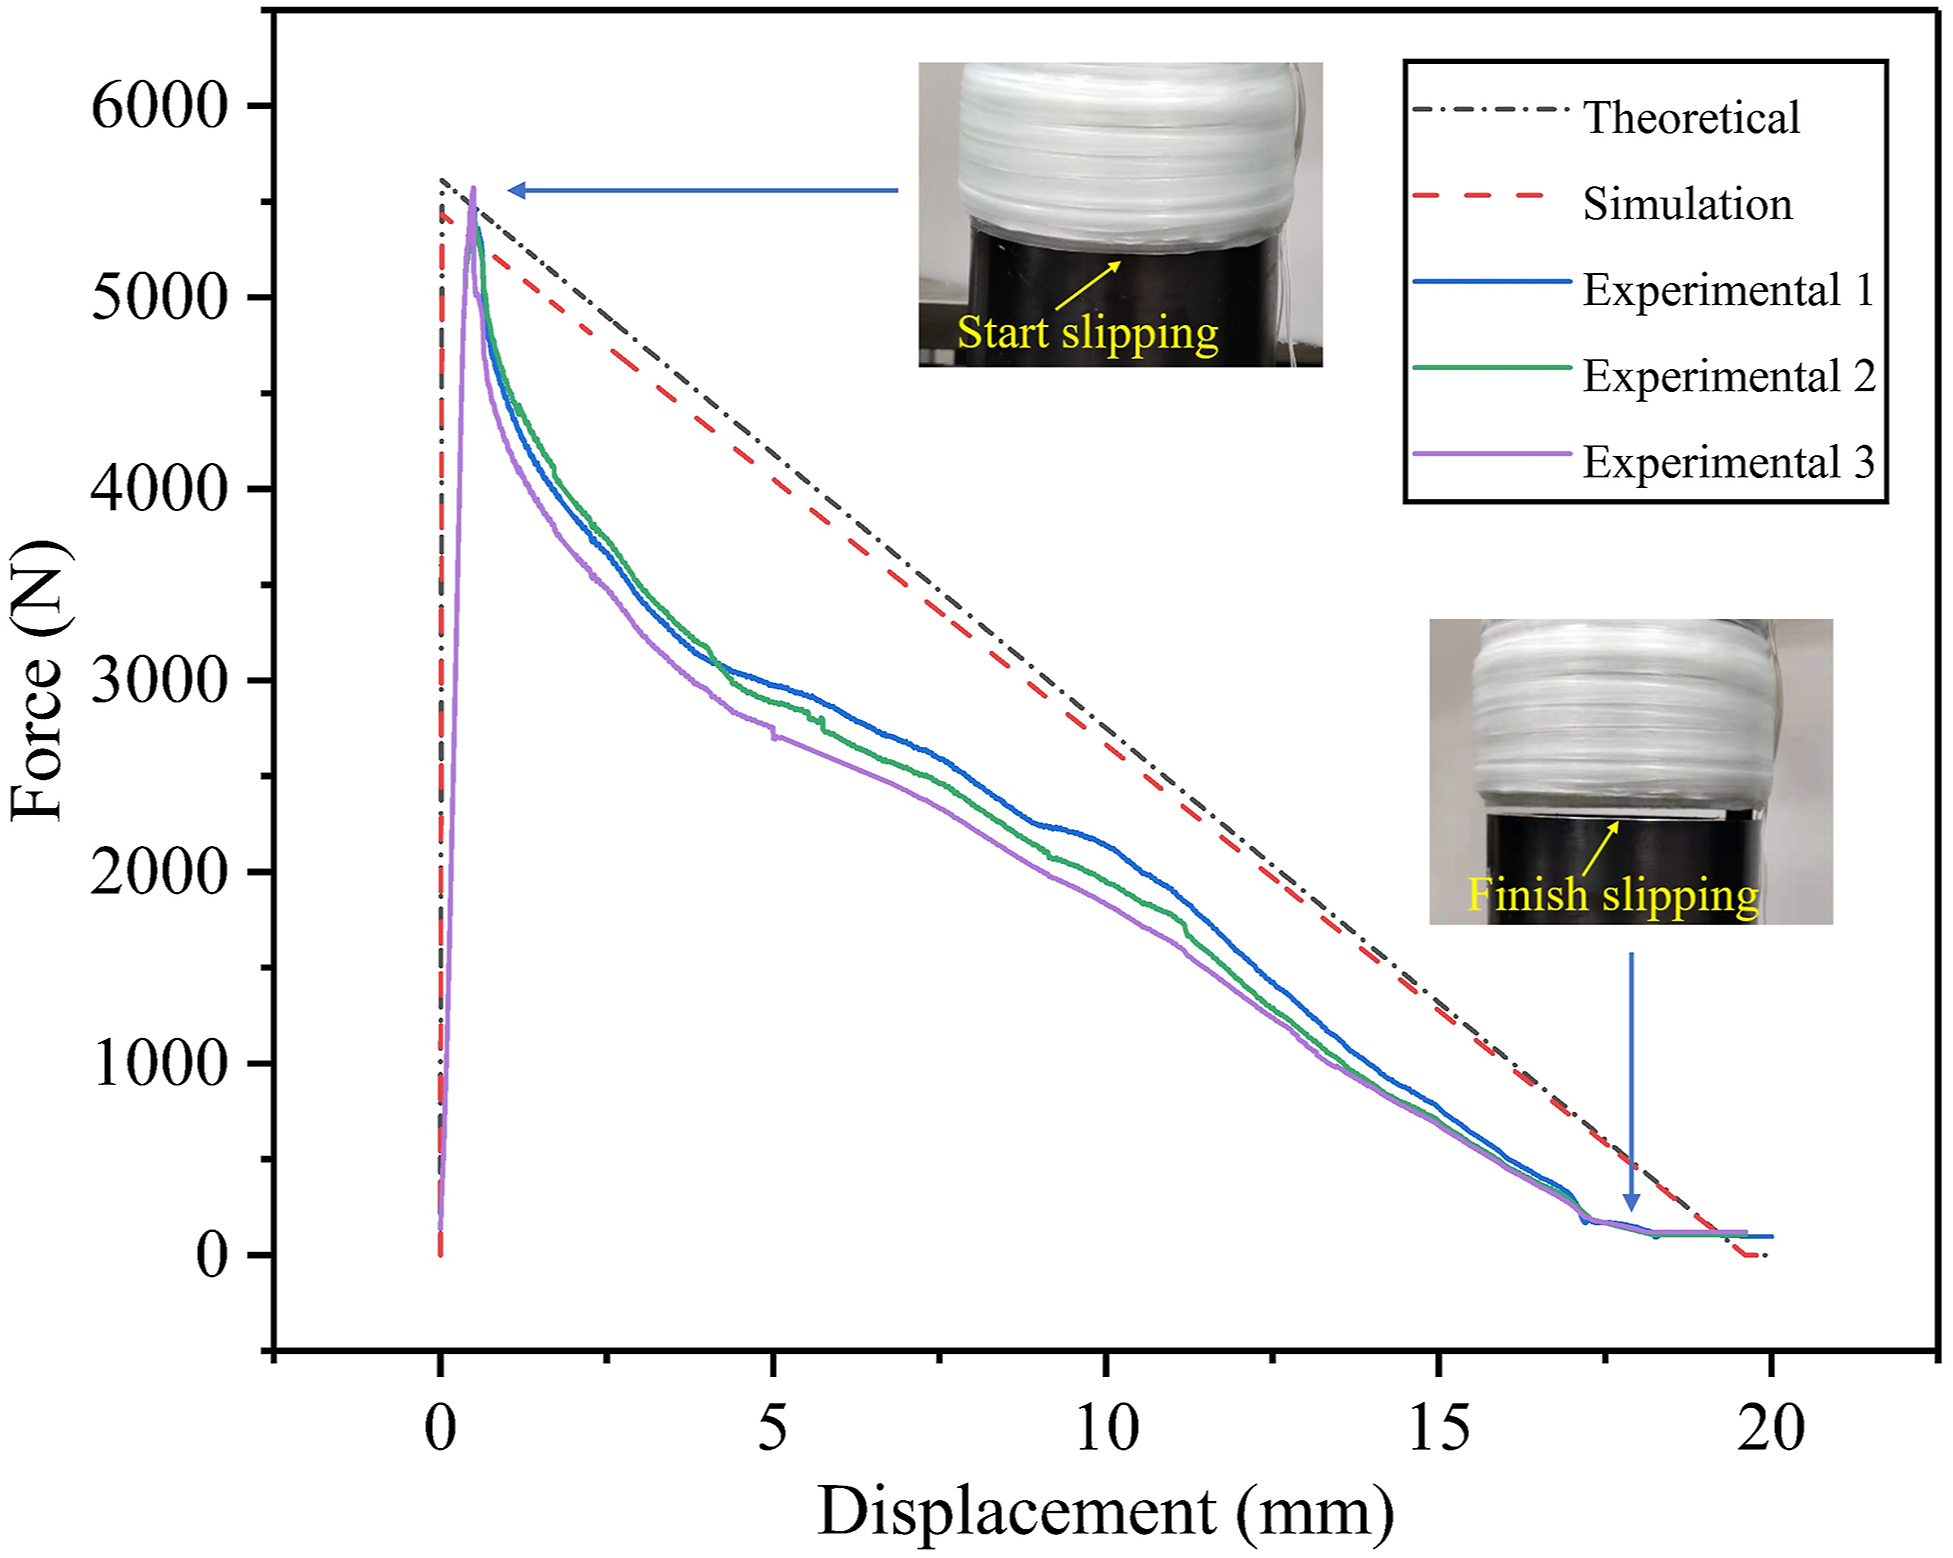
I It can be seen from Figure 12 that the average experimental peak load is 5516N, which is 1.71% error from the analytical peak force (5612N), and is 0.20% error from the simulated peak force (5527N), which is similar to the contact stress error. The reason has been explained above. Apart from this, the deviations of the three curves mainly appear in three aspects.
The first aspect is the displacement of the curve to the peak load. The analytical and simulated curves reached the peak within a short tensile displacement (about 0.07 mm), while the experimental curve reached the peak at a tensile displacement of about 0.48 mm. There may be two reasons for the large displacement at the experimental peak force. On the one hand, during the winding process of the sample, the same layer of composite is not completely dense covered in the axial direction, and there are gaps, which makes the actual average transverse modulus (that is the axial modulus) of the composite part of the sample smaller than that in the ideal state. On the other hand, there may be defects between the composite layers, resulting in the need for greater axial deformation to transmit the same load when the load is transferred between layers.
In the second aspect, after reaching the peak, as the tensile displacement continues to increase, the experimental curve first shows a rapid nonlinear decline, and then shows a linear decline. There may be three reasons for the rapid nonlinear decline of the curve. The first is that after reaching the peak, the bonding force between the composite and the metal core mold changes from static friction to sliding friction instantaneously. The second possibility is that there is a small amount of bonding between the composite material and the metal core mold when the joint is formed. As the tensile displacement increases, the bonding quickly disappears, resulting in a rapid decline in the bonding force. The third possibility is that there are internal defects during the molding of the composite tube. After the peak load is reached, the composite material is damaged internally, resulting in a nonlinear drop in the tensile curve.
The third aspect is that when the displacement of the experimental tensile curve is around 18.20 mm, the curve has reached the lowest point. This may be because when the sample is wound, due to the reversal of the winding direction, there are problems such as gaps, collapse and inadequate bonding of the winding layer at the A end, which causes the pre-tightening effect near the A end to be smaller than the middle area. When the displacement reaches 18.20 mm, only the composite material near the A end bears the load. At this time, the pre-tightening between the core mold and the composite material is very poor, and there is even no pre-tightening effect. As a result, the curve has not yet been completely pulled out and the curve has dropped to the lowest point. The lowest point of the experimental curve is not zero, and there is still a force of about 100N, which may be due to a certain internal stress generated at the joint of the mold half during the joint forming, which caused the dowel to deform, and a certain friction between the dowel and the mold was generated when the joint was pulled out.
Conclusions and future work
In this paper, the effects of friction coefficient, lap length, winding prestress and core mold material on the joint properties of thermoplastic composite—metal prestressed drive shaft are investigated by finite element method, analytical derivation, experimental verification and comparative analysis. The influence of abnormal stress at the end, stress change in the process of demolding and stress relaxation during the forming process of the joint is explained and analyzed. The distribution of contact stress and shear stress as well as stress relaxation phenomenon are emphatically analyzed. The following conclusions are drawn: Due to the end effect, the lap length is not linearly correlated with the peak torque. Increasing the lap length, the effect of the end effect will be weakened, and the finite element model has a higher coincidence with the analytical model. In addition, the demolding process increases the stress at the end of the joint by up to 9.92 times, resulting in obvious stress concentration; The influence of winding prestress and core mold material on contact stress is investigated. The results show that the larger the winding prestress is, the greater the contact stress is, but the stress relaxation phenomenon is more obvious; the higher the core modulus, the less obvious the stress relaxation. Under the same conditions, the hoop stress relaxation rate of the steel core mold is only 6.80%, while the aluminum core mold is as high as 9.08%; The shear stress distribution characteristics of the joint are analyzed. The maximum value of in-plane shear occurs in the outermost layer, while the maximum value of contact stress occurs in the innermost layer. Therefore, the ideal layering method is 90° for the inner layer and ±45° for the outer layer. The validity of the finite element method and analytical model is verified by experiments. The peak force obtained by the experiment has an error of 1.71% from the analytical peak force while only 0.20% from the simulated peak force. The defect of the analytical model mainly lies in the lack of end analysis, and the finite element method is closer to the experimental situation.
In the future work, the following aspects can be studied: (1) Further investigate the influence of prestress in non-lap zone on the overall performance and stress distribution of the joint, so as to obtain the optimal value of prestress in non-lap zone. (2) Refine the layering method and introduce 0° layering to get the best layering method. (3) Develop the algorithm of stress concentration at the joint end to make it closer to the actual state.
Footnotes
Declaration of conflicting interests
The author(s) declared no potential conflicts of interest with respect to the research, authorship, and/or publication of this article.
Funding
The author(s) disclosed receipt of the following financial support for the research, authorship, and/or publication of this article: This study is supported by the National Key Laboratory of Science and Technology on Helicopter Transmission (Nanjing University of Aeronautics and Astronautics) (HTL-A-20K01).