
Abstract
Building upon previous researches that introduced an innovative foam core hybrid-sandwich composite structure for radome applications, showcasing promising performance under low-velocity impacts (LVIs), this paper delves into the assessment of damage tolerance and mechanics through Compression After Impact (CAI) testing. The primary objective is to analyze disparities in damage tolerance, damage mechanisms, displacements, deformations, energy absorption, and residual strengths resulting from LVIs followed by CAIs on dissimilar materials on opposite faces of the hybrid structure. The extent of damage is evaluated through Computed Tomography (CT) scans. During LVIs, impacts on the S glass face sheets side demonstrated different energy dispersion and absorption mechanisms, leading to variations in indent damage depths and widths across all impact energy levels, unlike the impact damages observed from the Kevlar side. During CAI testing, this difference becomes more evident, with Kevlar specimens (KS3 & KS5) showing greater indentation depths and narrower widths, and S glass specimens (SK3 & SK5) experiencing buckling. These effects are due to the unique damage absorption and dispersion properties of Kevlar and S glass. These variations prompted an in-depth investigation of the structure using CAI to comprehend damage tolerance and mechanisms under compressive loads. This study, unparalleled in existing literature, proposes hybrid sandwich structures with superior specific impact and residual strength compared to various composite sandwich structures documented in published literature, expanding their utility beyond radomes.
Keywords
Introduction
Understanding the mechanisms of impact damage formation, morphology, and effects on the structural integrity of sandwich structures is important in aerospace applications, where safety and damage tolerance are primary concerns. 1 Most of the previous researches on sandwich structures have primarily focused on honeycomb and polyurethane foam core materials. Pizhong Qiao and X. Frank Xu carried out analytical modeling of Torsion and In-plane Shear of Honeycomb Sandwich Structures. 2 Paul Compston carried out low-velocity impact (LVI) on glass face sheet with aluminum core sandwich structures and observed ductile failure modes. 3 Hazizan et al. found that the dynamic response of sandwich structures is dependent on the elastic properties of foam-core materials. 4 Tomblin et al. characterized the impact damage on carbon fiber face sheet with nomex core sandwich composites as dependent on the diameter of the spherical steel impactor.5–7 Moody et al. reported the effects of graphite face sheets with nomex core composite sandwich panels after low-energy impact. 8 Wang et al. performed LVI on Carbon Fiber Reinforced Plastic (CFRP) face sheet with foam core and analyzed that impact response is dependent on the punch diameter and the configuration parameters of the sandwich panels. 9
Theoretical analyses and numerical modeling studies have also been undertaken on various functionally graded sandwich structures subjected to static and dynamic loading. 10 Zhou et al conducted both experimental and numerical studies on different foam cores to assess the perforation characteristics.11,12 Muhammad Basha et al. investigated and compared LVI and Compression after impact (CAI) response of CFRP in comparison with CFRP sandwich with Kevlar core. 13 Ruixiang performed CAI experiments on foam core sandwich panels and revealed that the residual compressive strength decreased with an increase in the impact energy.14,15 Giannopoulos 16 presented the results of LVI and CAI tests on a woven CFRP laminates. The main failure modes identified were face-sheet failure, matrix/core crush and interface delamination. Zhou et al. 17 carried out LVI and CAI on plain weave E glass reported that the core thickness is a critical factor in shock energy absorption.
The studies presented above suggest the gap existing in the impact damage response of the functional composite structures designed for particular applications. For instance, the radome-specific materials must possess sufficient mechanical strength to withstand aerodynamic and inertial loads while also maintaining electromagnetic transparency. The challenge of meeting these requirements, along with impact damage resistance, has not been addressed in existing literature. Given that radome structures are susceptible to impact damage both in flight and on the ground, it is crucial to assess their materials for damage resistance and tolerance behavior.
This current study introduces a specialized structure for nose radomes applications designed to endure aero/inertial loads and enhance electromagnetic performance. The structure, detailed in our prior work, 18 utilizes a foam core with S glass and Kevlar face sheets for impact resistance and UV protection, respectively. 19 The proposed structure exhibited superior specific impact strength performance as compared to various structures available in published literature. 20 This necessitated a detailed study to understand damage mechanics and tolerance due to compressive loads after impact of specimen at low velocities. While some findings align with existing literature, a unique revelation during LVIs pertains to dissimilar impact responses observed when S glass is impacted with Kevlar on the bottom face (SK3 and SK5) versus the reverse scenario (i.e., KS3 and KS5) where Kevlar face sheets are impacted. These variations during LVIs lead to the differences in damage tolerance and mechanics during compressive loads due to differences in energy dissipation/absorption. Beyond novelty, our proposed structure exhibits superior specific impact/residual strength compared to various sandwich composite structures documented in the published literature expanding its utility beyond radomes. Additionally, this study provides essential insights for designers and practitioners for material selection and configurations specific to impact damage resistance and tolerance requirements.
Materials selection, configurations, and fabrication
This study involved compression after impact (CAI) testing on specimens already undergone Low Velocity Impact (LVI) at different energy levels.
20
Four different configurations have been selected based on our previous work. The SK3 and SK5 identify the number of layers for the face sheets as three and five, respectively, and impact has been made on S glass face. On the other hand KS3 and KS5 implies number of layers for the face sheets as three and five, respectively, and impacts are made on Kevlar face. For this research, commercially available plain weave S glass and Kevlar as face sheets with 4 mm thick ROHA cell foam as core have been used as depicted in Figure 1. Schematics of composite sandwich specimens; SK3, KS3, KS5, and SK5.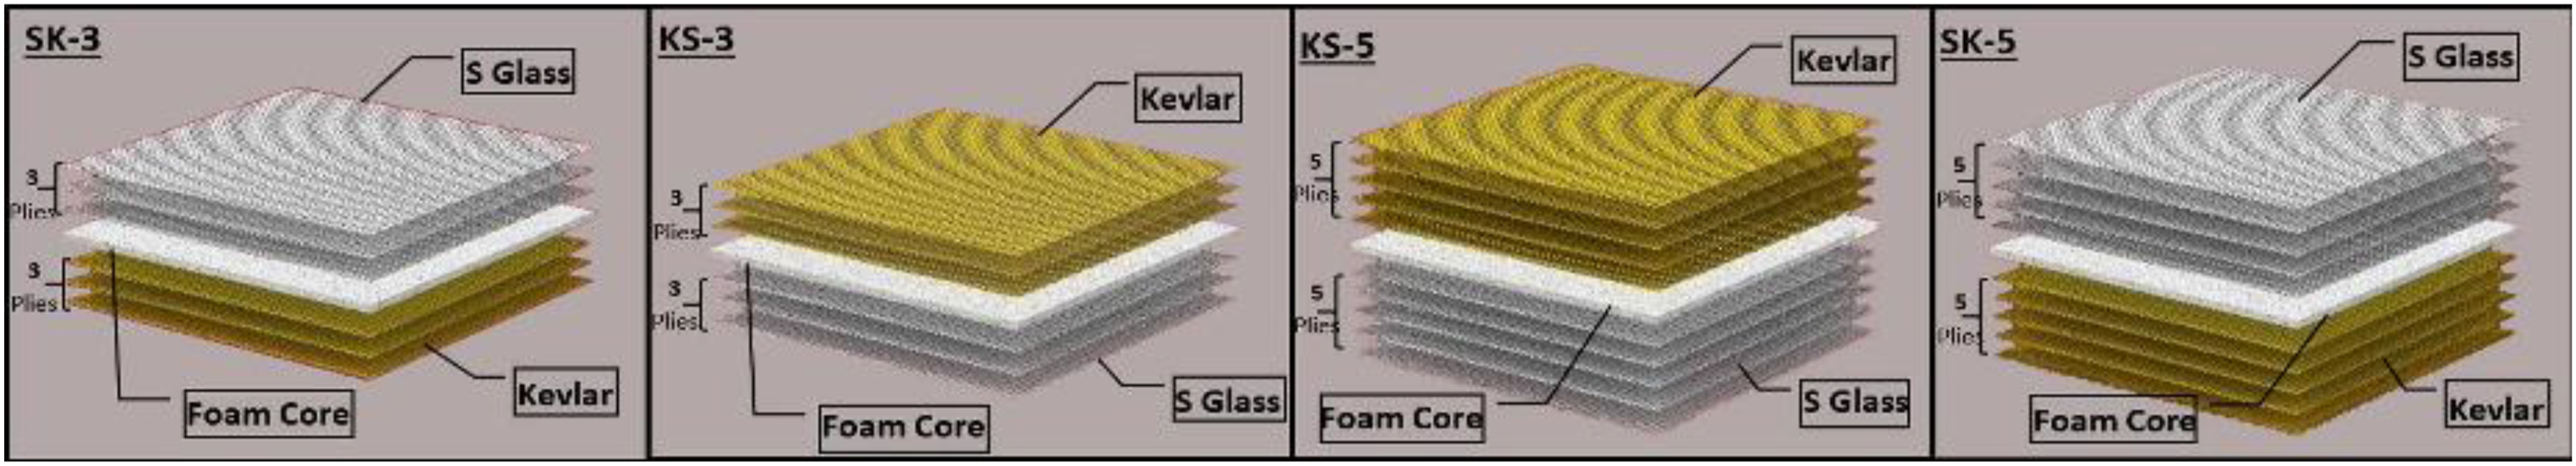
Properties of materials used in the layup.
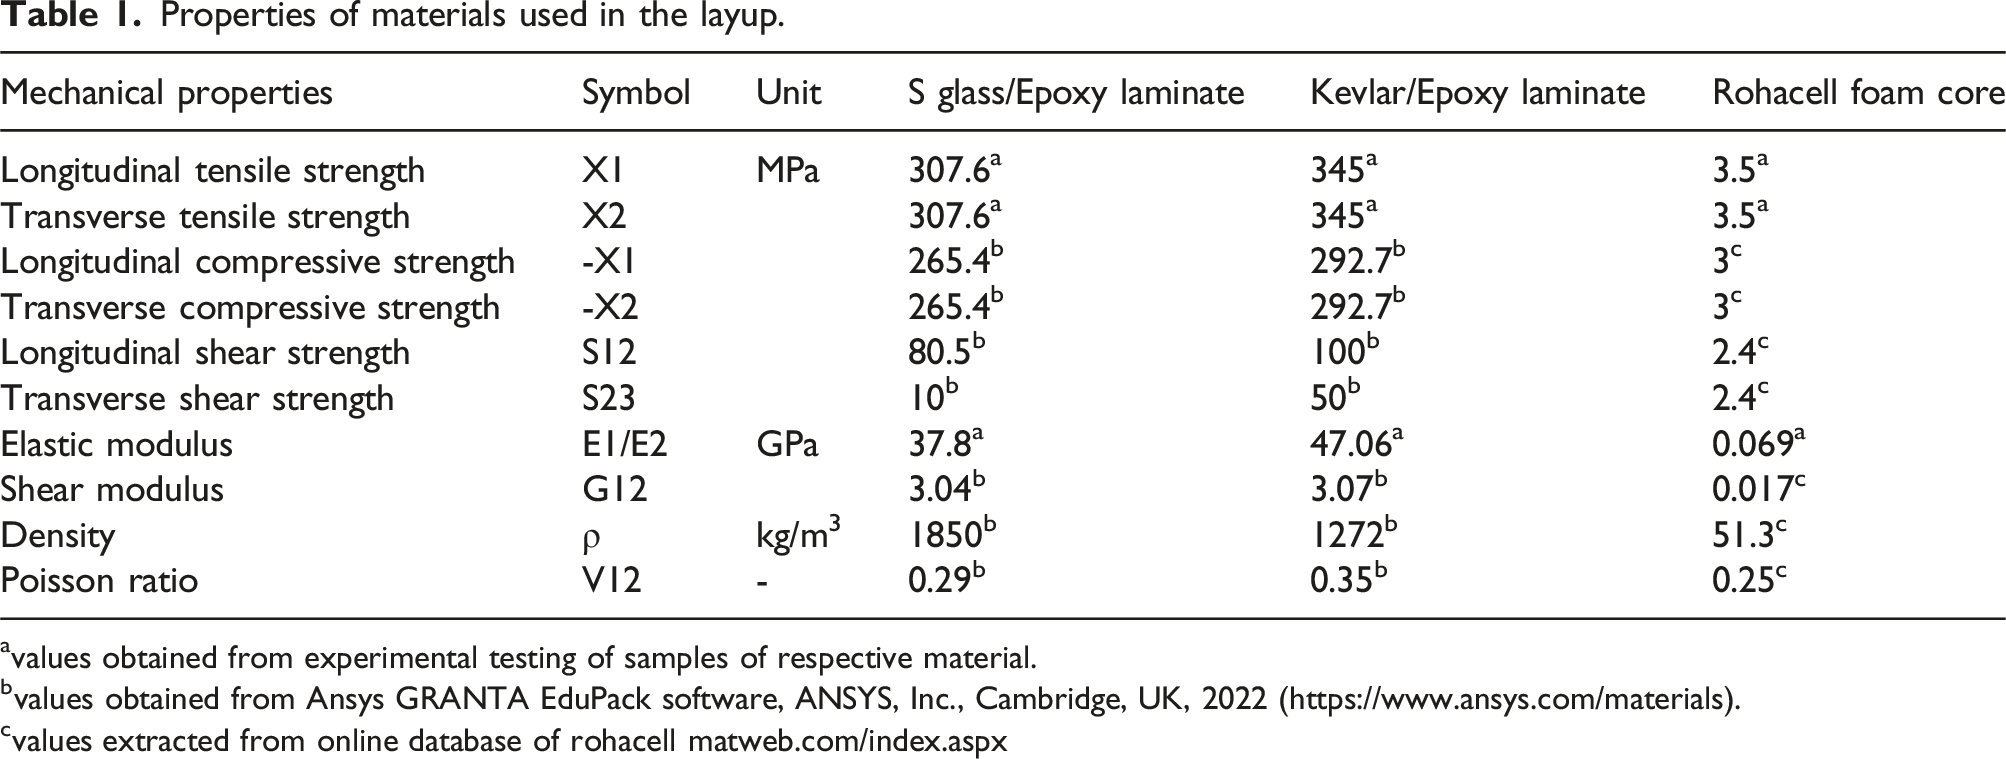
avalues obtained from experimental testing of samples of respective material.
bvalues obtained from Ansys GRANTA EduPack software, ANSYS, Inc., Cambridge, UK, 2022 (https://www.ansys.com/materials).
cvalues extracted from online database of rohacell matweb.com/index.aspx
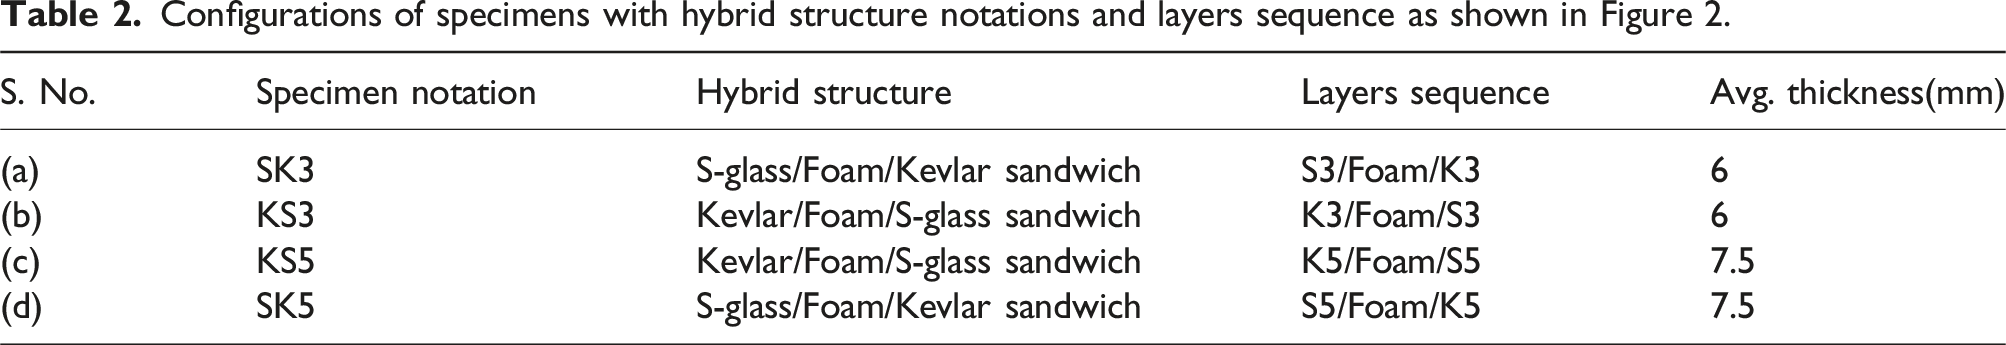
Configurations of specimens with hybrid structure notations and layers sequence as shown in Figure 2.
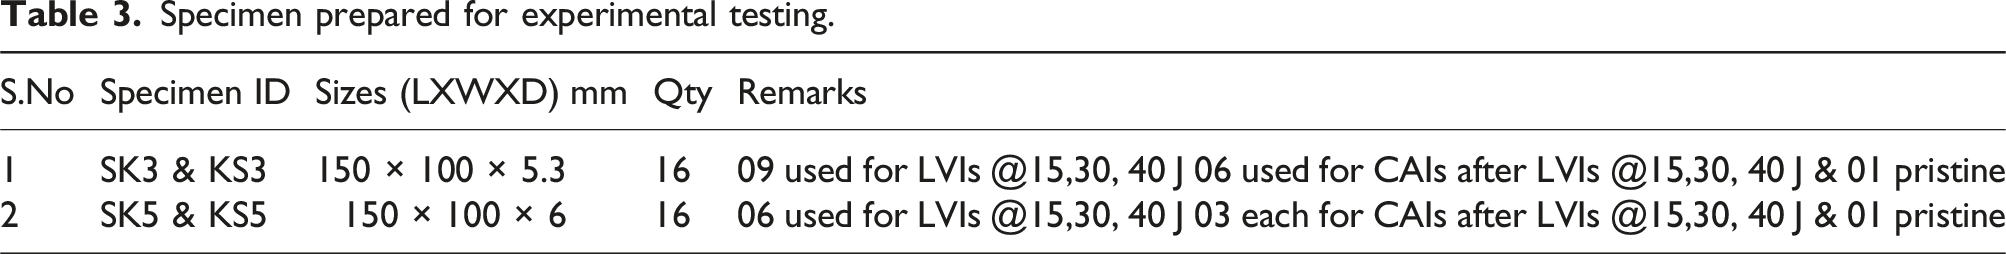
Facesheets and cross section of samples prepared is depicted in Figure 2. A minimum of 03 samples of SK3, KS3, SK5, and KS5 were tested under LVIs at all levels and subsequent CAIs, also pristine specimens of the respected coupons were kept for comparative analysis. The specimens prepared are mentioned in Table 3. Original samples (a) Kevlar Face sheet (b) S glass Face sheet (c) Side view. Specimen prepared for experimental testing.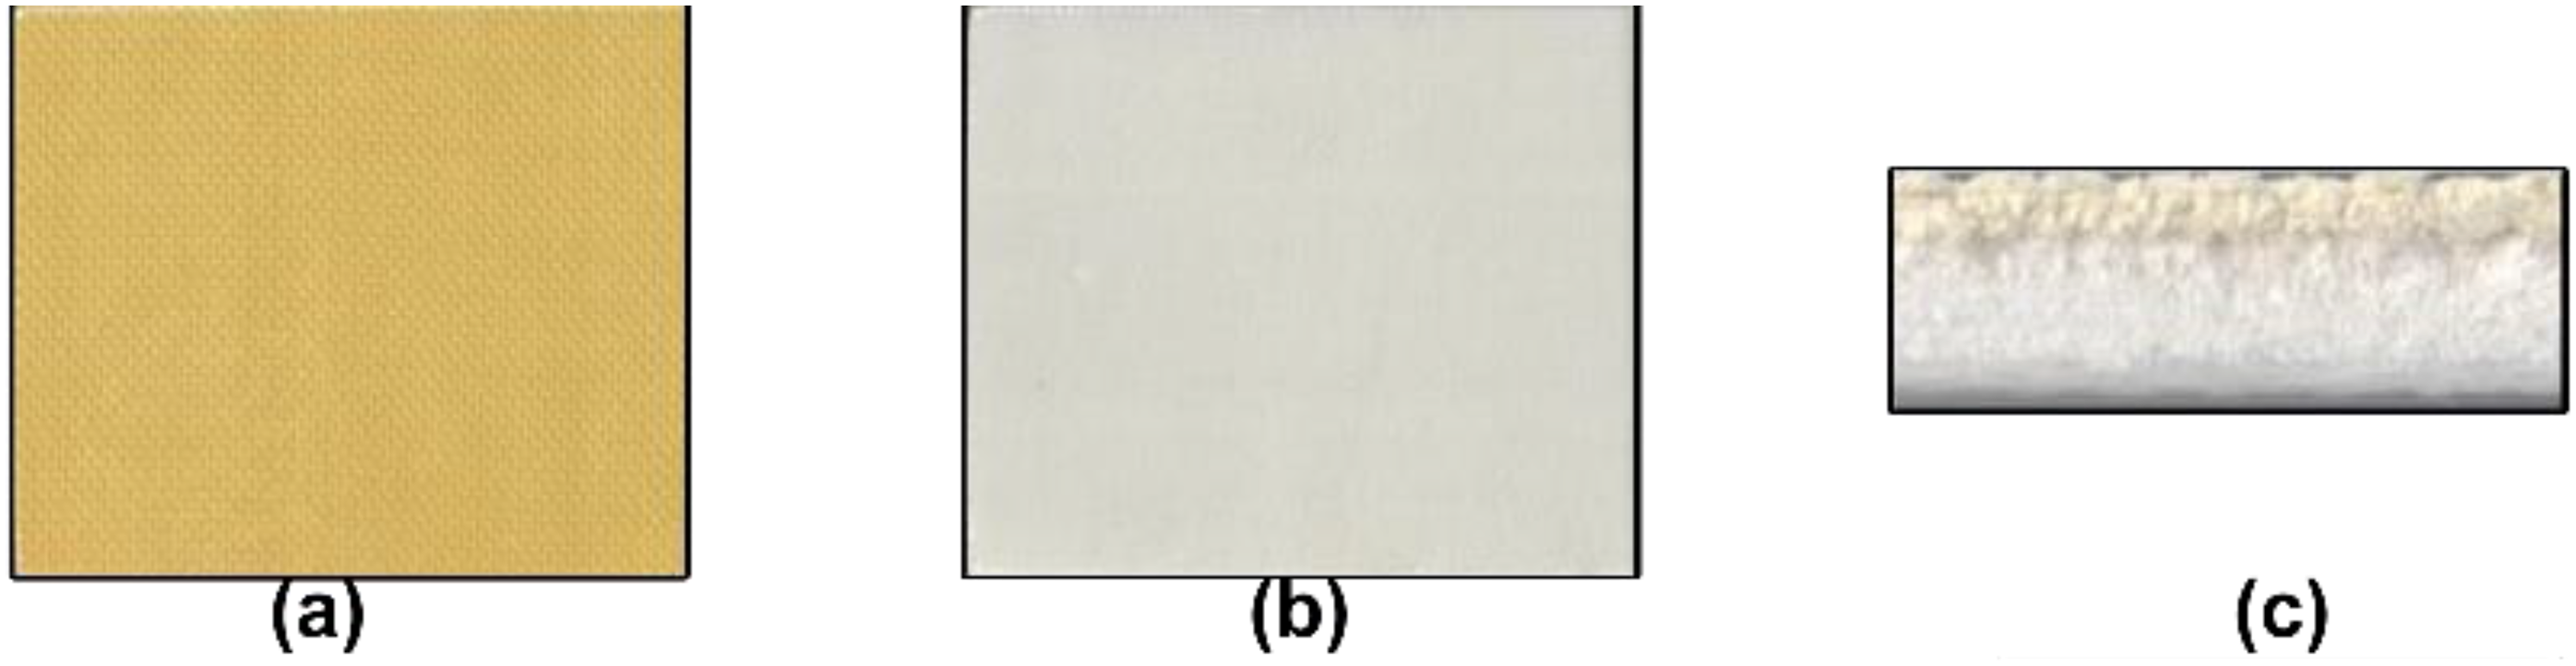
Experimental testing of hybrid sandwich composite laminates
Low velocity impact test
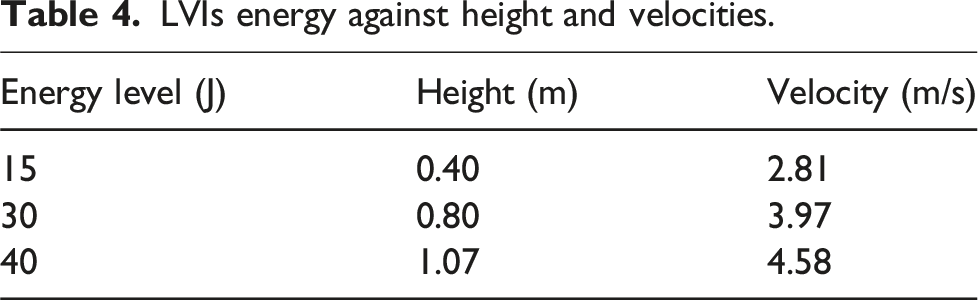
A Drop-Weight Impact Tester HIT 230F from Zwick–Roell shown in Figure 3(a) was employed to carry out Low Velocity Impact (LVI) tests in accordance with ASTM-D7136 standard. The apparatus includes a top insert that features a perfectly rigid, hemispherical stainless-steel nose with a diameter of 16 mm with impactor mass of 3.80 kg. In this study, the apparatus was used to conduct low velocity impacts at energy levels of 15, 30, and 40 J. By varying the impact height, the response of the test specimens under different energy levels was evaluated, providing valuable insights into their damage resistance and structural integrity across varying energy levels. The experiment schematic is shown in Figure 3(b). The impactor height and velocities are mentioned in Table 4. (a). LVI Testing using drop weight impact tester. (b) Drop weight impact testing; (a) testing setup schematic (b) testing setup. LVIs energy against height and velocities.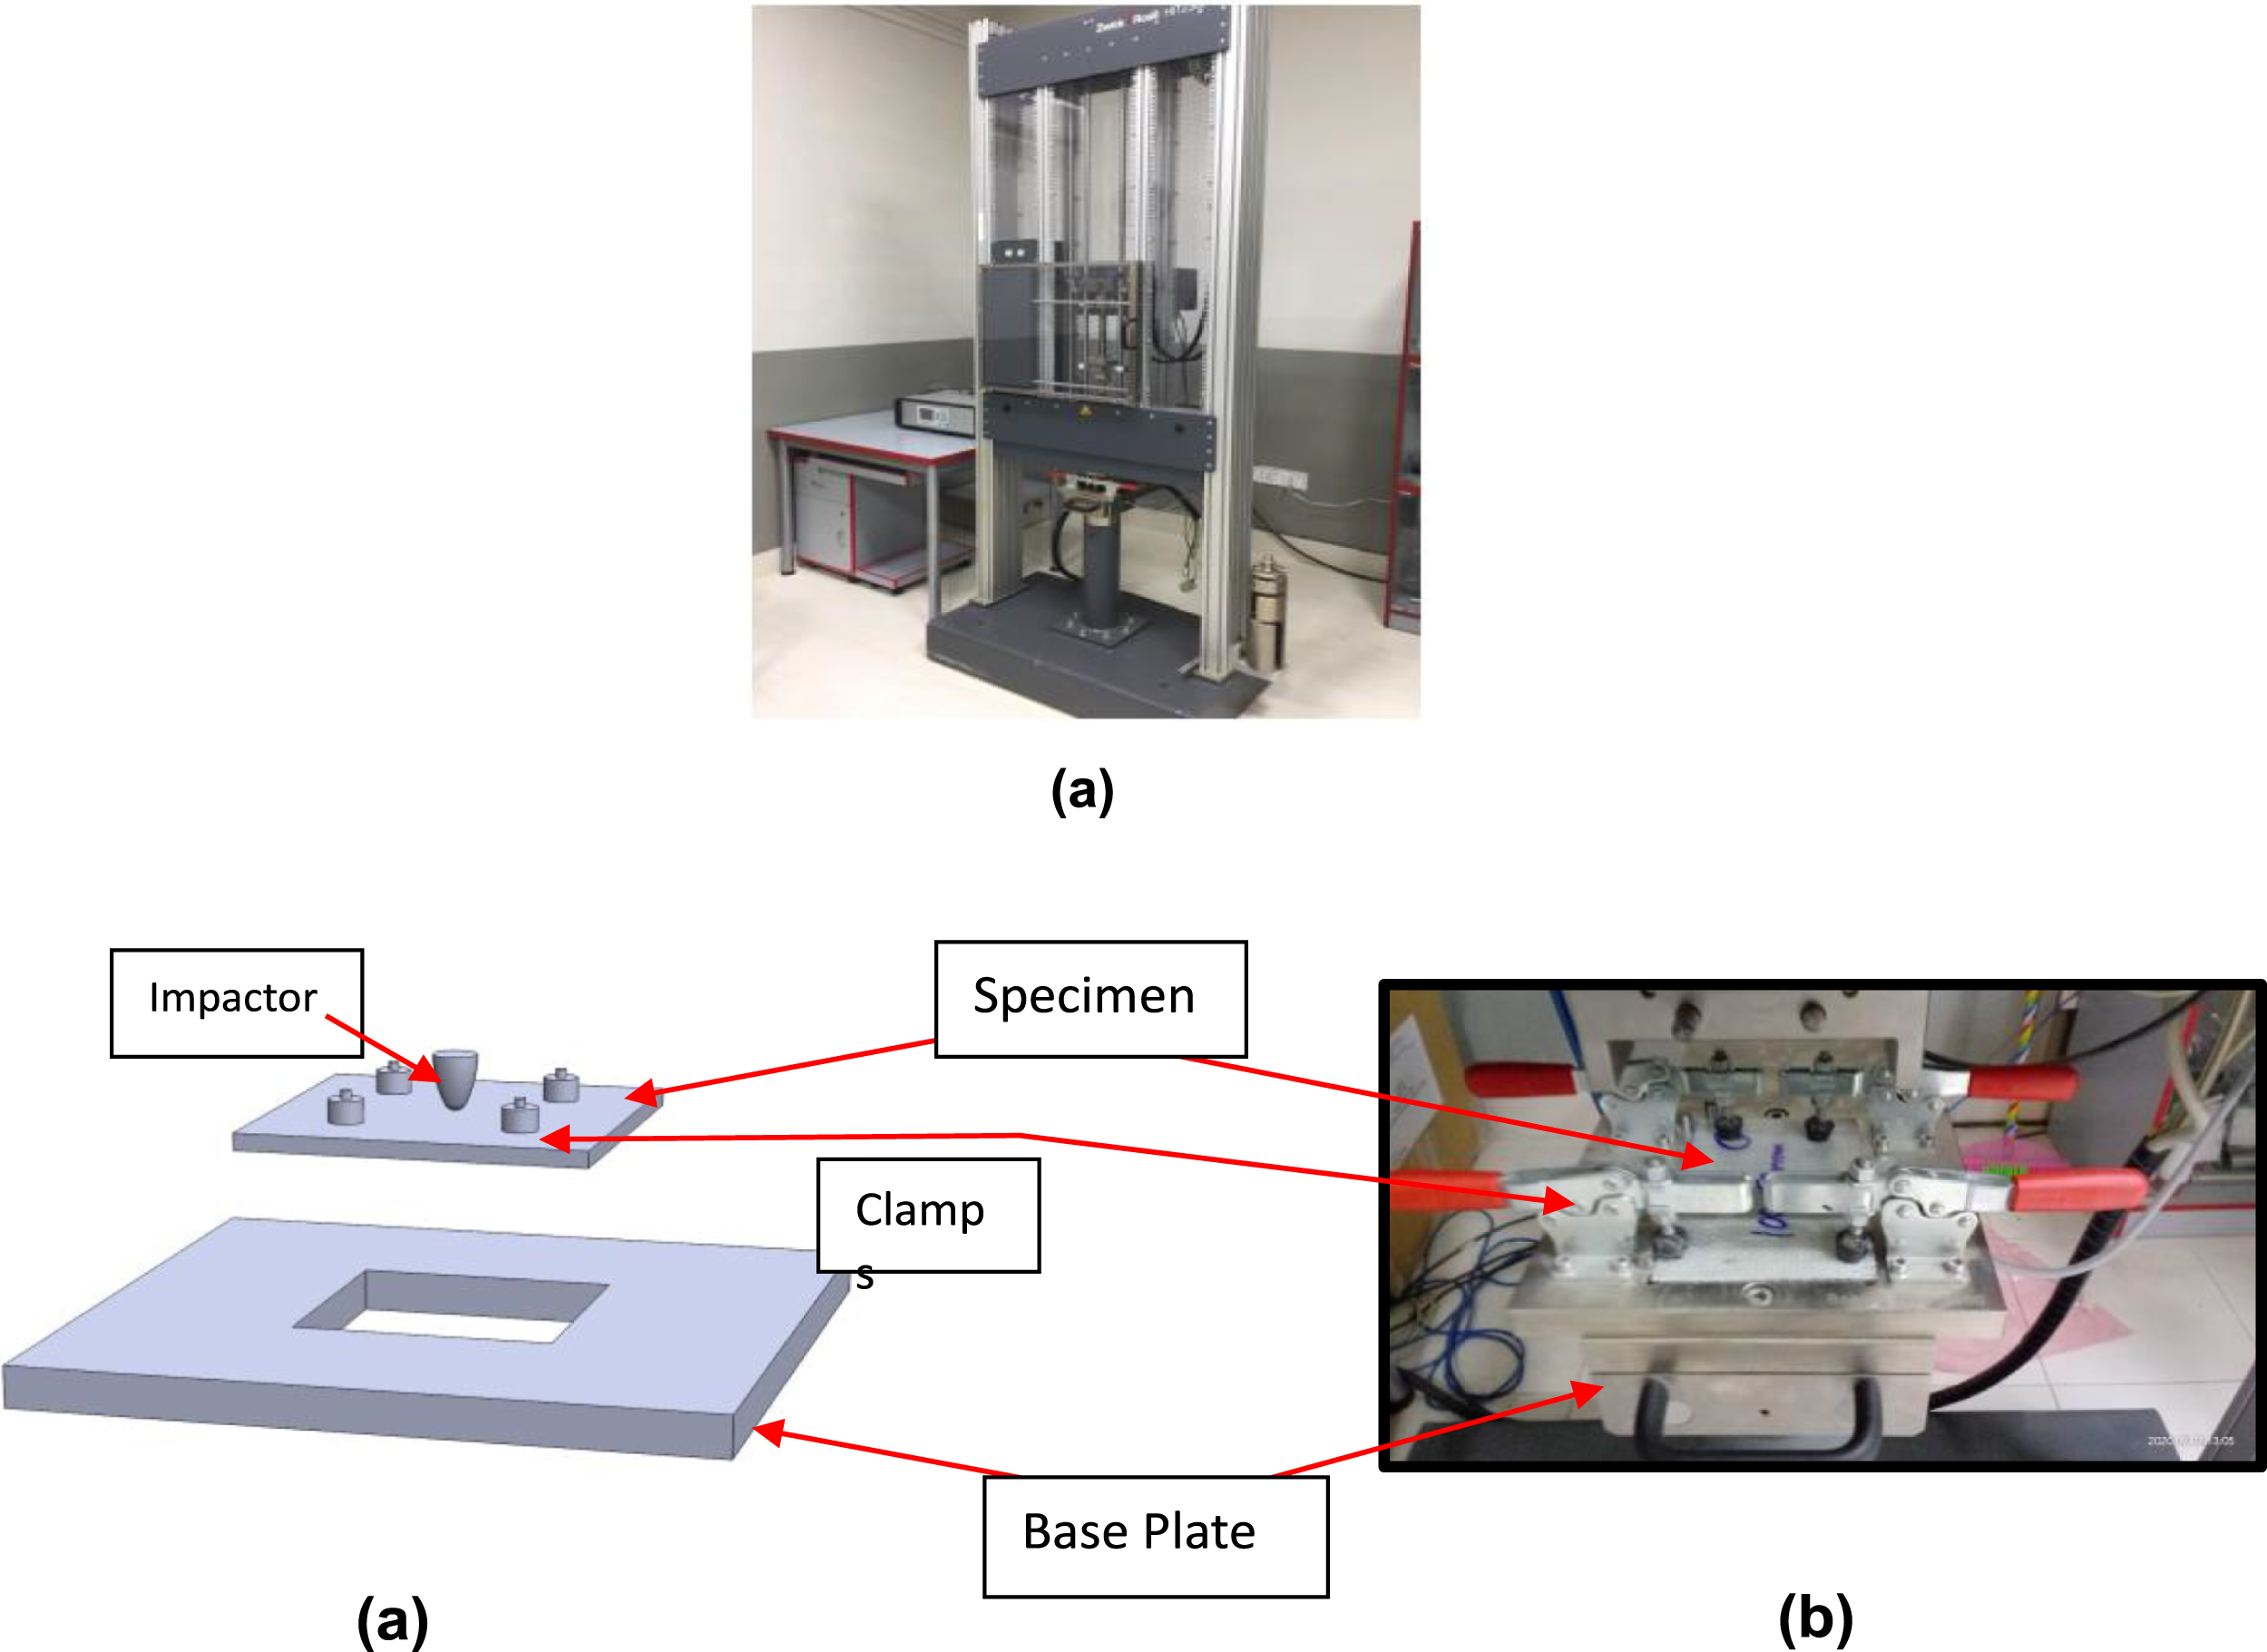
Compression after impact testing
To evaluate the residual compressive strength, compression after impact (CAI) testing was conducted in accordance with ASTM D7137 standards. This testing method is essential for assessing the residual strength of composite materials after they have been subjected to impact damage.
A universal testing machine, with a loading capacity of 100 kN was utilized to apply compressive loads to the specimens. The load was applied at a constant rate of 1 mm/min to ensure uniform and controlled testing conditions.
The test fixture as shown in Figure 4 was used for the CAI testing is specifically designed to constrain the specimen’s motion in all degrees of freedom except the longitudinal direction. This design ensures that the compressive force is applied perpendicularly to the cross-section of the coupon, promoting proper compressive behavior and accurate measurement of the material’s residual strength. The fixture, made out of 5130 steel, has dimensions of 35 mm × 76 mm × 198 mm, providing a robust and stable setup for the testing process. Compression after impact (CAI) fixture.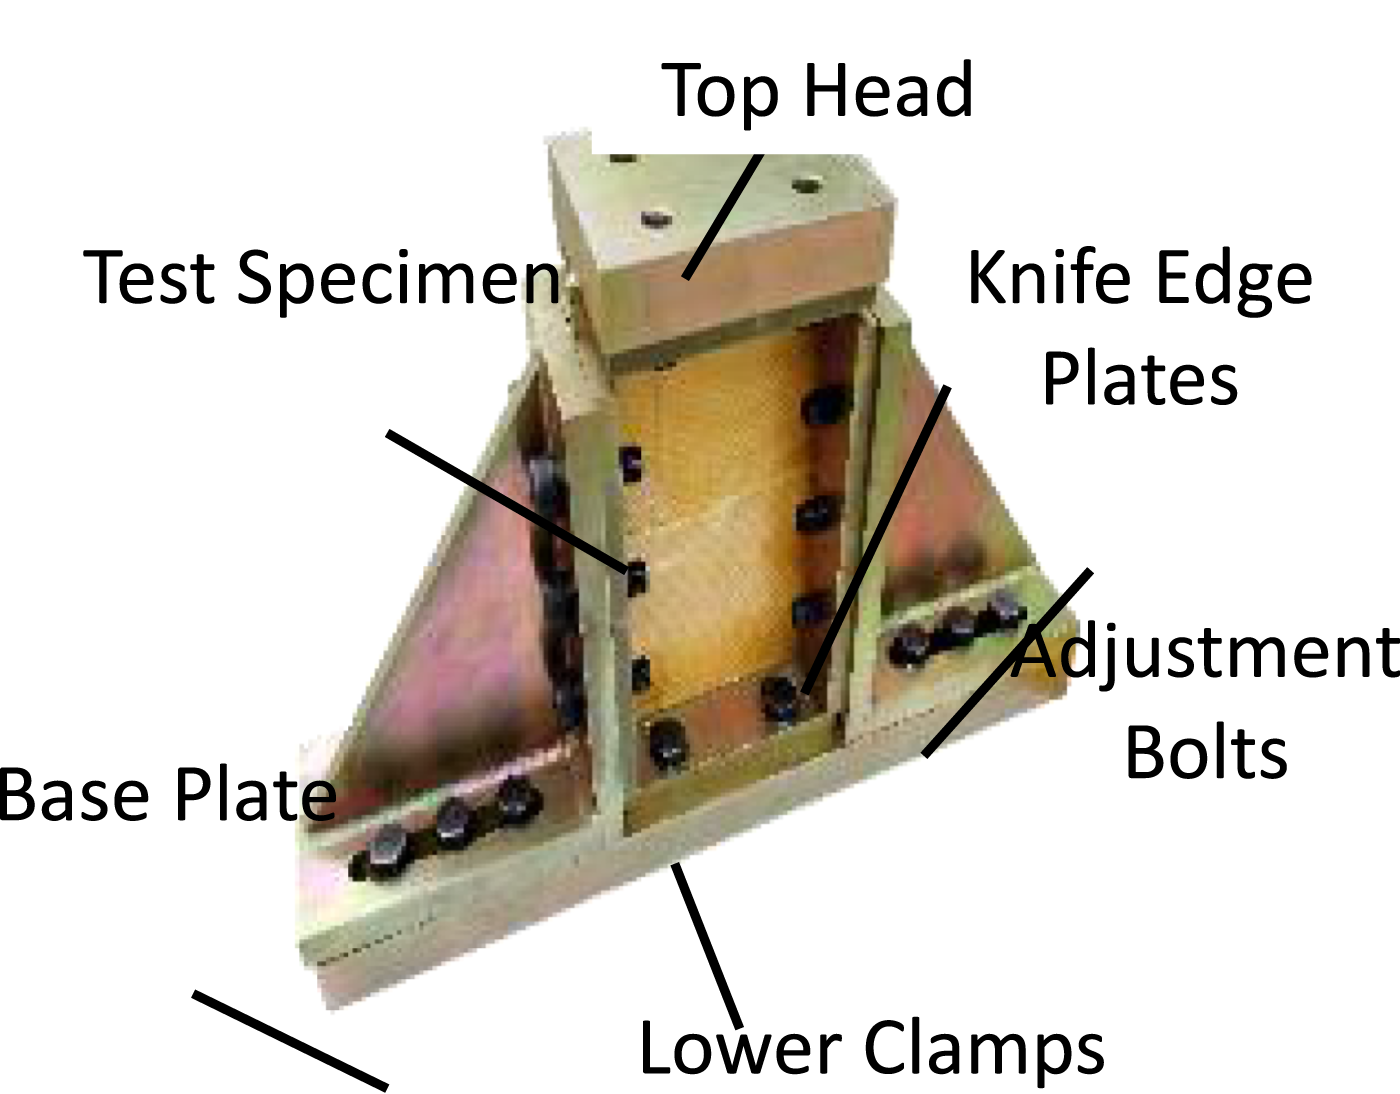
The specimens, which had previously undergone Low Velocity Impact (LVI) testing, were subjected to compression to assess their load-bearing capacity and energy absorption characteristics post-impact. This step is crucial in understanding how the materials behave under compressive loads after experiencing impact damage, which provides valuable insights into their structural integrity and performance in real-world applications.
Computed tomography scanning
Computed Tomography (CT) scans were conducted to analyze the internal damage mechanics of specimens. The results are presented in Figures 7 and 8 (post LVIs), and Figures 10 and 11 (post CAIs).
Results and discussions
The discussion provides an overview of LVIs’ results, leading to exploration of CAI performance. The aim is to elucidate the impact and compression after impact induced damage mechanisms, specifically attributed to dissimilar face sheet foam core sandwich materials of varying thicknesses. This study specifically distinguishes between displacements and deformations. Displacements represent the maximum elastic distance under the impact load, occasionally exceeding the sample thickness itself.19,20 Conversely, deformations manifest as physical damages, taking the form of indents or cracks on the specimen.
Damage resistance & mechanics under low-velocity impacts
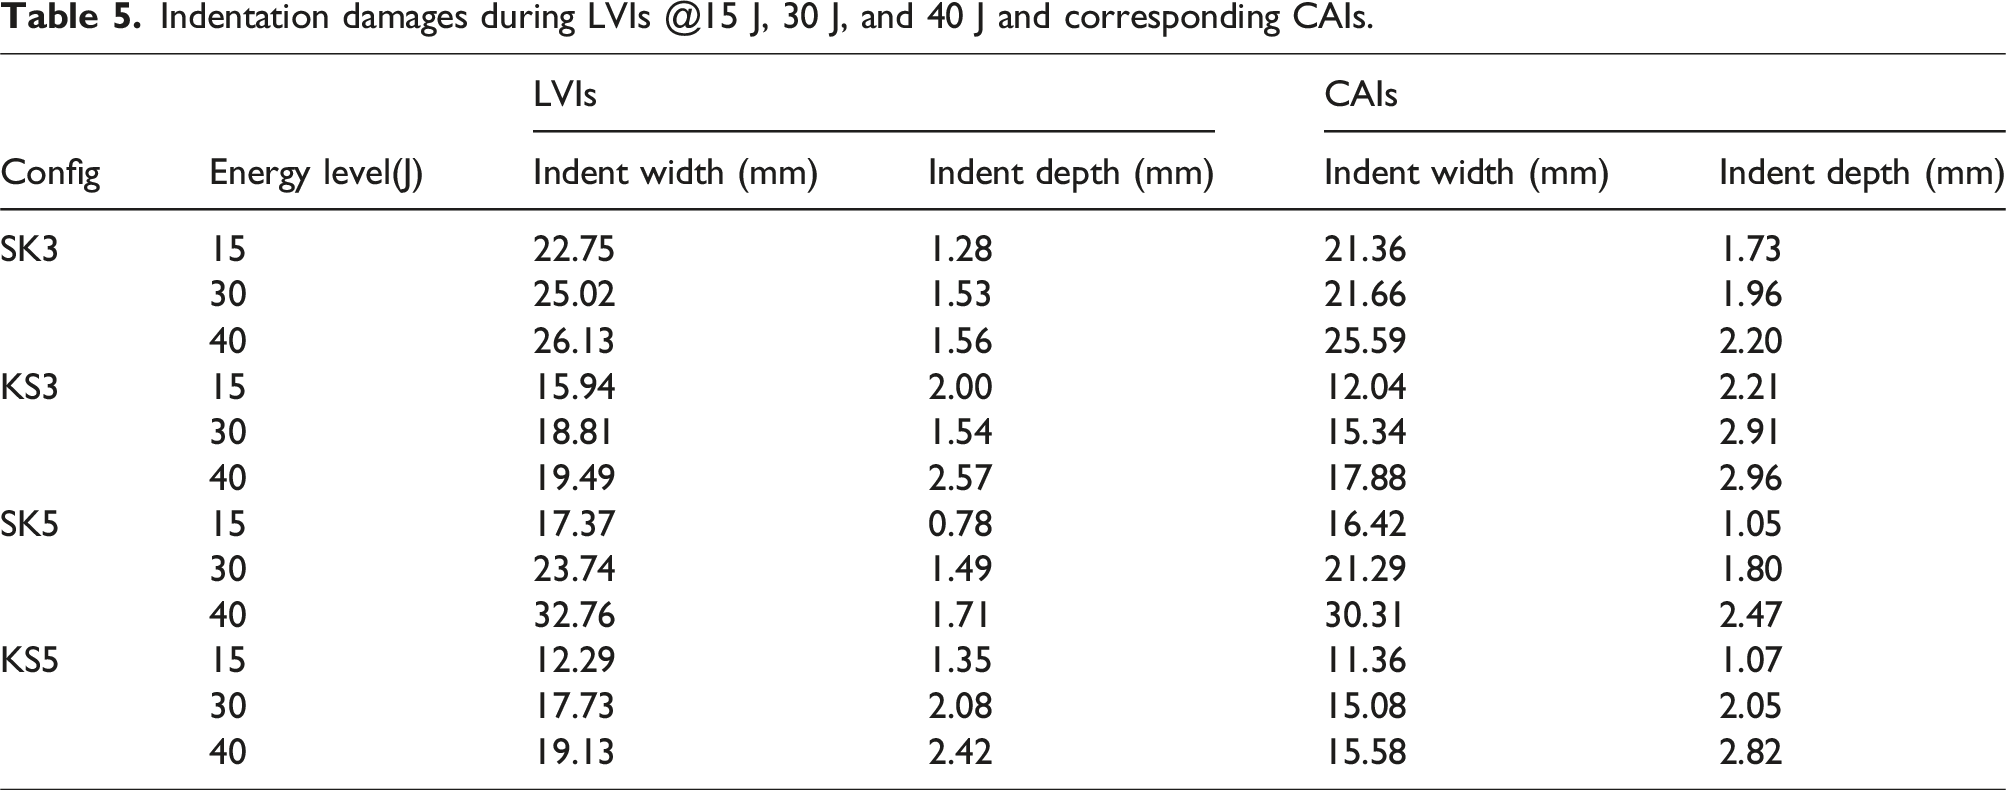
Indentation damages during LVIs @15 J, 30 J, and 40 J and corresponding CAIs.
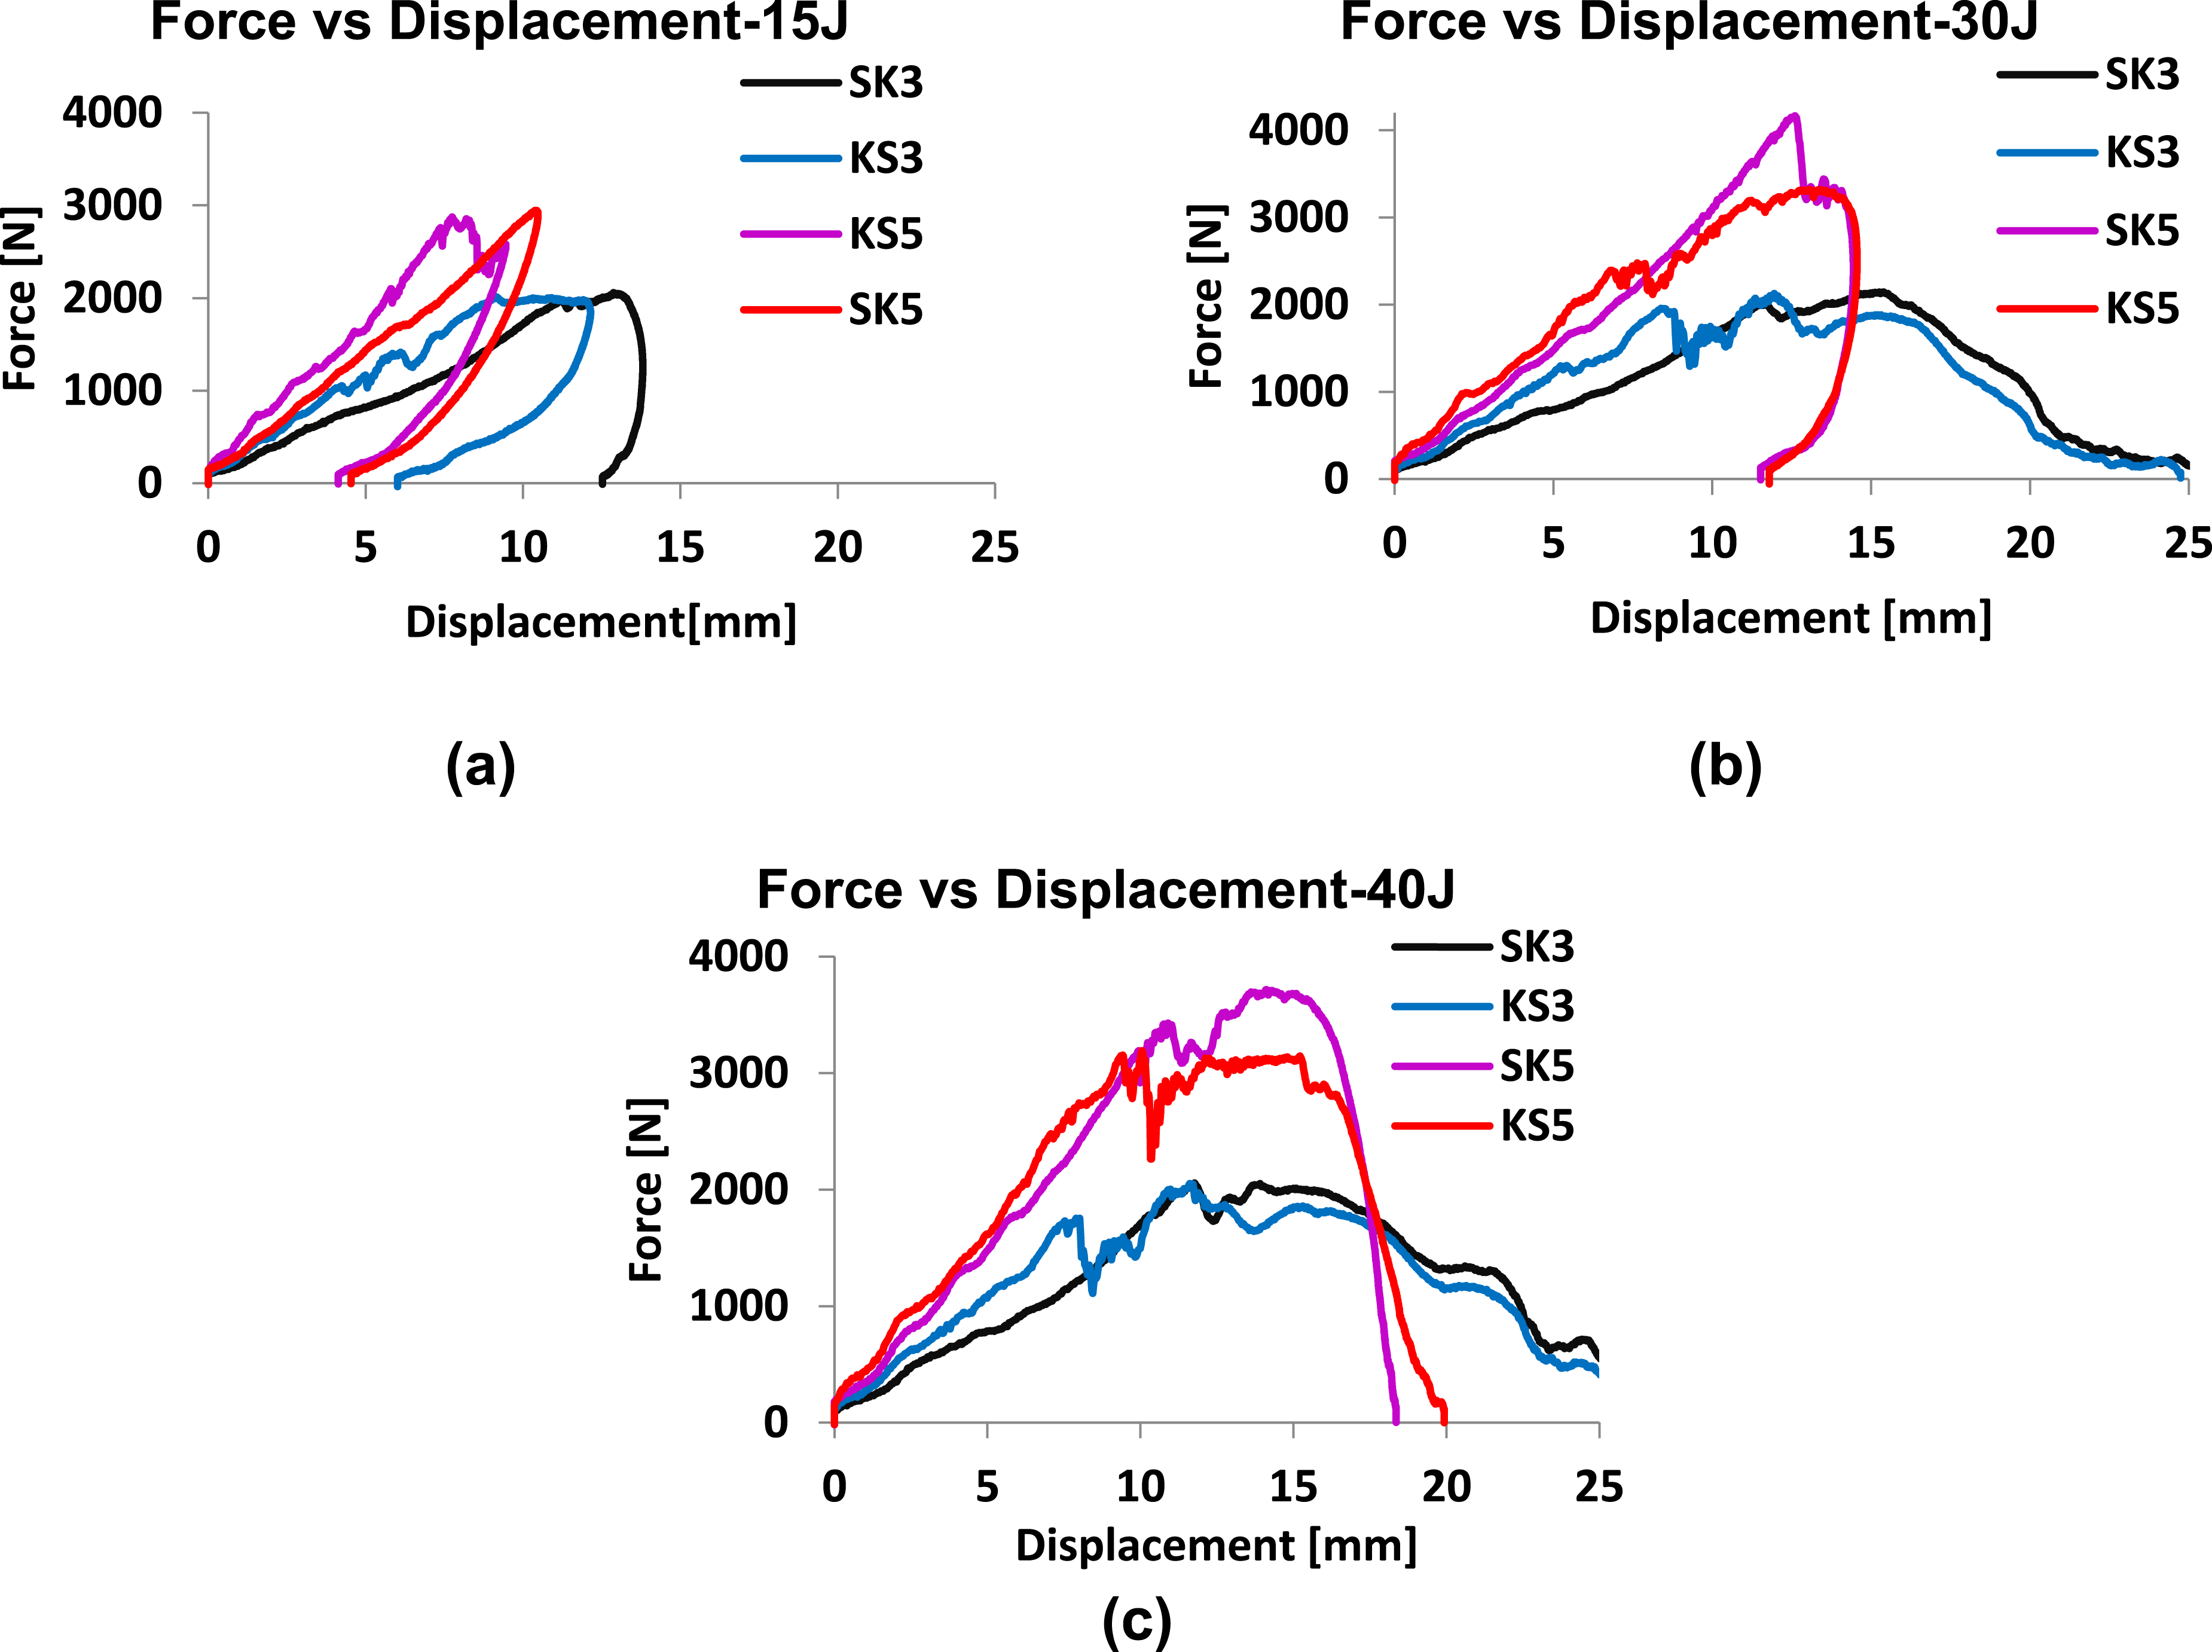
LVIs force versus displacement graphs (a) 15 J, (b) 30 J, and (c) 40 J.
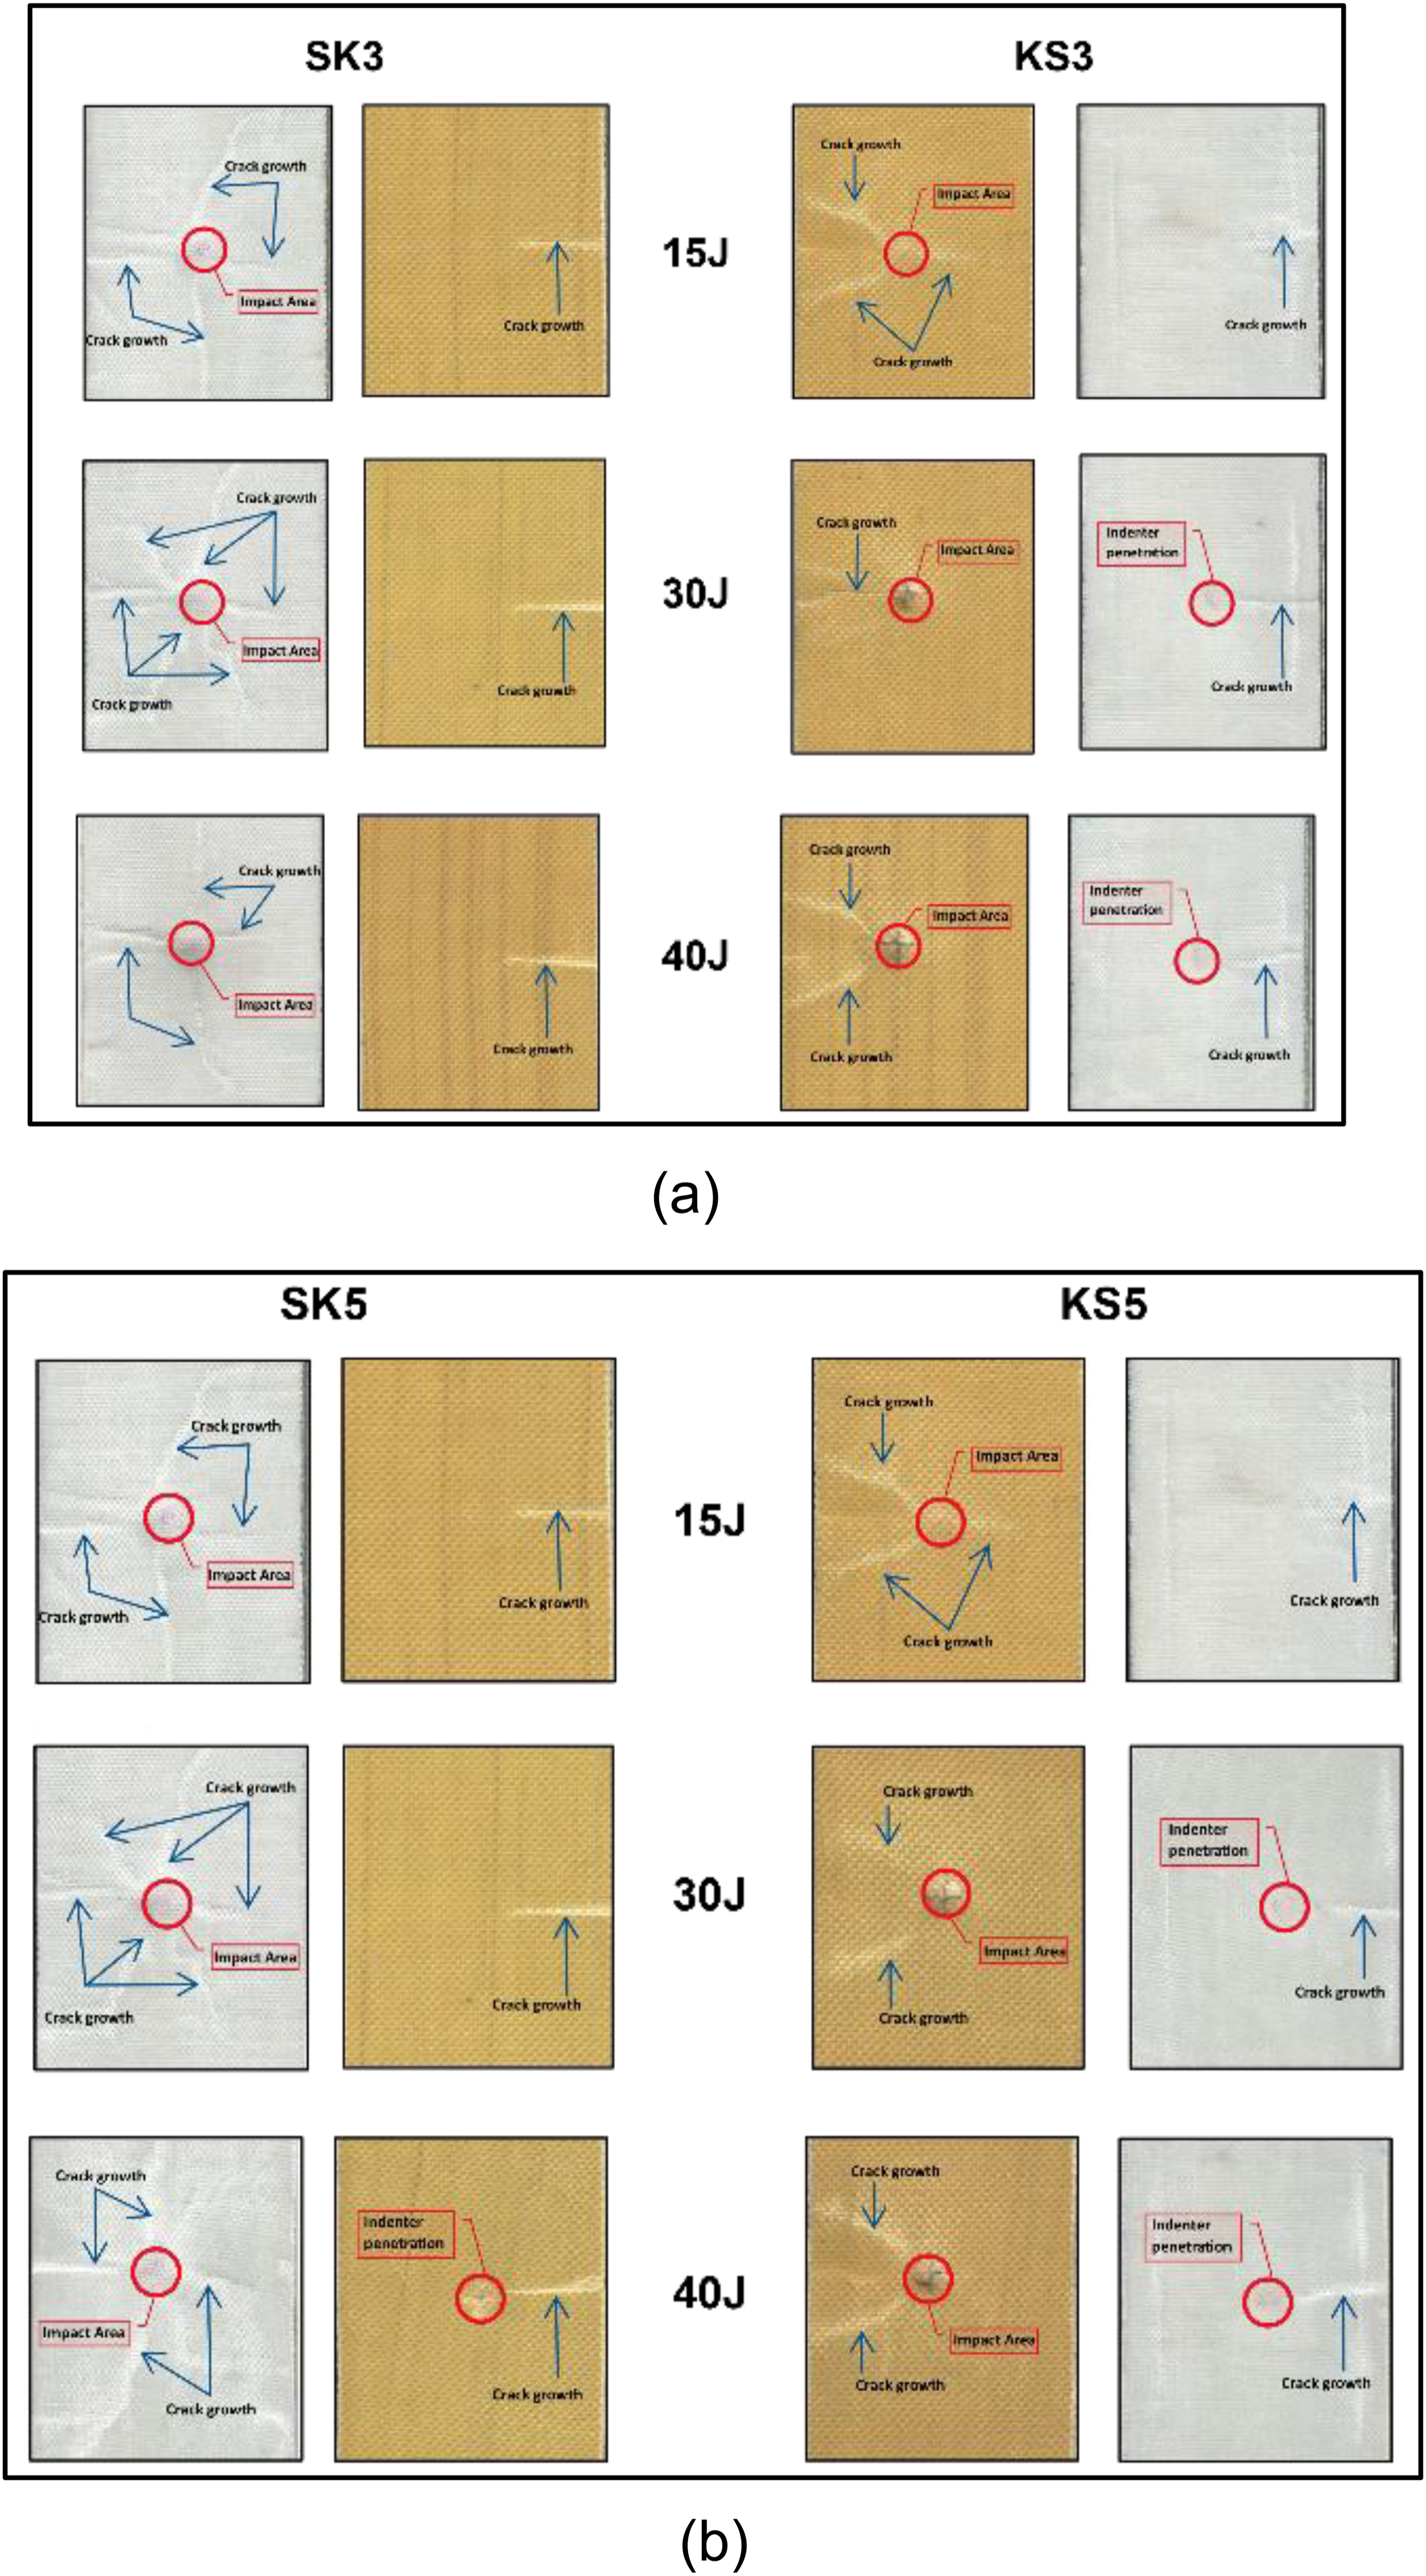
Face sheet damage after LVIs at 15 J, 30 J, and 40 J Impact Energy (a) SK3 & KS3 (b) SK5 & KS5.
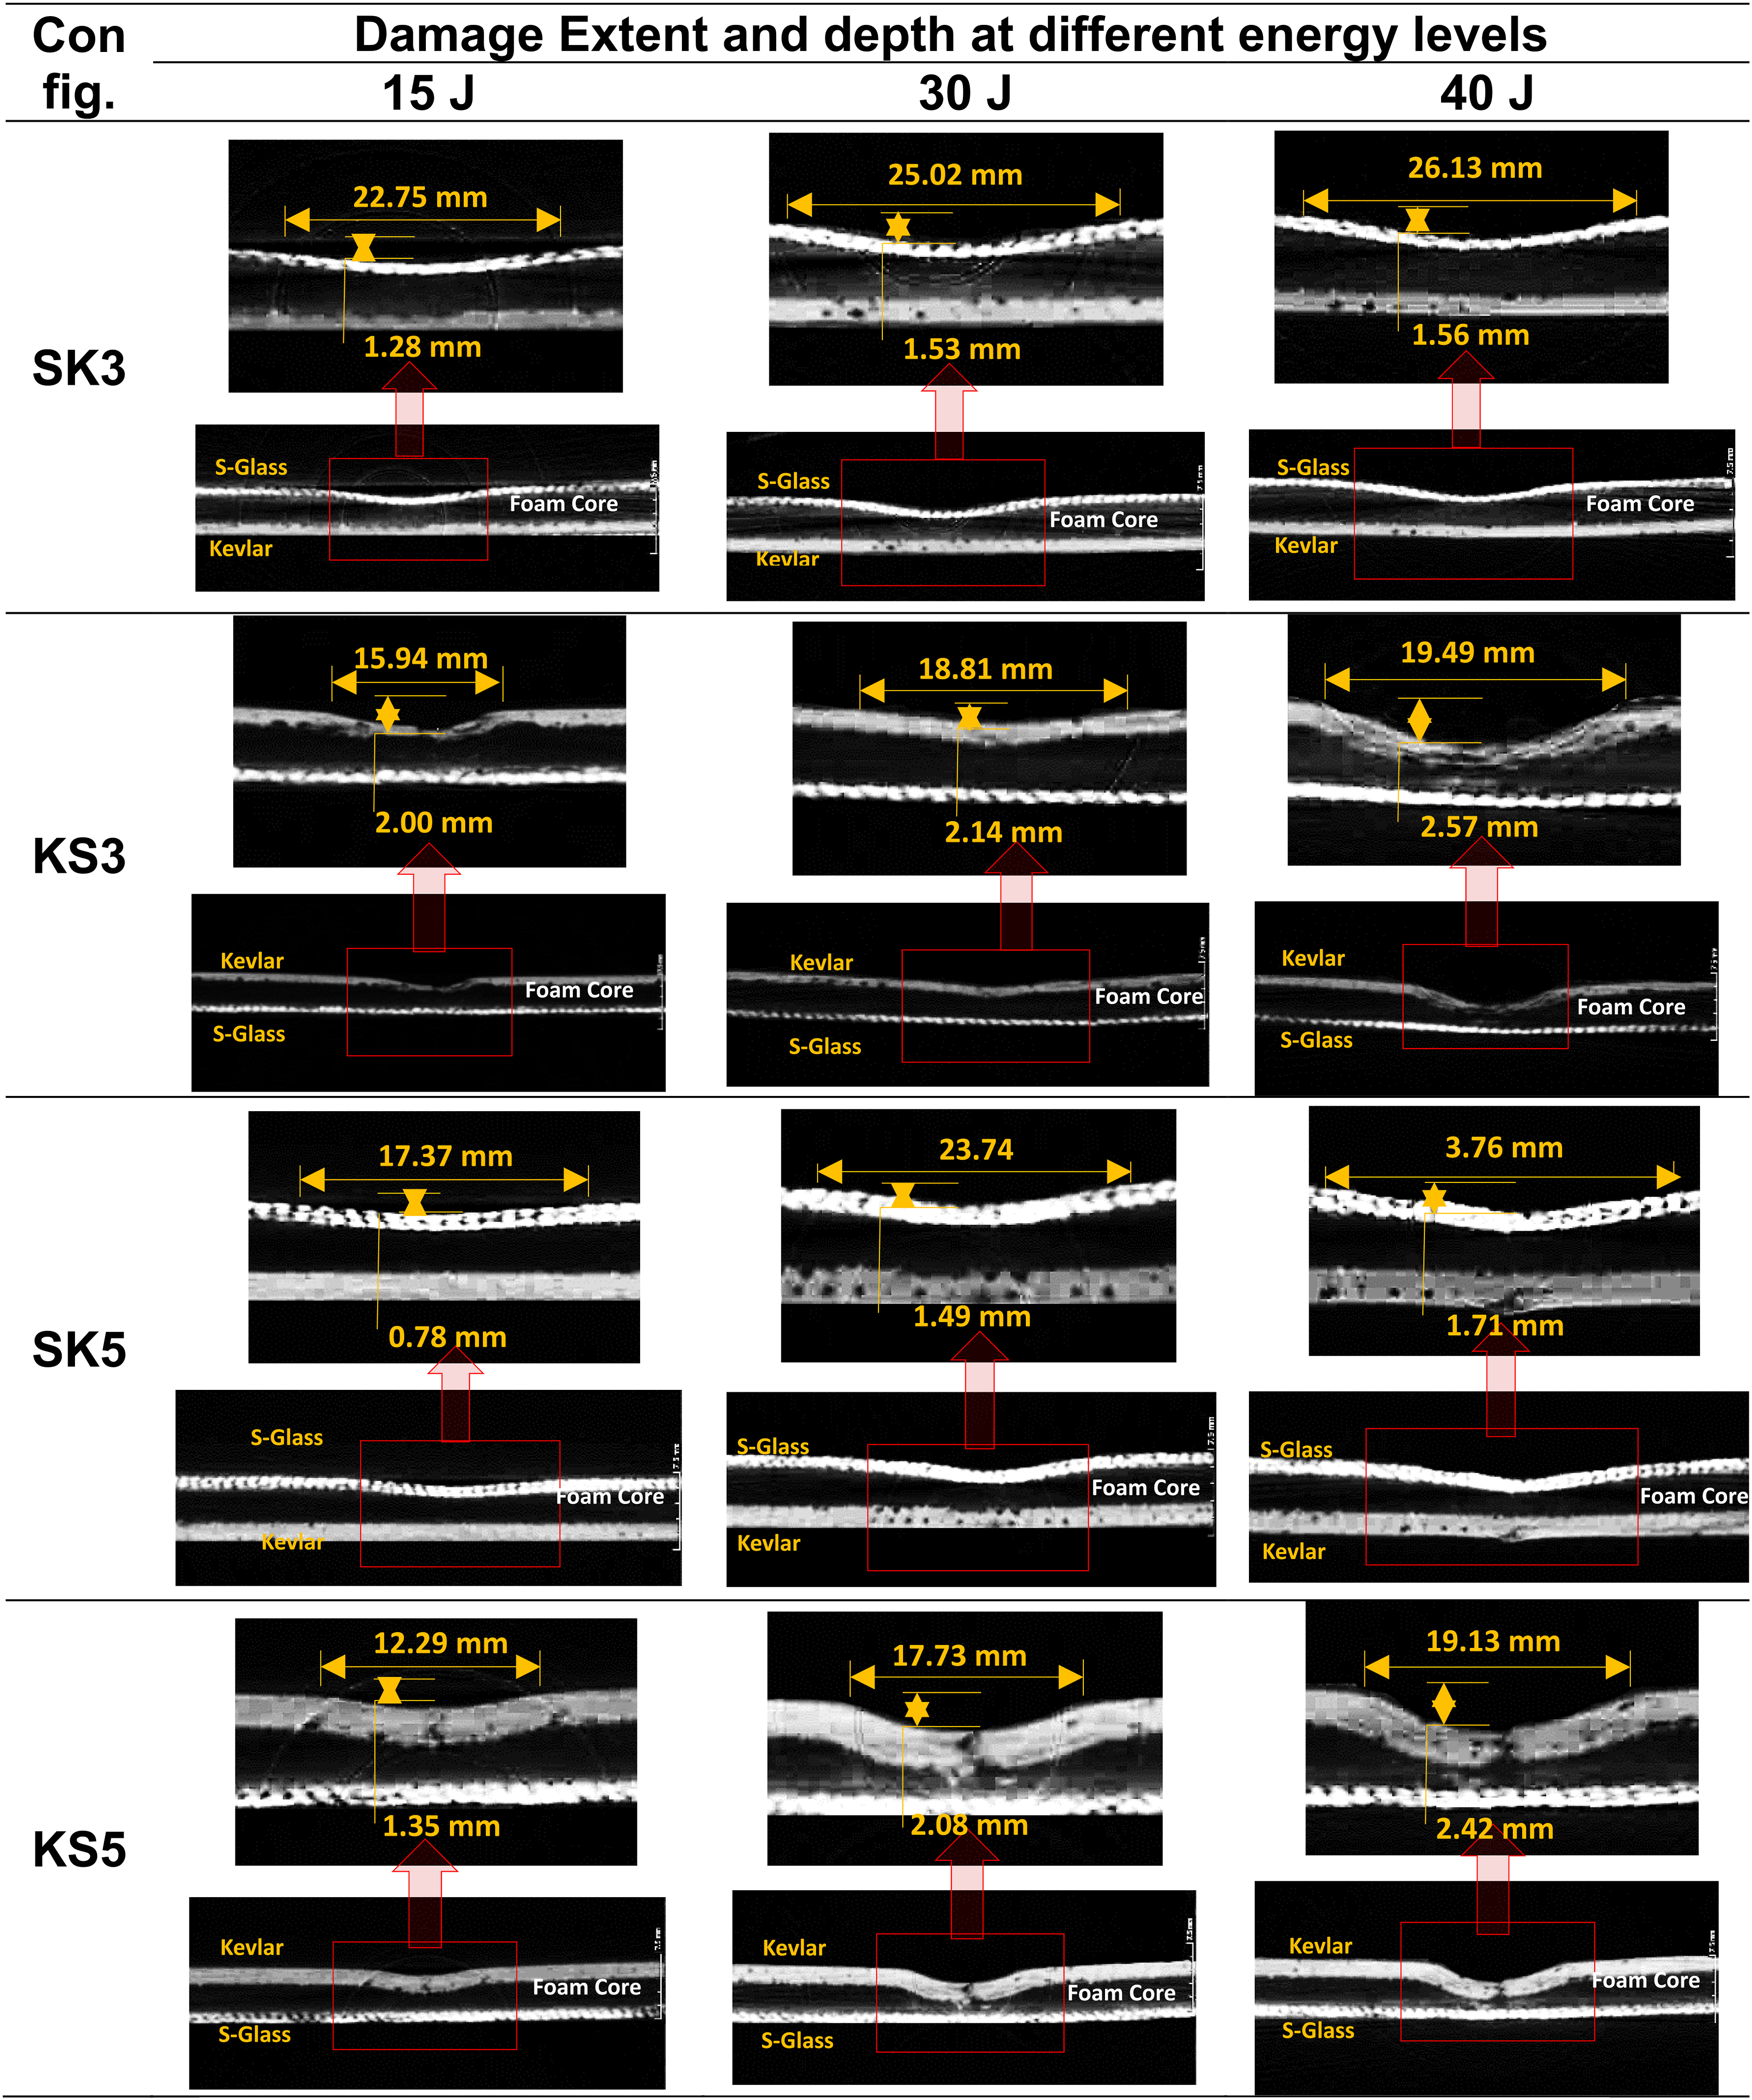
CT scan images (side views) after LVIs at 15, 30, and 40 J.
The curves in Figure 5 indicate changes in stiffness and load-bearing capacities of specimen. At 15 J impact energy, all specimens display slight fluctuations, indicating damage to face sheets. SK3 and KS3, exhibit softening, potentially resulting in semi-penetration, whereas, SK5 and KS5 show rebounding which means no penetration. At 30 J impact energy, SK3 and KS3 specimens show open-type curves, suggesting penetration while KS5, and SK5, display semi-penetration. At 40 J impact energy, SK3, KS3 shows curves with low peak values, the curves are open type curves which mean that the impactor has penetrated the specimens. While SK5 and KS5 curves show higher peaks with open curves but not as wide which indicate greater damage absorption while penetration.
The force–displacement behavior also emphasizes the influence of face sheet thicknesses on the impact response of the sandwich composites.19,20 SK5 and KS5 demonstrate a 30% and 11% increase in peak load at 30 J compared to 15 J, followed by a subsequent drop of 10% and 3%, respectively, at 40 J. This suggests that beyond a certain impact energy threshold, the stiffness of the specimen decreases, leading to reduced rebound (elastic) energy on the impactor and subsequently reduced stiffness. The findings of LVIs indicate notable differences in damage resistance between impacts on S-glass face sheets and Kevlar-based face sheets in the hybrid sandwich structures. The curves indicate changes in stiffness and load-bearing capacity.
Figure 7 illustrates that the width of indent damages on S glass impacted face sheet specimens (SK3 and SK5) are 20% wider compared to their Kevlar impacted face sheet counterparts (KS3 and KS5). Conversely, the depths of indent damages on KS3 and KS5 were found to be 25% deeper than SK3 and SK5. Increasing the energy levels resulted in greater displacements and changes in damage patterns with more damage to foam cores in case of KS3 and KS5.
Figure 8 also shows the damage morphology in terms of indentation and crack growth for the SK3 and KS3 configurations at different LVIs. However, crack growth traveling from the center to the edge is visible for SK3 in the Kevlar sheet, which was not found in the Kevlar sheet for the SK5 configuration. This finding suggests that increasing the number of layers has increased the resistance to indenter penetration and subsequently reduced the crack growth.
20
CT scan results showing damage propagation during LVIs from impact surface and side view scanning positions.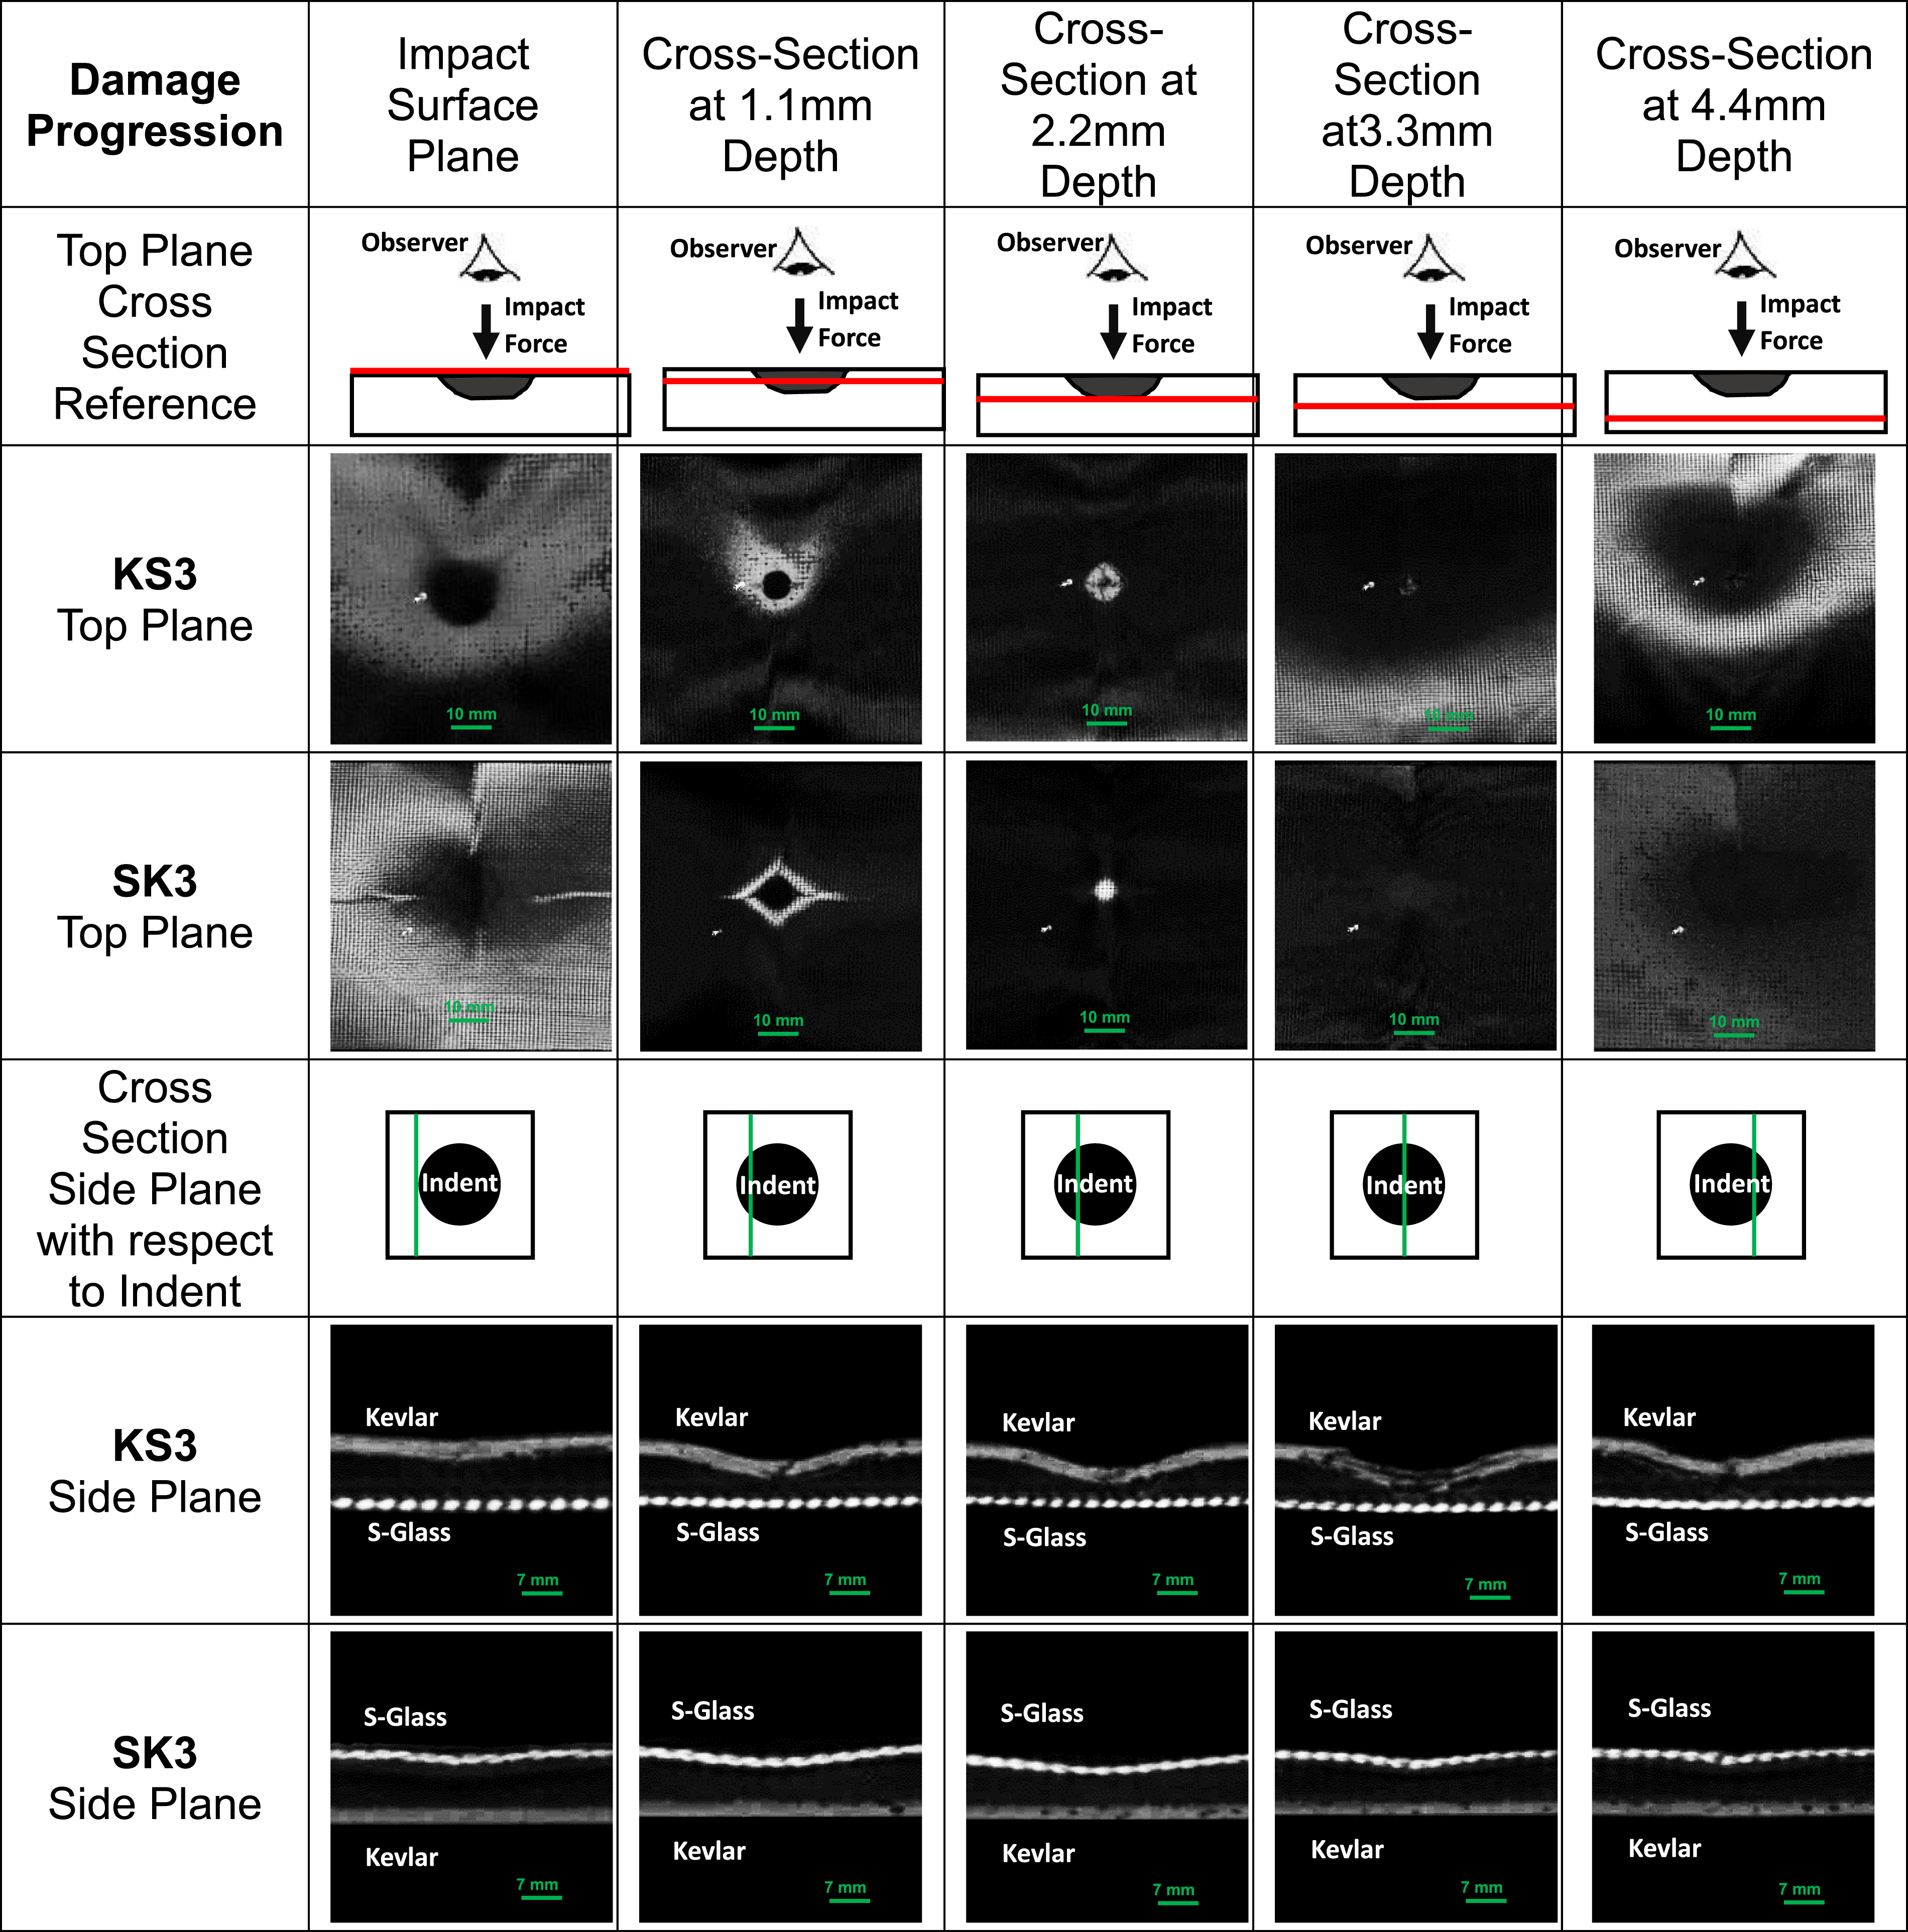
The damage mechanics of samples subjected to impact loads analyzed through CT scan (Figure 7) showed varying degree of micro scale matrix cracking and fiber breakage, lead to compromised load-carrying capacity mentioned in Table 5. The subsequent delamination, manifested through inter-laminar shear and transverse matrix cracking, contributed to reduced structural integrity (greater displacements). Polymer matrix plasticity and viscoelastic effects, coupled with fiber-matrix interface failures, for example, de-bonding and matrix erosion, played significant roles in energy absorption.
The visual examination of damage progression in KS3 and SK3 samples @40 J impact has been explained through a set of CT scan images presented in Figure 8.
The top two rows of CT scan images (Figure 8), provide a top-down view, revealing cross-sections within the coupon’s depth. For KS3 impacted on the Kevlar side, damage and cracks propagate along the depth due to transferred energy. In contrast, SK3 impacted from the S glass side shows lateral cracks spreading in all directions. While there is some depth damage, it is less pronounced, attributed to absorbed energy dispersing mainly in the top layer, resulting in less impact on the bottom layers.
The subsequent CT scans (Figure 8) through side views of cross-sections offer, consistent damage patterns. For KS3, damage initiates in the top layer and progresses almost to the bottom, causing skin delamination, matrix cracking, core crushing, and fiber breakage. Conversely, SK3 exhibits energy dispersion, concentrating damage primarily in the top layer and showing reluctance to extensively traverse the coupon’s depth. This distinctive behavior is attributed to the energy absorption and dispersion in S glass materials.
Damage mechanics & tolerance under compression after impact
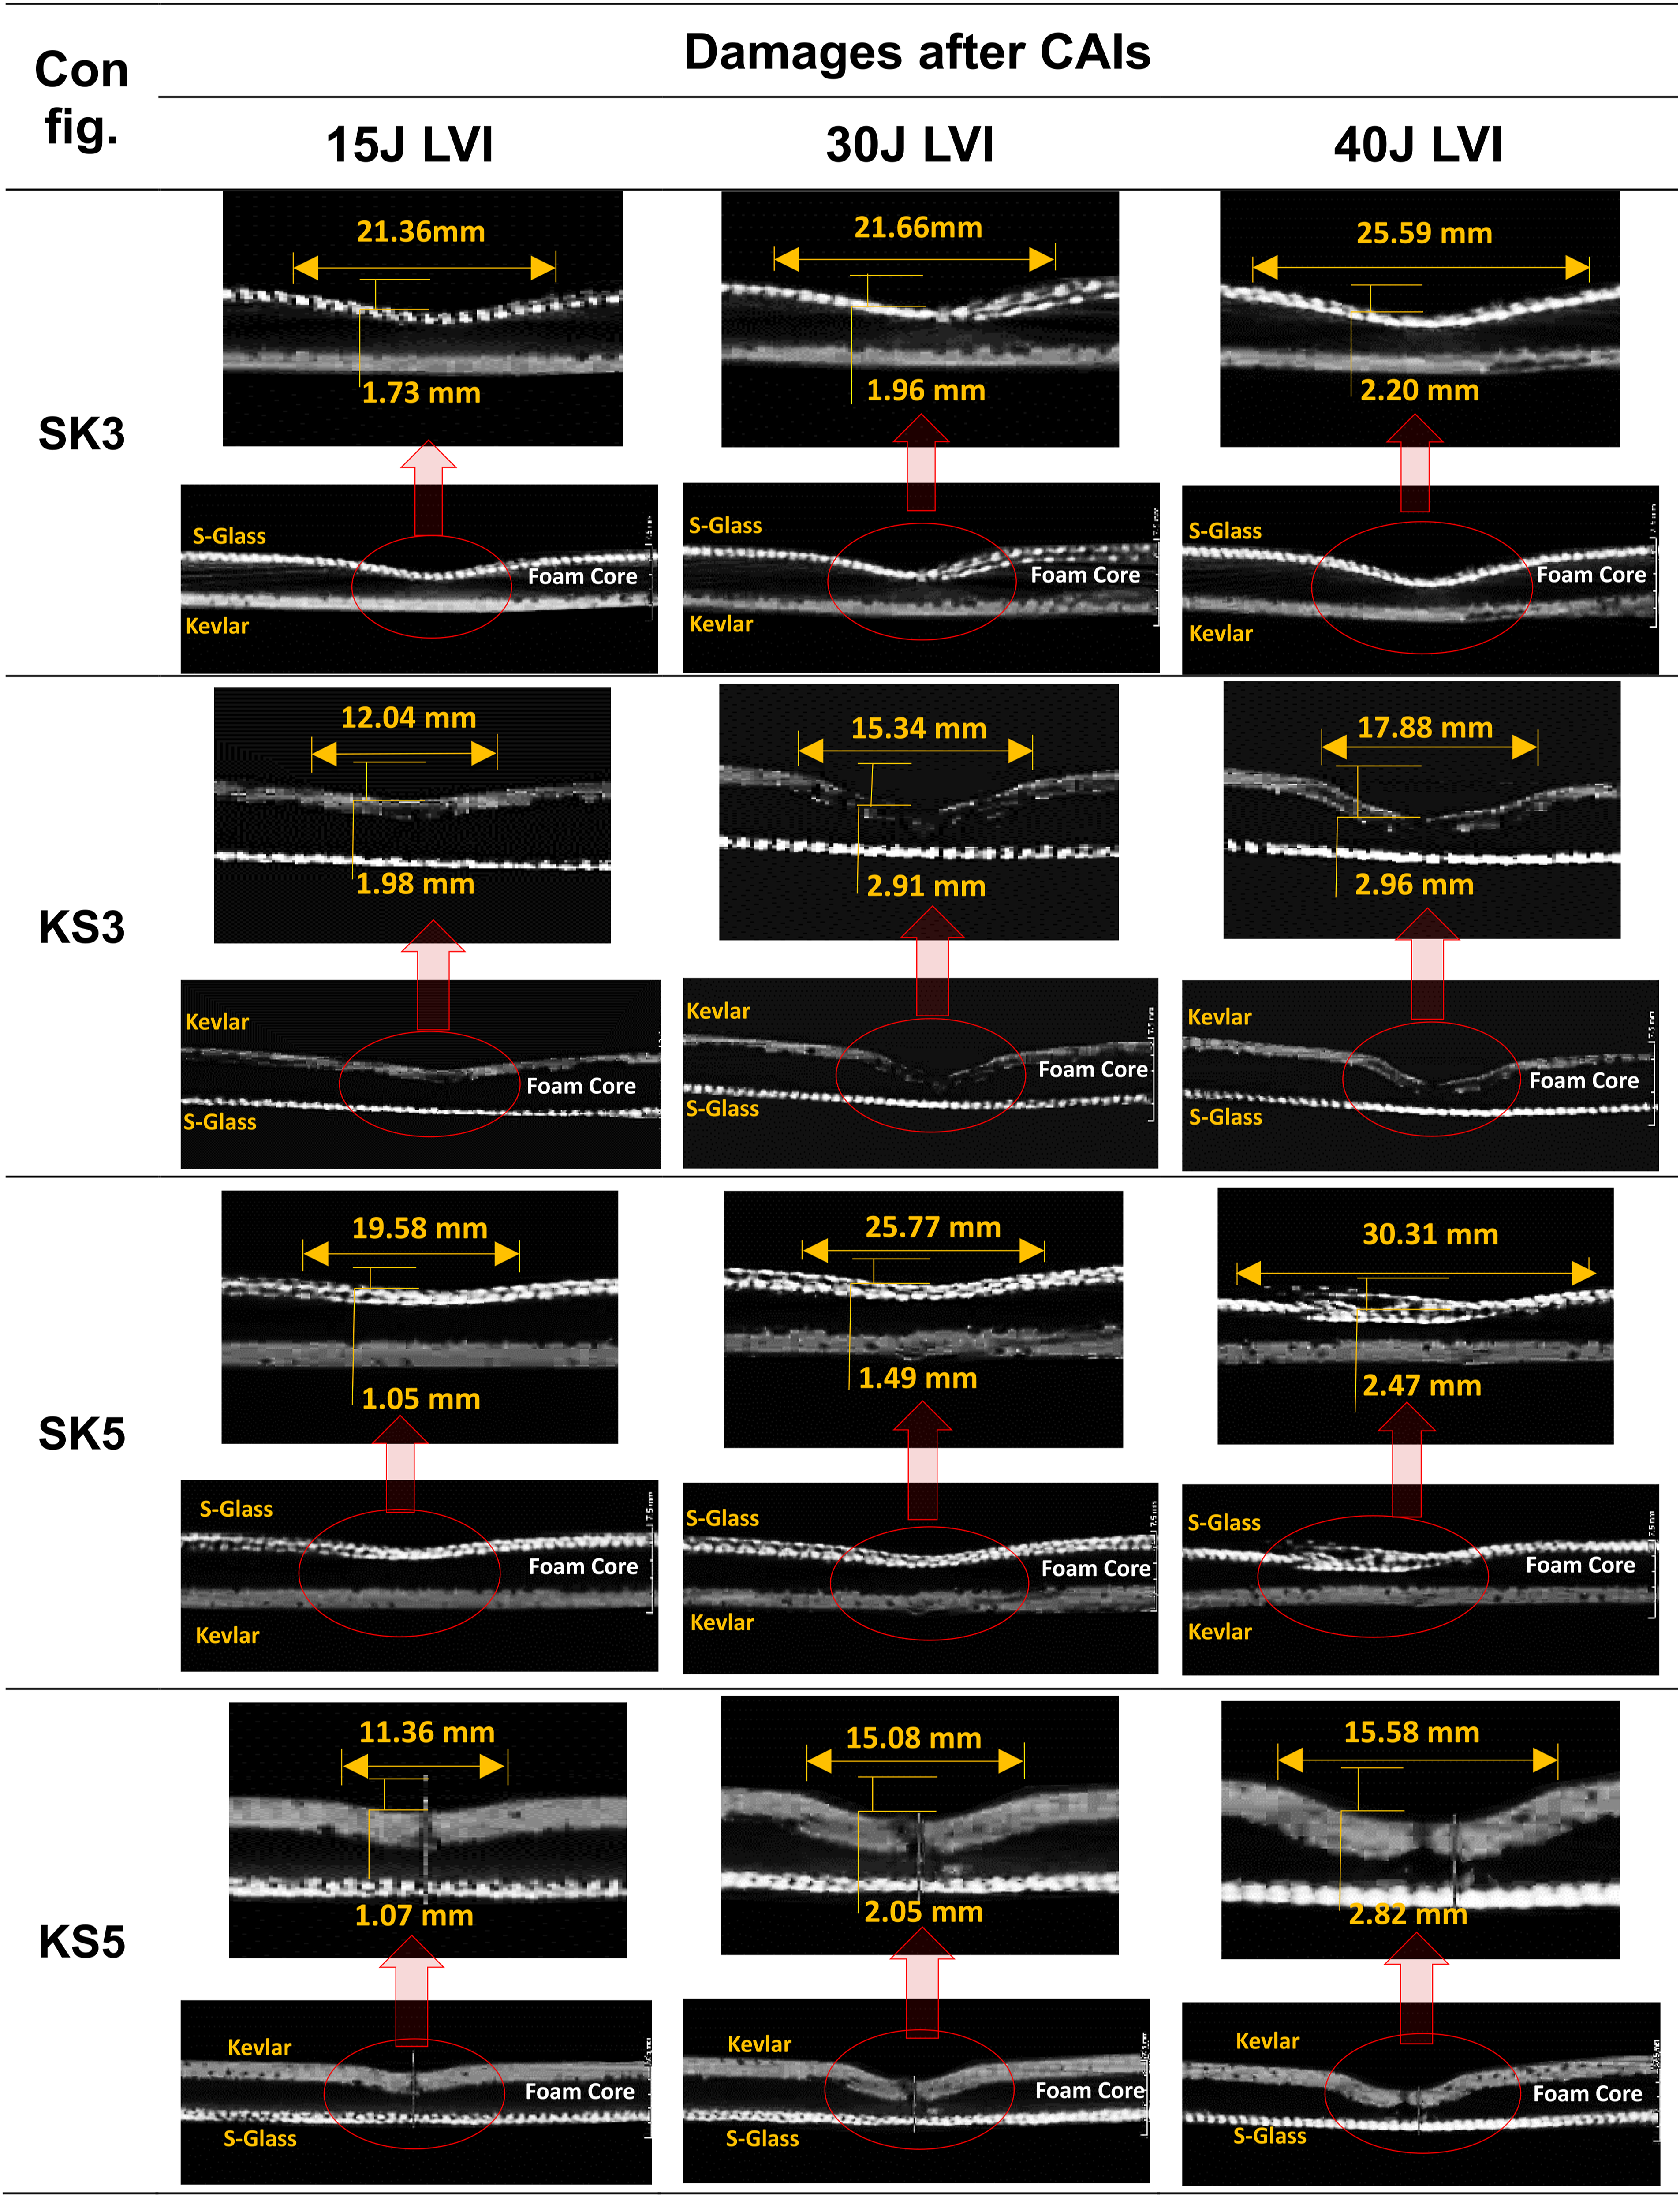
Compression after impact tests were performed on SK3, KS3, SK5, and KS5 configurations and external and internal damages have been shown in Figures 9 and 10, respectively. Face sheet damage views after CAIs post LVIs at 15, 30, and 40 J (a) SK3 & KS3 (b) SK5 & KS5. CT scan images (side views) after CAI on specimen at impact energies of 15, 30, and 40 J.
CAI versus LVIs (damages relationship)
Table 5 presents a comparison of the extent of damages in terms of indent depths and widths experienced during LVIs and subsequent CAIs. The low-velocity impact (LVI) damage widths are greater and the damage depths are shallower on SK3 and SK5 specimens compared to KS3 and KS5 specimens. This indicates that the S-glass face sheet has absorbed more energy, resulting in lesser loads being transferred to the depths of the specimens. Consequently, the damage widths are visibly larger on these SK3 and SK5 specimens, and this damage pattern increases with higher energy levels.
Conversely, the impact damage depths are greater and the damage widths are narrower on KS3 and KS5 specimens compared to SK3 and SK5 specimens. This suggests that the Kevlar face sheets have not absorbed as much energy, instead transferring it to the depths of the specimens, resulting in narrower damage widths but deeper damage depths on KS3 and KS5. This also indicates localized damage in these specimens, with the same damage pattern intensifying as energy levels increase.
Another important observation is that both impact damage depth and width are reduced in thicker specimens (i.e., SK5 and KS5) compared to their thinner counterparts (i.e., SK3 and KS3). This observation aligns with several published studies on the impact performance of composite materials.
Regarding damage propagation due to compression after impact (CAI) testing, all the low-velocity impacted specimens show an increase in damage depths and a decrease in damage widths. This is due to the in-plane compressive loads. Notably, KS3 and KS5 experience a greater increase in damage depths due to an already weakened core from the LVIs, which was crushed during the impacts. In contrast, SK3 and SK5, which absorbed more energy in the impacted face sheet, exhibit greater damage widths and lesser damage depths. Consequently, during CAI, SK3 and SK5 show a closure of damage widths and a lesser increase in damage depths compared to KS3 and KS5. It is important to highlight that the foam cores in a sandwich structure are designed to withstand compressive loads.
In the cases of KS3 and KS5, the foam core is already damaged due to LVIs, resulting in greater depth increases during CAI compared to SK3 and SK5 It has been observed that during CAIs, width of indents have decreased due to in-plane compressive loads with corresponding increases in indent depths as evident from CT Scan results (Figure 10). It is also evident that since Kevlar faced impact specimens, that is, KS3 and KS5 already sustained more indent depth damages during LVIs, (Figure 8) therefore the corresponding increases in depths during CAIs is higher as compared to S-glass faced impact specimens, that is, SK3 and SK5.
For example, there is 25% rise in indent depth on KS3 as compared to SK3 during CAIs after 40 J LVI and 12.5% raise in indent depth on KS5 as compared to SK5. On the other hand the corresponding decrease in indent width for KS3 is 30% more than SK3 at 40 J and indent width reduction is 50% more for KS5 as compared to SK5. This implies that specimen experiencing more damages in terms of depth would tend to increase further in depth with more reduction in indent width and vice versa.
It is also prudent to highlight that as damage grows in depths, the damage to foam core and subsequently to the lower face sheet starts as shown in CT scan results in Figures 10 and 11. During Compression after impact (CAI) loads, damage mechanics involved the exacerbation of delamination through compression stresses, crushing of the foam core, localized compression in the polymer matrix, and buckling of reinforcing fibers (Figure 10). The cumulative effect of these mechanisms leads to localized stiffness reduction, affecting the post-impact structural integrity of the composite material under compressive loads. This implies that change of face sheet material would not only induce different damage behaviors and growth but also the prediction through FE analysis would pose challenge in modeling the damage growths. CT scan results showing damage propagation after CAI from impact surface and side view scanning positions.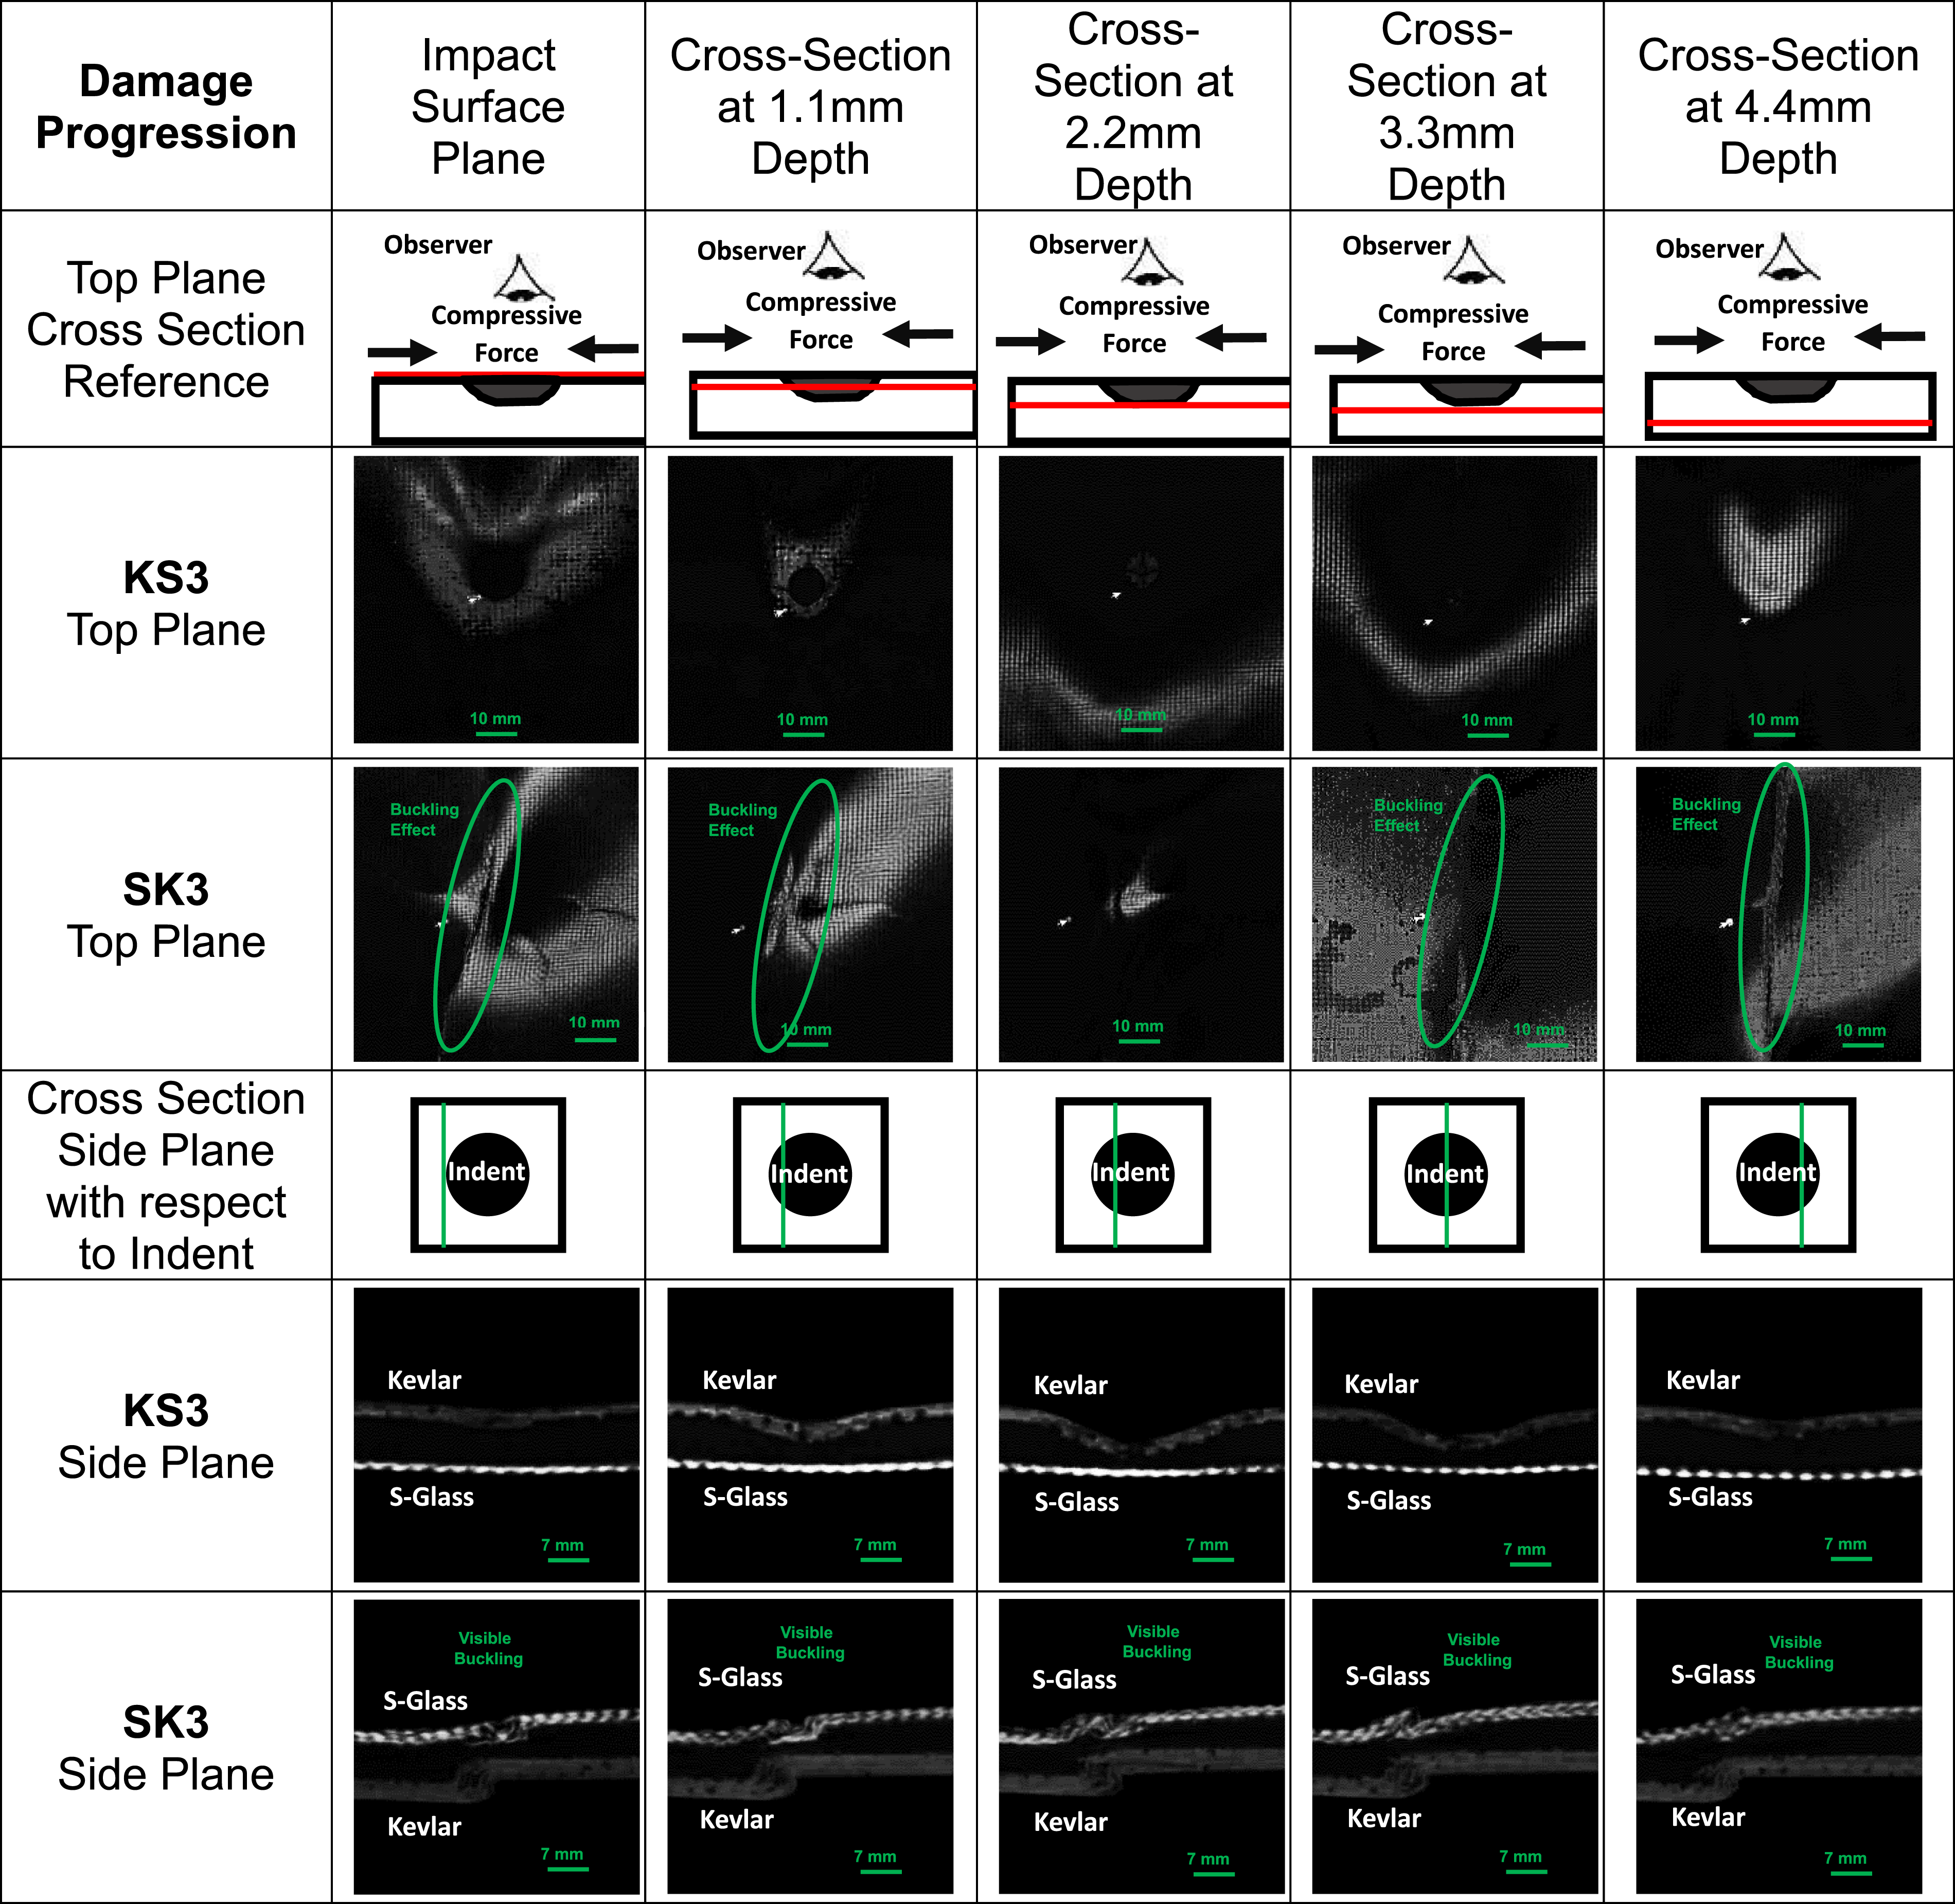
The visual examination of damage progression in KS3 and SK3 samples @40 J impact has been explained through a set of CT scan images presented in Figure 11. The first focus lies on the damage progression along the depth of the samples, revealed by the CT scan images in the initial two rows.
The post-impact examination of SK3 and KS3 specimens depicted in Figure 11 following compression after impact (CAI) testing at 40 J provides insightful observations into their structural responses. In the SK3 specimen, the manifestation of buckling is evident, characterized by a central protrusion exhibiting a distinct line. This localized structural response suggests the influence of internal damages incurred during the initial impact at 40 J. Conversely, the Kevlar-faced KS3 specimen displays a distinctive absence of buckling, accompanied by an intriguing phenomenon where the indenter’s dent becomes progressively deeper. In-depth cross-sectional analysis along the side of the KS5 specimen, moving towards the point of impact, substantiates this intriguing deepening dent behavior.
The top face views Figure 11 of the specimens under scrutiny shed light on the nuanced damage patterns. In the case of KS3, cracks intensify predominantly at the facesheet, particularly at the outer layers. This observation suggests a localized response to the impact, where damage concentrates closer to the impact site. Interestingly, the cracks in KS3, while more pronounced than those observed after only Low-Velocity Impacts (LVI), remain concentrated at the facesheet. On the other hand, the SK3 specimen exhibits a more complex structural response, with both top and bottom facesheets protruding from the middle due to buckling.
The general damage propagation behavior and failure mechanism observed is that at first the indentation in the impacted facesheet becomes deeper; then part of the laminate surrounding the damage region becomes unstable and the indentation begins to propagate in the width direction, that is, the direction perpendicular to the load.
Under increasing compressive load, indentation keeps propagating until its edge reaches a critical location roughly between 25 mm and 30 mm away from the damage center along the width central line, right at this moment, a sudden fracture across the damage region in the impacted front facesheet occurs, causing a complete loss in its load bearing capacity. All the load then transfers to the back facesheet, which cannot carry the whole load on its own, and buckles and breaks immediately; the catastrophic failure of the whole sandwich structure occurs.
Furthermore, an in-depth examination of the facesheet damages reveals intriguing disparities between the S glass and Kevlar impacted sides depicted in Figure 12. The outer facesheets of the S glass impacted sides exhibit more damage compared to the Kevlar impacted sides. Remarkably, the damages on the Kevlar impacted sides penetrate more deeply into the material. This differential damage distribution underscores the multifaceted interplay between material properties, impact-induced damages, and subsequent structural behaviors. The need for a meticulous investigation into the underlying mechanisms governing these responses becomes imperative for a comprehensive understanding of the observed phenomena. CT scan results showing damage morphology after CAIs.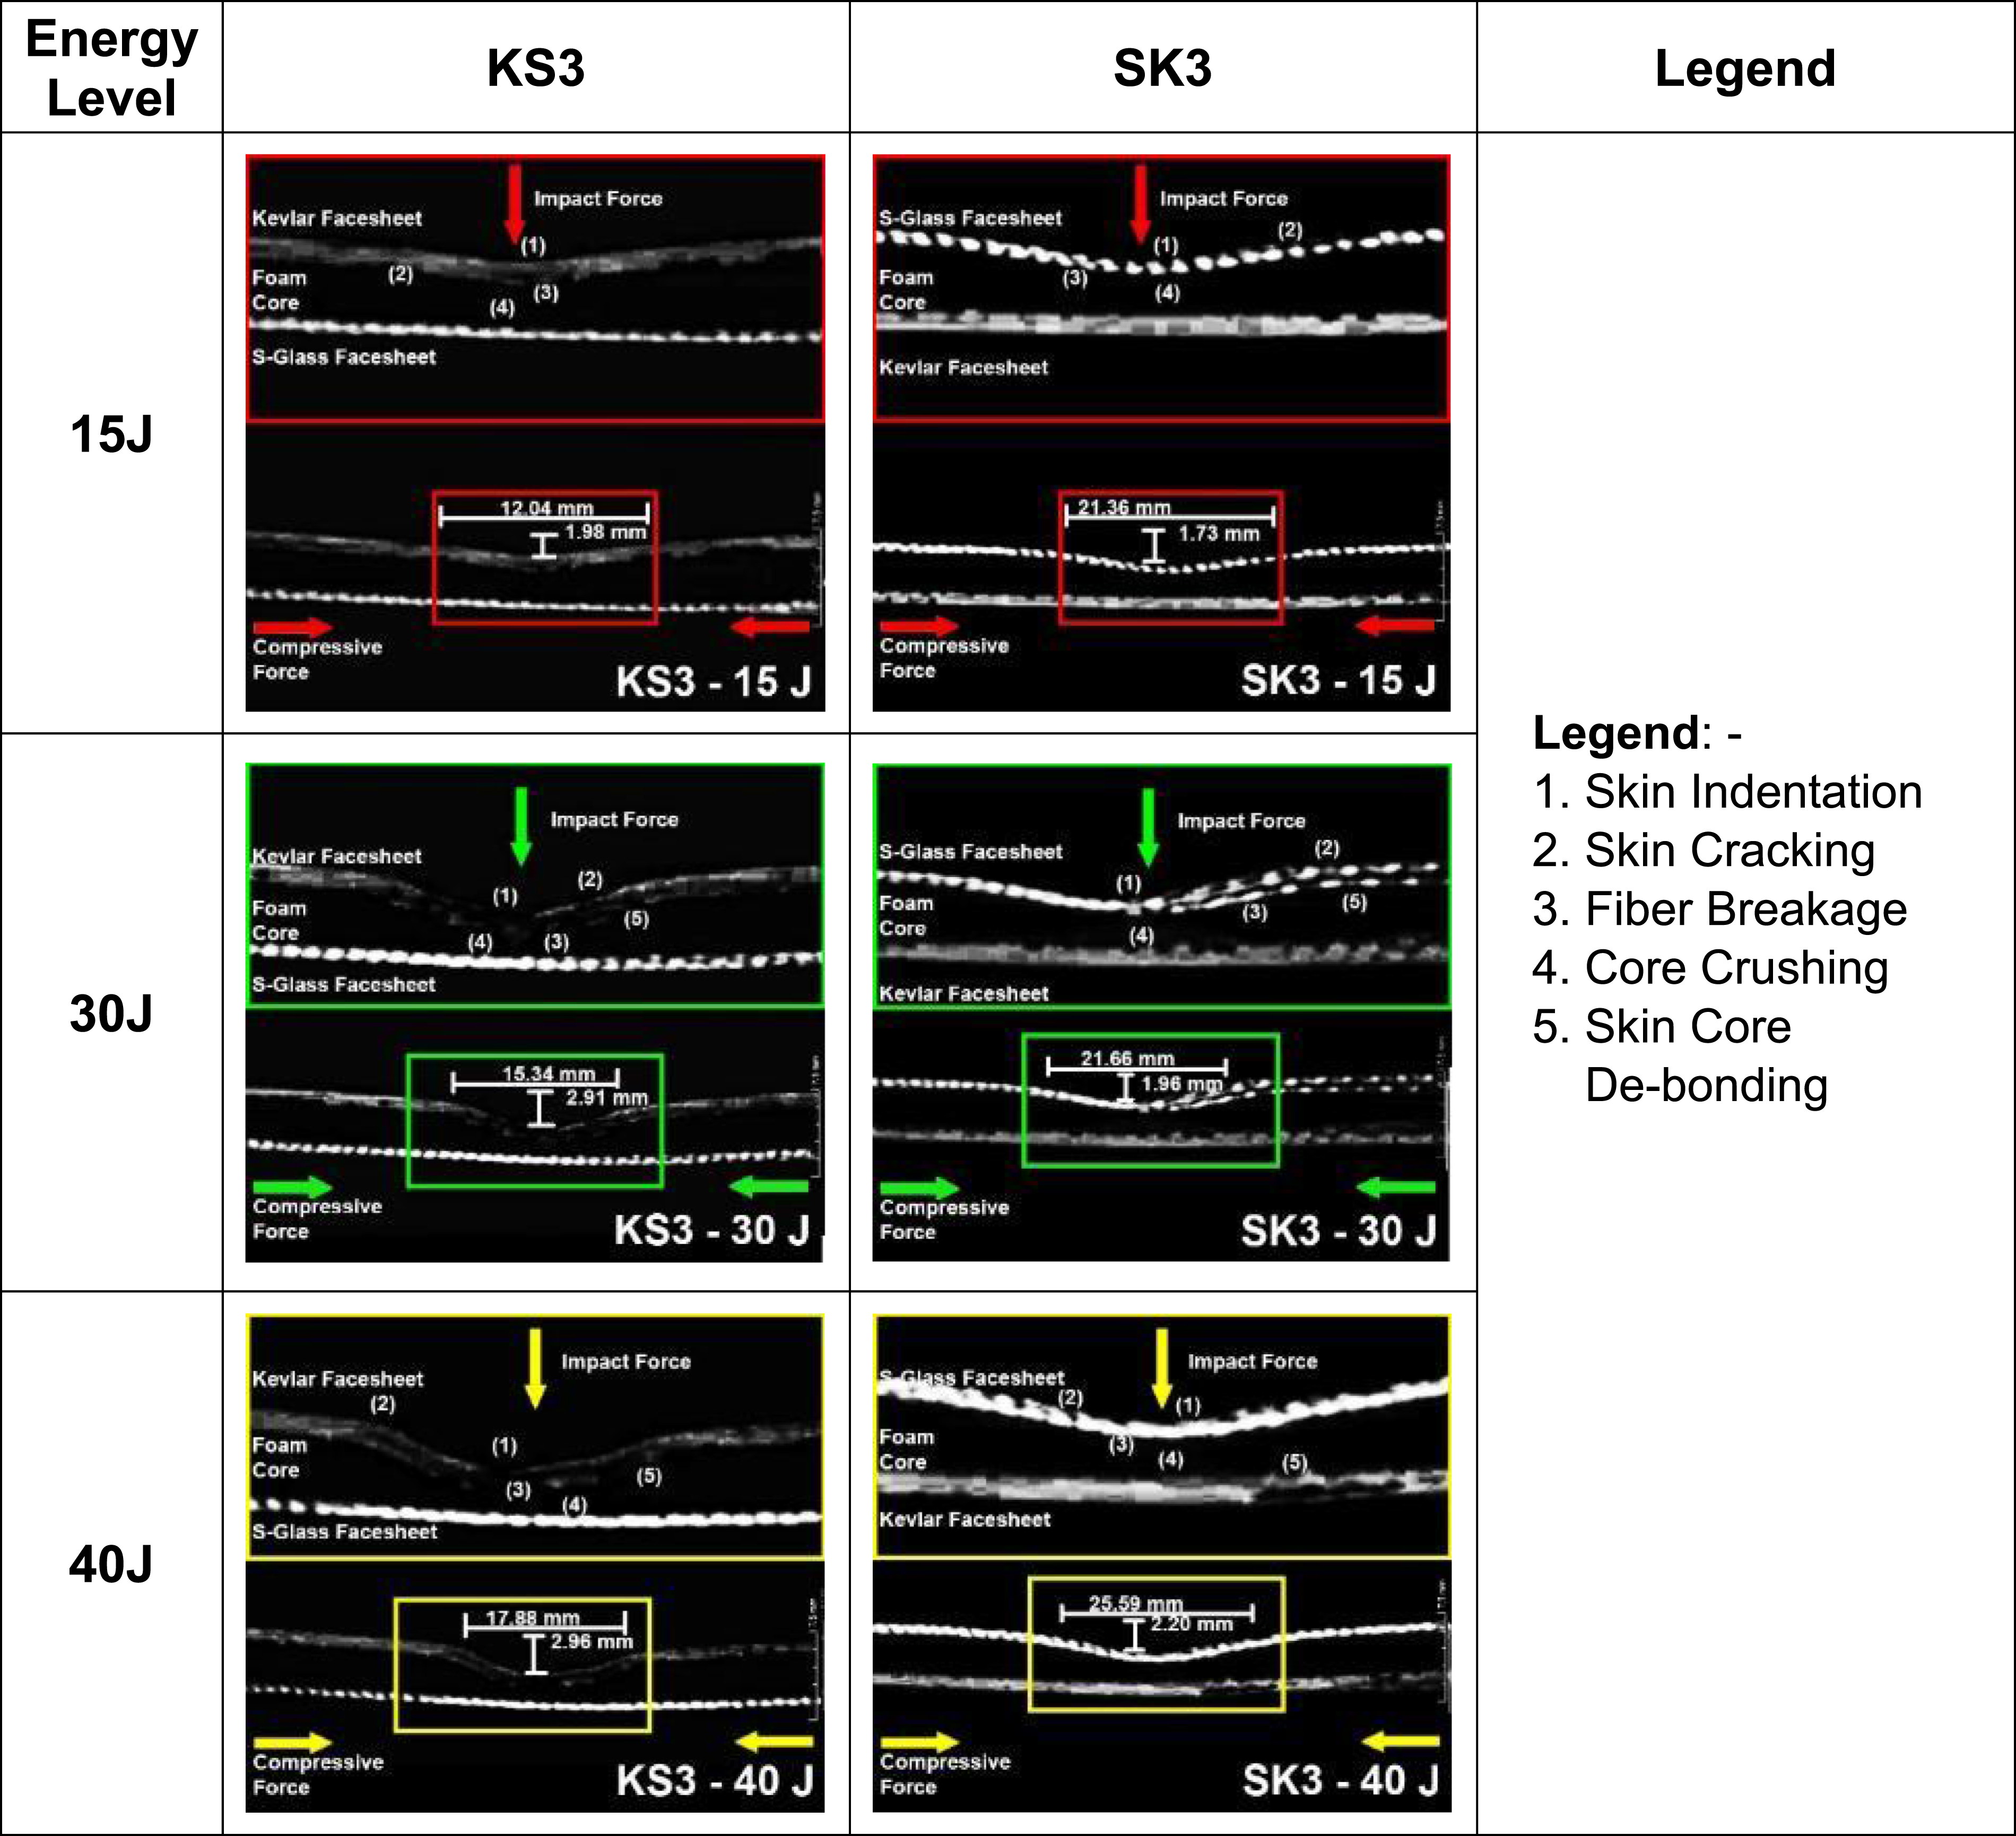
Damage mechanics & tolerance (load–displacement relationship)
Figures 13(a) and (b) depict the compression after impact (CAI) behaviors of SK3 and KS3 specimens, in comparison with pristine specimens (CBI). The overall behavior is quite similar, as the load increases with an increase in deformation followed by decline after reaching peak load bearing limits. For both SK3 and KS3 specimens, significant degradation in peak load capacity, and increase in rate of deformations were observed compared to the pristine specimens. It is important to note discernible differences in loads versus displacements curves for SK3 and KS3 specimens due to differences in damage characteristics as discussed earlier. Compression after impact response of (a) SK3, (b) KS3, (c) SK5, and (d) KS5.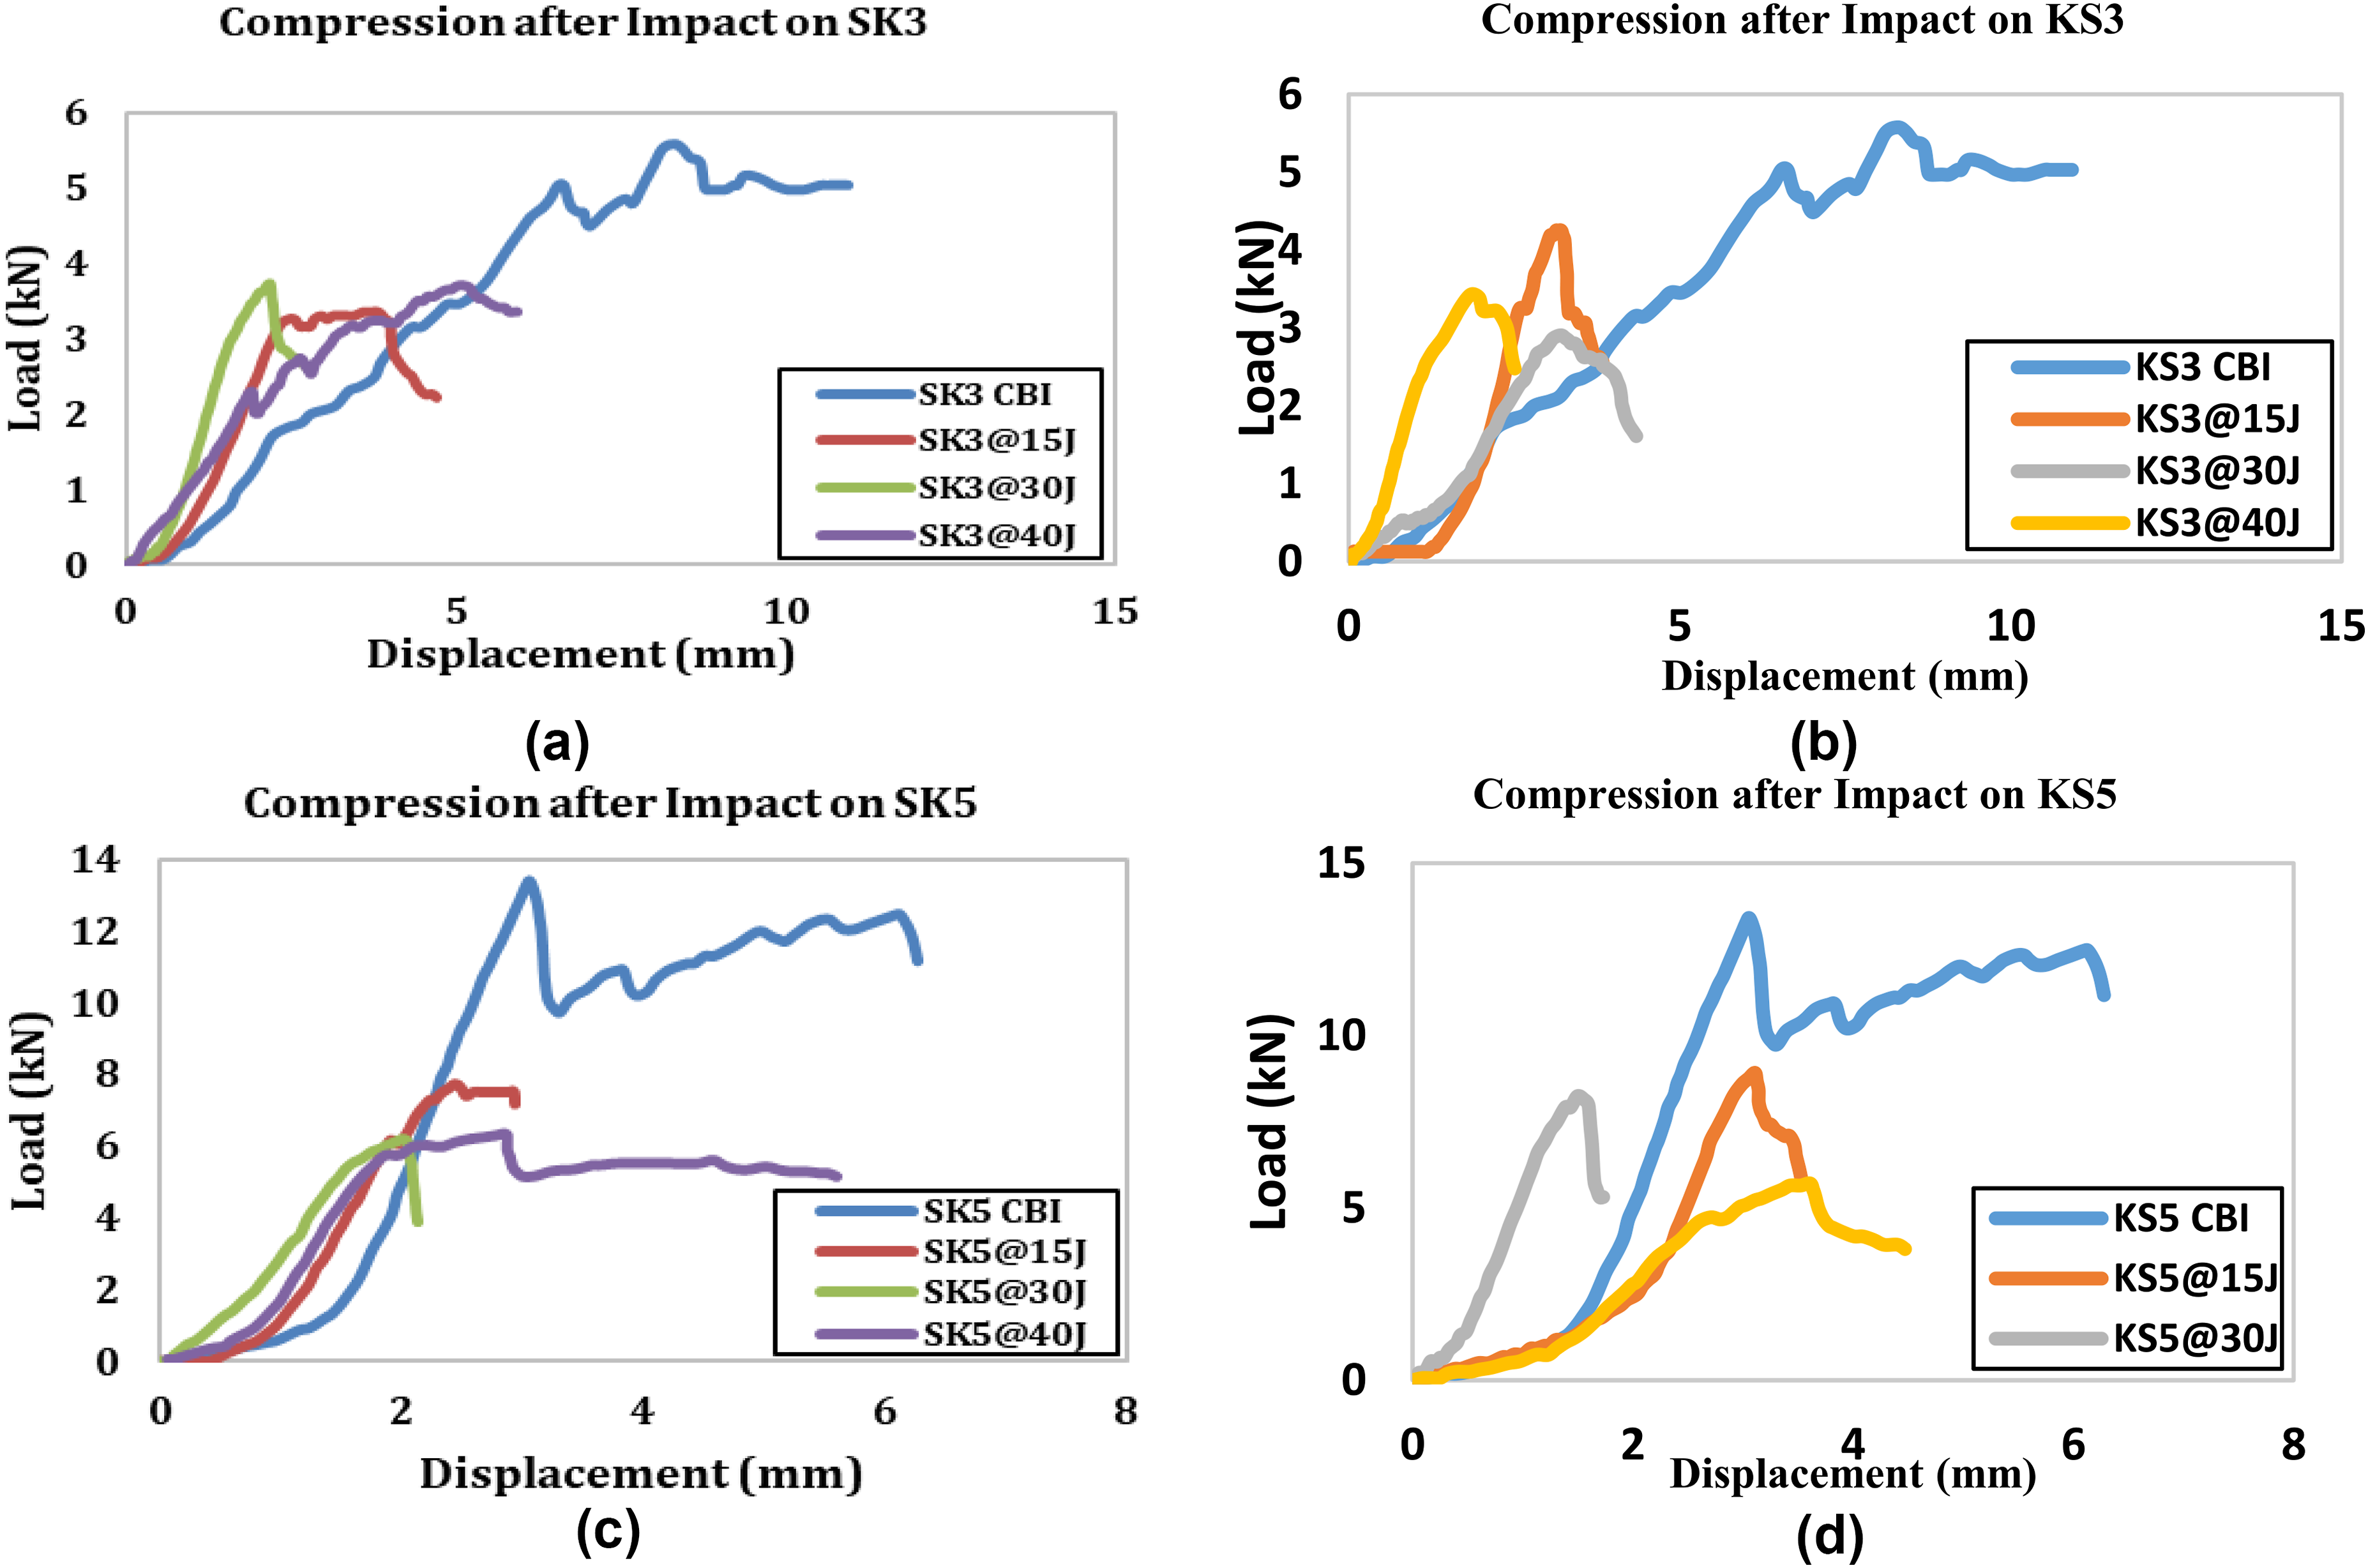
SK3 specimens have shown more energy absorption as compared to KS3 specimens as evident from the areas under the curves. This energy absorption phenomenon is also evident in the Figures 11 and 12 depicting more cracks on S glass impacted facesheet as compared to Kevlar impacted one. The longer and greater number of cracks on the S glass impacted face depicts that more energy was dissipated/absorbed by the top facesheet resulting into lesser damage transfer to the foam core and lower face sheets. This phenomenon has a significant relationship with the overall damage mechanics of all the impacted specimens. Sharp slops for KS3 depicts more rapid failure during CAI, whereas the SK3 specimens showed gradual trend depicting that damage patterns in both cases have significant contribution in load versus displacement behaviors. Although the peak loads varies 8%–12%, however, CAI response shows that depths of indent damages have more critical consequences rather than width of indent damages. Since SK3 has wider but shallower indents (Figure 11) than KS3, the effects are visible in compressive loads versus displacement behavior. The main reason for difference is damage to the foam core, which is more prominent in case of KS3 and has a crucial role to play in undertaking compressive loads. Non-impacted specimens typically exhibit higher subsequent loads after the initial failure, owing to a higher resistive force from both the foam core layer and partially damaged boundary face sheet.
Figures 13(c) and (d) illustrate the load–displacement curves for the SK5 and KS5 sandwich structures. Notably, the SK5 and KS5 specimens, with their thicker face sheet plies, exhibit 75%–80% higher tolerance against compressive after impact (CAI) compared to the SK3 and KS3 specimens. The load–displacement curves demonstrate a linear relationship until reaching their respective maximum values. Pristine specimens exhibit 60%–70% higher load-bearing capacity than impacted specimens, as evidenced in previous studies.17,18 The distinctive behavior in the Kevlar vis a vis S glass impacted face sheets, as observed in the SK3 and KS3 specimens, is similarly evident in the trends observed in the SK5 and KS5 specimens. While the KS5 specimen displays greater depth of indent damages compared to the SK5 specimen, the vice versa is observed for indent width damages. As a result, the subsequent global behavior aligns with that of the KS3 and SK3 specimens. The sharp slopes observed in the KS5 specimen’s load-displacement curve indicate rapid failure of the foam core, as corroborated by the CT scan images provided in Figure 13.
Interestingly, both pristine and damaged specimens show no abrupt damage behavior during CAI testing for all specimens, however, the specimens have shown higher stiffness with lesser deformations. It is important to highlight that for impacted panels, compressive failure initiated in the middle of the residual dent and propagated perpendicularly across the panel. In non-impacted panels, face-sheet fracture occurred close to one of the clamped ends and was associated with a drastic loss of stiffness and load-bearing capacity. 17
Post damage residual strength and specific compressive load
The residual strength depicted in Figure 14 shows slight 5% discrepancy in residual strength between the samples subjected to 15 J and 30 J impact energies are ascribed to the analogous stress concentrations induced by the distributed load acting on their identical cross-sectional areas. Despite differing face sheet materials, consistent stress distribution upon impact results in similar stress concentration variations. This is evident as damage inflicted on the face sheets at these energy levels does not extend through the majority of the core, maintaining uniform stress concentration patterns. However, at 40 J impact energy, complete core crushing ensues, leading to uniform stress concentration throughout the crushed core due to its diminished cross-sectional area. Consequently, the resulting residual strengths between the samples become nearly identical at this juncture. Residual CAI strength of impacted specimens.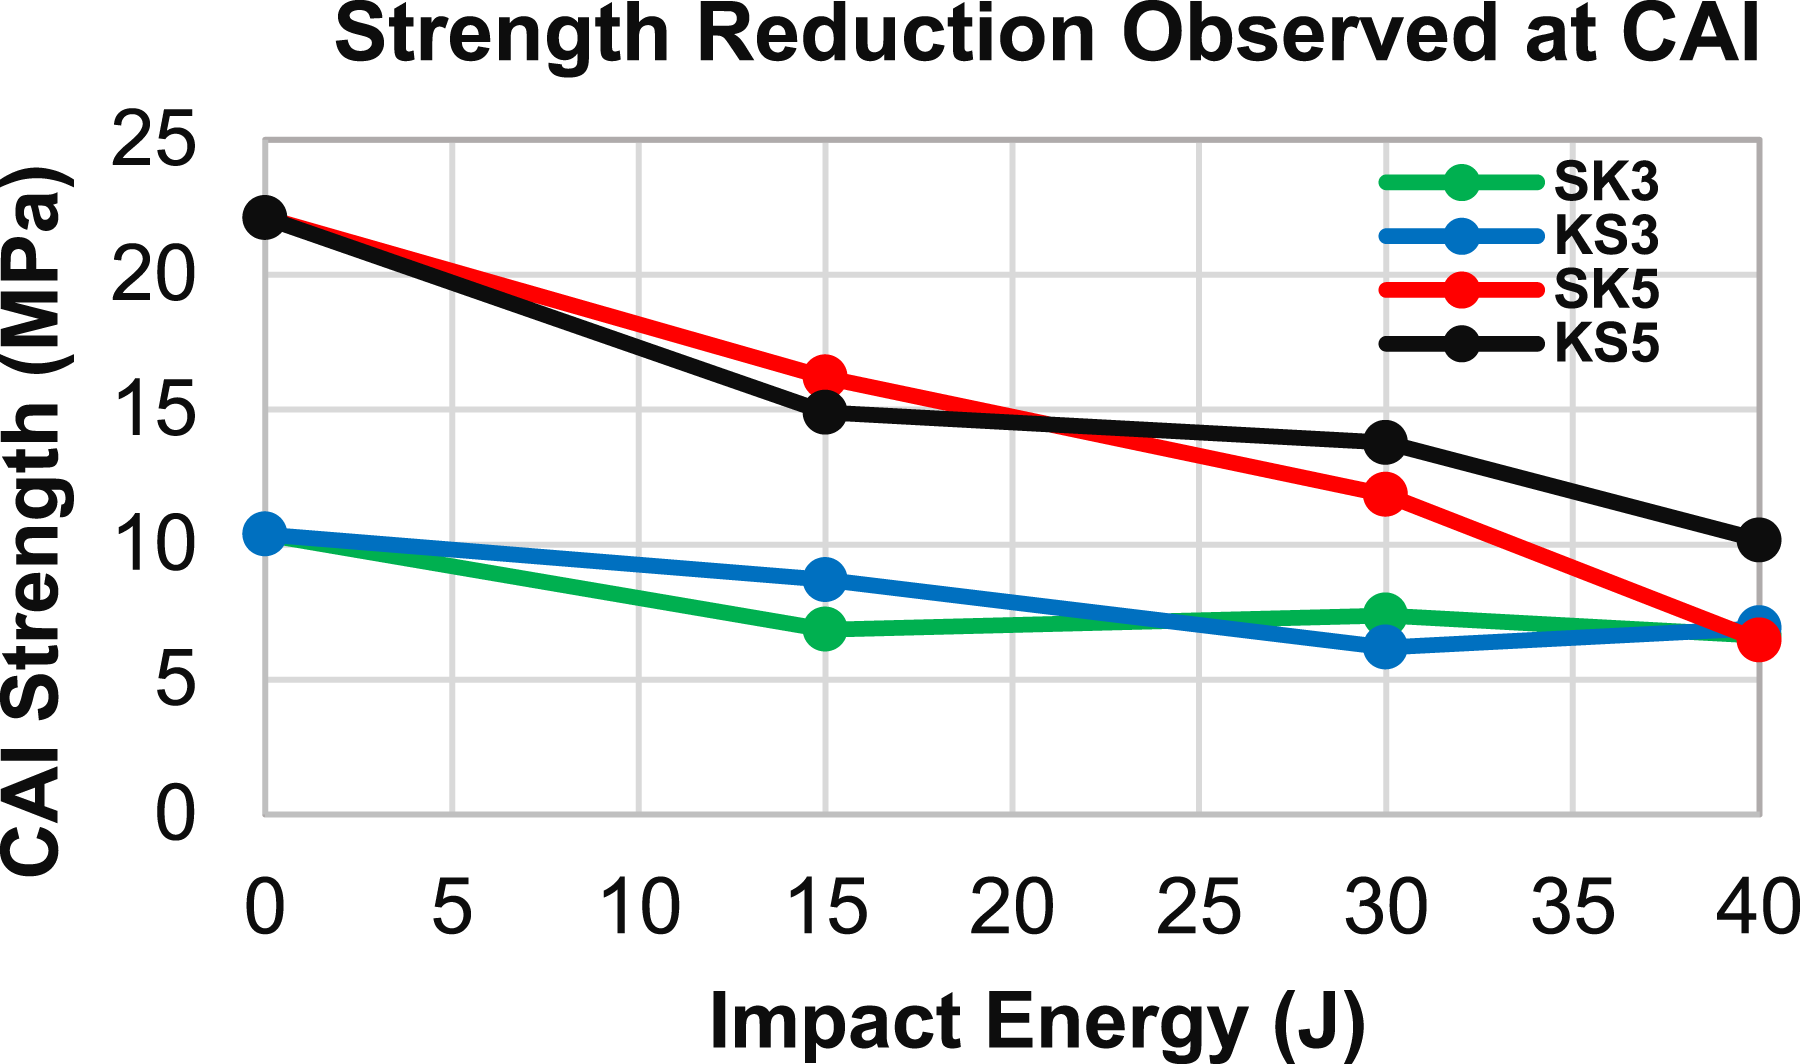
Furthermore, the CAI fixture’s constraint, allowing a force head movement of up to 10 mm, (Figure 4) safeguards against catastrophic failure. Relaxing this constraint could potentially lead to divergence in residual strength graphs due to heightened stress concentrations and subsequent structural instability.
Conversely, the SK5 sample, which incorporates Kevlar fibers, displays a more pronounced reduction in strength (48.6% at 40 J). Kevlar is known for its excellent impact resistance but has a lower compressive strength compared to S glass. The observed decrease in strength after CAI at higher energy levels could be attributed to the inherent characteristics of Kevlar, which may result in a more pronounced response to compressive loads, especially after experiencing impact-induced damages.
In the case of KS5, the Kevlar-faced specimen, a similar reduction in strength (46% at 40 J) is observed. This behavior might be associated with the unique combination of Kevlar facing the impact side and the subsequent compression-induced damages. The Kevlar side, while effective in absorbing impact energy, may lead to certain structural weaknesses when subjected to compression forces, contributing to the observed decrease in residual strength.
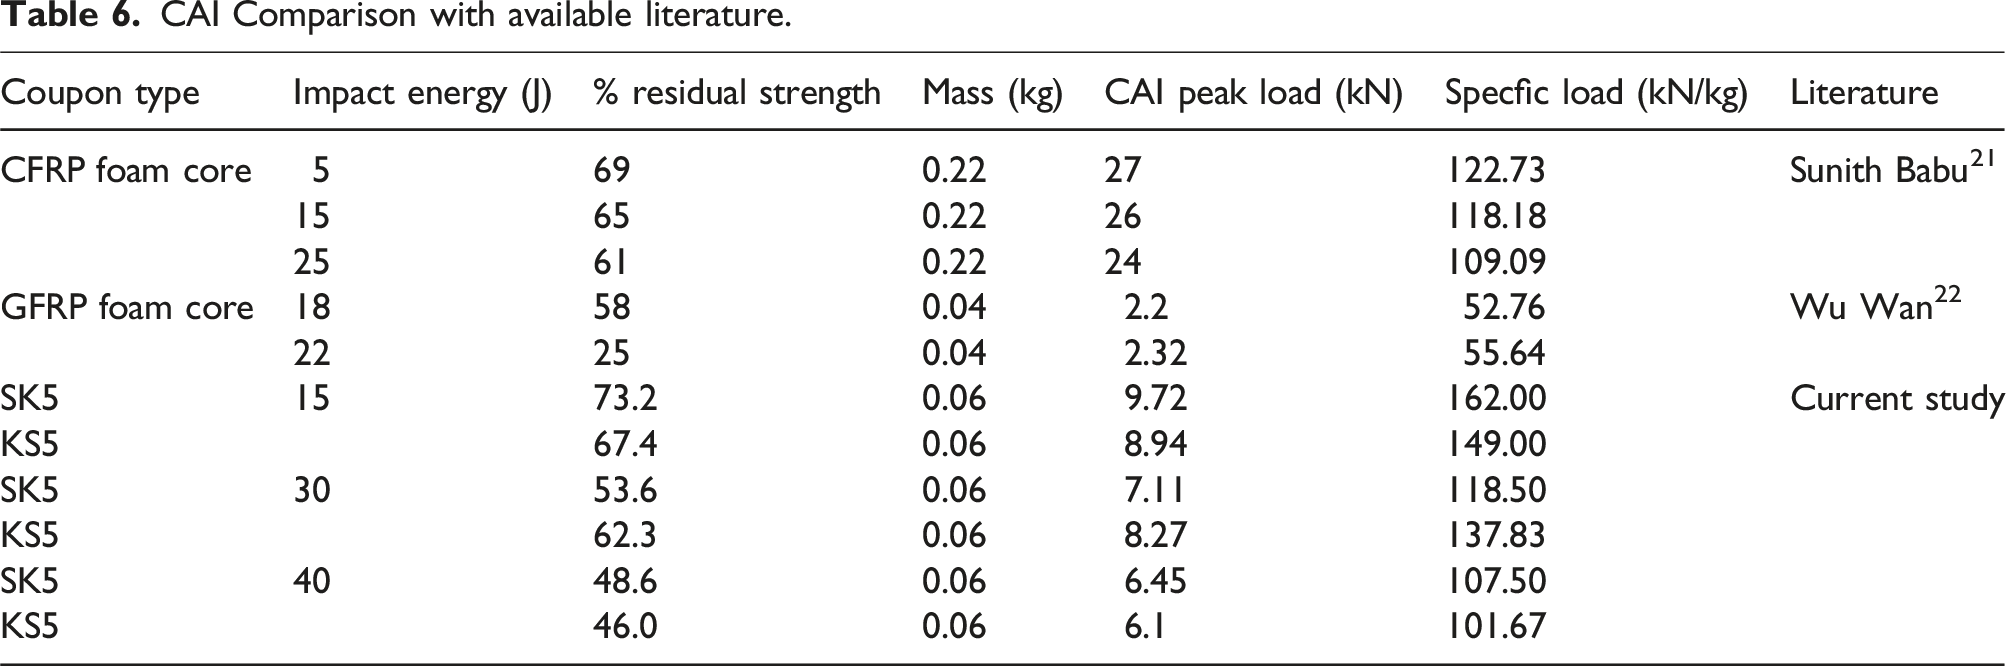
CAI Comparison with available literature.
Conclusions
Hybrid sandwich foam core samples consisting of S glass and Kevlar underwent experimental CAI testing after LVIs at 15, 30, and 40 J, alongside corresponding simulations. The following conclusions can be drawn from the findings: (a) Damage spread is more pronounced on the S glass side, while Kevlar-sided specimens exhibit deeper penetration. This divergence intensifies during CAI testing, manifesting in increased indentation depth and reduced width for Kevlar specimens (KS3 & KS5), and buckling for S glass specimens (SK3 & SK5), attributable to the distinct damage absorption and dispersion characteristics of Kevlar and S glass, respectively. (b) In practical applications, the selection of face sheet materials is pivotal, contingent upon specific requirements. Opting for S glass face sheets facilitates damage dispersion, while Kevlar face sheets are preferred for damage absorption scenarios. Kevlar’s propensity for localized damage simplifies repairs, whereas S glass’s damage dispersion necessitates larger and more complex repair solutions. Both configurations offer versatile solutions tailored to distinct application demands.
Footnotes
Author contributions
Zafar Iqbal: Experimental design, testing, Analysis, writing; Malik Adeel Umer: Supervision, review; Haris Ali Khan: Analysis, manuscript composition, supervision; Kamran Asim: data curation, writing.
Declaration of conflicting interests
The author(s) declared no potential conflicts of interest with respect to the research, authorship, and/or publication of this article.
Funding
The author(s) received no financial support for the research, authorship, and/or publication of this article.
Data availability statement
Data to be provided upon request.