
Abstract
The underlying cause of stiffness degradation in composites subjected to fatigue is irreversible microstructural damage, which exhibits spatial anisotropy depending on the loading conditions and structural characteristics. Each mode of microdamage represents different physical quantities, making it a challenging task to predict stiffness. In this work, machine learning (ML) models, including multiple linear regression (MLR), support vector regression (SVR) and random forest (RF), were employed to predict stiffness based on stereologically quantified damage data. High resolution Scanning Electron Microscopy imaging of edge-sectional planes was conducted during fatigue tests to quantify damage in interrupted composite materials. Experimental findings identified two distinct types of microstructural damage: (i) perpendicular cracks in woven roving mat (WRM) and chopped strand mat (CSM) under tension-tension (T-T) cyclic loading, and (ii) parallel cracks in CSM under both tension-tension and compression-compression cyclic loading. Incorporating these damage features, ML models demonstrated strong predictability of stiffness values for both CSM (T-T) and WRM (T-T) composites, with the SVR model showing particularly good agreement with experimental results for the CSM (T-T) composite. By leveraging experimental microscopy and stereology data, the ML models successfully established a non-linear relationship between microstructural damage and stiffness, providing a robust framework for understanding degradation mechanisms.
Keywords
Introduction
Given their exceptional combination of properties and significant technological relevance, it is eminent that most of the glass fibre reinforced polymer (GFRP) composites are often subjected to various types of fatigue loading. Depending on the application, structural components made from woven roving mat (WRM) and chopped strand mat (CSM) are particularly exposed to cyclic loading from vibrations and pulsating forces. For instance, these composites are commonly used in GFRP pipes within power station cooling water systems, where the pipes are subjected to a complex loading pattern that includes a background static load superimposed with sinusoidal variations. 1 The fatigue life of these composites is characterized by the initiation and accumulation of microstructural damage, leading to the degradation of their stiffness and eventual failure. Consequently, anticipating stiffness and enhancing their performance require thorough damage examinations.
In the last four decades, there has been considerable analytical and experimental effort to understand the fatigue failure of CSM and WRM composites.2–4 In the case of experimental campaigns, most research on fatigue is carried out under tension-tension (T-T) cyclic loading, while compression-compression (C-C) cyclic loading is less frequently analysed and understood. The relative scarcity of research in this area can be attributed to the inherent challenges of testing these materials under cyclic compressive loads, including the tendency of specimens to buckle and the difficulty in maintaining precise control over the stress state. 5 Assessing the extended reliability of structural components, such as GFRP pipes – which are expected to last more than 50 years – is crucial for ensuring that these products meet international standards from the early stages of design. Consequently, among various loading modes in composite design, C-C fatigue loading is paramount, necessitating increased vigilance to prevent premature failure. When research in this area is conducted, it typically focuses on developing predictive models based on the S-N curve and phenomenological approach.6,7 While these literature sources provide valuable insights into the macroscopic material behaviour, they offer no indications of the underlying microstructural damage mechanisms at the micro-length scale. For the multiscale model to have true predictive capability, an in-depth knowledge on the active fatigue damage mechanisms is indispensable. Hence, unravelling these underlying mechanisms becomes a fundamental prerequisite for enhancing the reliability of models.
Interrupted fatigue loading offers valuable insights into the progression of cracks in woven and chopped composites. The initial weakening of interface damage typically occurs in fibres that are aligned perpendicular to the applied load.
5
A schematic illustrating the damage states in the perpendicular plies, is shown in Figure 1. It is important to recall that in composite materials, fatigue damage initiation and propagation mechanism depend on the stress experienced by each of the constituent elements. Even if the composite material is subjected to the same uniaxial loads, stress state in the composite material is different. This is because of the spatial arrangement of the fibres and different fibre volume fractions. The stress/strain distribution gets influenced either due to the weaving phenomenon in WRM composite or due to random non-uniform distribution of fibres in CSM composites, thus affecting the fatigue damage evolution.
8
Hence, it becomes crucial to analyse the damage development in CSM and WRM composites under different cyclic loading. Schematic illustrating the types of damage states in perpendicular plies.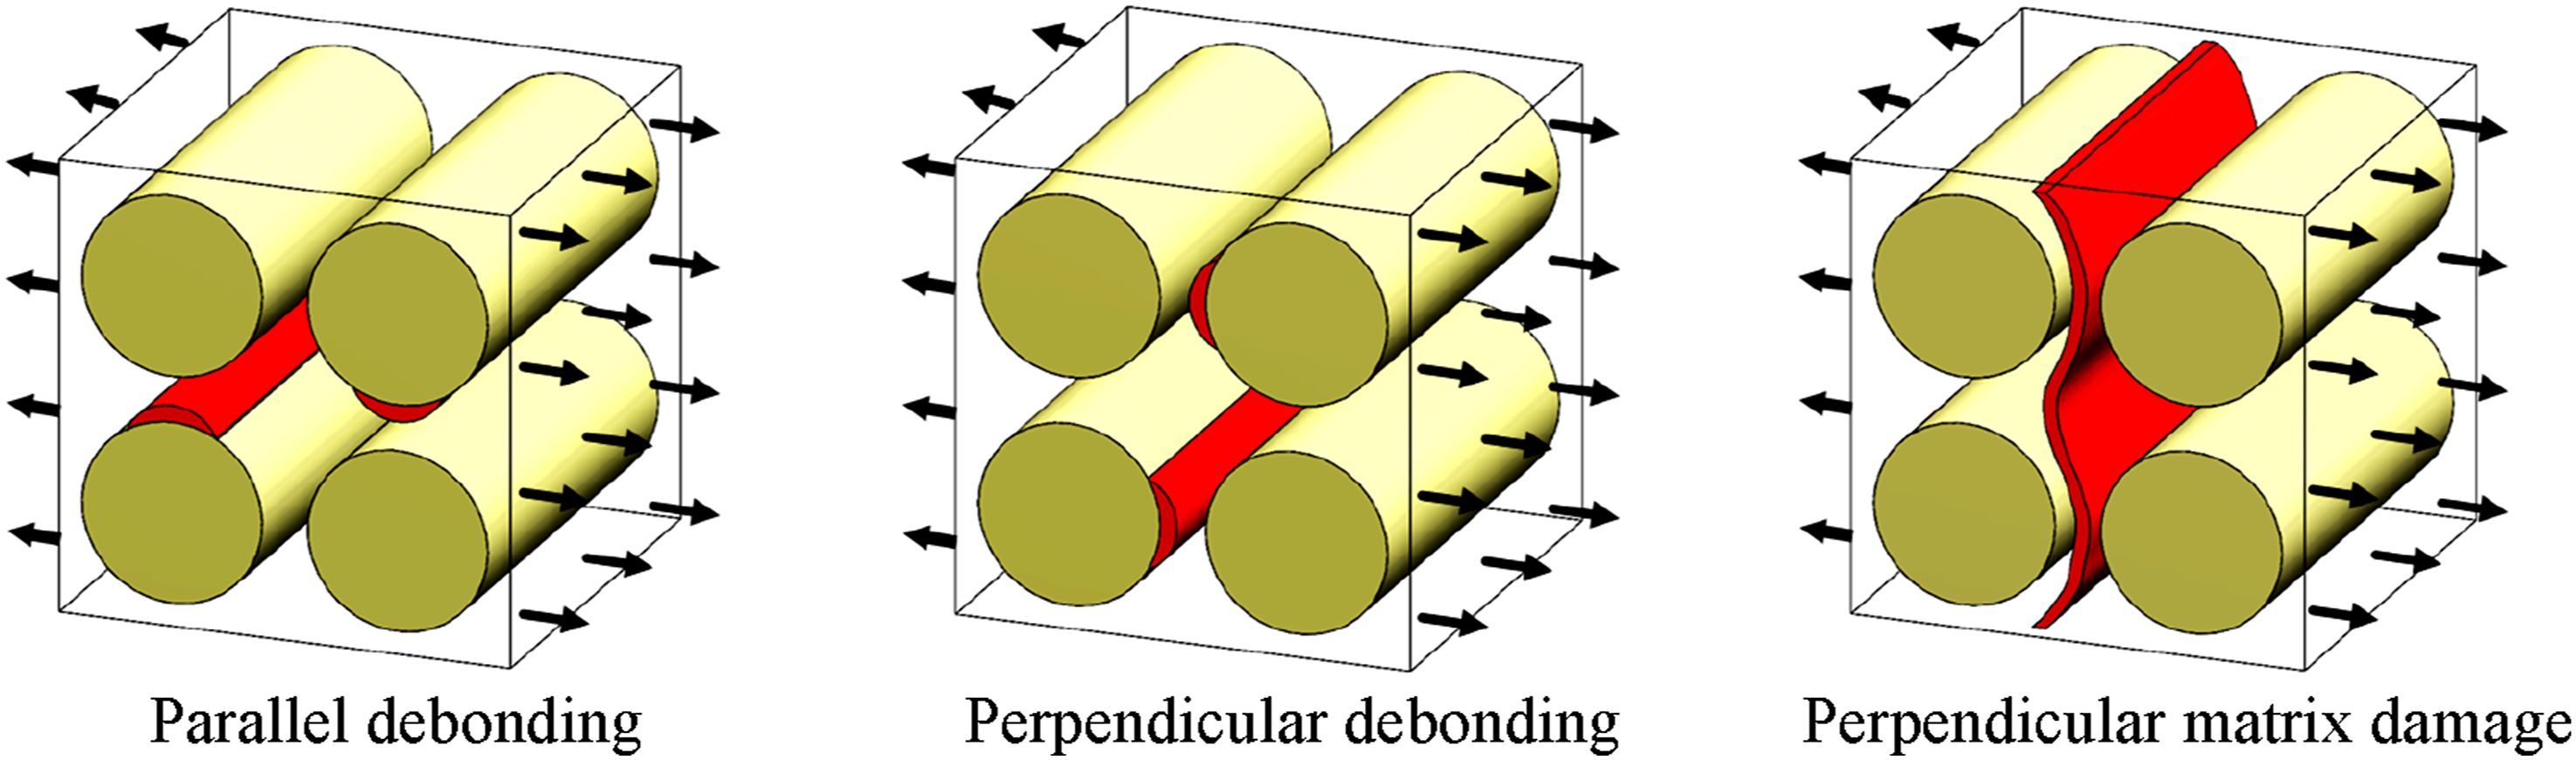
Existing studies qualitatively indicate that various types of microstructural damage progressively accumulate over the course of fatigue loading.9–11 The stiffness of a composite can be predicted for any arbitrarily complex loading history, as long as the microstructural damage state is known. 12 Therefore, capturing the progression of true microstructural damage is of significant interest. The quantification of damage requires methodologies for direct observation, including computed tomography and various microscopy techniques. However, computed tomography is limited by its spatial resolution. The extent to which damage mechanisms are observed in detail depends on both the method of observation and the sensitivity of the equipment used. Accordingly, scanning electron microscopy (SEM) needs to be used for damage quantification in combination with the stereology technique. 13
Fatigue damage in fibre reinforced polymer composites is fundamentally a structural phenomenon influenced by the composite’s geometry and material properties, adding complexity beyond that observed in metals. 14 Each mode of microdamage has its own distinct mechanism for initiation and propagation, representing a unique physical quantity, which makes the stiffness degradation problem a high-dimensional, non-linear challenge. Developing reliable and durable composite structures necessitates a detailed simulation of the mechanisms and principles governing stiffness degradation. Moreover, achieving high precision in finite element simulations requires incorporating intricate modeling features. In contrast, recent advancements in intelligent computational methods, such as machine learning (ML) and deep learning (DL), have enabled more reliable structural health monitoring. 15 ML algorithms, in particular, show significant promise by enabling rapid interpretation and insightful analysis of large, multidimensional datasets. 16 ML relies only on input and output datasets to establish correlations through efficient fitting. Recent studies have employed ML-based models to predict stiffness degradation, demonstrating excellent reliability and accuracy. 17 For instance, kernel ridge regression has shown high efficiency and accuracy (R-squared value of greater than 0.95) in predicting the elastic modulus degradation of cross-ply laminates. 17 In an interesting study by Li et al., 18 a combined computational micromechanics and ML method was utilised to investigate the transverse mechanical behaviour of UD-CFRP composites. Their study successfully predicted the transverse strengths of 1000 new microstructures, demonstrating strong correlation with finite element analysis (FEA) results. This enabled the construction of a microstructure-dependent strength criterion for UD-CFRP that fully accounts for fibre distribution effects. Li et al. 19 proposed a high-throughput FEA and ML combined approach to predict the allowable compression load of laminates. In this study, ML models were trained using design variables of notched composite laminates as inputs and critical compression loads as outputs. Similarly, Zhang et al. 20 developed artificial neural network and random forest models to learn parametric FEA models of composite laminates. Their models successfully predicted mechanical properties in three cases: the failure factor based on Puck’s theory under random stress states, the failure factor and the critical buckling eigenvalues of open-hole laminates. The predicted data closely matched FEA curves, with significantly reduced root-mean-square errors. Similarly, DL models have accurately predicted the stiffness evolution of wind turbine blades during service. 21 Azad and Kim 22 proposed an interpretable DL model based on an explainable vision transformer for the structural health monitoring of composites, leading to improved repair planning, maintenance, and performance. Li et al., 23 presented a deep transfer learning approach to define the allowable load space of notched laminates by considering various design parameters. Wang et al., 24 proposed a combined ML and FEM simulation approach to predict the failure factors of composite pressure vessels for further optimization.
Despite these advancements, developing a comprehensive ML model that links experimentally quantified damage parameters with stiffness loss in fatigue remains a significant challenge. Such a model would address the limitations of traditional mechanical models, which rely on idealised assumptions and simplifications.
In a recent study, the authors presented an ML-based stiffness prediction approach using damage data obtained from X-ray microscopy analyses of tension-compression fatigued woven composites. 25 However, this method could not be applied to CSM composites because the dye used in X-ray microscopy could not fully penetrate the material (see Supplemental material). This limitation arose due to the lack of open surface cracks and the absence of internal connectivity for liquid flow, as observed in woven composites. To address this, the present work employs high-resolution SEM analysis specifically for CSM composites. Based on the obtained true microstructural data, ML models were used to predict stiffness degradation. This study presents a key novel contribution by integrating accurately quantified microstructural damage, demonstrating for the first time that a data-driven using SEM-derived damage data can enhance fatigue analysis and provide a robust framework for understanding stiffness degradation.
Accordingly, the aims of this work include: 1. Analysing the initiation of damage at the micro-length scale within CSM and WRM composites subjected to T-T and C-C fatigue. 2. Quantifying the damage progression in these composites using unbiased stereological sampling procedures. 3. Determining the relationship between the experimentally quantified damage parameters and the stiffness degradation using ML.
Various ML models, such as multiple linear regression (MLR), support vector regression (SVR) and random forest (RF), were employed to predict stiffness reduction using quantified damage data. The predictions from these models were compared with experimentally measured stiffness values. It is important to note that, both the measured stiffness and the microstructural damage data were obtained independently through separate experimental procedures. Therefore, the model predictions represent true outcomes and are not artifacts of reverse fitting. 26
Experimental procedure
As-received material and specimen preparation
Panels of E-glass chopped strand mat (CSM (450 gsm)) consisting of six layers and panels of woven roving mat (Plain woven - WRM (1000 gsm)) consisting of five layers were sourced from a commercial supplier in India. The respective mats were stacked with vinyl ester resin. ASTM standard D3171 was followed to obtain fibre volume fraction, resulting in values of 0.4 for the WRM composite, and 0.2 for the CSM composite.
All the test specimens for monotonic and fatigue tests were water jet cut from the composite panels. The quasi-static tensile and fatigue coupon specimens were prepared according to the geometry shown in Figure 2(a). This specimen geometry was entirely adapted from Ref. 27. To determine the quasi-static compression properties, specimens were prepared according to the geometry shown in Figure 2(b), following the ASTM standard D6641. Specimen geometries used for (a) monotonic tensile and fatigue tests and (b) monotonic compression test (dimensions in mm).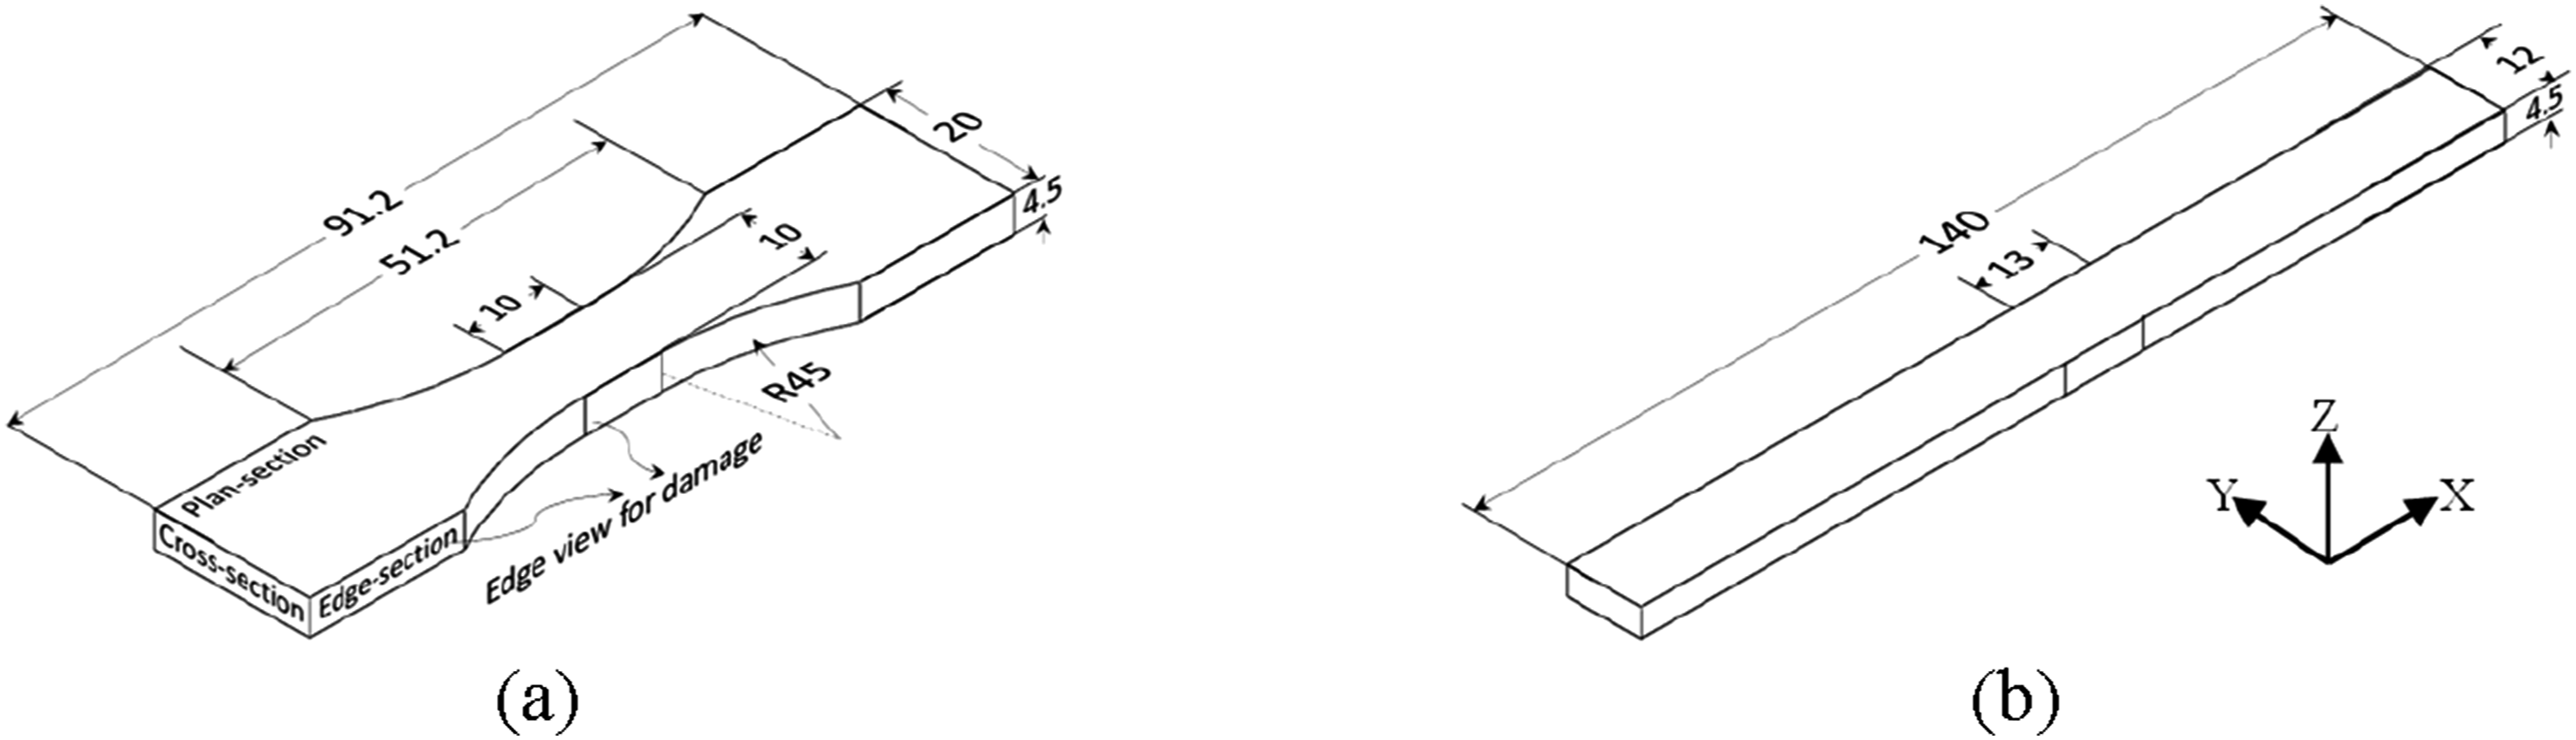
Static and fatigue testing
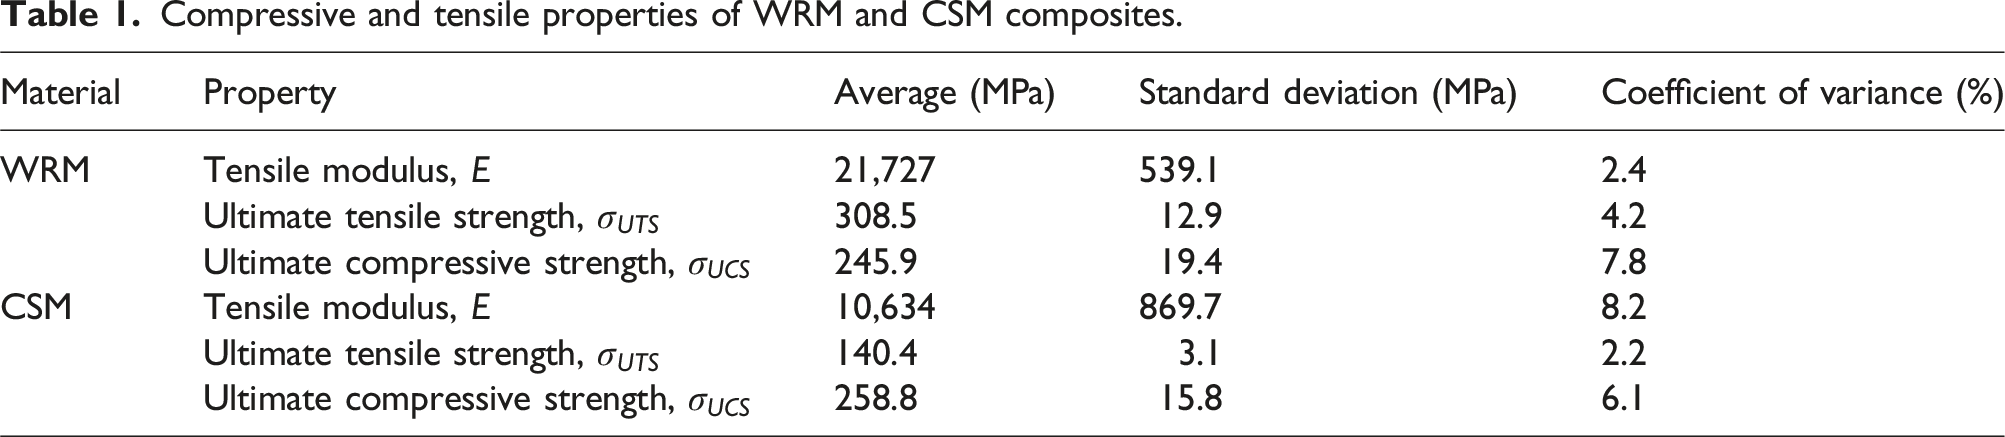
Compressive and tensile properties of WRM and CSM composites.
Interrupted fatigue test parameters.
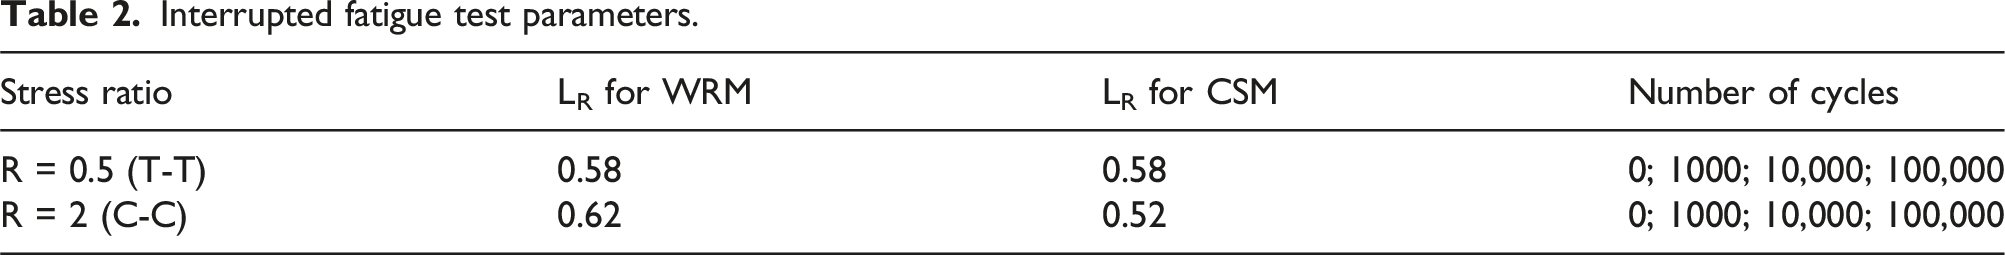
With the mentioned load ratios in Table 2, an additional set of specimens was subjected to cyclic loading without reaching failure to generate different levels of damage. This process was performed on multiple specimens, each representing a distinct stage of fatigue degradation. The specimens underwent cyclic loading for 103, 104 and 105 cycles, followed by sectional microscopic analysis to assess the underlying damage mechanisms. For each cycle count, only one specimen was tested in fatigue for each case. Throughout the fatigue loading process, the dynamic stiffness of all specimens was continuously tracked by recording the valley and peak strains and loads measured by the testing apparatus during each cycle. Data points were recorded at every cycle during the fatigue test. Based on this data, the axial stiffness was determined using the hysteresis loop’s secant slope.
Microstructural damage characterization
For any microstructural-based characterization, a properly prepared sample for imaging is of utmost importance. The surface-based damage in each specimen subjected to a prescribed number of fatigue cycles was characterized by using SEM.
The fatigued specimens were sliced into three mutually perpendicular sections, representing the edge, cross-section and top (plan) views (Figure 2(a)) for both composites. An illustration of the damage types observed in the edge section of these two composites is presented in Figures 5–7. The Secotom-10 (Struers Inc.) precision cutoff machine with a diamond wheel was used to slice the specimens at a feed rate of 0.02 mm/s and a moderate speed of 3000 RPM. Only one section from each view was analysed for each test sample. The slicing process was carried out with the utmost caution to prevent the introduction of any damage.
Subsequently, following the cold mounting procedure, these parts were inserted into epoxy molds, with 24 h of room temperature curing. To achieve the necessary surface finish, the mold was subjected to rough grinding and fine polishing using an automatic polisher (Tegramin-30 system Struers Inc.). A standard metallographic preparation procedure was followed to minimize any potential adverse effects, starting with coarse grinding using 180 grit abrasive paper, followed by fine grinding from 320 grit to 2500 grit abrasive paper. A thoroughly cleaned specimen is essential for effective polishing. Ultrasonic bathing and running water aid in removing any residual debris from the ground surface. The polishing process involved multiple stages: initially using a cloth moistened with suitable lubricant and a diamond suspension of 9 μm particle size, followed by a softer polishing pad with 3 μm diamond suspension and reduced pressure. After this, the specimen’s surface achieved an almost mirror-like finish, free of visible scratches. For the final polishing stages, the specimen underwent a third polishing operation using a 0.5 μm diamond suspension, followed by a final polish with 50 nm (0.05 μm) colloidal silica to eliminate any remaining surface imperfections. In between the polishing process, the polished samples were examined using a Zeiss Axioscope seven upright optical motorised microscope to have an overview image of damage distribution on the specific sectioned plane.
Before imaging the samples in SEM, the WRM and CSM polished sections were sputter coated with the help of an automatic sputter machine with gold target. Subsequently, a Zeiss Gemini SEM 560 was used to examine the damages on a specific sectional plane. The imaging was carried out with a secondary electron and in-lens detector. To conduct quantitative microscopy, high-resolution large area montage of images was created by tiling contiguous micrographs. 30 The montage spanning the entire edge section was obtained for each composite. The obtained images were used for quantitative analysis of surface-based true three-dimensional microstructural damage.
Quantitative stereology for damage measurement
With the help of the stereology technique, 13 the three-dimensional microstructural parameters can be inferred from two-dimensional micrograph measurements. The fundamental stereological equations were utilized to quantify damage, and their derivation can be rigorously established using sigma algebra. 31
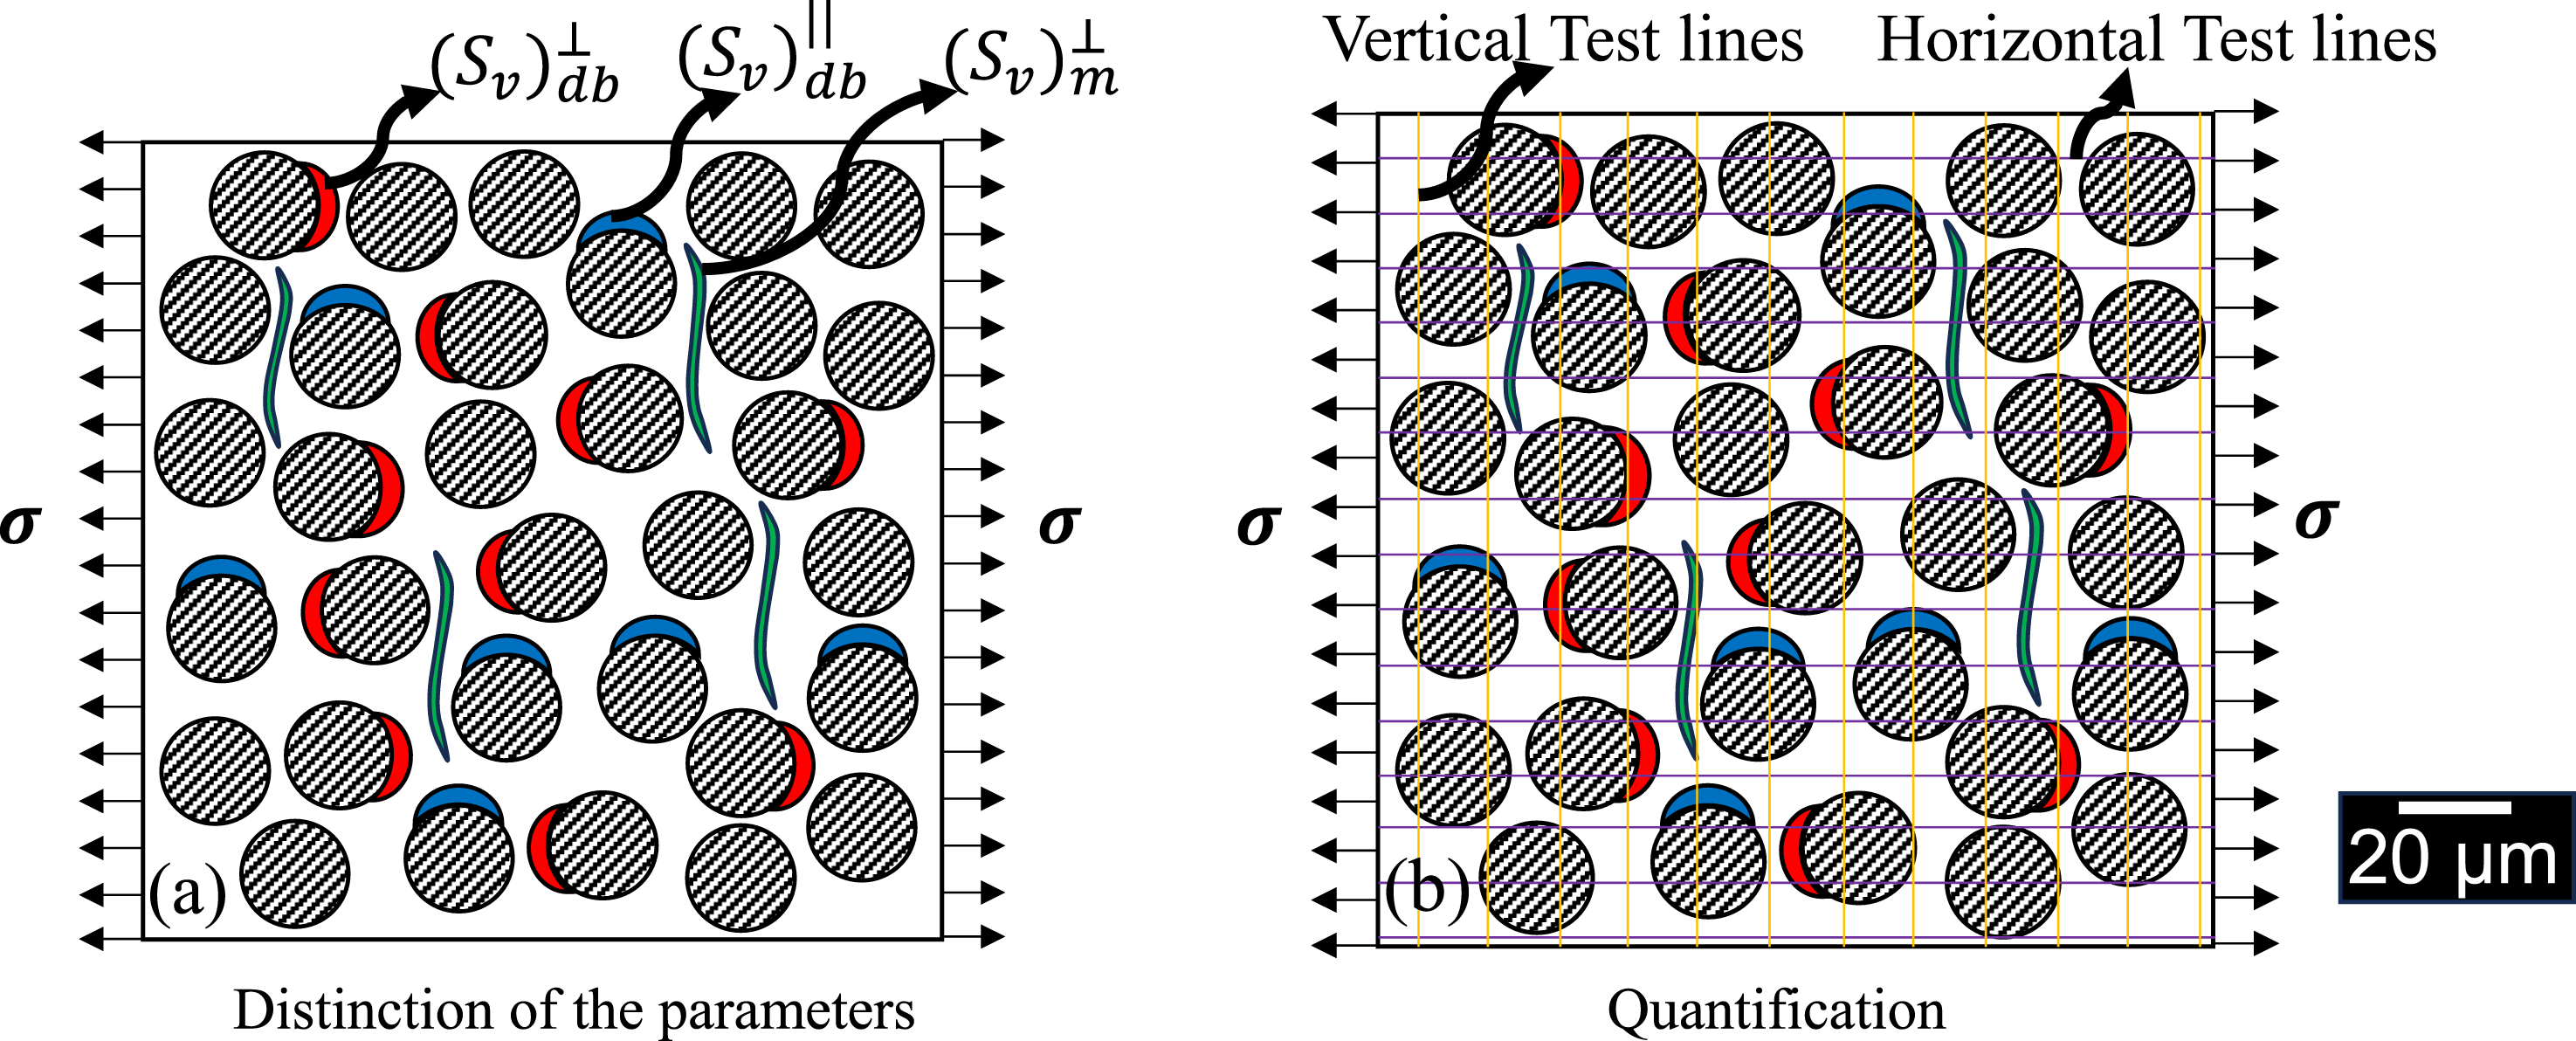
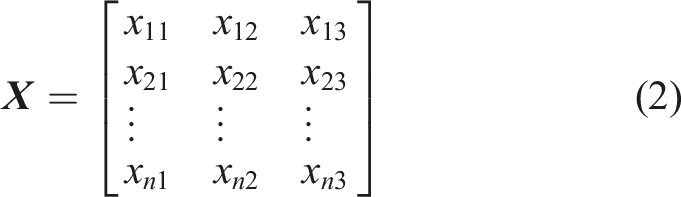
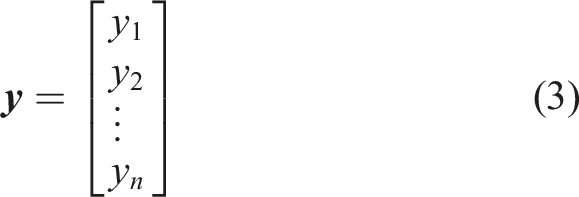
The parallel interface debonding area is determined from micrographs capturing debonding along the loading direction, while the perpendicular interface debonding area is measured from micrographs showing debonding perpendicular to the loading direction. Perpendicular matrix microstructural damage is quantified through crack surface density, defined as the matrix crack surface area per unit volume. These microstructural damages are defined in generic form as shown in equation (1). (a) Distinction of the parameter 
Results
Fatigue test results
Figure 4 illustrates the variation in normalised stiffness reduction as a function of the number of cycles (N) for WRM and CSM composites. Normalised modulus degradation of WRM and CSM at R = 0.5 (T-T) and 2 (C-C). (a) (Semi-log scale) (b) Linear scale.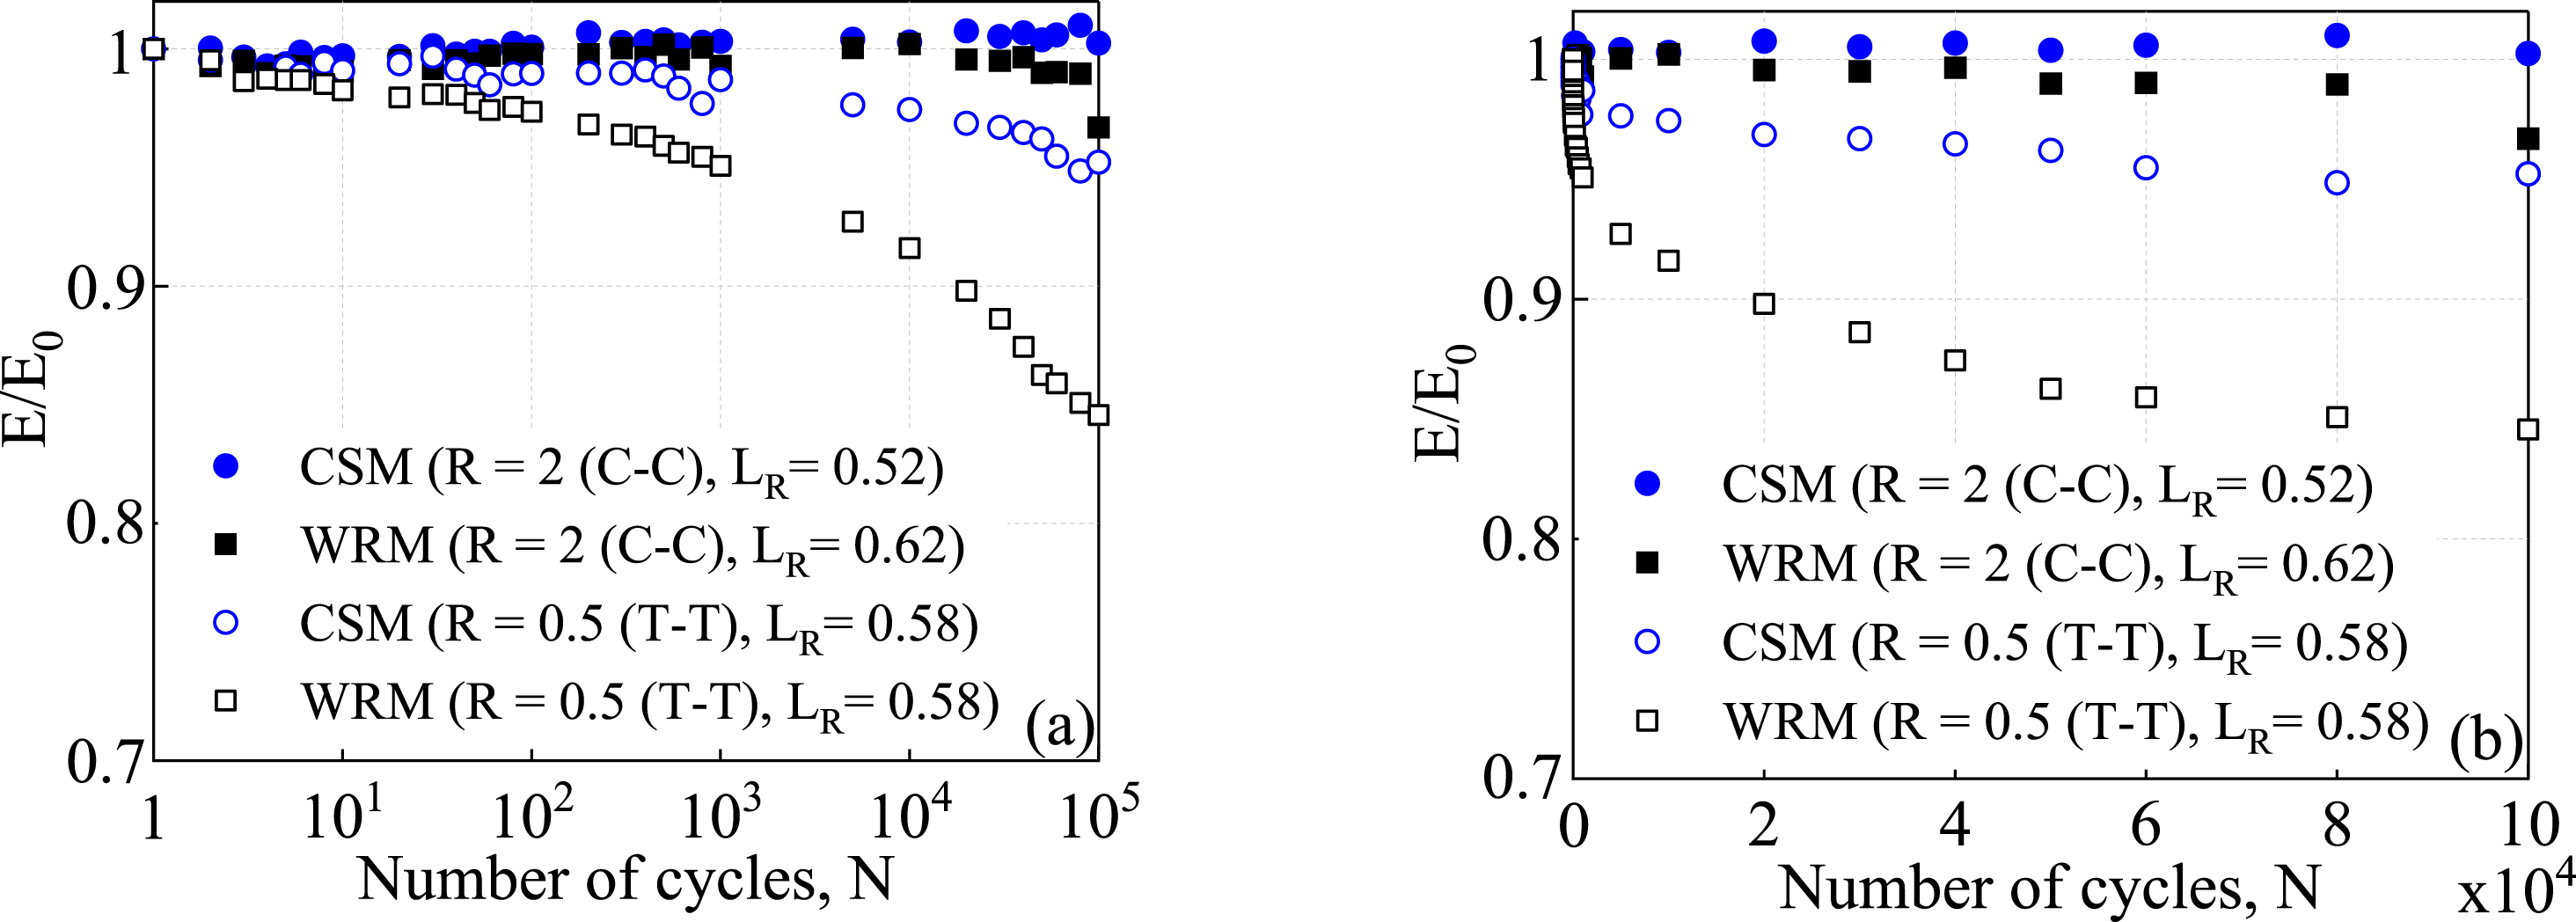
If observed on both linear and logarithmic scale, it is evident that T-T loading significantly impacts the normalised stiffness of both composites, whereas C-C damage has little influence on their normalised stiffness. This can be attributed to the inherent structural differences and the respective responses to the external loads. The normalised stiffness degradation of WRM composite under C-C fatigue loading is comparable to those found in Ref. 29.
Throughout the plot, it is observed that under T-T cyclic load, stiffness degradation is lower in CSM composite compared to that in WRM. In WRM composite, the weaving phenomenon leads to efficient load transfer along the fibre direction. However, this weaving phenomenon makes the composite more susceptible to degradation in the stiffness occurring due to the fibres which are perpendicular to the loading direction. The WRM composites are prone to meta-delamination and can propagate more easily in the organised fibre structure, causing a quicker reduction in stiffness. On the other hand, randomly oriented fibres, in CSM composite can mitigate the damages commonly observed in WRM composite. The lack of preferential pathways for crack propagation can slow down the degradation of modulus over time. In the case of C-C cyclic loading, almost no clear trend was seen in the normalised stiffness curves of both composites. This is because of minimal changes in normalised stiffness reduction. In the subsequent section, results obtained from microscopic examination are presented.
Analyses of damage at micro-scale
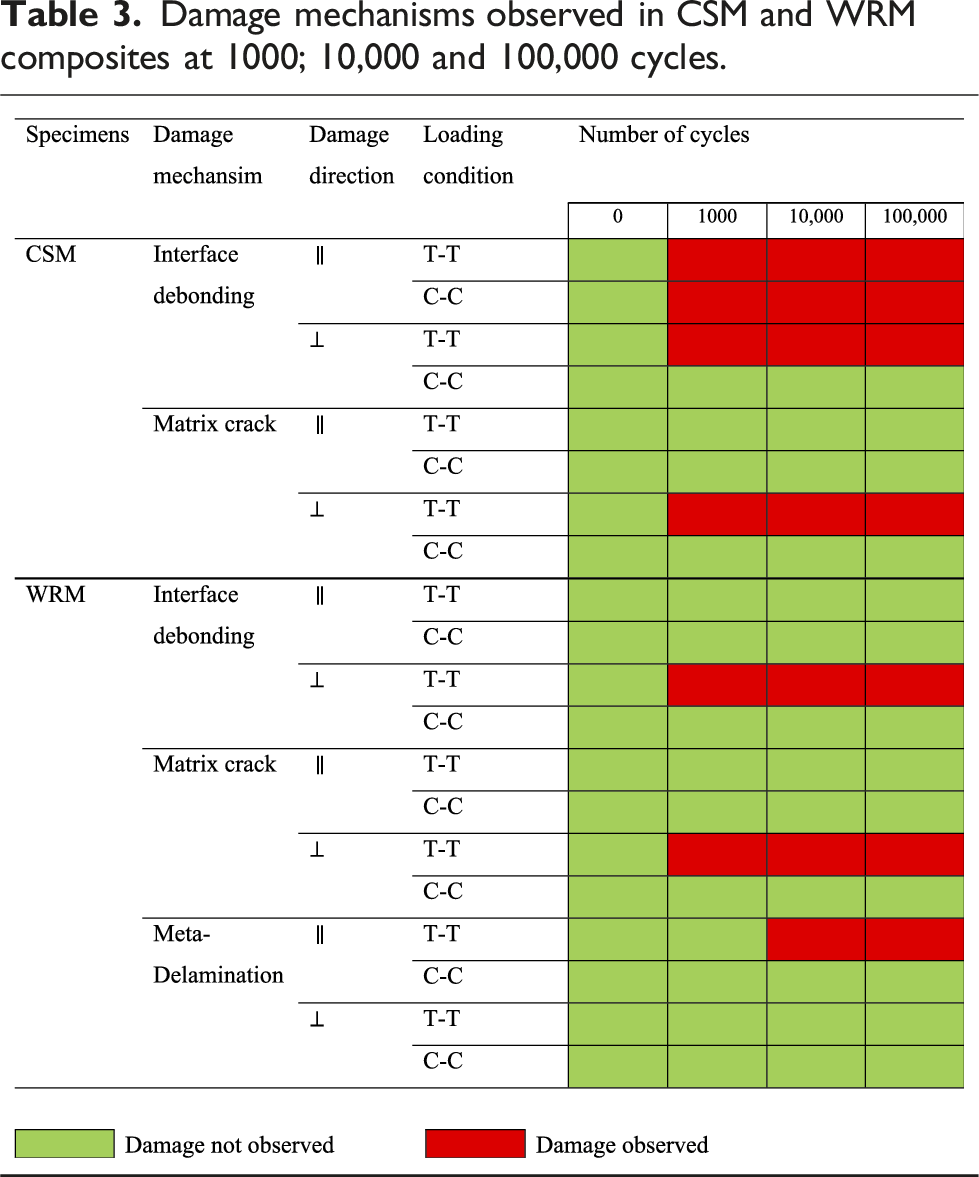
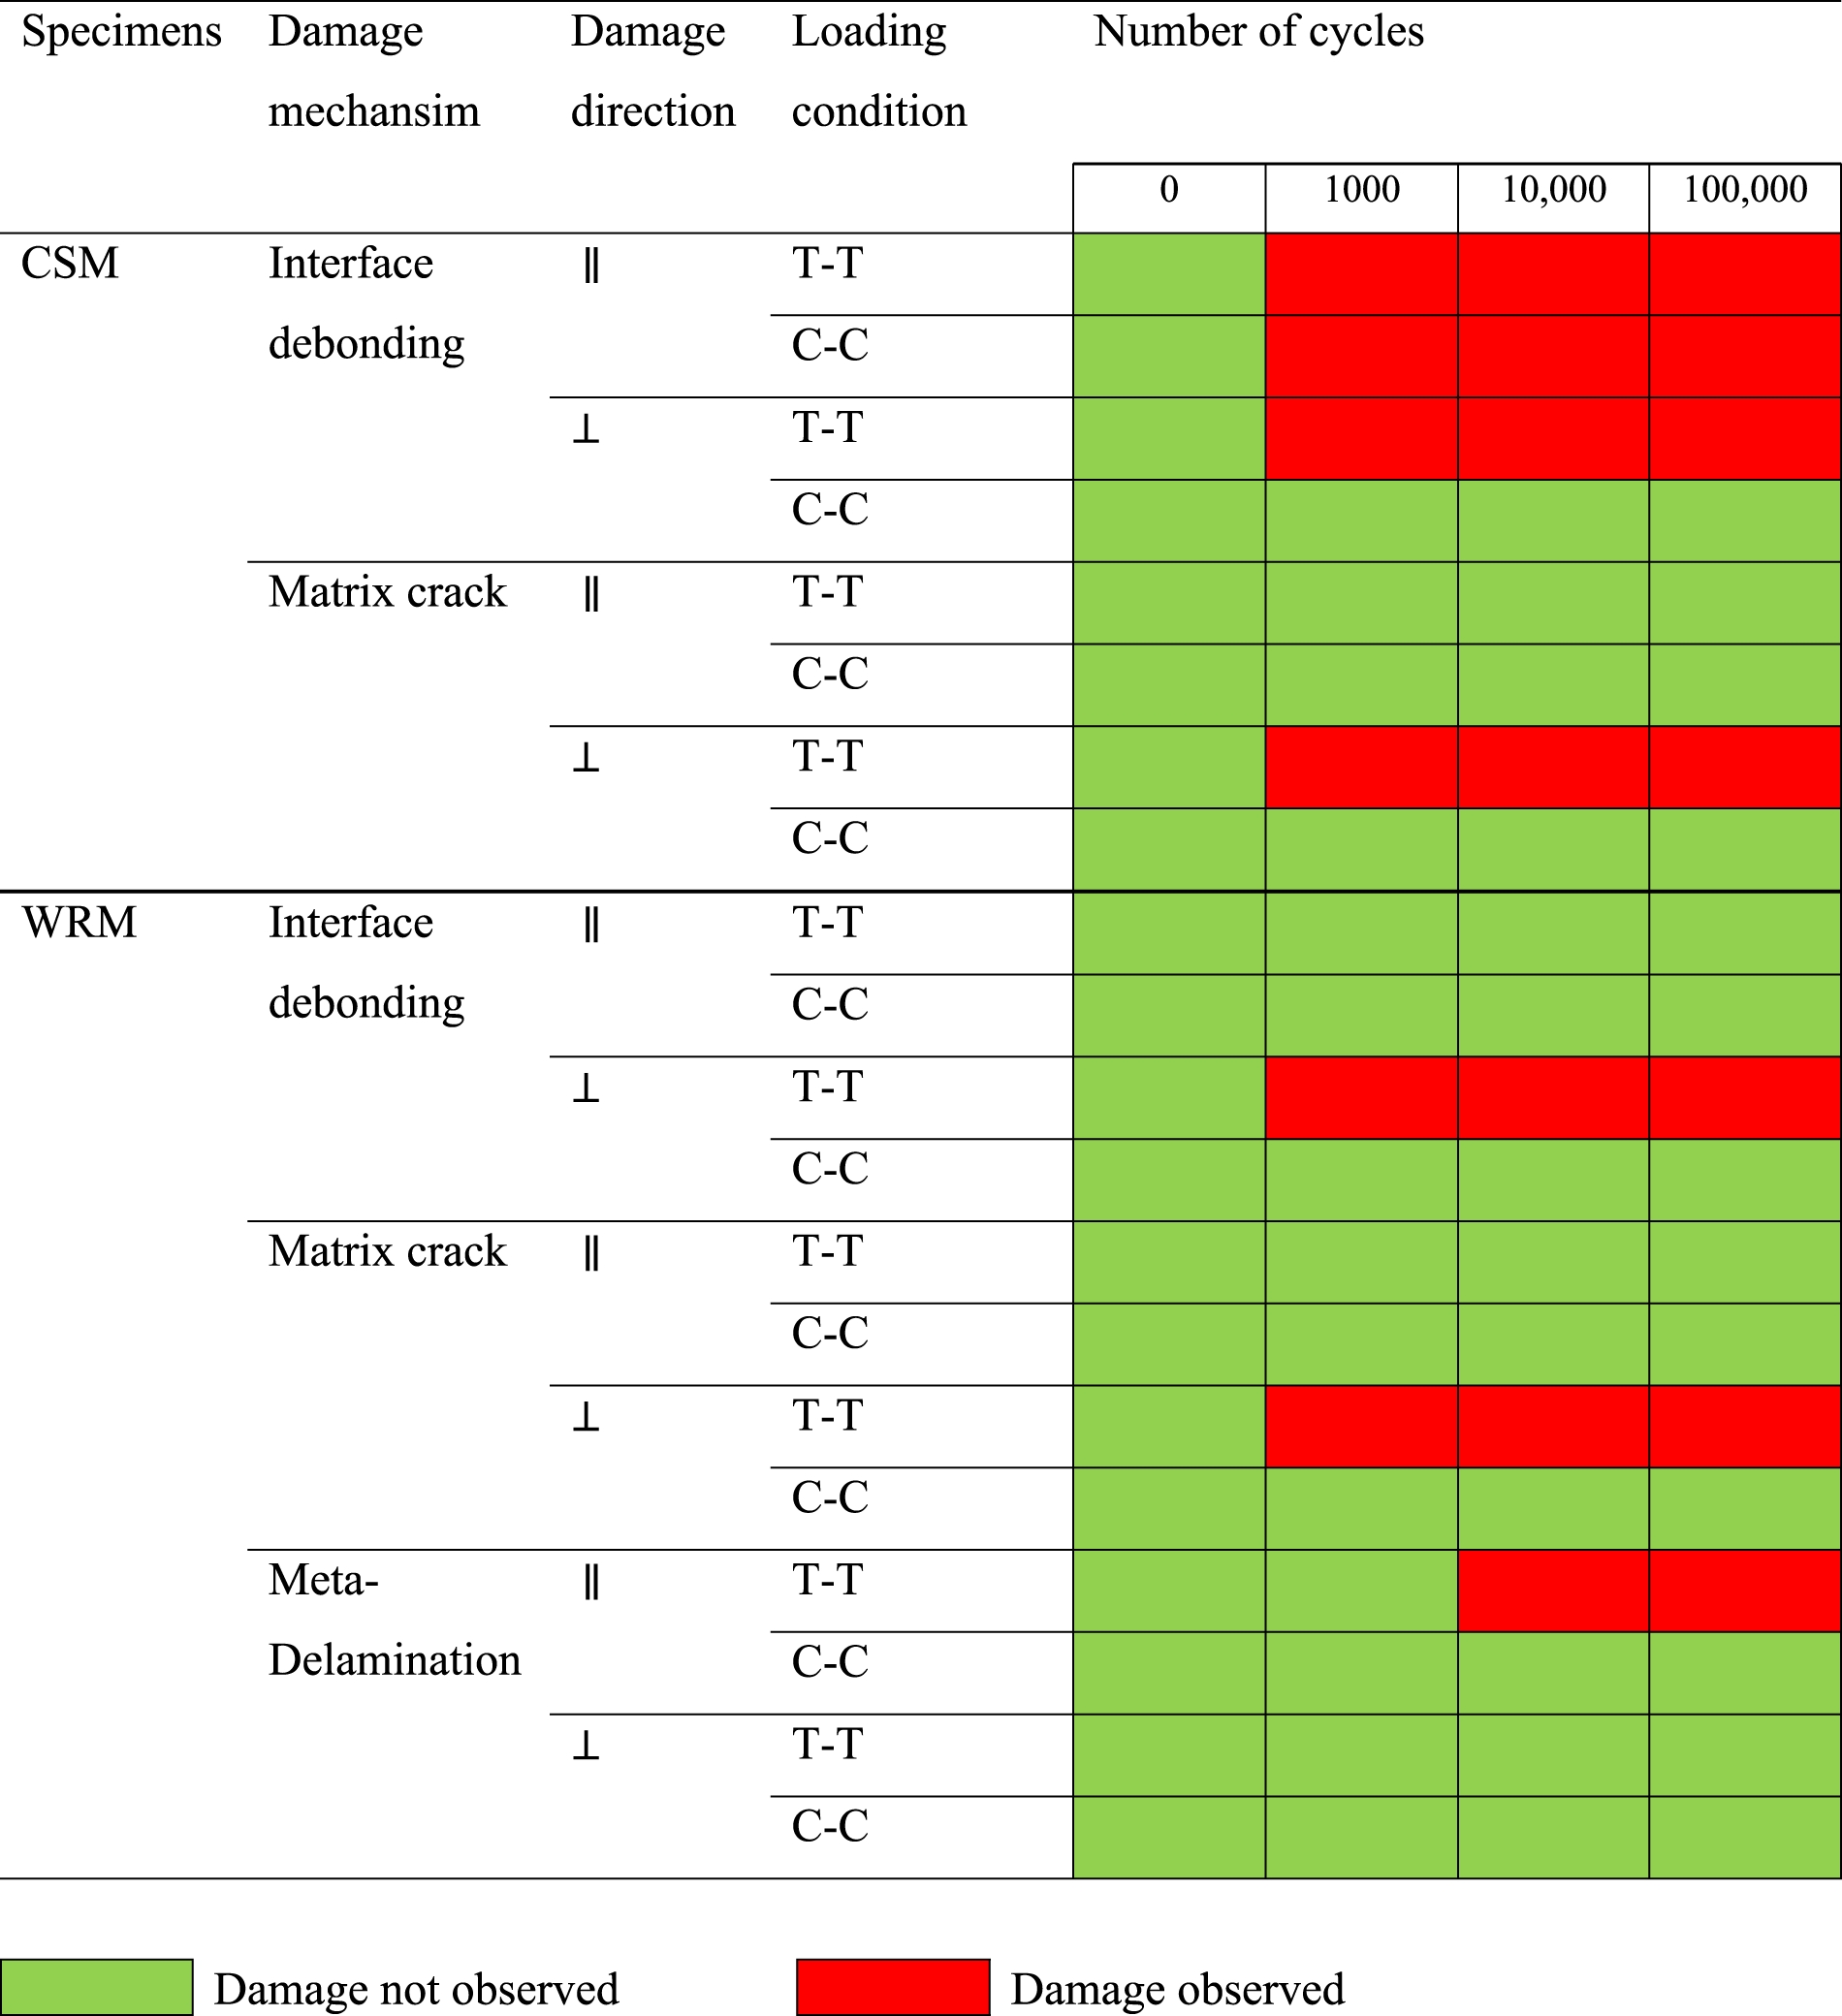
Damage mechanisms observed in CSM and WRM composites at 1000; 10,000 and 100,000 cycles.
The details of the pristine WRM and CSM specimen can be found in the Supplemental material. Figure 5 illustrates the damage mechanisms occurring at R = 0.5 (T-T) in the WRM composite. Edge observations reveal that at 1000 and 10,000 cycles, cracks predominantly form perpendicular to the loading direction. Such damages are characteristic of WRM composites subjected to T-T cyclic loading. It represents one of the significant microstructural damages, the cause of which has been well documented in several research studies.
9
(a) Development of interface crack only along perpendicular to the loading direction at 1000 cycles. (b) Growth of interface crack observed at 10,000 cycles on the edge view.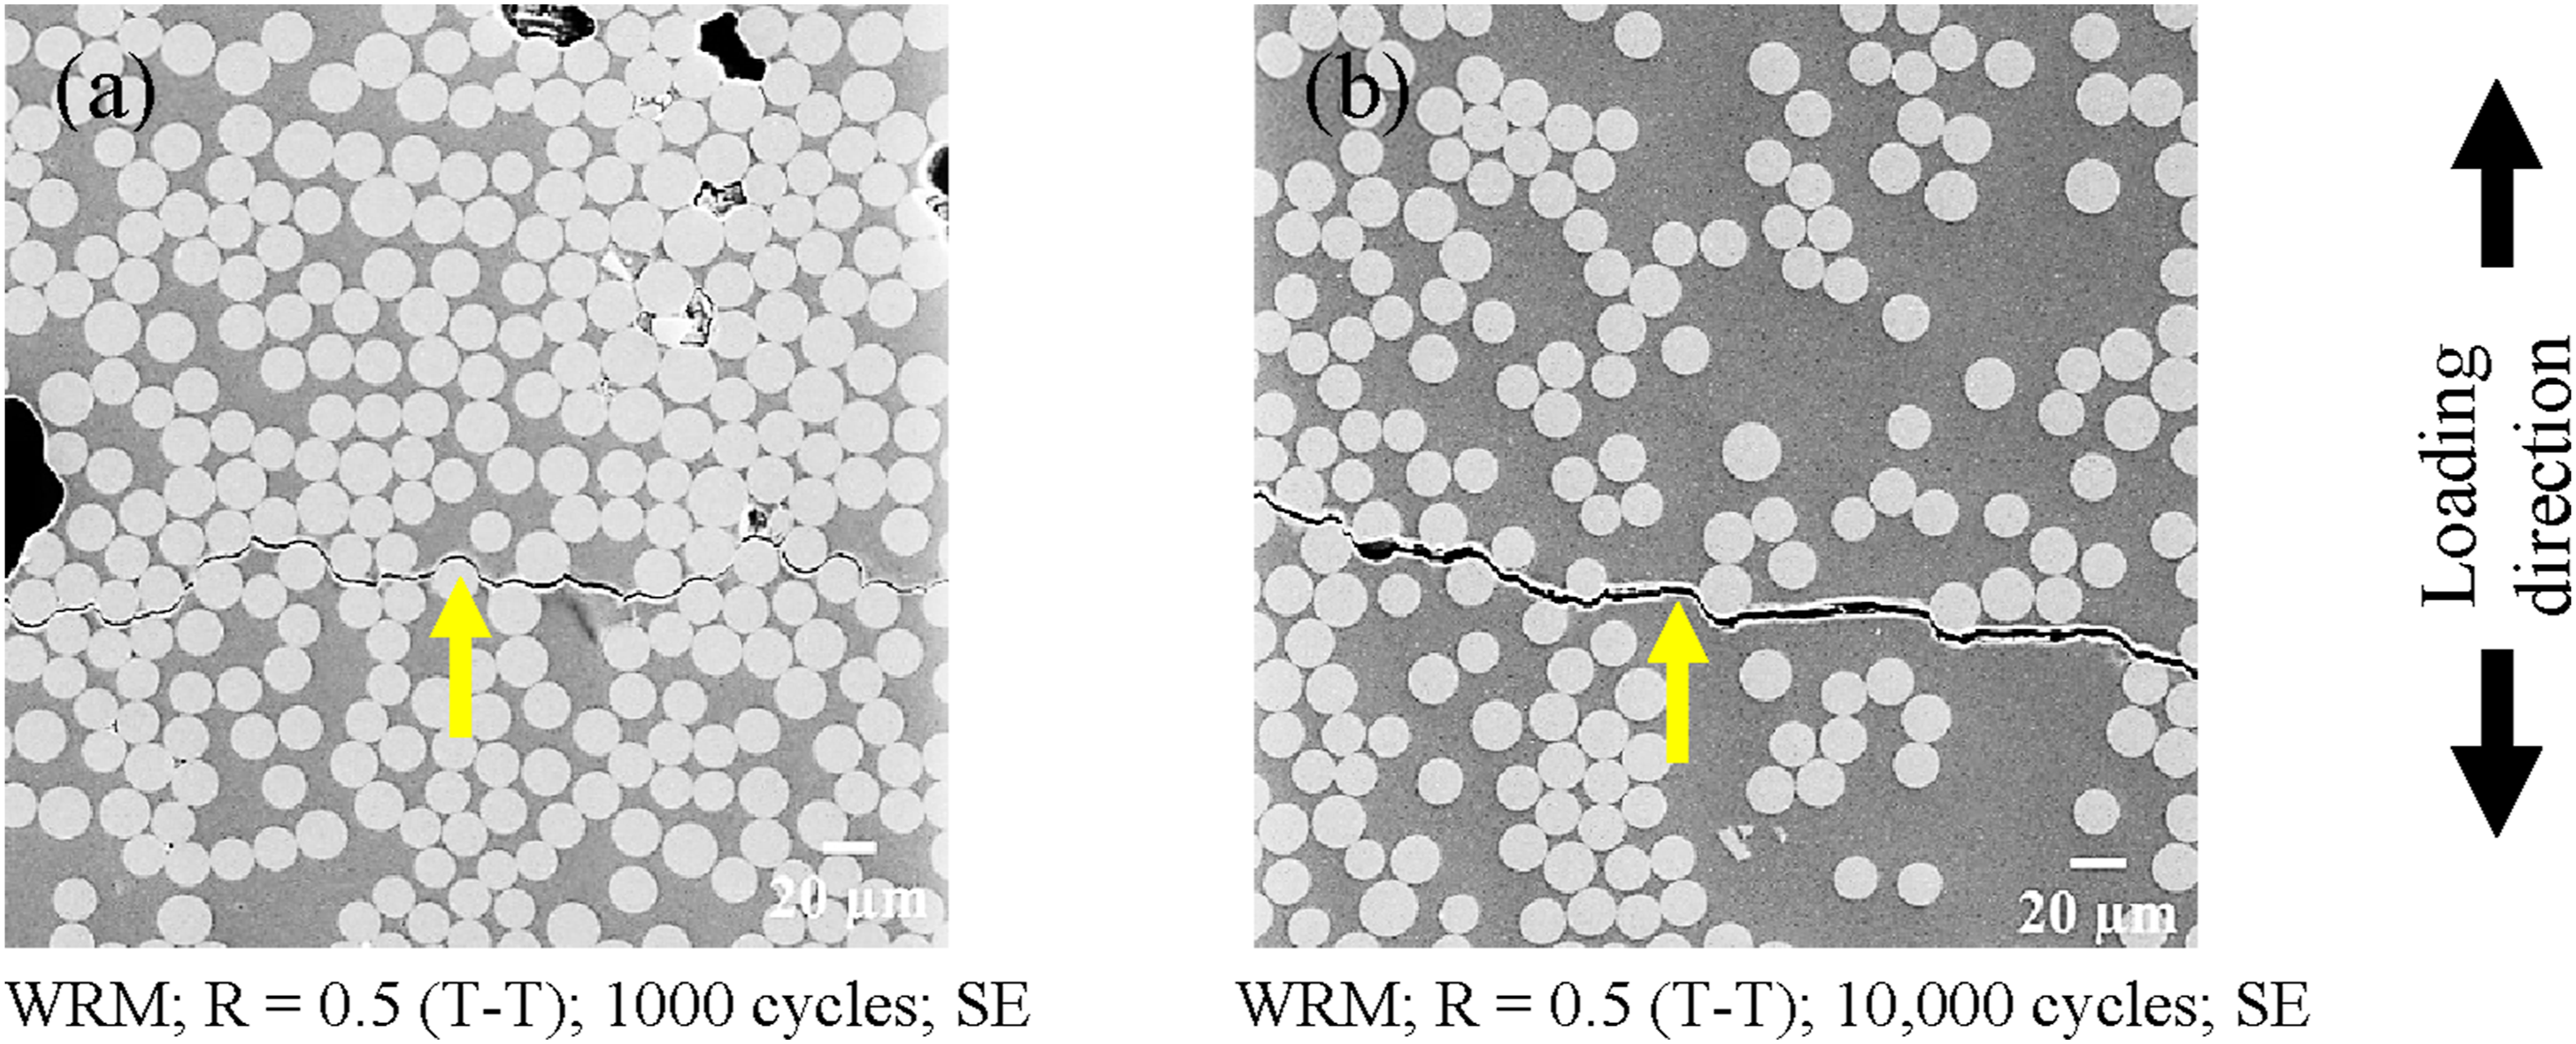
Conversely, no damage was observed in any of the three mutually perpendicular sections of WRM composites subjected to C-C cyclic loading. This absence of damage is attributed to the relatively lower loads applied in this study, aimed at reaching 105 cycles, compared to the ones applied in Ref. 29. WRM appears to be more sensitive to T-T fatigue loading wherein the initial crack starts from the fibre-matrix interface. Moreover, the fibre volume fraction is far more than that of the CSM. Therefore, large resin rich regions are not observed.
In the case of CSM composite, fibres are randomly oriented in a plane. However, fibres are in clusters where each cluster has fibres all oriented in one direction. Each fibre cluster in turn however is randomly oriented. Moreover, CSM composite has a very low volume fraction of glass fibre. Under T-T cyclic loading, the crack initiates at the interface of fibre and matrix which is perpendicular to the loading direction (Figure 6). (a) Development of perpendicular interface crack at 1000 cycles. (b) Growth of interface crack parallel to the loading direction at 10,000 cycles observed on the edge view.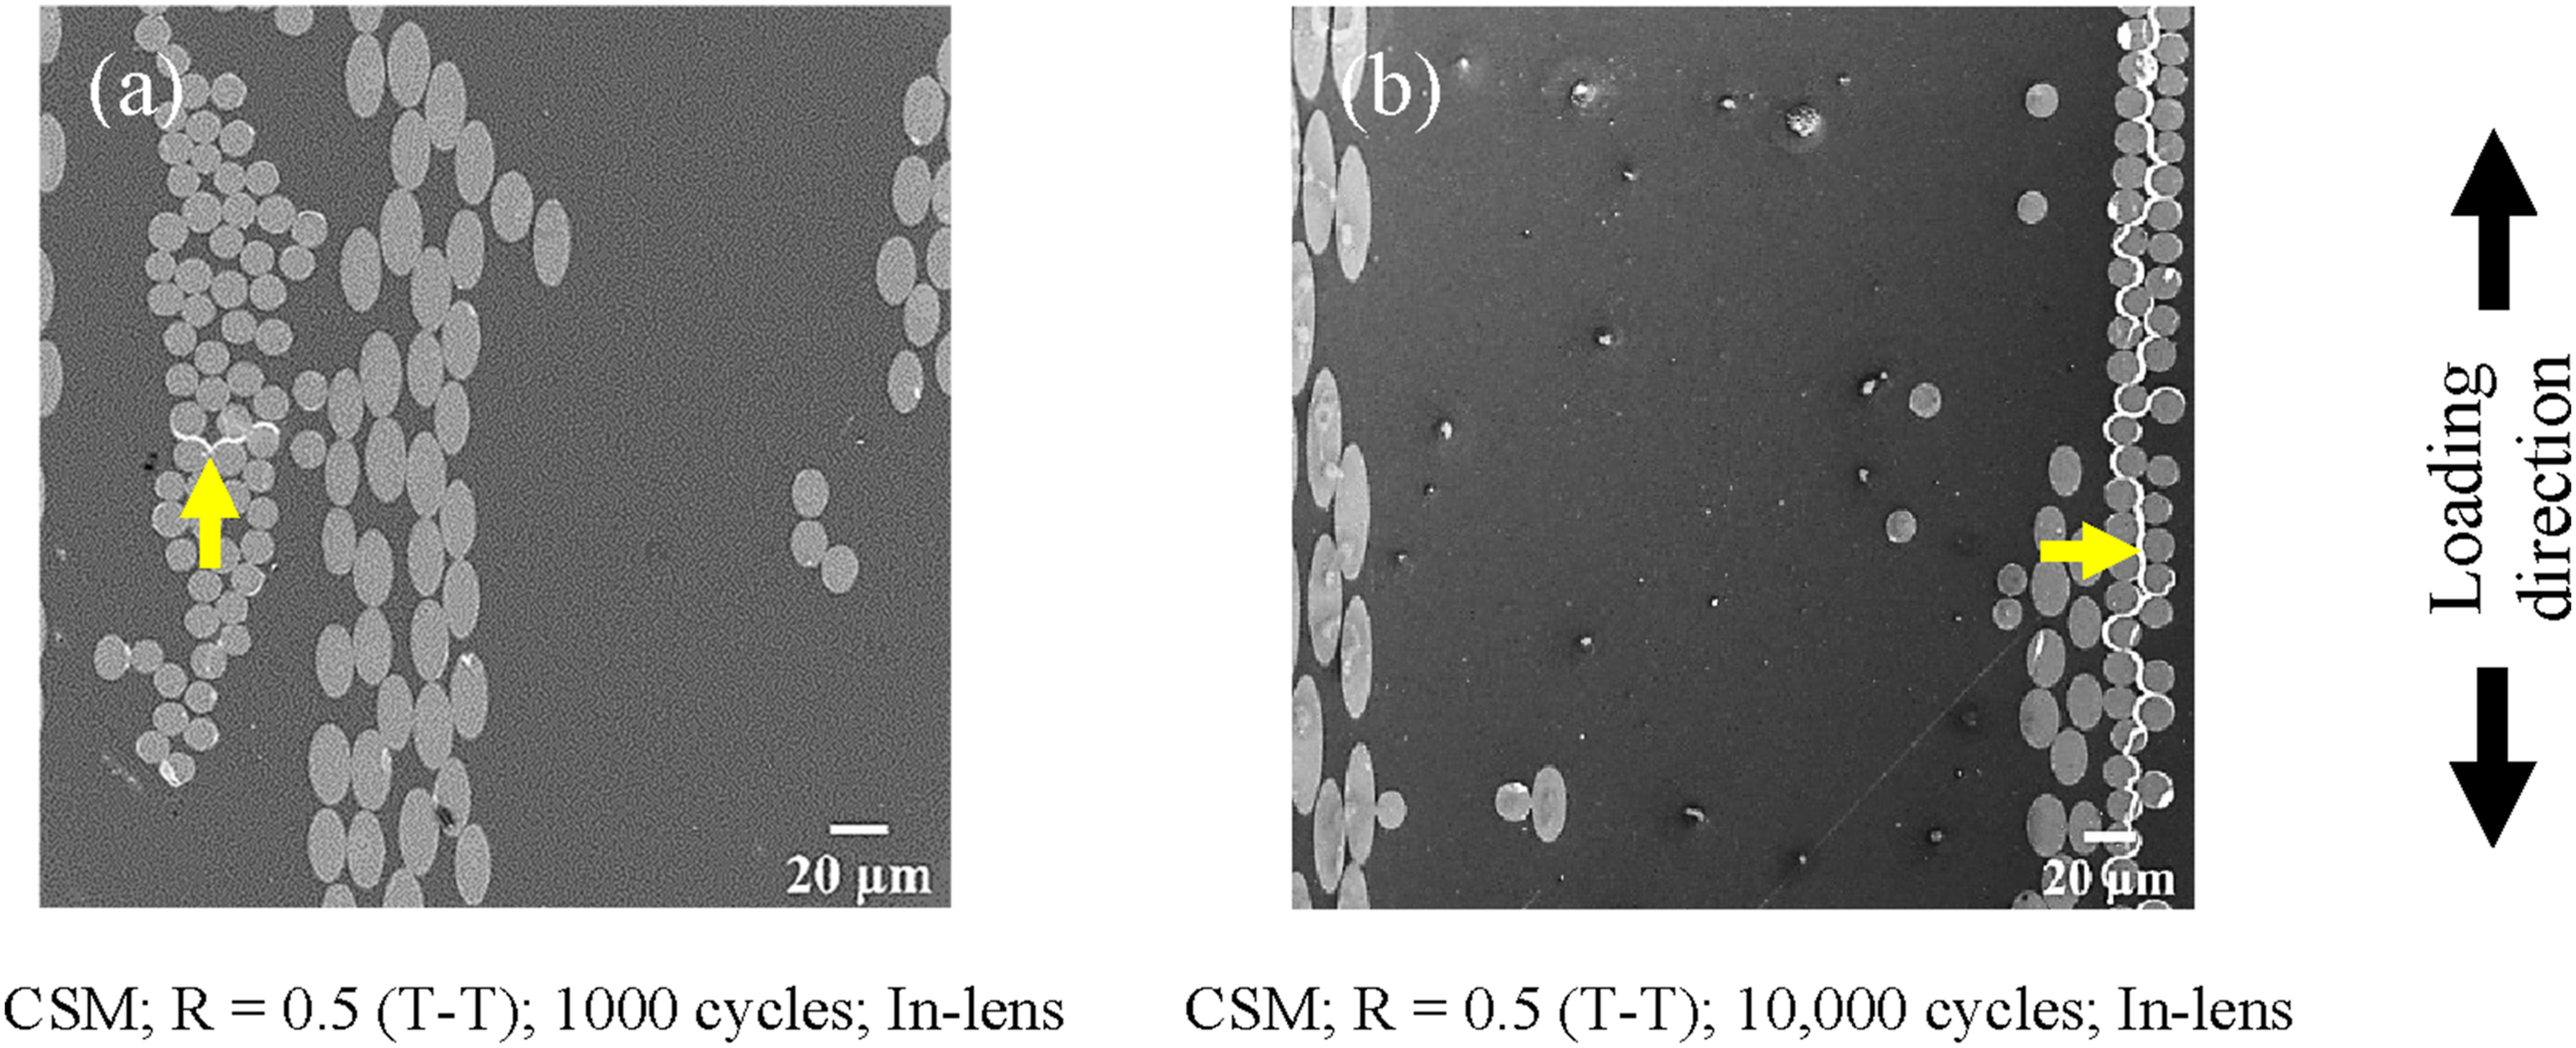
Given that the fibres are oriented in various directions, only a small fraction aligns with this perpendicular orientation. As a result, these fibres are the most likely to develop interfacial cracks (Figure 6(a)). It is observed that any fibre which has an elliptical shape 1 does not have an interface cracked. Because fibres are bunched in clusters with the same orientation, the fibre-matrix debonding also gets concentrated in these clusters which are perpendicular to the loading direction. The high density of interfacial cracking leads to stress concentration which start triggering cracks parallel to the loading direction (Figure 6(b)). Interestingly, these parallel cracks predominantly appear in the central regions of the specimen’s thickness rather than at the edges (as seen in large area high resolution montage image in supplementary material (Figure S6(b)). This finding aligns with the observations reported in Ref. 10. The authors suggest that the low fibre volume fraction plays a crucial role in this phenomenon. Under T-T fatigue, the region which has high fibre density exhibit less deformation strain. Thus, if a low-volume fraction region is adjacent to a high-volume fraction region with fibres perpendicular to the loading direction, differential strains between the fibre-rich and matrix rich areas occur. This differential strain is believed to generate shearing stress. 28 Because the fibre interfaces are already cracked in this region, the shear stress will cause the fibre-matrix interface to crack parallel to the loading direction. It is clearly observed that this always happens when fibre clusters which are perpendicular to the loading direction are in the vicinity of a resin rich region (Figure 6(b)).
In the CSM composite under C-C cyclic loading, cracks originate at the fibre-matrix interface aligned parallel to the loading direction. This occurs due to the development of tensile stresses at the fibre-matrix boundary in the transverse direction.
32
Figure 7 reveals that perpendicular fibres are once again the most likely to develop interfacial cracks. Similar to T-T fatigue, under C-C fatigue, shear stress is generated due to differential strain arising from the difference in volume fraction between resin rich regions and fibre rich regions. Consequently, cracks develop parallel to the loading direction. (a) Development of interface crack along the loading direction. (b) Higher displacement of interface crack parallel to the loading direction observed on the edge view.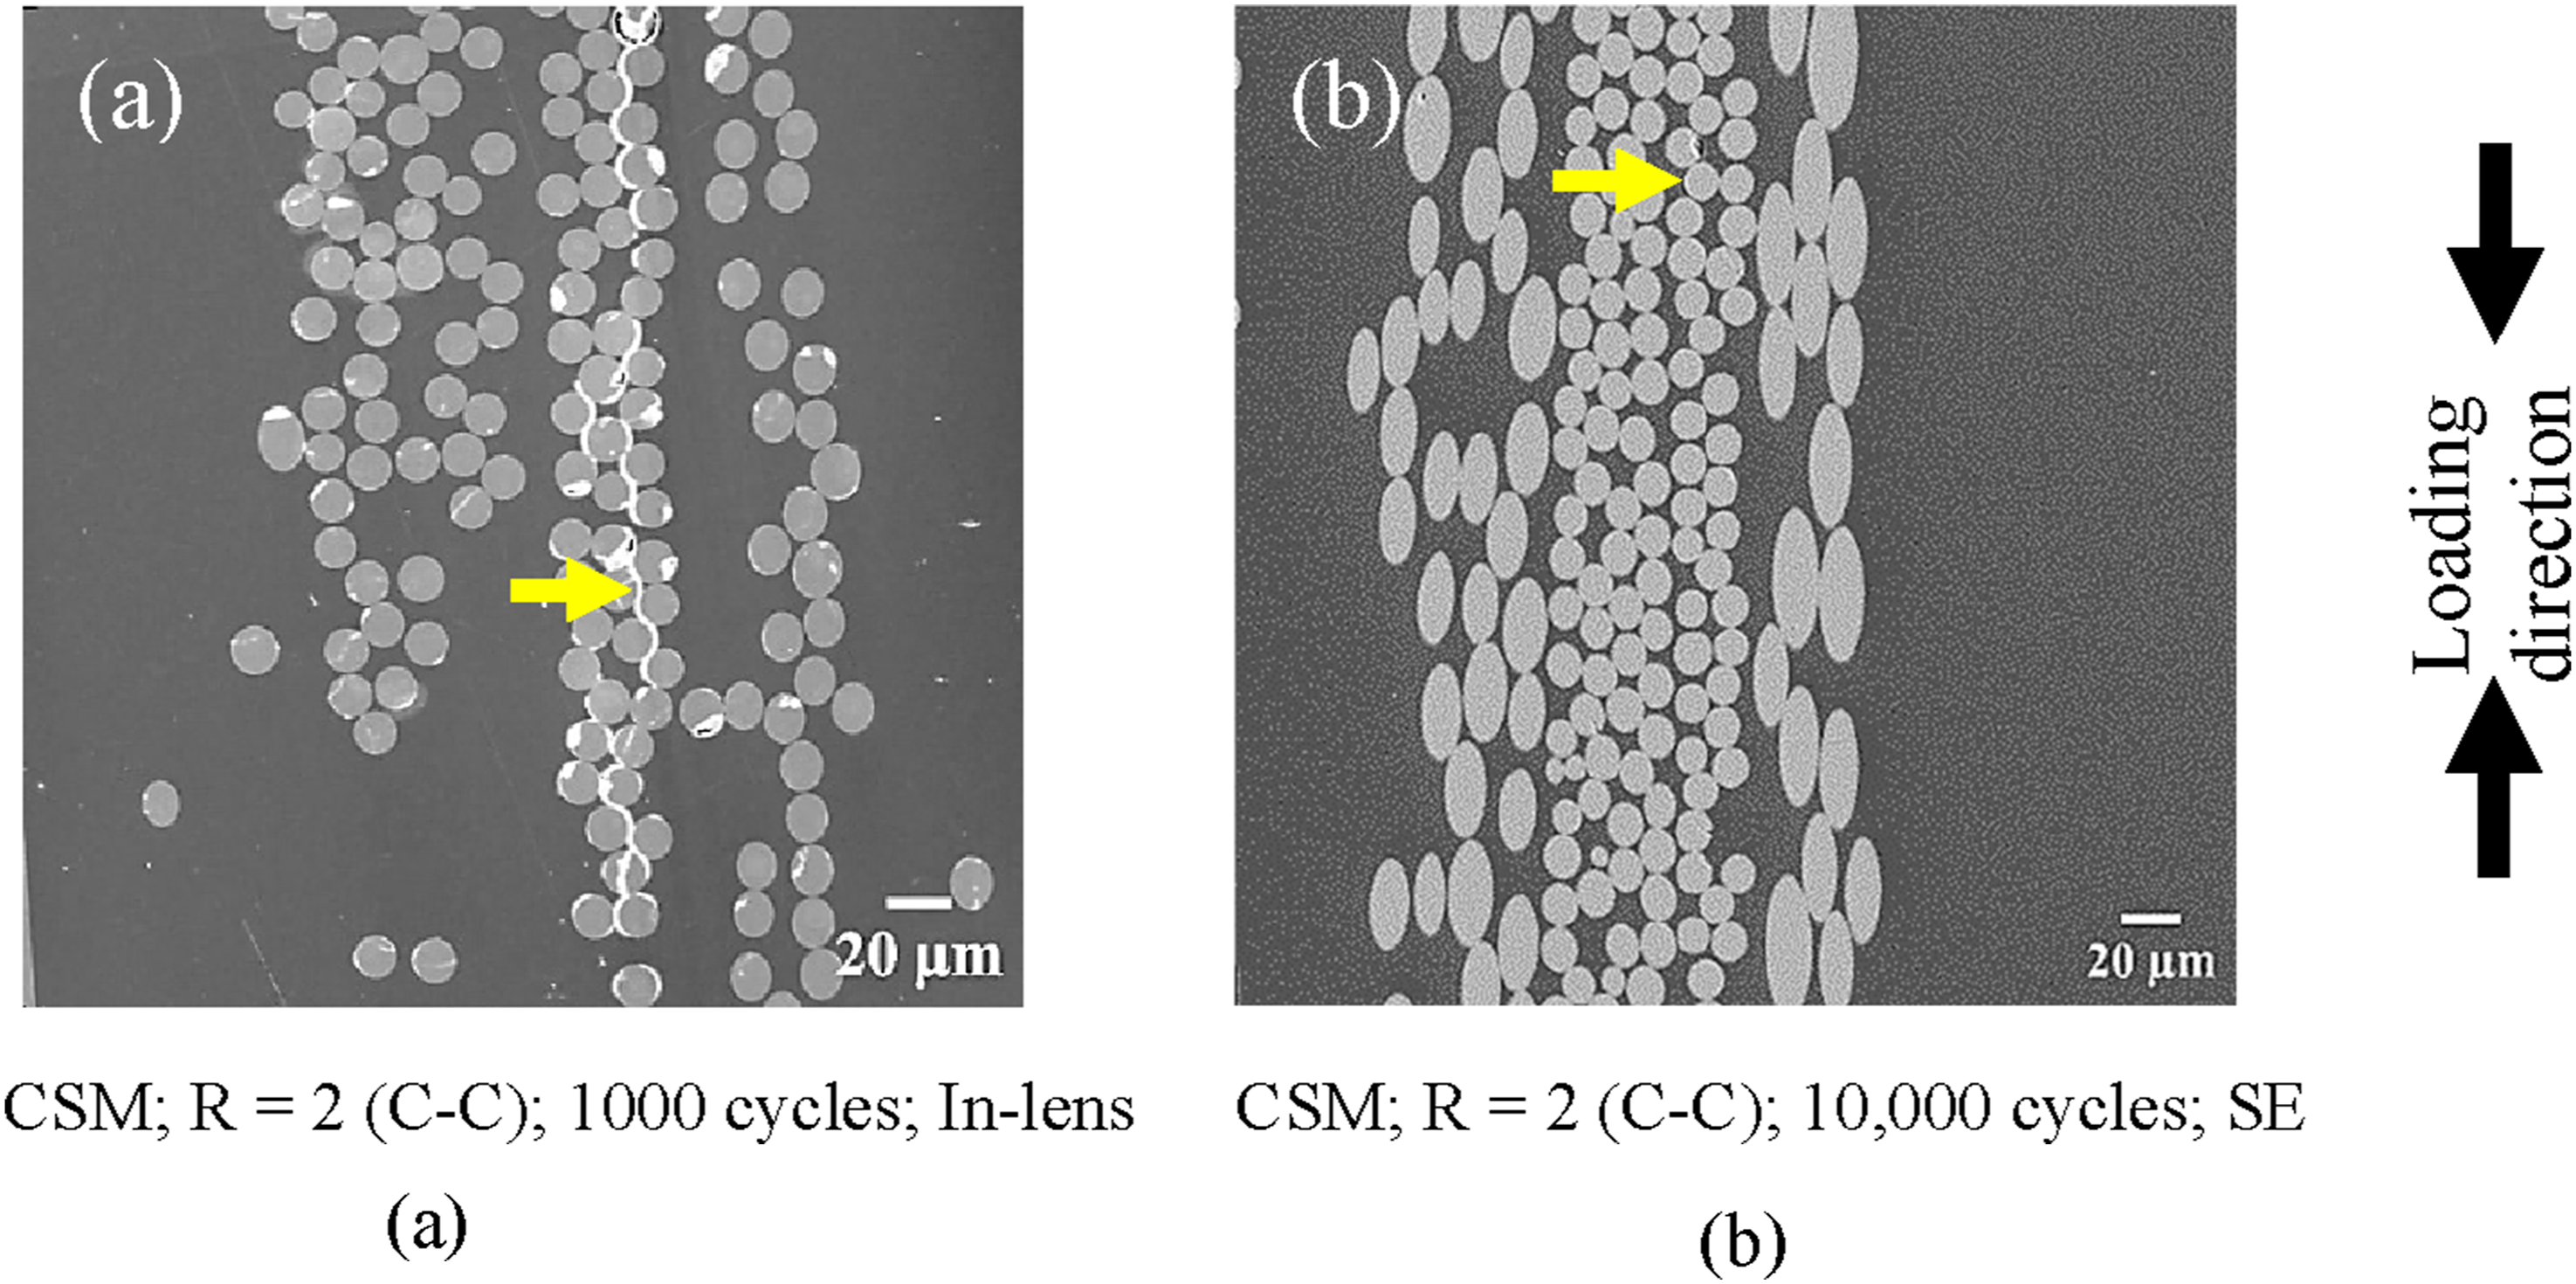
The damage evolution in CSM and WRM composites under T-T and C-C fatigue loading was quantified using SEM and stereological sampling method, with a minimum of 45 micrographs analysed for each fatigued sample.
Variation in (a) 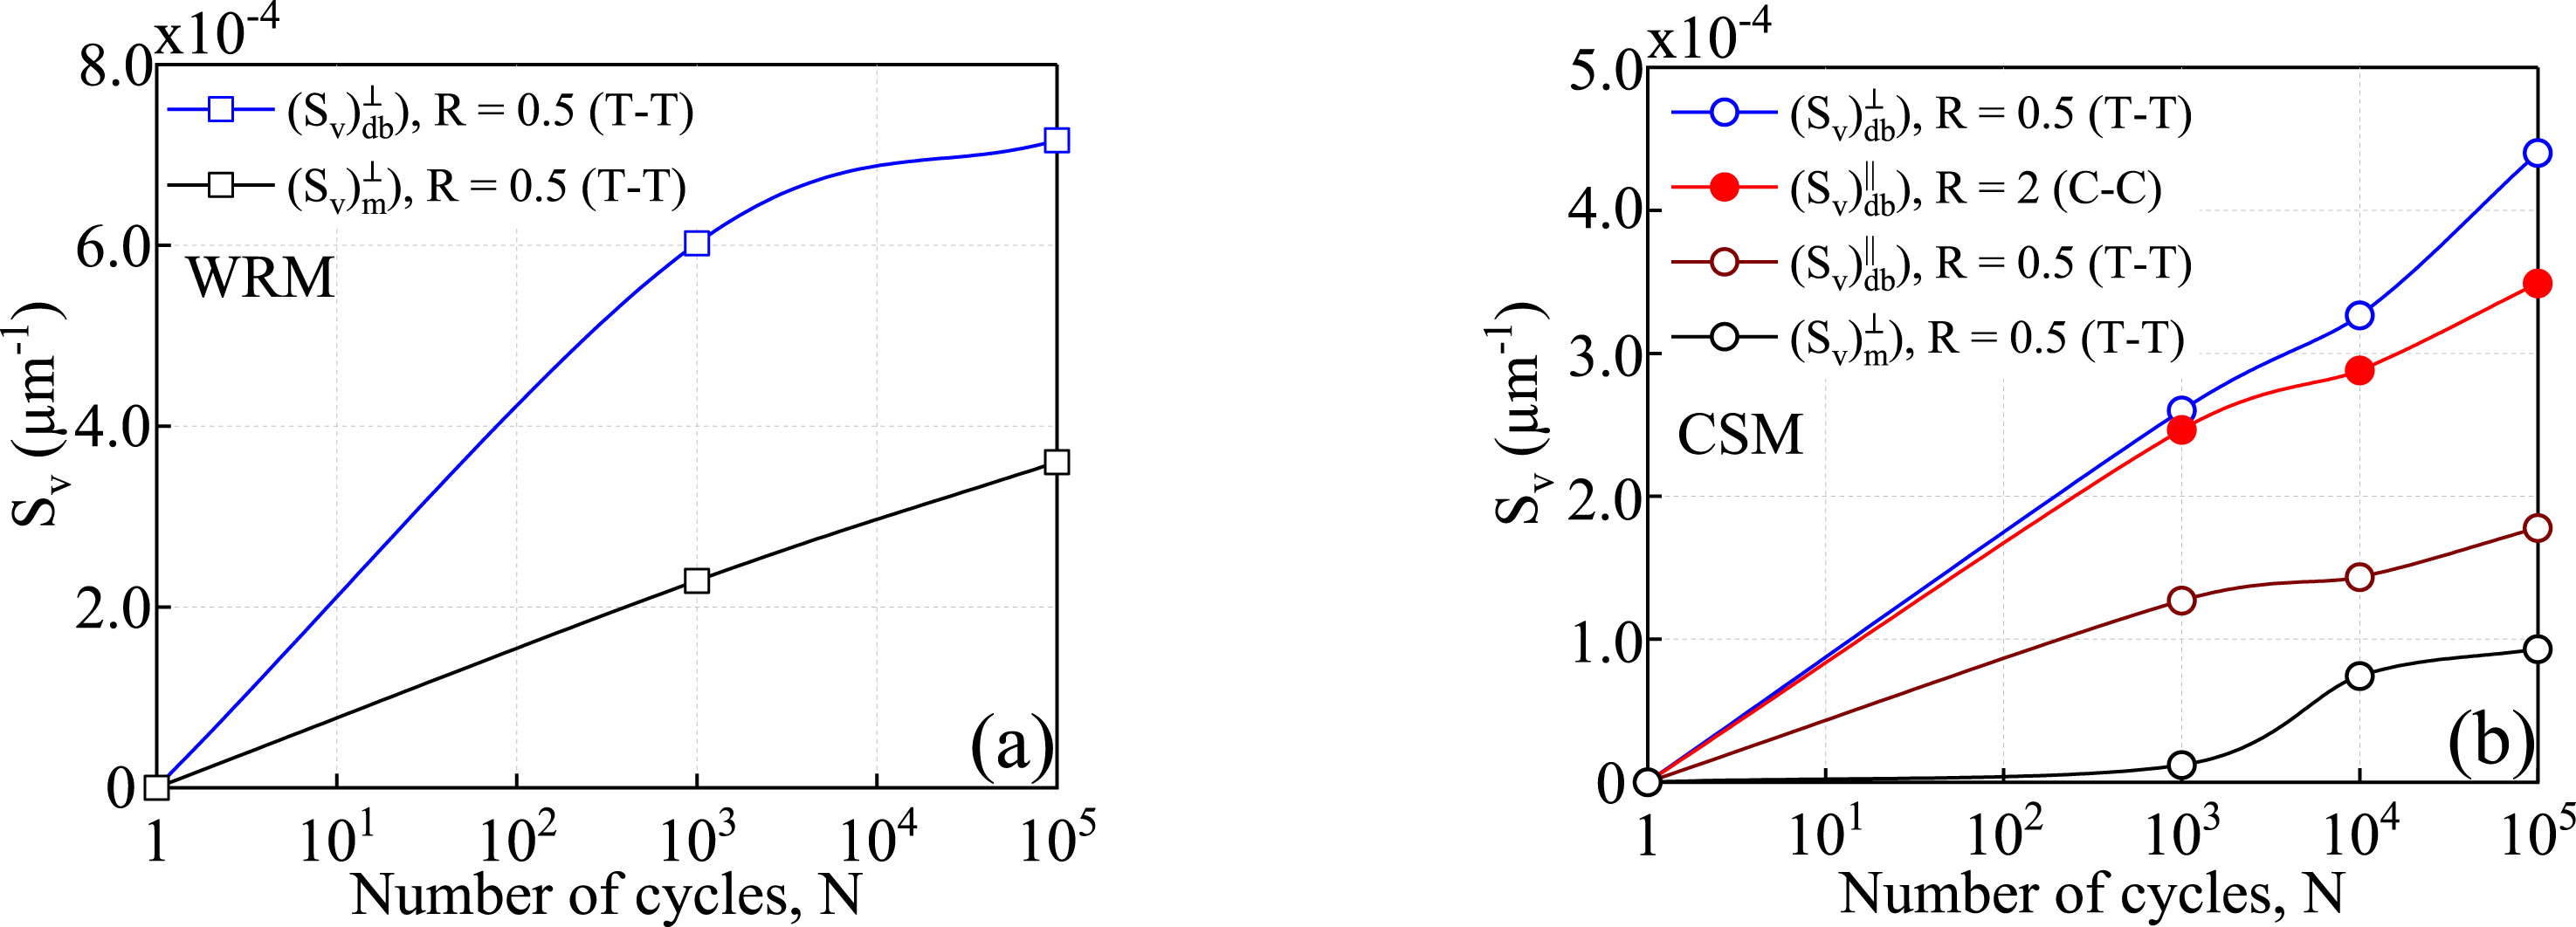
Discussions
Comparison of underlying damage mechanism
Figure 9 shows the process of crack initiation and propagation in CSM and WRM composites under each type of cyclic loading, depicting a four-stage progression in damage evolution. Schematic of the crack initiation mechanism and its propagation in (a) CSM composite under T-T cyclic loading, (b) under C-C cyclic loading, and (c) in WRM under T-T cyclic loading.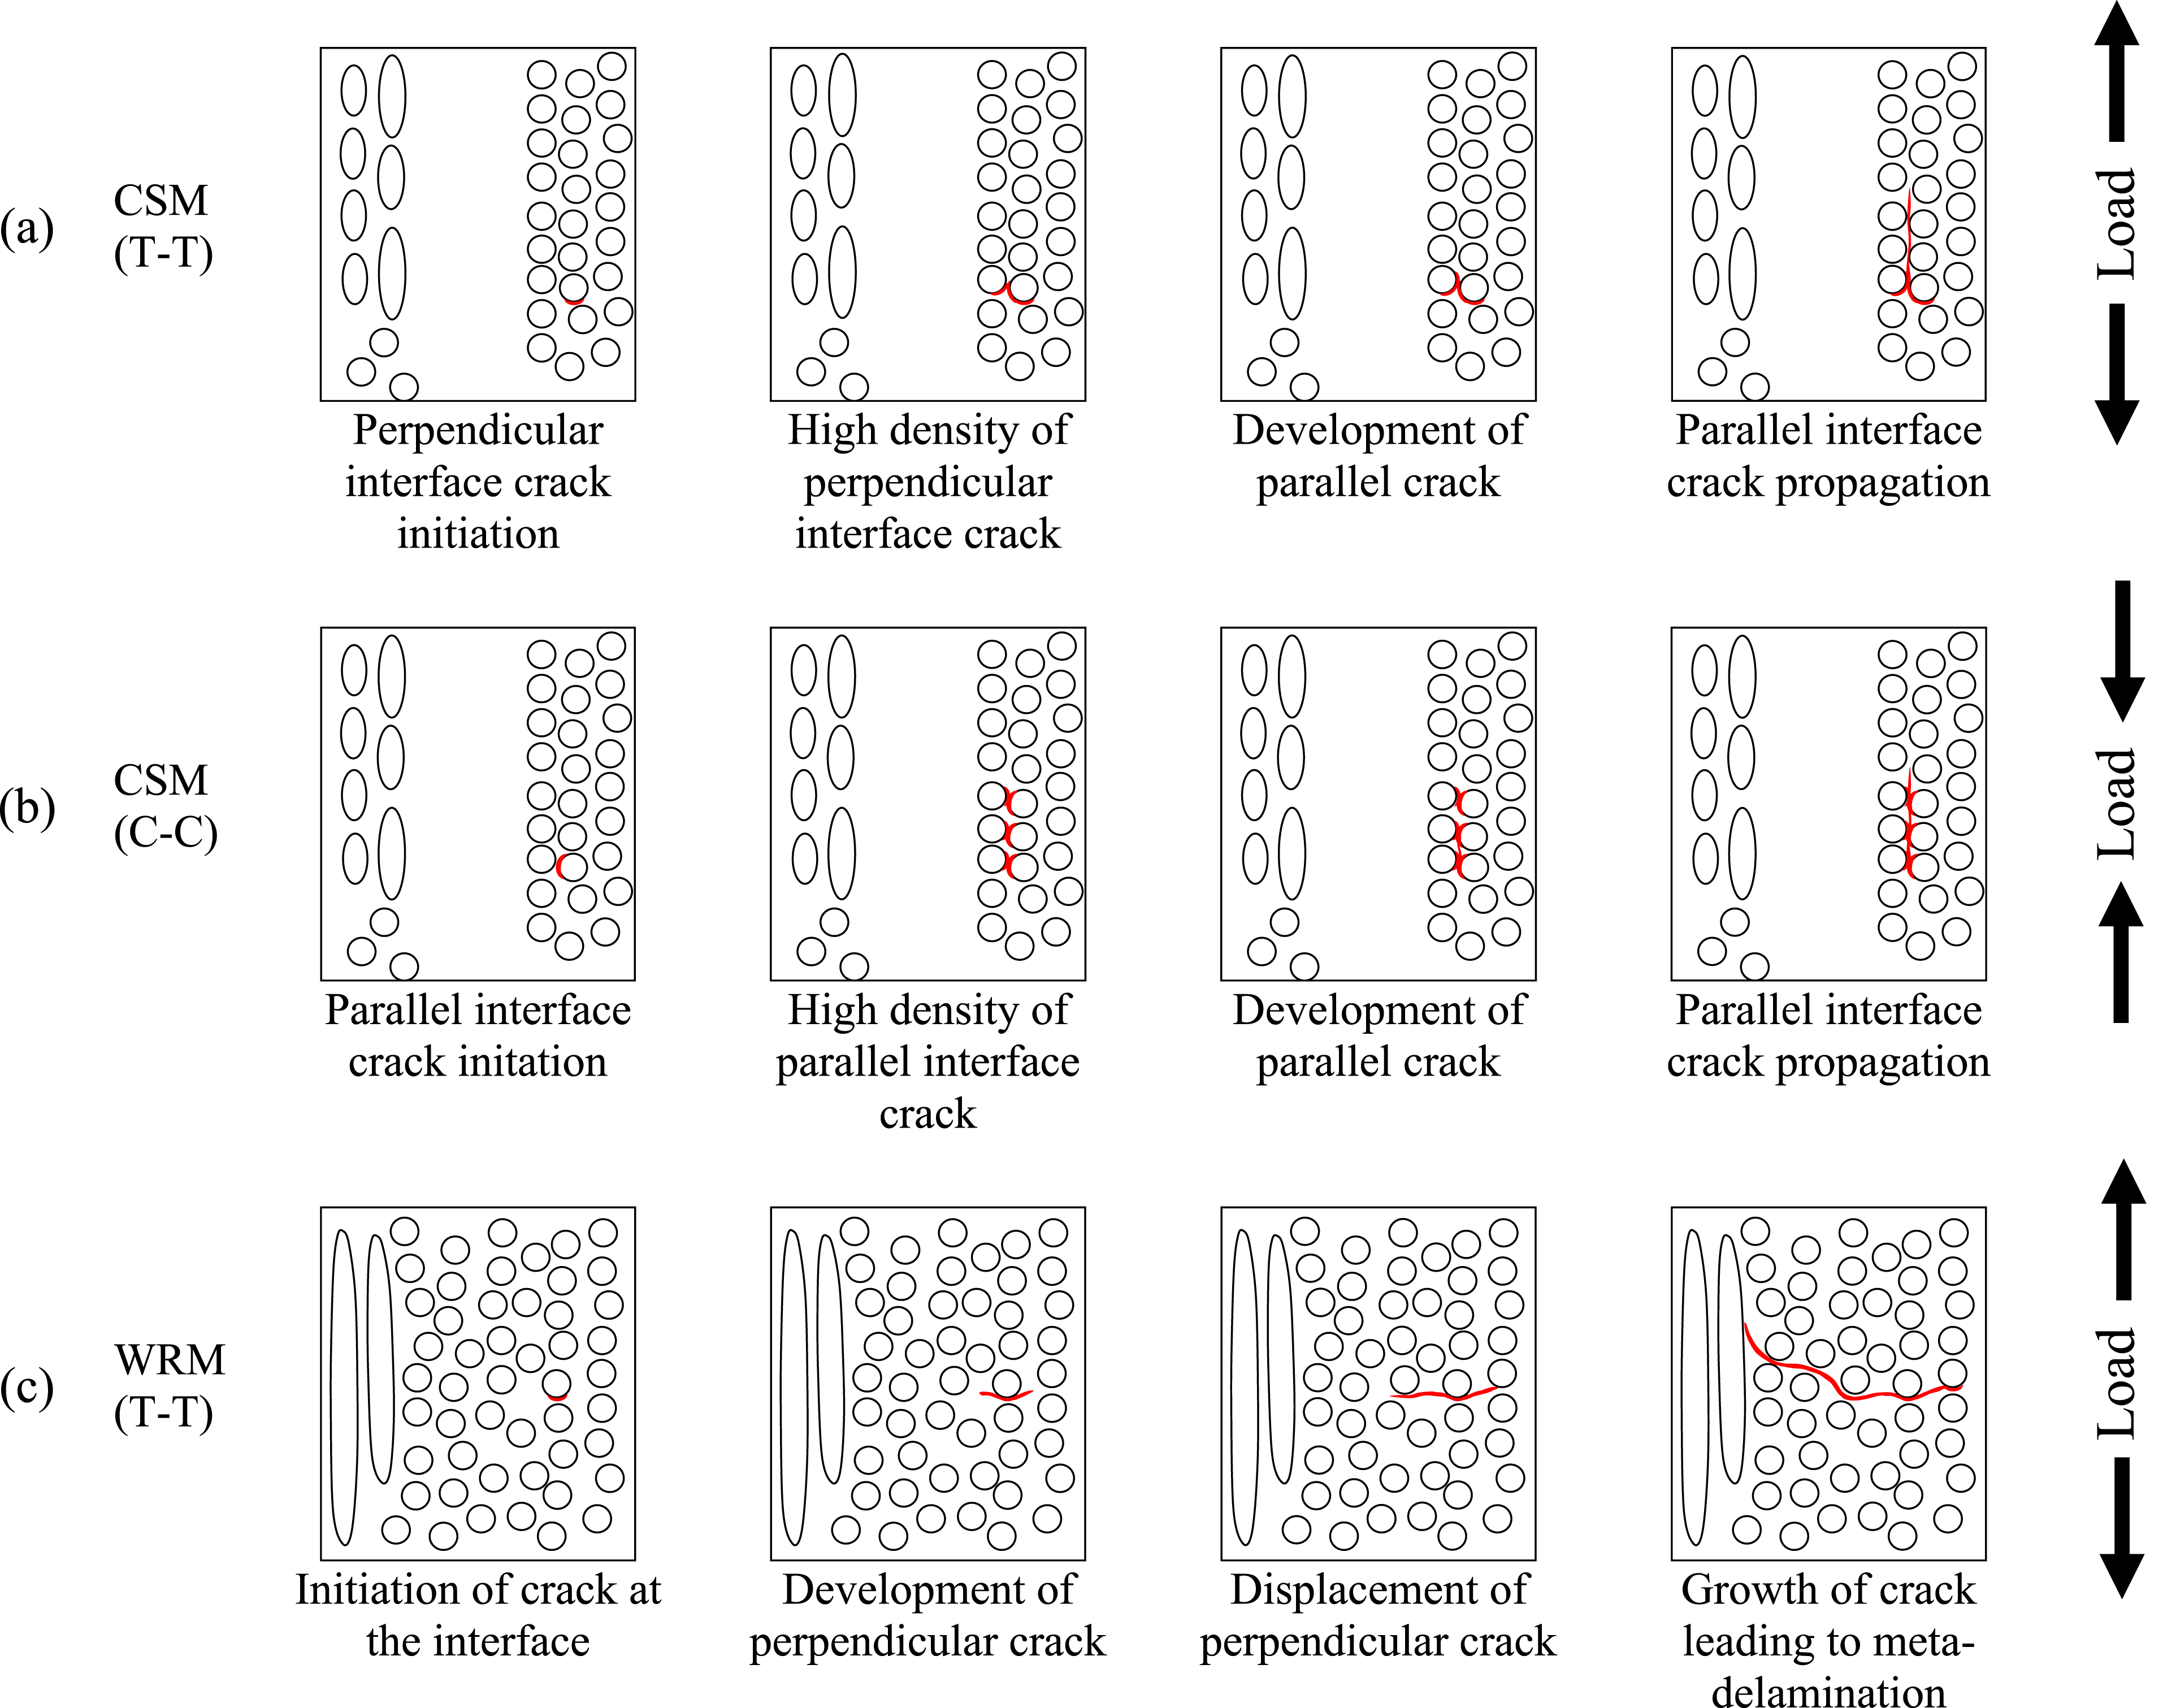
In the case of the CSM composite, the fibres are oriented in various directions, and at some locations, fibres are bunched into clusters. These clusters have all fibres oriented in one direction, with only a small fraction oriented perpendicular to the loading direction. The sequence of damage development for the CSM composite under tension fatigue case is presented in Figure 9(a). As observed earlier (Figure 6(a)), under T-T fatigue loading, perpendicular fibres are the most likely to develop interfacial crack, representing stage 1 of damage development. The second stage involves a high density of interface cracks. Since fibres are bunched in clusters with the same orientation, fibre-matrix debonding becomes concentrated in these clusters that are perpendicular to the loading direction. The third stage is the development of parallel cracks. The high density of interfacial cracking leads to stress concentrations, which start triggering cracks parallel to the loading direction. The fourth stage is the propagation of these cracks. The region between the fibre and the matrix-rich areas is subjected to shear stress concentrations. Under tensile fatigue loading, once the interface between the fibre and matrix debonds perpendicular to the loading direction, the crack propagates along the fibre clusters due to the developed shear stress.
In contrast, the sequence of damage development for the CSM composite under compression fatigue is different (Figure 9(b)). During the first stage, initial cracks emerge along the fibre-matrix interface aligned with the loading direction. This occurs as a result of tensile stresses developing at the boundary between the fibre and matrix in the direction perpendicular to the applied load. As a result of these parallel cracks and the additional cracks developed due to the shear stress, the density of parallel cracks is higher compared to the tensile fatigue case, representing stages 2 and 3 of damage development. This observation supports the earlier presented results on quantification (Figure 8(b)). The fourth stage is the propagation of these parallel cracks along the loading direction.
Concerning the differences in the damage mechanisms between the two composites, in WRM, the initial crack also starts from the fibre-matrix interface for fibres that are perpendicular to the loading direction, as shown in Figure 9(c). Furthermore, Figure 9(c) illustrates the region along the fibre sides is subjected to peak transverse stresses at the poles of the fibre under tensile load. This has been rigorously proved in the several literatures.9,33 However, because of the weaving pattern, the matrix and fibres never experience shear stress in the direction of loading and therefore never form a crack parallel to the loading direction. Subsequently, the sequence of damage development proceeds as these perpendicular cracks propagates through the entire bundle thickness and then deviate along the fibre direction, leading to a meta-delamination, as shown in Figure 9(c). However, under compression, the matrix of the WRM composite is subjected to significantly lower stresses compared to those under tensile load. Thus, the WRM composite is more likely to fail under tensile fatigue conditions than under compression. Consequently, no cracks were observed in the case of C-C cyclic loading.
Prediction of stiffness in CSM and WRM composites with damage
Dataset and evaluation metrics
Experimental data were utilized for stiffness prediction of CSM and WRM composites subjected to T-T fatigue loading. Figure 10 presents a schematic representation of the ML workflow. Schematic outlining the ML workflow for predicting stiffness based on true damage.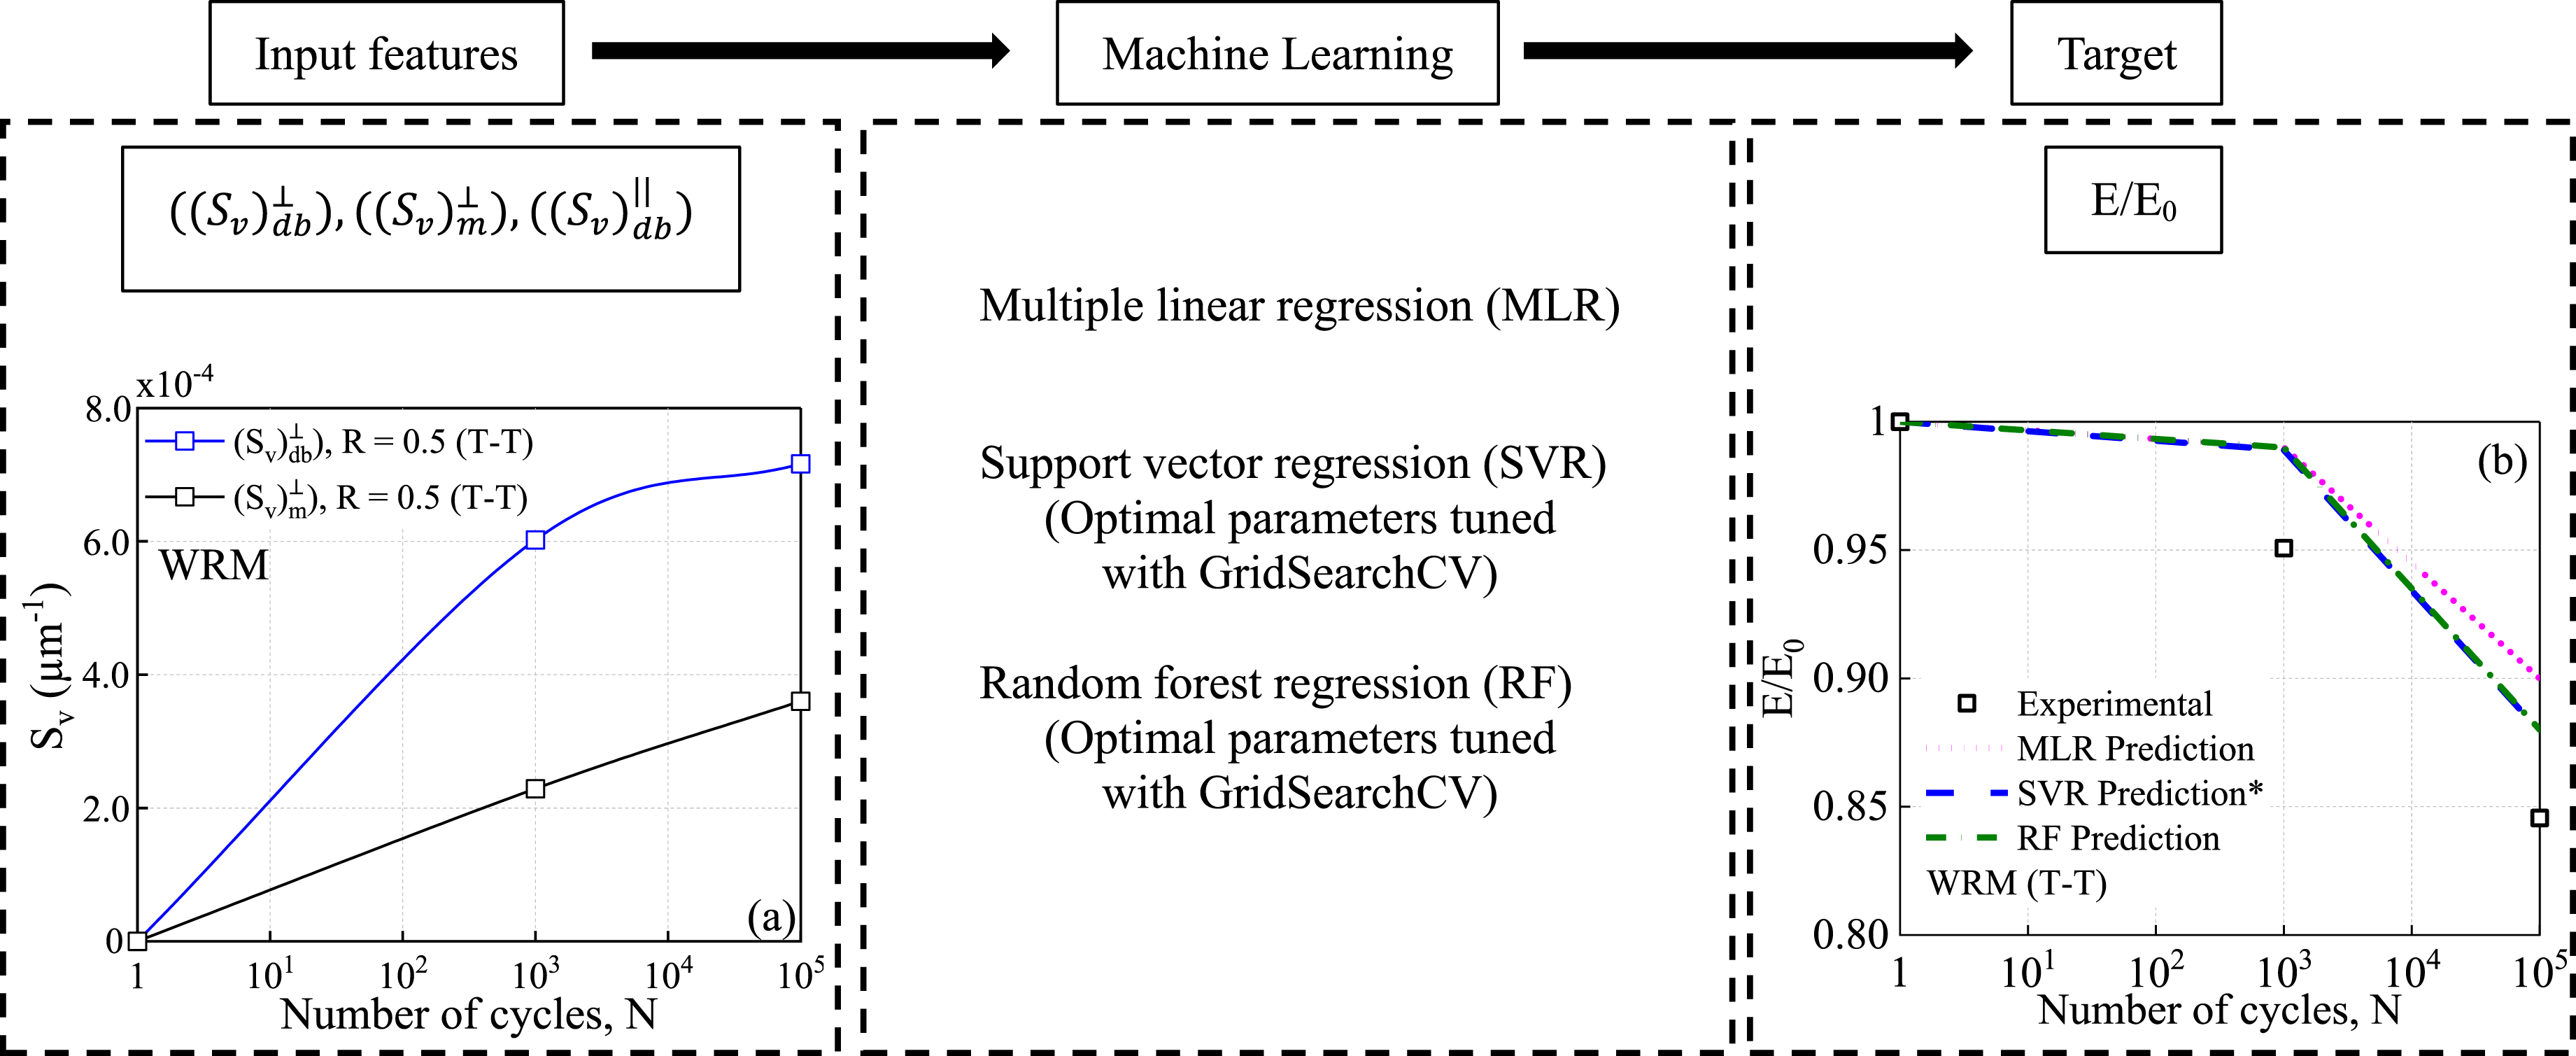
The dataset used for ML training consists of damage variables and corresponding stiffness values recorded at specific cycle counts from experimental measurements. It is important to note that, both the measured stiffness and the microstructural damage data were obtained independently through separate experimental procedures. However, damage variable data was only available at three key cycle points: 103, 104 and 105 cycles. To generate a more continuous dataset and improve model generalization, Bézier interpolation was employed to estimate missing values between these cycle points. Additionally, its smooth, non-linear nature closely aligns with the experimentally observed trends of damage accumulation, as discussed in Ref. 10. Specifically, Bézier curves ensure a realistic interpolation between available data points while preserving the underlying physics of damage evolution. The interpolation process resulted in 104 data points for WRM (T-T) composites and 155 data points for CSM (T-T) composites.
Data augmentation techniques play an important role in enhancing model robustness, particularly when dealing with limited or imbalanced datasets, as demonstrated in studies such as Ref. 34. Moreover, Ref. 17 indicates that ML prediction accuracy remains satisfactory when the training dataset includes more than 360 samples. To strengthen the dataset and address potential data sparsity issues, an additional augmentation step was applied. For each pair of consecutive data points, 10 evenly spaced interpolated points were generated, resulting in 12 total points per interval (original point +10 interpolated points + next point). Consequently, the dataset was expanded to 1351 data points for CSM (T-T) composites and 813 data points for WRM (T-T) composites, significantly improving the training data density. It is important to note that while Ref. 17 suggests that a dataset size of 360 is sufficient for achieving acceptable ML prediction accuracy in the present study, this threshold may not be universally applicable to other composite material systems or ML models. The required data size depends on various factors, including the complexity of the damage mechanisms, material anisotropy, and the choice of the ML model. Future studies should assess data sufficiency based on the specific problem at hand, considering material variability and algorithmic requirements.

Parameter ranges obtained from T-T fatigue experiments.
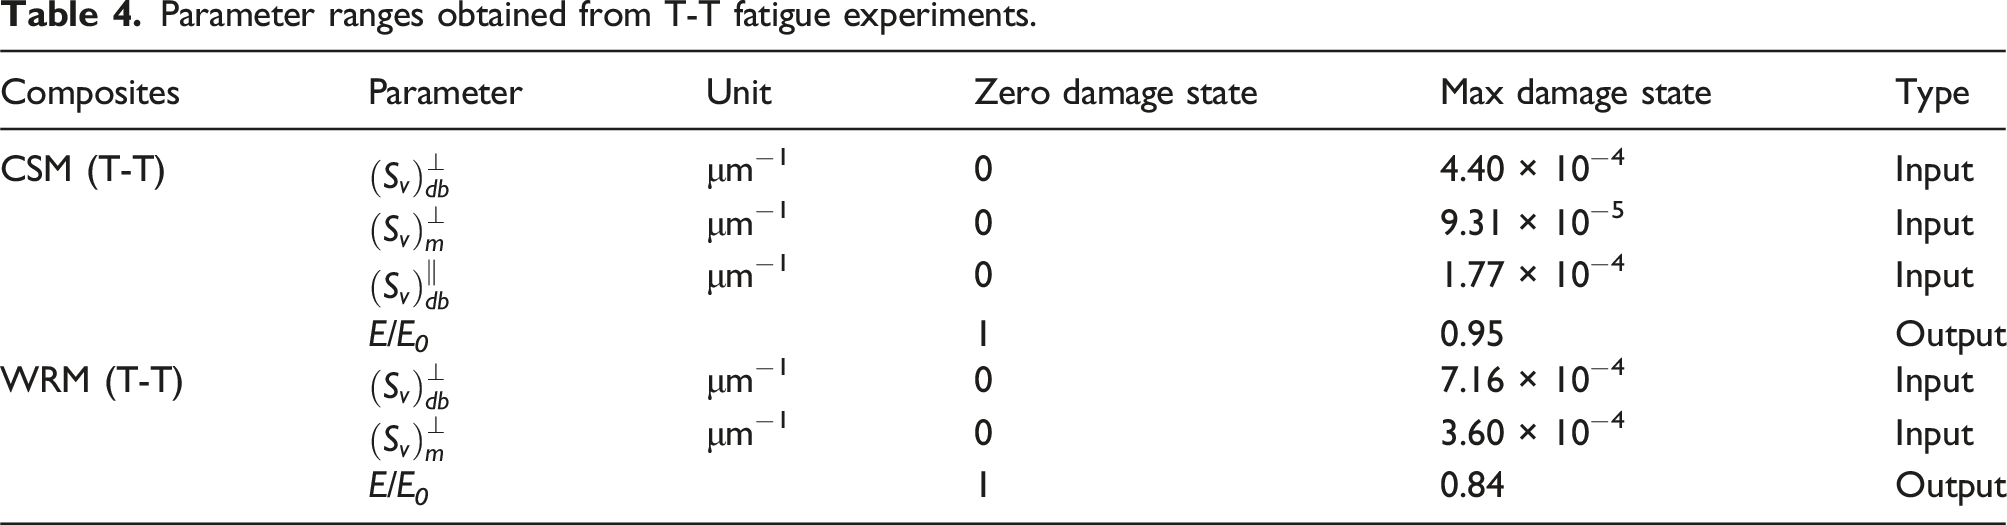
For both composites, all the ML models were trained only on the T-T cyclic loading dataset and not on C-C cyclic loading dataset, since the experiment showed no significant degradation in stiffness (Figure 4). The evaluation of all ML models was assessed using the R-squared value, which measures how well the predicted values fit the experimental data, as well as the average error rate (AER) and root mean squared error (RMSE).
ML models
ML models, including MLR, SVR and RF, are presented in this section to predict stiffness based on quantified damage data. Recent literature also discusses deep learning (DL) approaches, such as those mentioned in Ref. 35. While Ref. 35 has shown strong capabilities in autonomous morphological fracture analysis of composites using DL approach, our decision to utilize MLR, SVR and RF was based on three key considerations: dataset size and complexity, model interpretability and computational efficiency. Regarding dataset size, DL models typically require substantially larger datasets to effectively learn complex patterns. Given the relatively limited dataset available in the present study, traditional ML models such as MLR, SVR and RF were deemed more suitable. Notably, SVR and RF, are known for their robust performance with moderate-sized datasets while minimising the risk of overfitting.36,37 Since our primary objective was to understand the relationship between microstructural damage and stiffness degradation (as mentioned in equation (4)), we prioritized models that offer improved interpretability. 38 MLR provides clear insights into individual feature contributions, while RF and SVR enable effective feature importance analysis. Although DL models are powerful, they often pose challenges in extracting meaningful insights directly from their complex architectures. In terms of computational efficiency, considering the complexity of our dataset and the available computational resources, SVR and RF provided a favourable balance between prediction accuracy and efficiency. In contrast, recurrent neural networks (RNNs)) and convolutional neural networks (CNNs) would have required extensive hyperparameter tuning and additional computational overhead. Nevertheless, given the complexity of microstructural damage patterns, the authors acknowledge the potential benefits of incorporating DL models to enhance predictive performance. These models excel in capturing complex patterns; however, they often function as black boxes, making it challenging to extract meaningful insights regarding the physical mechanisms influencing stiffness degradation. The authors recognize that DL models hold promise, particularly as larger and more comprehensive datasets become available. Given the scope of this study, these refinements are reserved for future work.
The dataset was divided into two portions, with 80% allocated for training and the remaining 20% reserved for validation. For CSM (T-T) and WRM (T-T), two separate ML models were developed to predict stiffness degradation: one dedicated to processing the data from CSM (T-T), and the other focussed on handling data from WRM (T-T), allowing for more specialized predictions for each type of input. Python and the open-source library Scikit-learn, 39 were used to perform all experiments and were executed on Google Colab.
MLR model
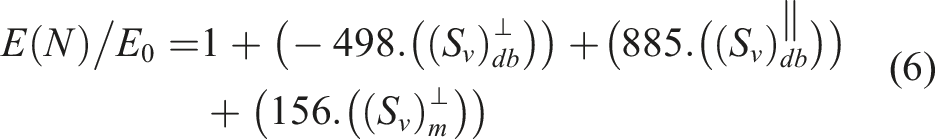
MLR was used in this research to analyse the relationship between the dependent variable and three independent variables in the case of CSM (T-T), and two independent variables in the case of WRM (T-T). The standard equation for MLR with three independent variables is expressed as follows: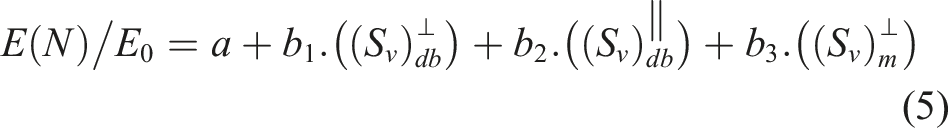

SVR model
The SVR model operates by mapping input features 
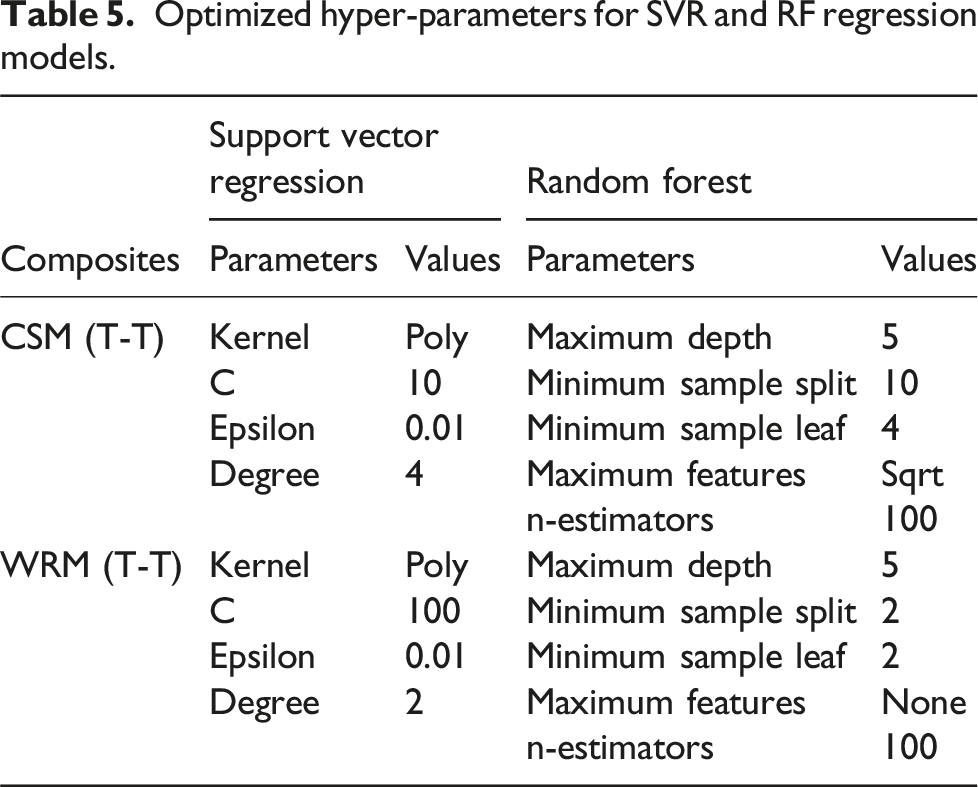
Optimized hyper-parameters for SVR and RF regression models.
RF model
The RF model also underwent hyperparameter tuning using GridSearchCV to optimise its performance. The primary hyperparameters tuned were the number of features [log2, sqrt, None], maximum tree depth [5, 10, None], number of decision trees [10, 50, 100], the minimum number of samples required at the leaf node [1, 2, 4] and minimum number of samples required to initiate a split at an internal node [2, 5, 10]. The optimal hyperparameters are summarised in Table 5 for CSM (T-T) and WRM (T-T), respectively. 5-fold cross-validation was used to train the RF model.
Prediction results
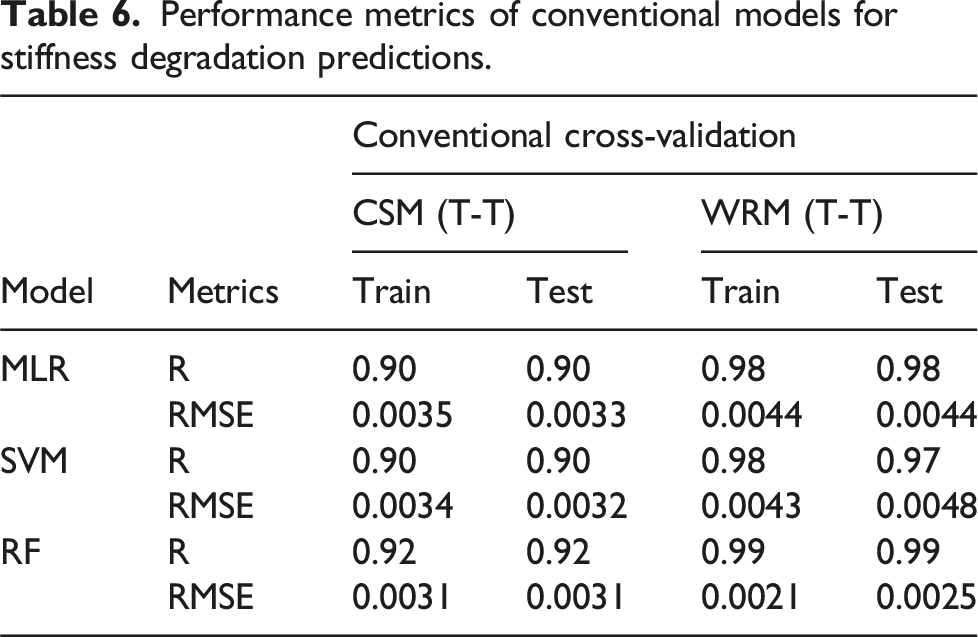
Figure 11 demonstrate that the training and validation sets exhibit similar R2 values, indicating that the models do not suffer from overfitting. Among the ML models, the RF model demonstrated outstanding performance for both composites, achieving an R2 value of 0.92 for CSM (T-T) (Figure 11(a)) and 0.99 for WRM (T-T) (Figure 11(b)) in predicting stiffness degradation. Prediction of stiffness degradation under T-T cyclic loading for (a) CSM and (b) WRM composites.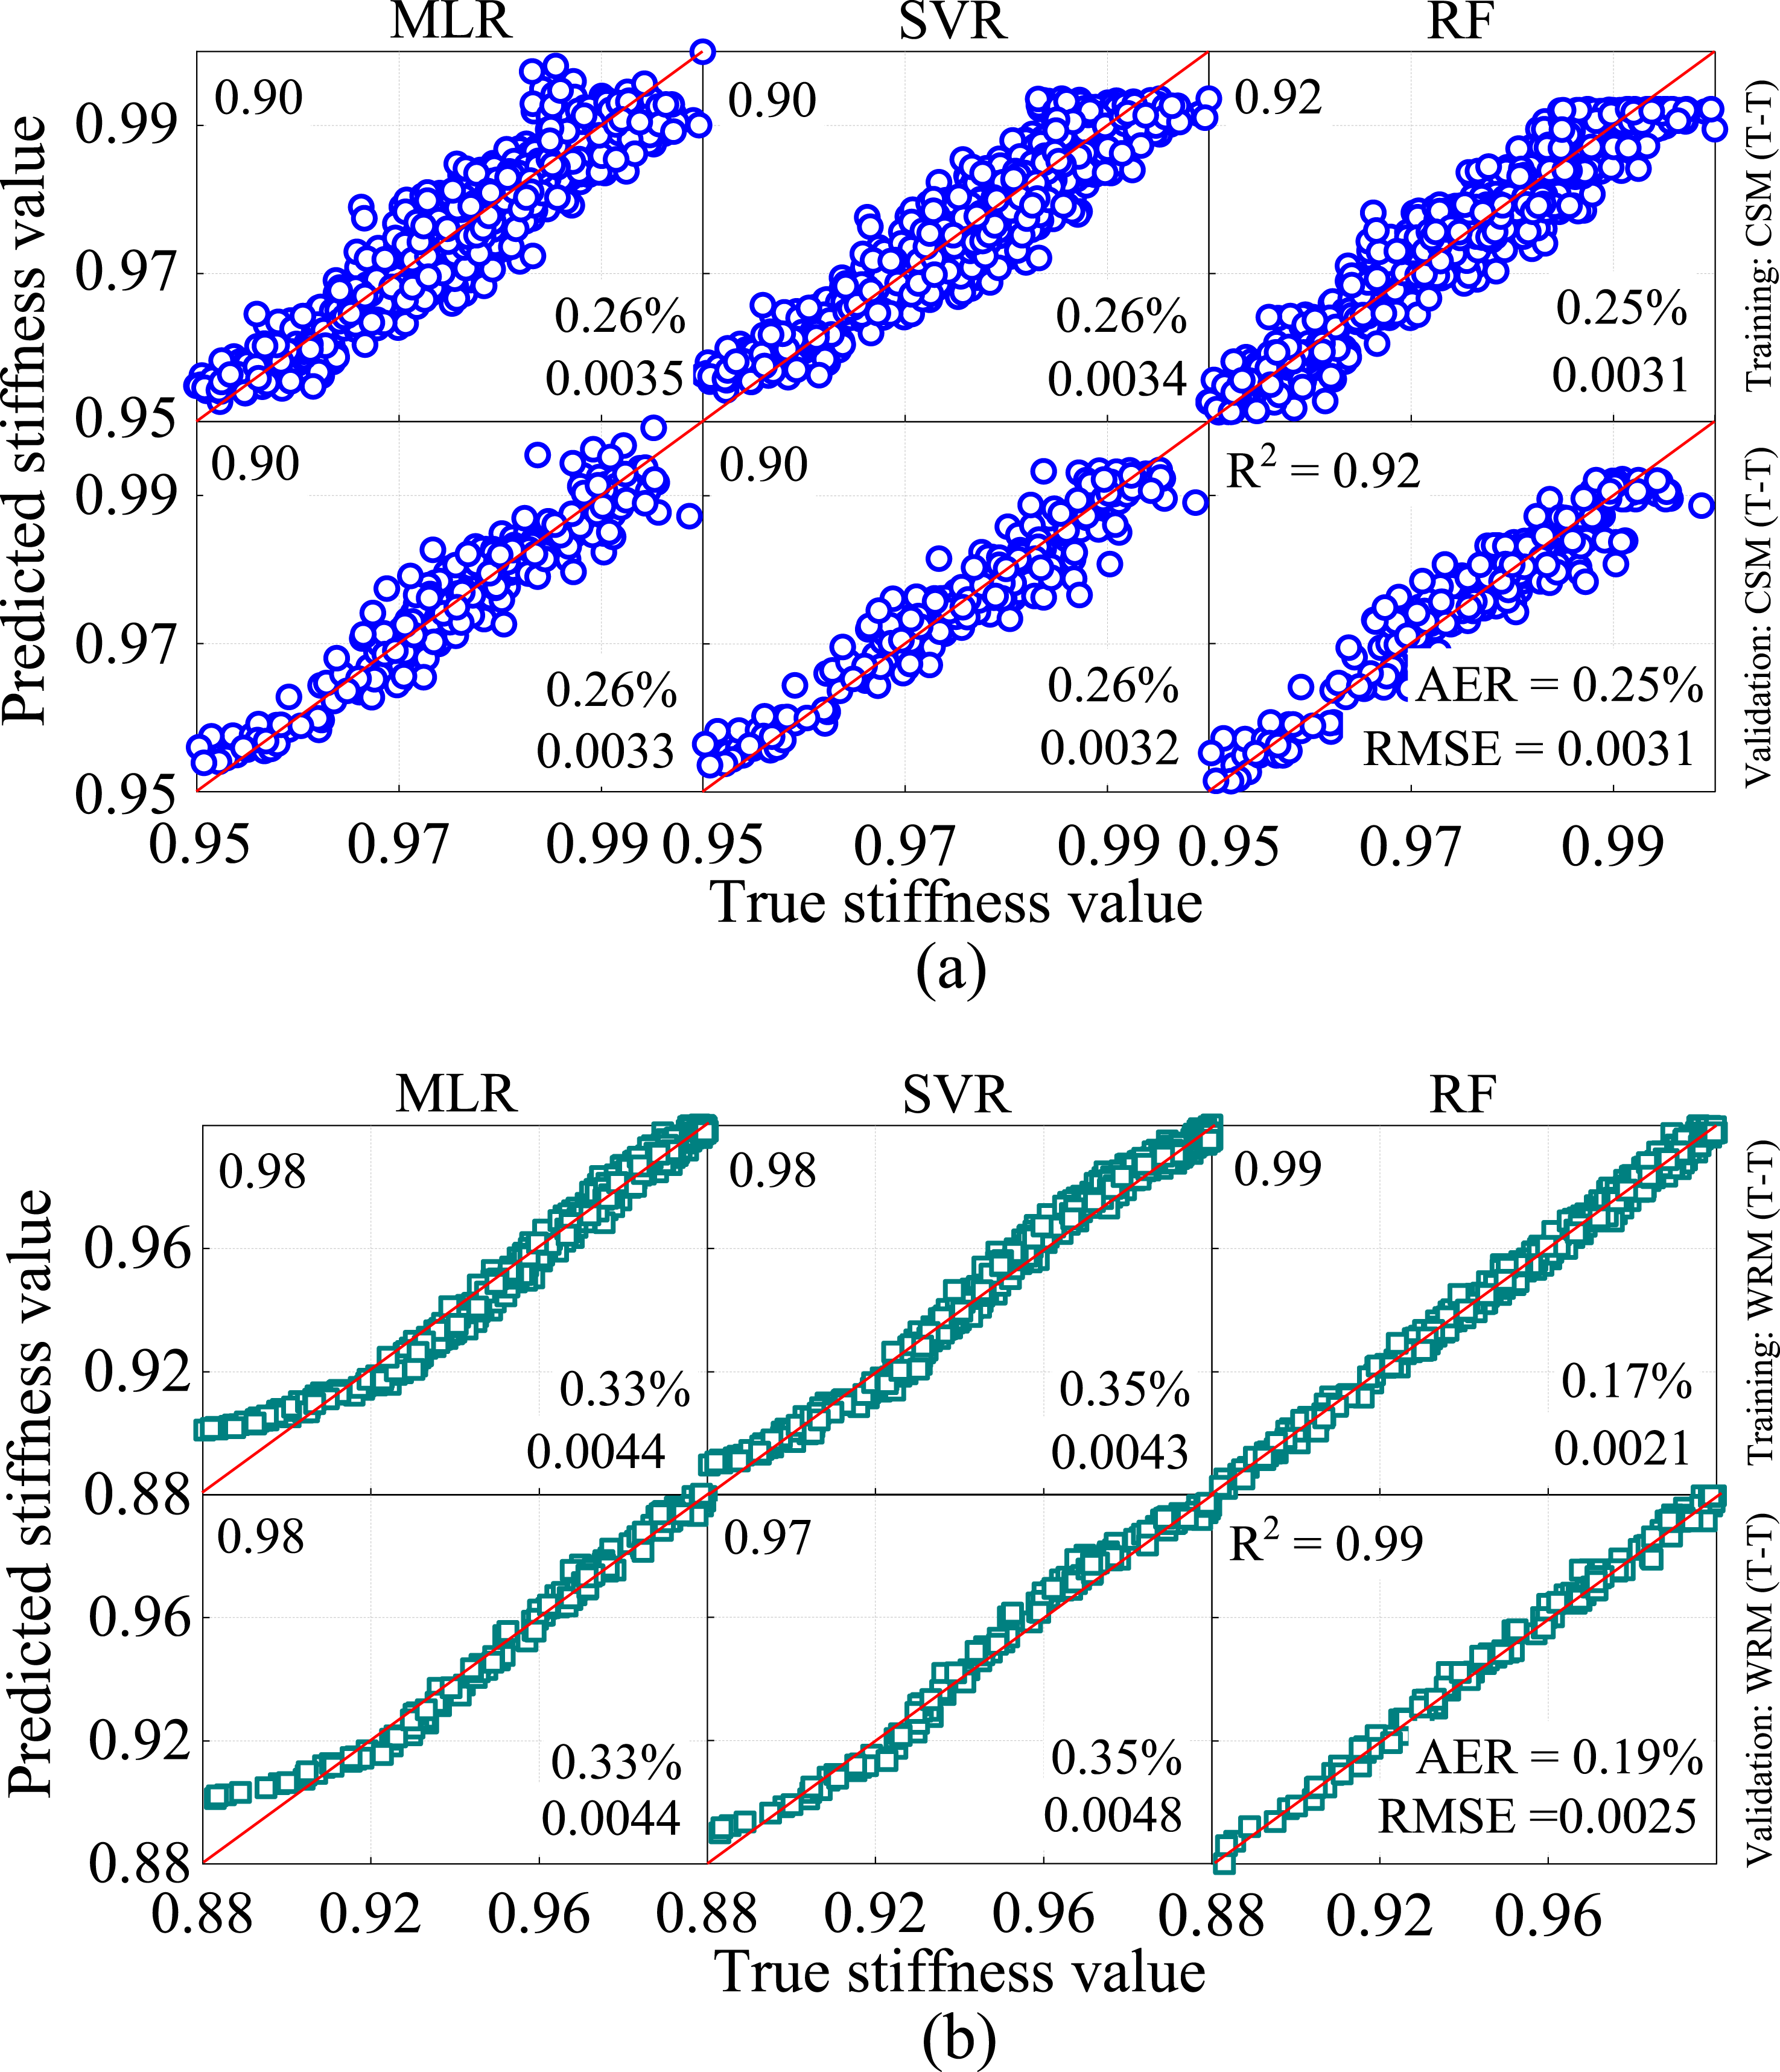
Comparison of ML predictions with experimental results
Figure 12 illustrates the predicted stiffness degradation in CSM (T-T) and WRM (T-T) using trained ML models based on combinations of ML model predictions compared to experimental results for stiffness degradation in (a) CSM and (b) WRM composites under T-T cyclic loading (semi-log scale). Note: *The identified kernel function for SVR prediction is the poly kernel.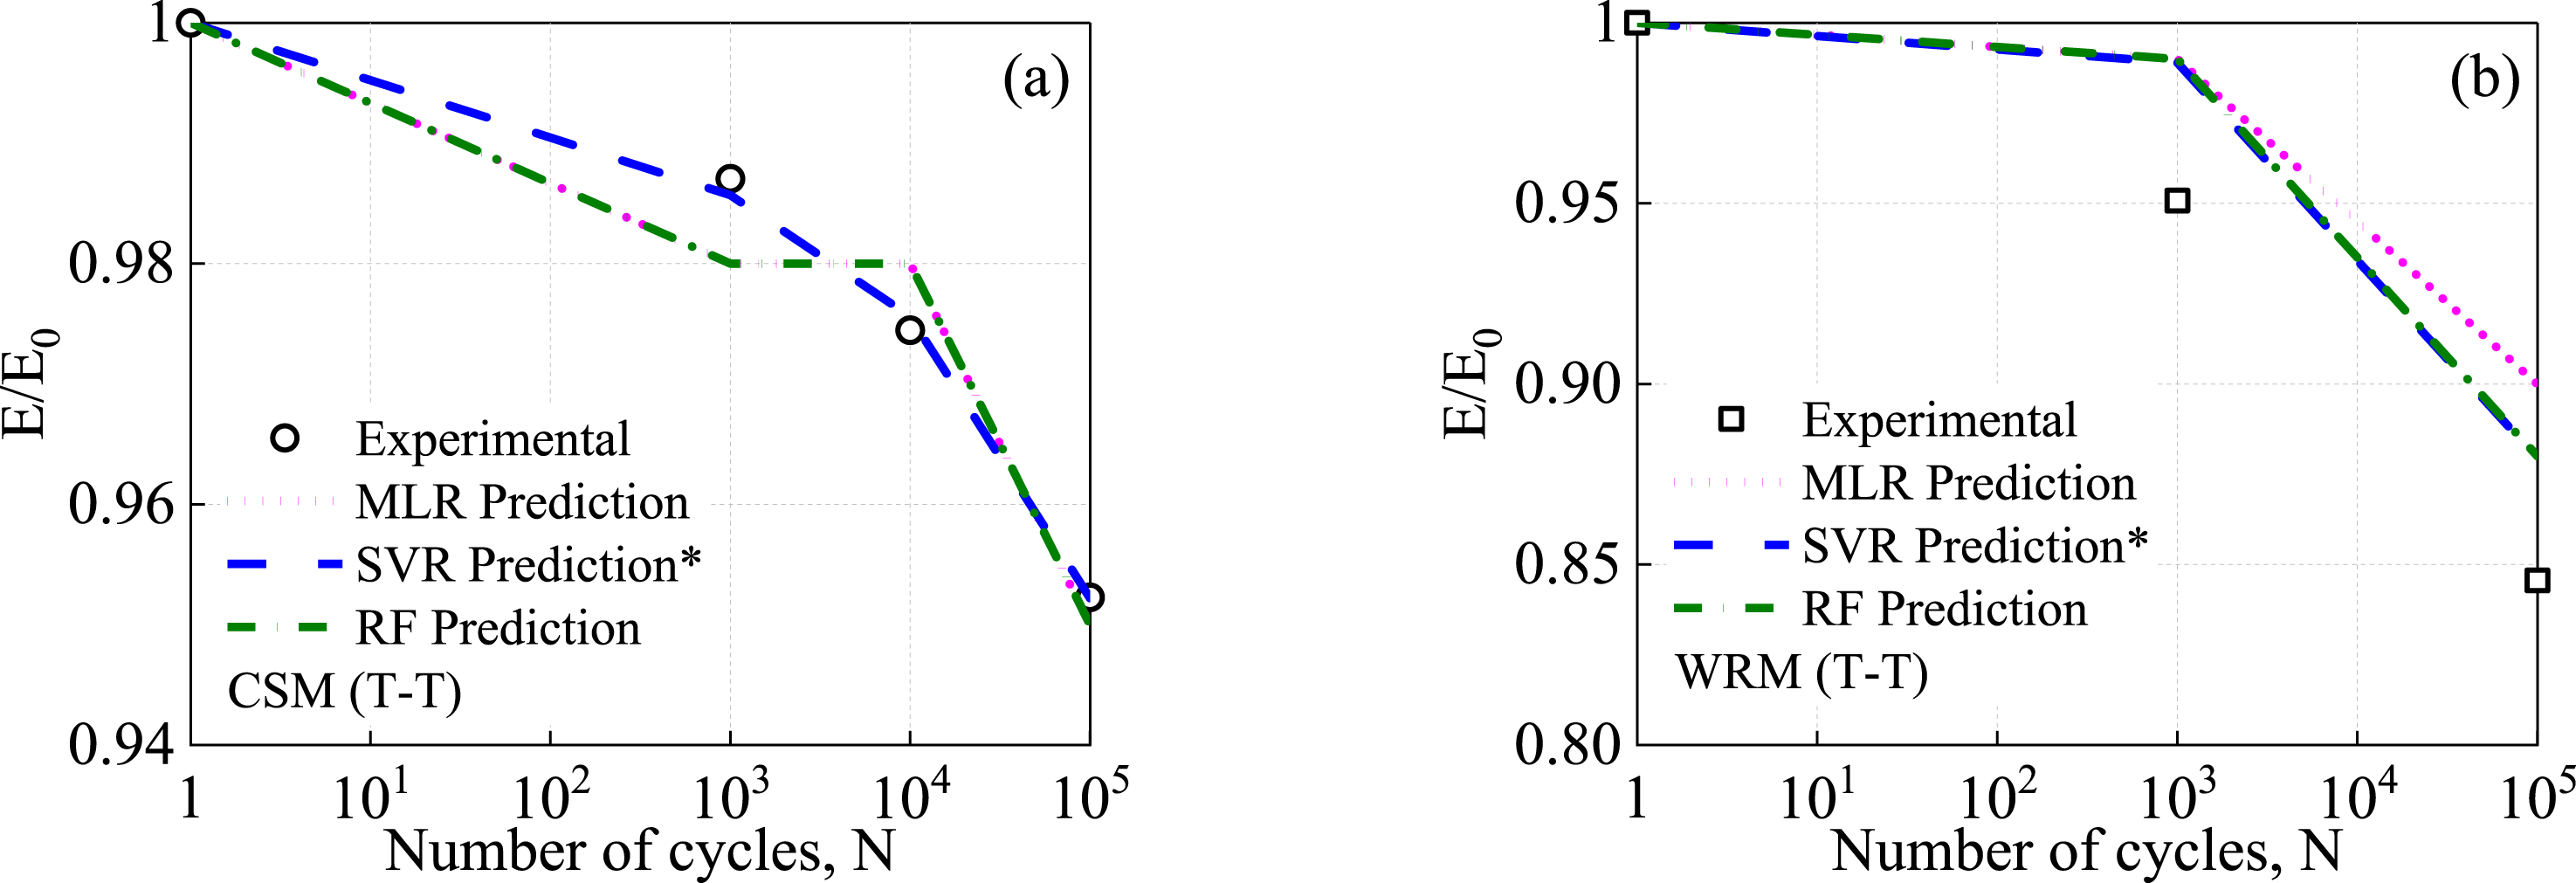
Although the ML models demonstrate high predictive accuracy, a careful analysis reveals that they struggle to capture trends accurately. This issue becomes evident through a disjoint cross-validation test, which highlights a false sense of high predictability when using conventional cross-validation.
To investigate this further, disjoint test was carried out on the considered ML models. The difference between conventional cross-validation and disjoint cross-validation is illustrated in Figure 13. Schema of conventional cross-validation versus disjoint cross-validation.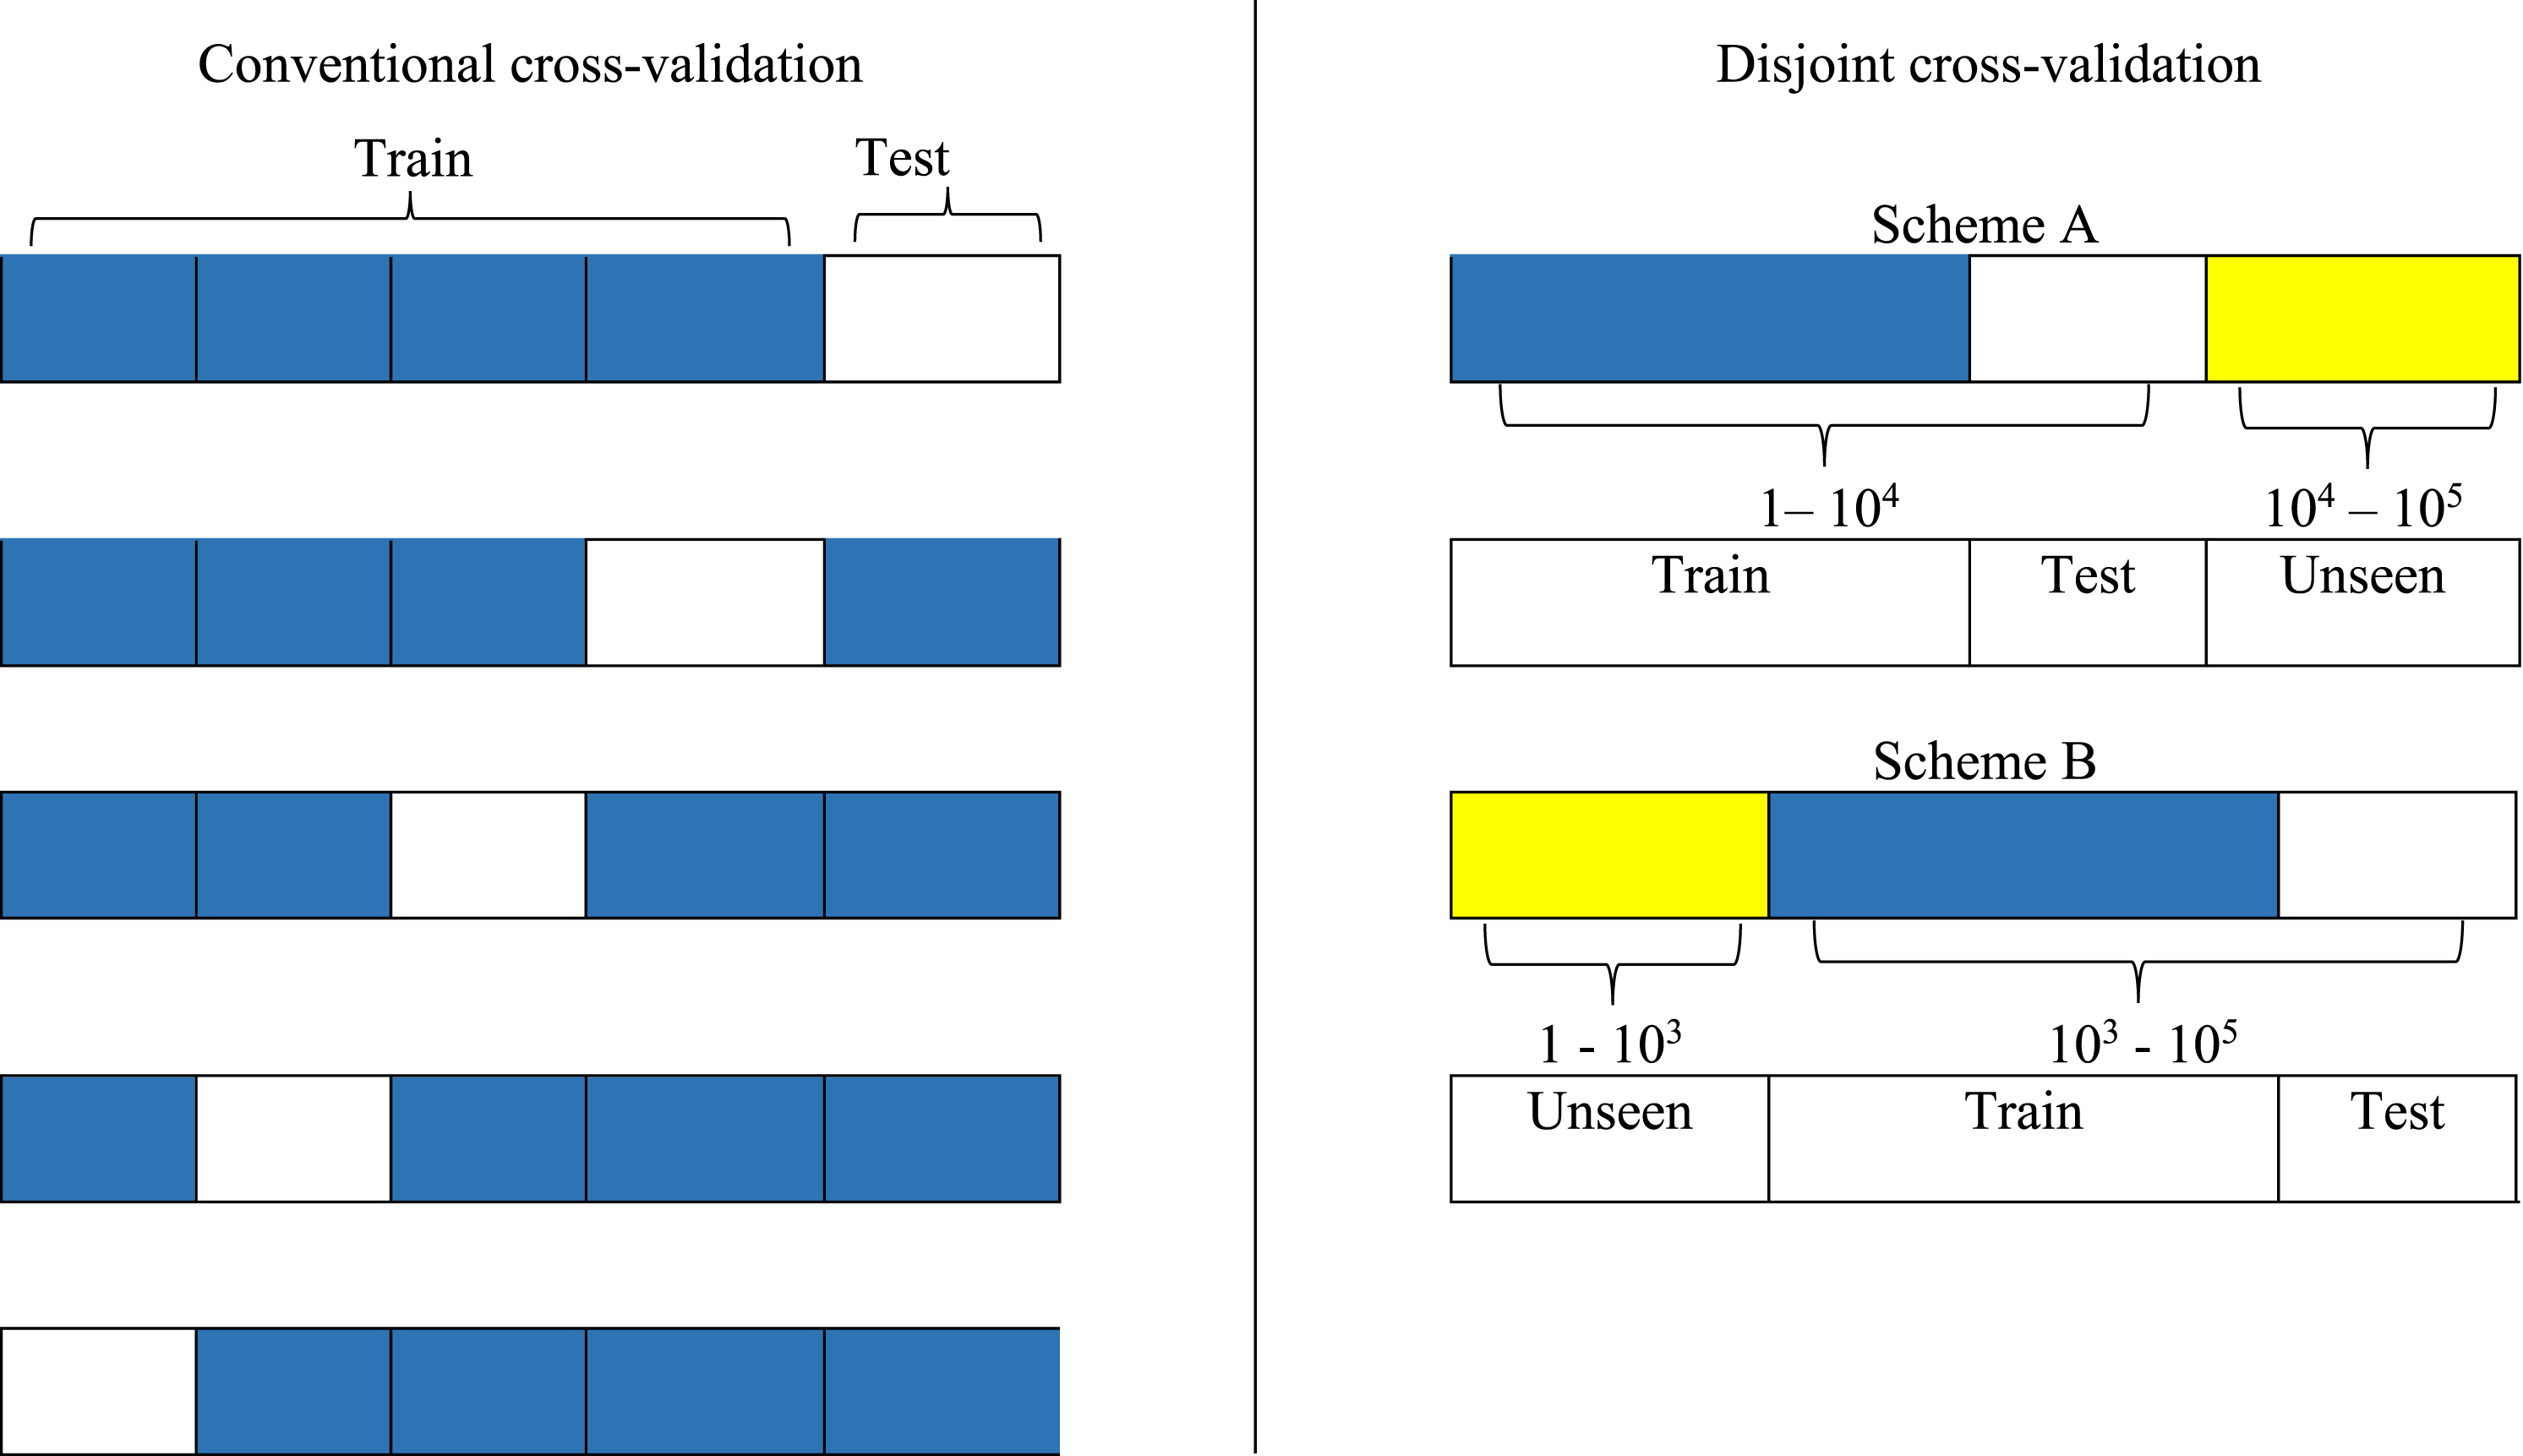
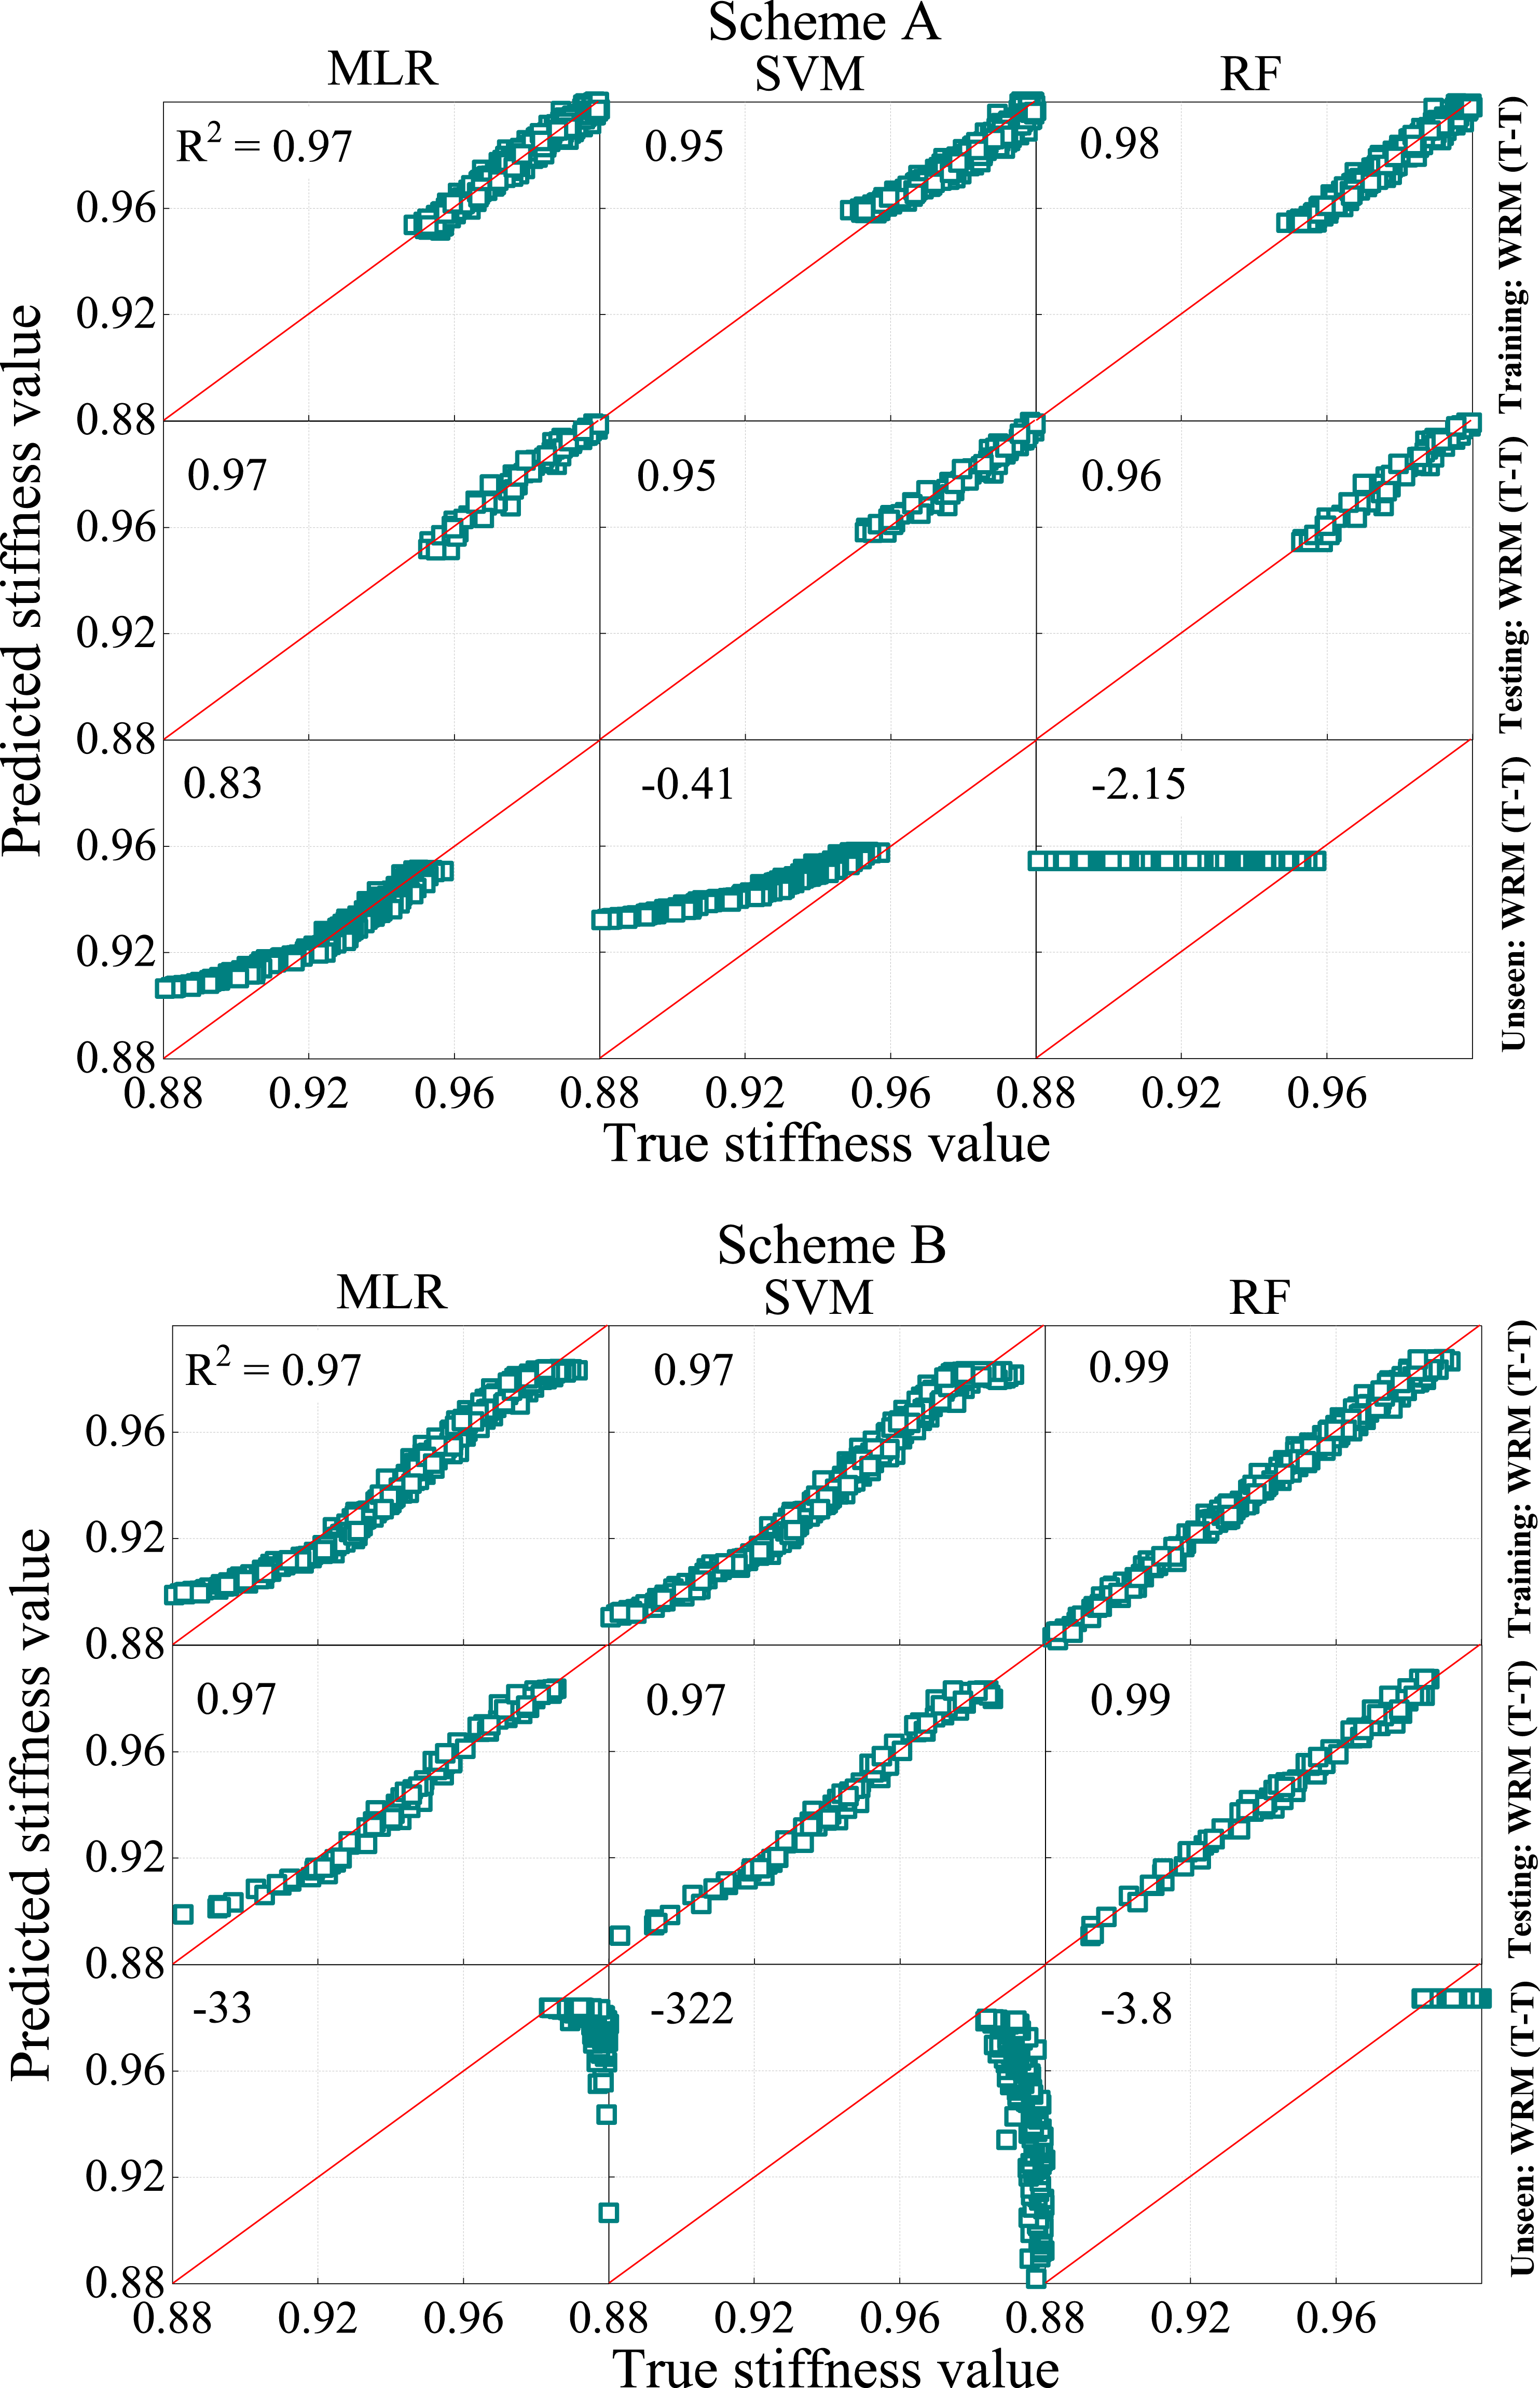
Two schemes were used: in Scheme A, models were trained on the first 104 cycles, and in Scheme B, models were trained on cycles 103 to 105 of the respective composite dataset (see the Supplemental material for more details on the identified best hyperparameters). The model performances were then evaluated on hold-out datasets: in Scheme A, cycles 104 to 105 were used as hold-out dataset, while in Scheme B, cycles 1 to 103 cycles were used.
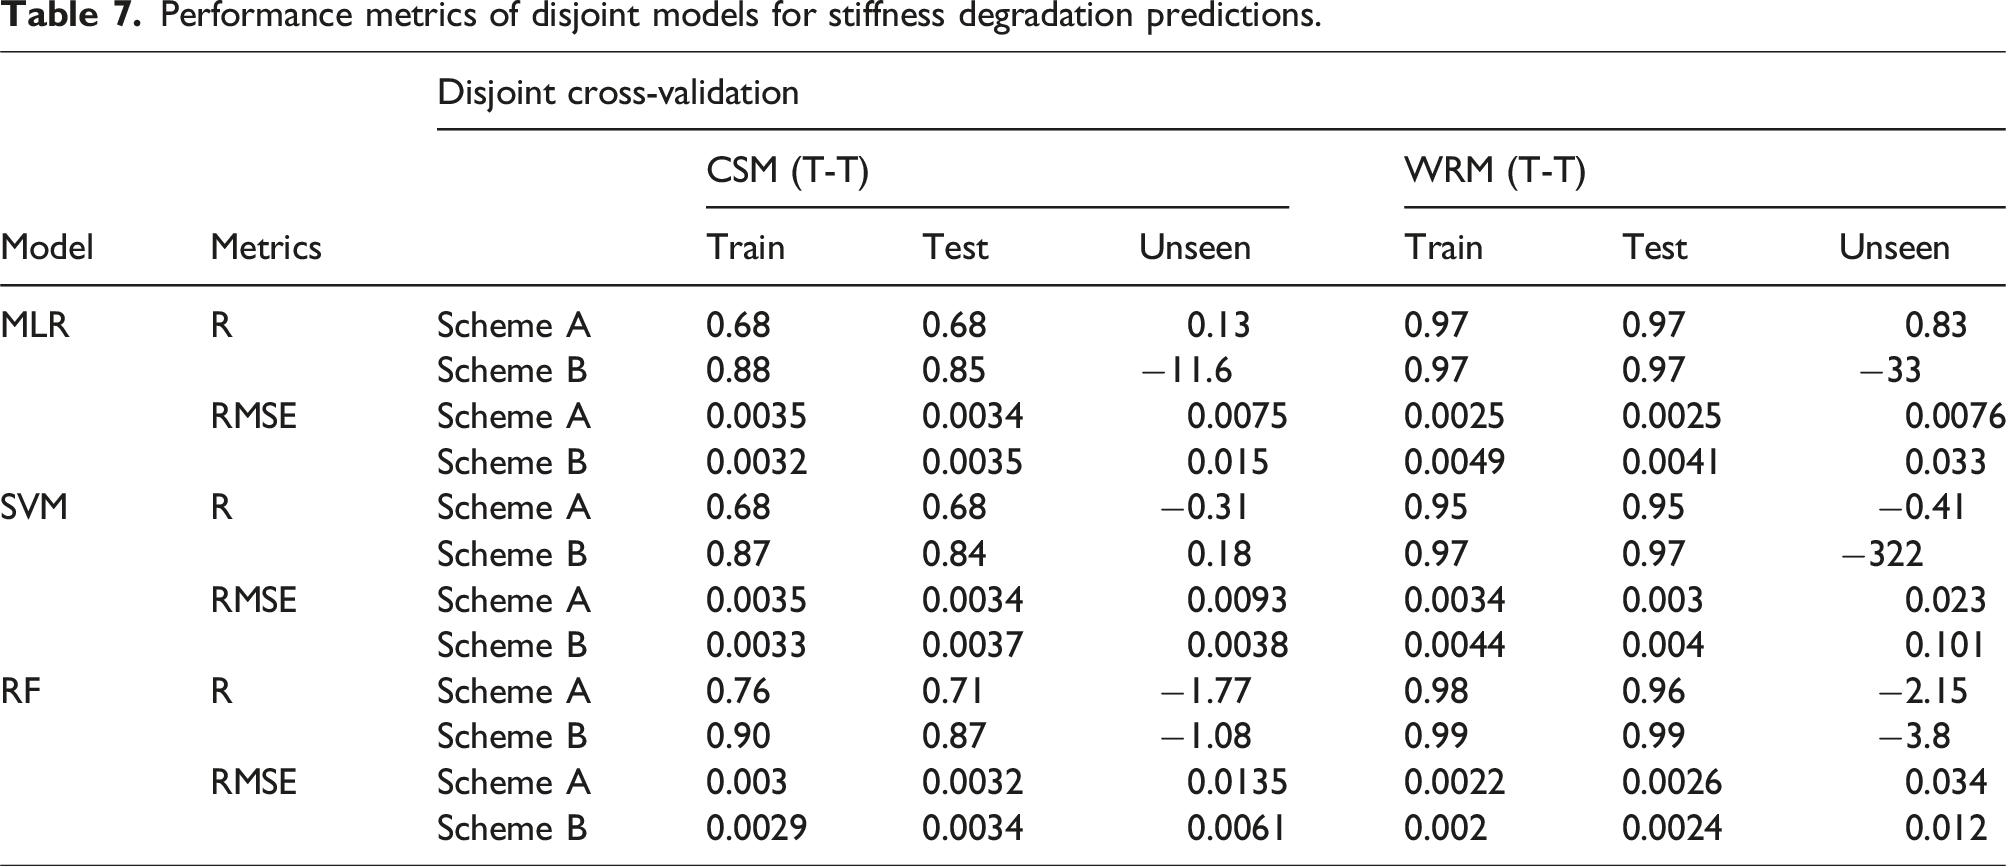
It can be seen in Figure 14, for CSM (T-T) composites, the SVM and RF models in Scheme A and the MLR and RF models in Scheme B exhibit poor prediction for unseen stiffness values, with R-squared values ranging from −11.6 to −0.31. Similarly, it can be seen in Figure 15 that for WRM (T-T), the RF model in Scheme A and all models in Scheme B show weak predictability on unseen data. This decline in accuracy suggests that conventional ML approaches struggle to generalize across different loading cycles. The authors attribute this poor performance to the multi-axial local stress state in woven and chopped composites. These brute-force methods lack detailed stress state information and, therefore, fail to adequately capture the material’s complex behaviour. Performance of ML models under disjoint cross-validation for CSM (T-T) composite. Scheme A models are trained on the first 104 cycles, and Scheme B models are trained on cycles 103 to 105 of the CSM (T-T) dataset. Without seeing values from cycles 104 to 105 (Scheme A) and 1 to 103 cycles (Scheme B), only the MLR model in scheme A and the SVM model in Scheme B capture the stiffness degradation trend. Performance of ML models under disjoint cross-validation for WRM (T-T) composite. Scheme A models are trained on the first 104 cycles, and Scheme B models are trained on cycles 103 to 105 of the WRM (T-T) dataset. Without seeing values from cycles 104 to 105 (Scheme A) and 1 to 103 cycles (Scheme B), MLR and SVM in Scheme A capture the stiffness degradation trend, whereas all the models in Scheme B suffer from severe over-fitting.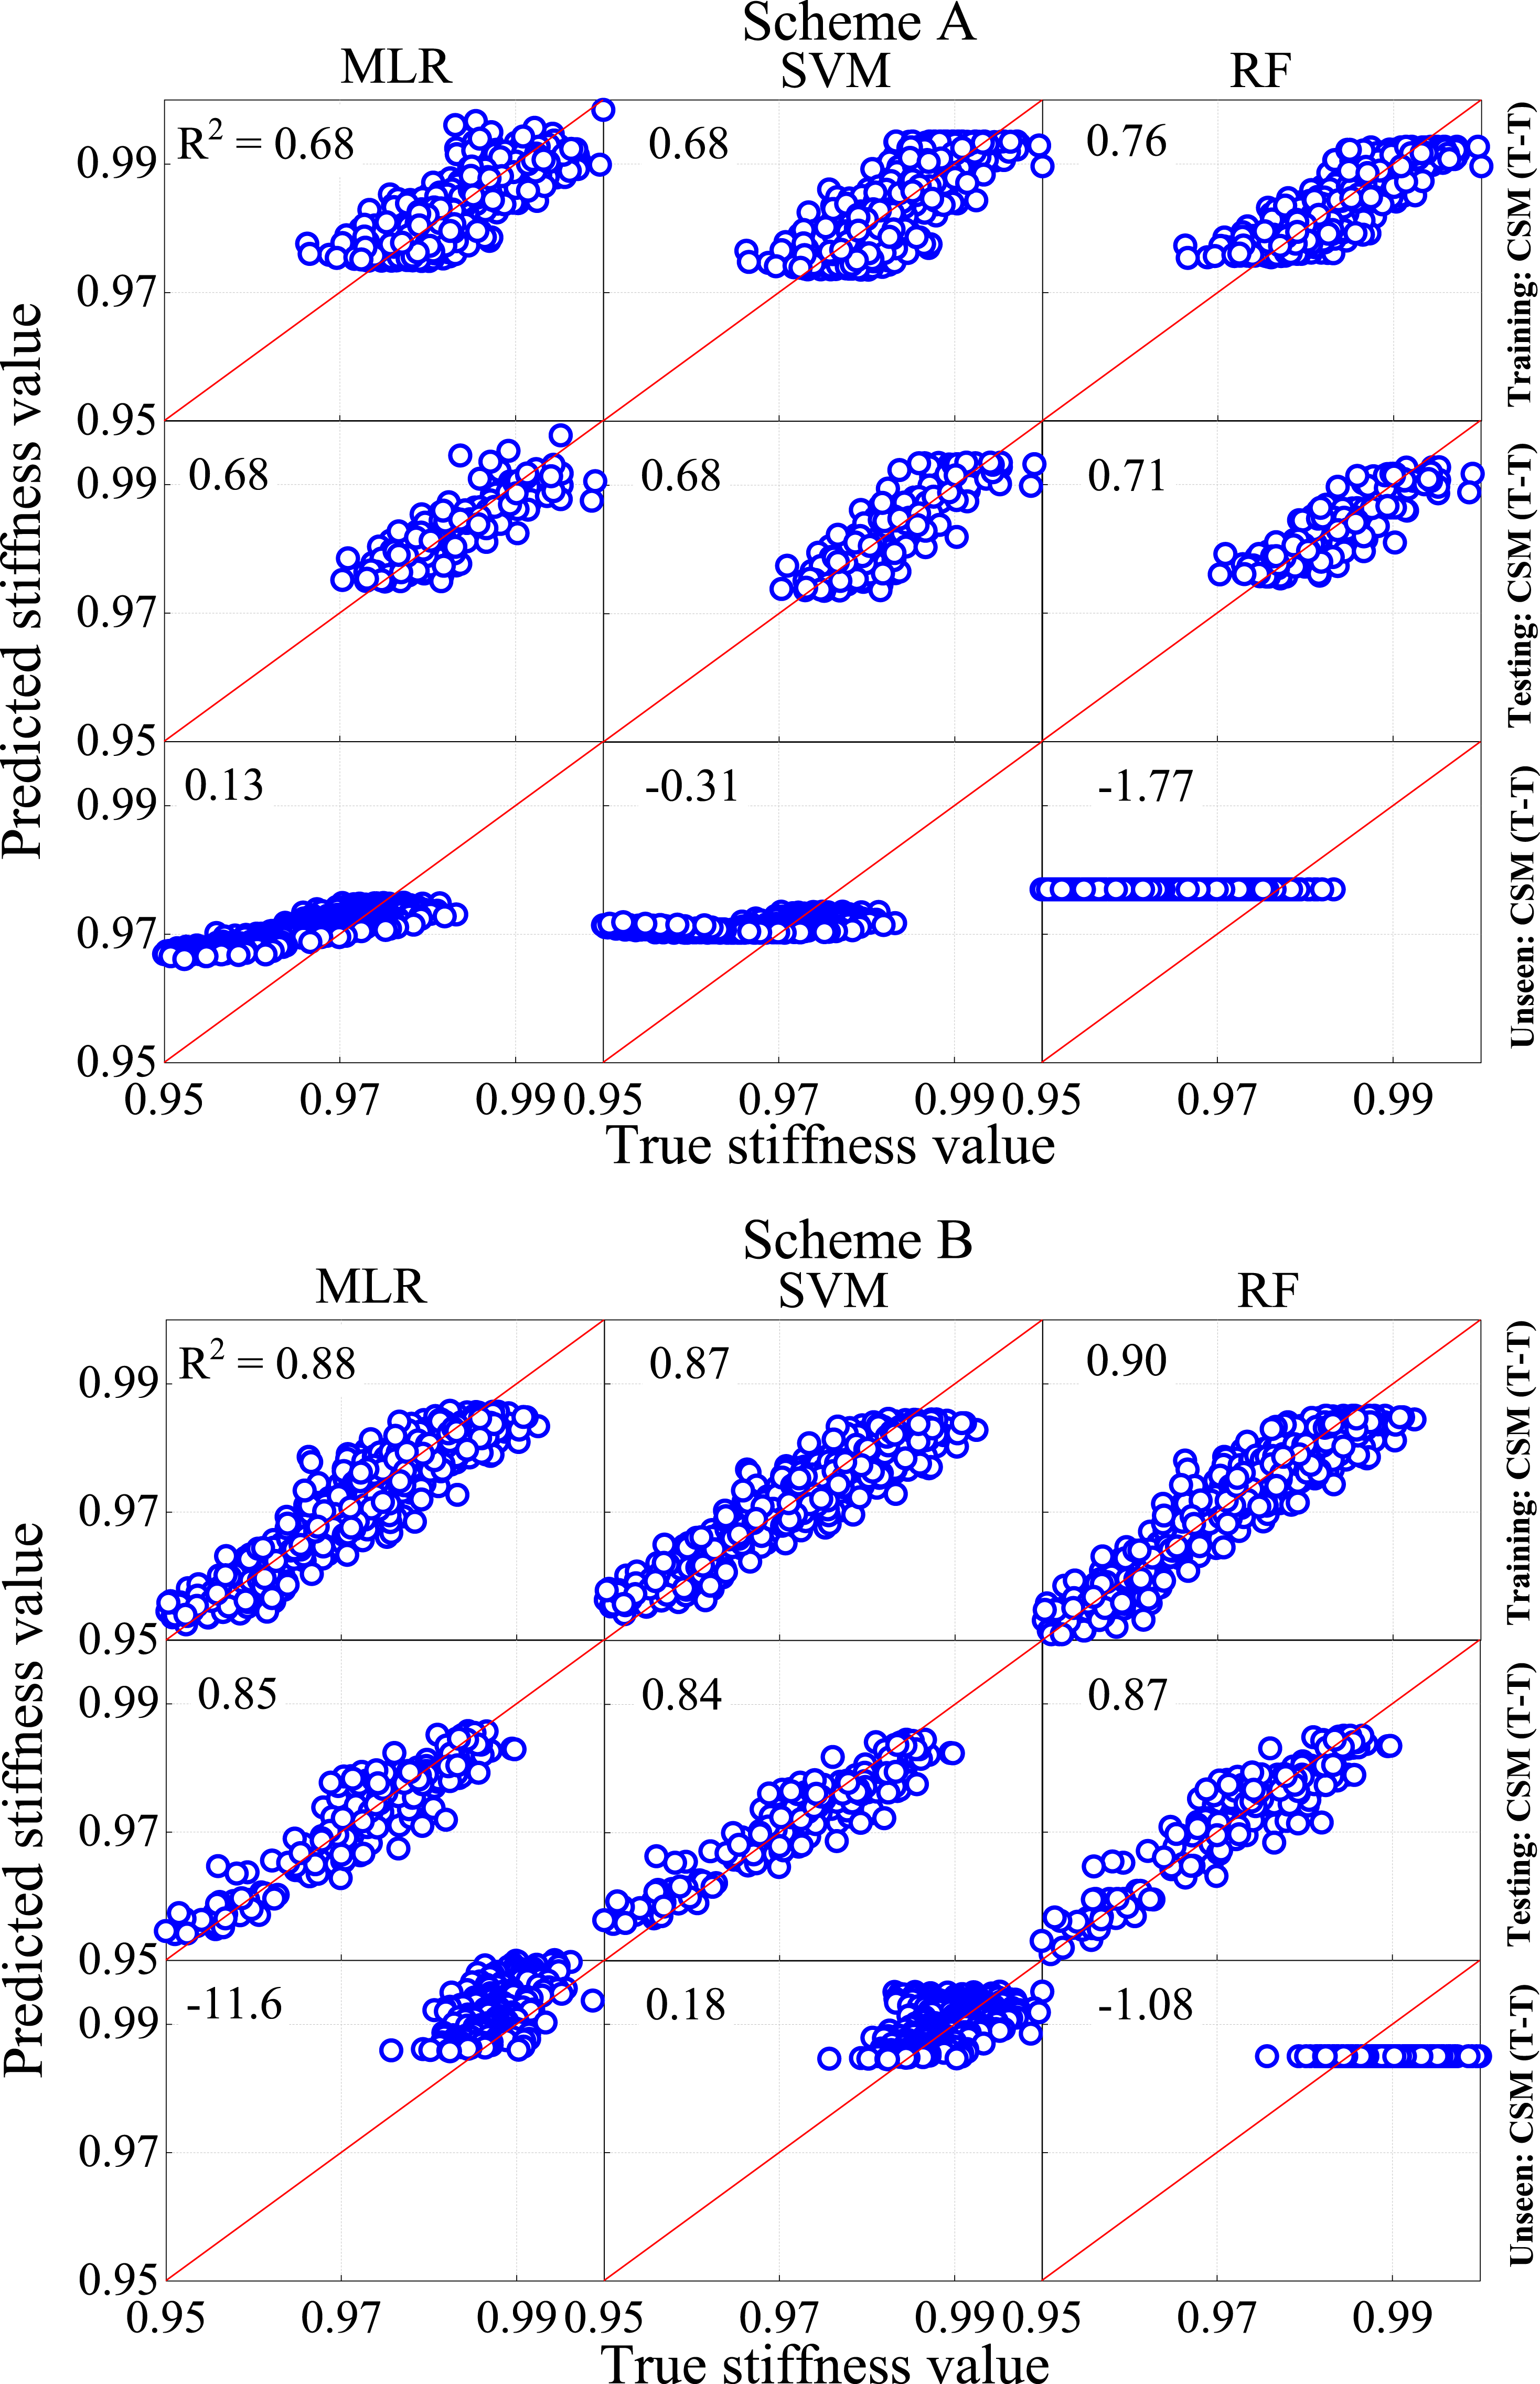
Performance metrics of conventional models for stiffness degradation predictions.
Performance metrics of disjoint models for stiffness degradation predictions.
Feature importance analysis
The SHAP (Shapley Additive explanations) method was utilized to assess feature significance by determining the impact of each input parameter on stiffness degradation. 41
Figure 16(a) illustrates that for ML models trained on the CSM (T-T) dataset, perpendicular debonding was the most influential factor in the MLR model. Conversely, parallel interface crack was the primary contributing element in the SVR model and also played a significant role in MLR predictions. Perpendicular matrix cracking had minimal contributions in both the MLR and SVR models. Influence of input parameters on stiffness degradation. (a) ML models trained on CSM (T-T), and (b) ML models trained on WRM (T-T).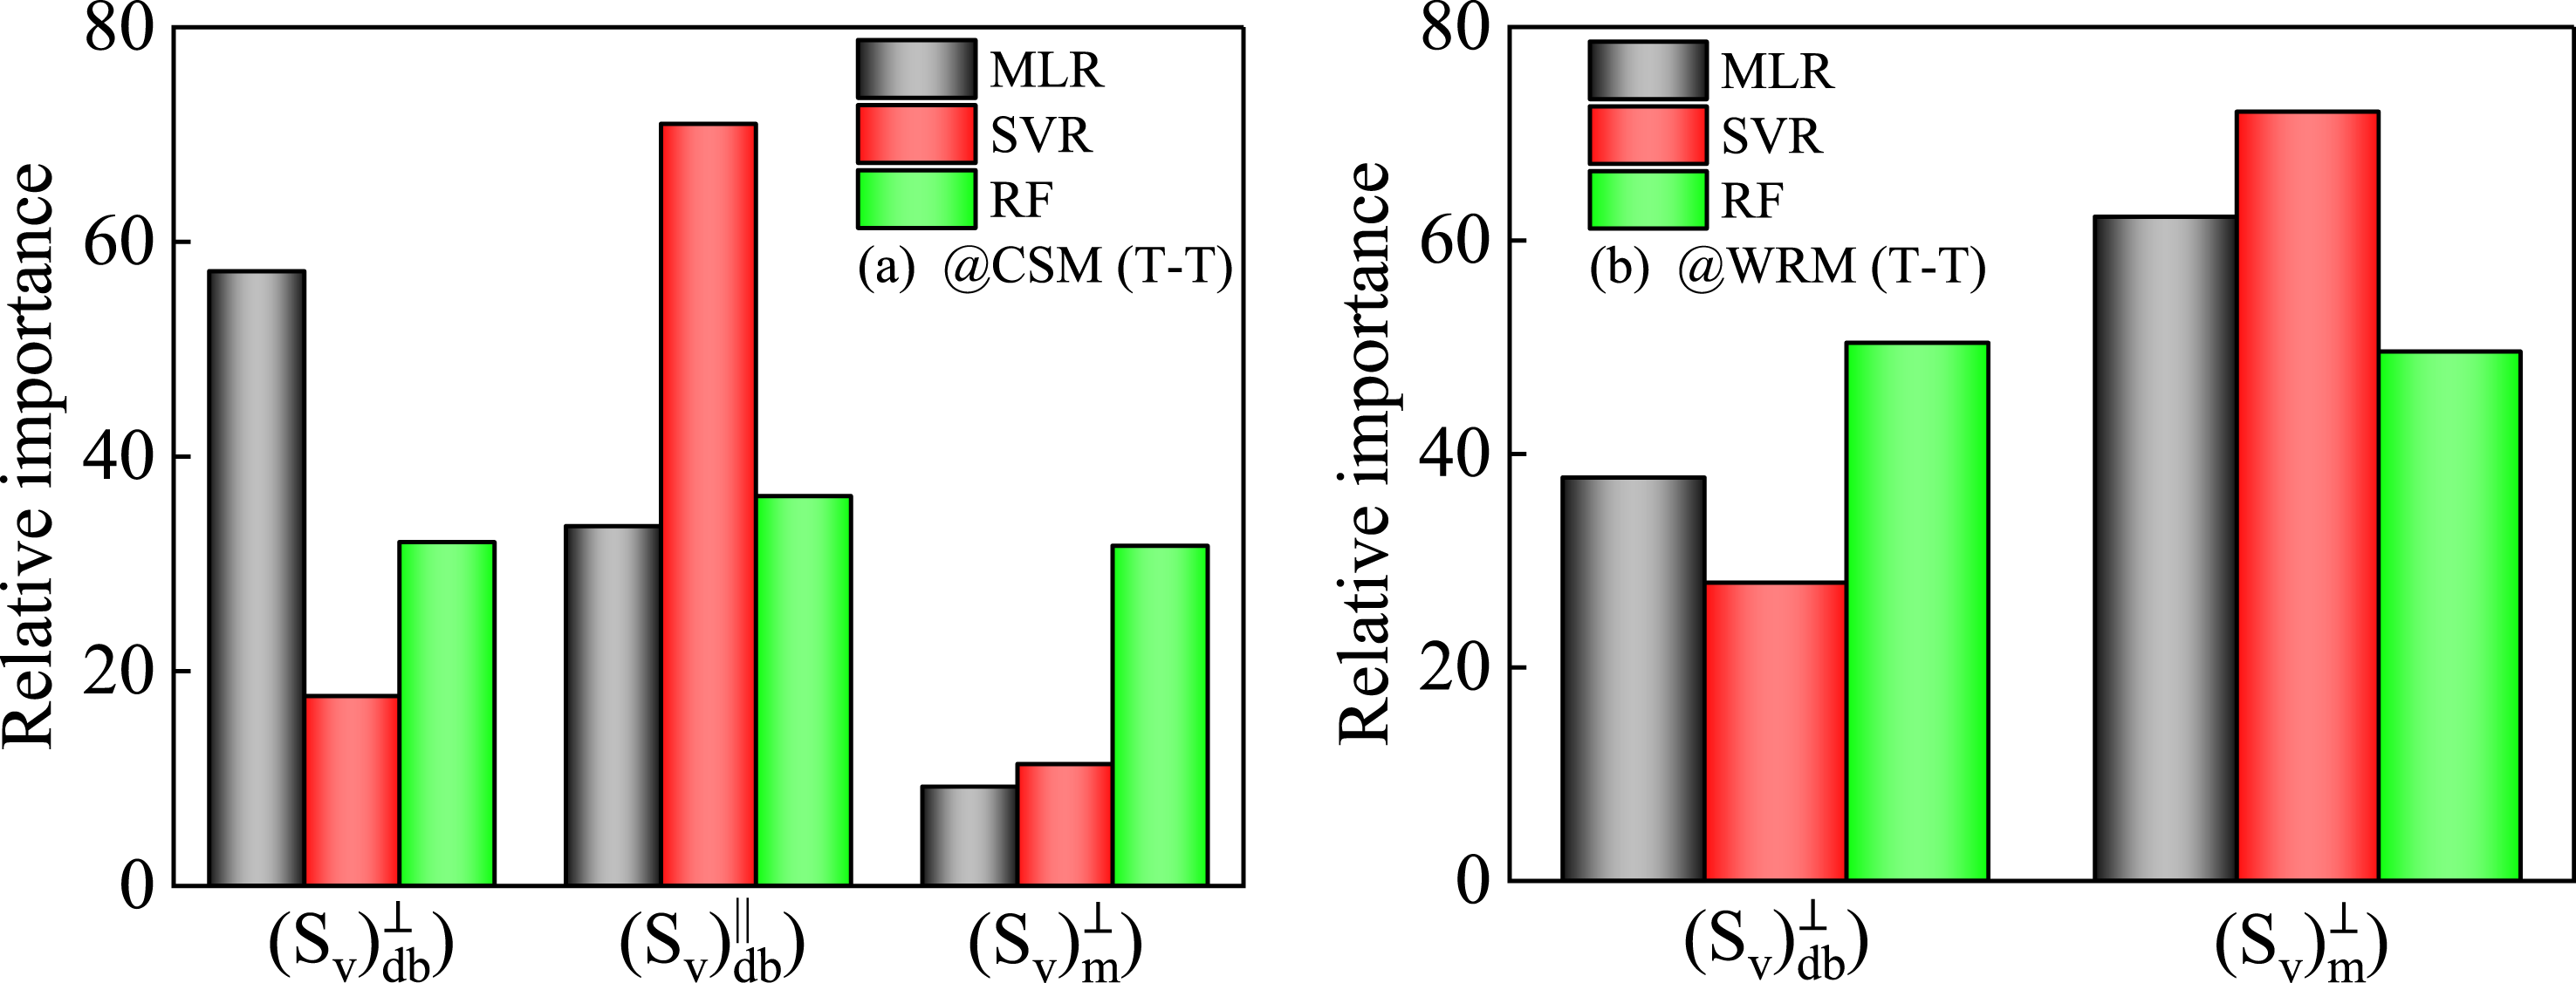
For the WRM (T-T) dataset (Figure 16(b)), perpendicular matrix cracking was identified as the most dominant microstructural constituent in both the MLR and SVR models, followed by perpendicular interface debonding. In the RF model, all input parameters contributed almost equally in both composite types.
Conclusions
In this work, fatigue damage at the micro-length scale in woven roving mat (WRM) and chopped strand mat (CSM) composites was investigated under tension-tension (T-T) and compression-compression (C-C) cyclic loading, with the aim of improving the understanding of the initial damage mechanisms and correlating these microstructural damages to stiffness degradation using machine learning (ML). This is for the first time that the true three-dimensional internal microstructural damage parameters of these composites were quantified. The microstructural damage parameters in terms of parallel interface debonding • Experimental fatigue investigation revealed that the secant modulus of both composites significantly degrades under T-T cyclic loading, while exhibiting minimal changes under C-C cyclic loading. • Microstructural damage in the form of interface debonding and matrix cracking was observed in WRM composite when subjected to T-T cyclic loading. However, no damage was observed in WRM composite when subjected to C-C cyclic loading. • Under both T-T and C-C cyclic loading, fatigue cracks aligned with the loading direction were observed in CSM composites, in addition to perpendicular cracks. However, these aligned cracks were not observed in WRM. Notably, the perpendicular cracks in CSM only appeared on fibres that were transverse to the loading direction. • Perpendicular cracks in WRM and CSM were observed only under T-T cyclic loading, whereas no perpendicular cracks appeared when WRM and CSM were subjected to C-C cyclic loading. • Microstructural damages, such as interface debonding and matrix cracking, increased nonlinearly with the number of cycles. Additionally, in CSM composite, the local clustering of the fibres significantly influenced interface cracking compared to matrix cracking, resulting in higher parallel interface debonding surface area per unit volume under C-C fatigue than under T-T fatigue. • All the ML models demonstrated strong overall predictability of stiffness values for both CSM (T-T) and WRM (T-T) composites, as indicated by an average error rate of less than 1%. The R-squared value exceeded 0.95 for WRM (T-T) and 0.90 for CSM (T-T), reflecting good performance in capturing general trends. For the CSM (T-T) composite, only the SVR model with a polynomial kernel accurately captures the trend of stiffness degradation across all cycles.
The ML model unifies the prediction of stiffness degradation in WRM and CSM composites through a microstructural damage-based approach. Unlike traditional models that often rely on phenomenological assumptions and complex crack-shape modelling, the ML model leverages experimental microscopy and stereology data to correlate microstructural damage with stiffness reduction. Standardized microscopy techniques ensure accurate damage quantification, providing reliable inputs for ML training. This approach simplifies the analysis while effectively capturing complex damage-stiffness interactions, making it a valuable tool for fatigue analysis of these composites.
Supplemental Material
Supplemental Material - Microstructural damage dependent machine learning model to predict stiffness reduction in damaged GFRP composites
Supplemental Material for Microstructural damage dependent machine learning model to predict stiffness reduction in damaged GFRP composites by Mritunjay M Hiremath, Timo Bernthaler, Pascal Anger, Sushil K Mishra, Anirban Guha and Asim Tewari in Journal of Reinforced Plastics and Composites.
Footnotes
Acknowledgments
The authors would like to thank Carl Zeiss Microscopy GmbH, Germany, for their support in obtaining scanning electron microscope images, and to Aalen University, Germany, for technical support. We are grateful to the AMTF facility at Indian Institute of Technology Bombay for providing the necessary equipment for conducting mechanical tests.
Author contributions
Mritunjay M. Hiremath: Conceptualization, Methodology, Data curation, Investigation, Formal analysis, Writing – original draft. Timo Bernthaler: Methodology, Resources. Pascal Anger: Methodology, Resources. Sushil K. Mishra: Supervision, Resources, Writing – review & editing.. Anirban Guha: Supervision, Resources, Writing – review & editing. Asim Tewari: Conceptualization, Supervision, Resources, Funding acquisition, Writing – review & editing
Declaration of conflicting interests
The author(s) declared no potential conflicts of interest with respect to the research, authorship, and/or publication of this article.
Funding
The author(s) disclosed receipt of the following financial support for the research, authorship, and/or publication of this article: This work was supported by the Indo-German Science and Technology Centre (IGSTC) [IGSTC/IF Call 2022/PIEF-(MH)/23/2022-23].
Data Availability Statement
The datasets generated during and/or analyzed during the current study are available from the corresponding author on reasonable request.
Supplemental Material
Supplemental material for this article is available online.
Note
References
Supplementary Material
Please find the following supplemental material available below.
For Open Access articles published under a Creative Commons License, all supplemental material carries the same license as the article it is associated with.
For non-Open Access articles published, all supplemental material carries a non-exclusive license, and permission requests for re-use of supplemental material or any part of supplemental material shall be sent directly to the copyright owner as specified in the copyright notice associated with the article.