
Abstract
This work reports distinct thermo-elastic behavior during the monotonic tensile loading of epoxy-based polymer matrix nanocomposites comprised of varying weight fractions (wt.%) of amine-functionalized multi-walled carbon nanotubes (MWCNT) and amine-functionalized graphene nanoplatelets (GNP). Four configurations—0.1 wt.% and 0.2 wt.% of CNT/epoxy and GNP/epoxy—were produced for this study. With the addition of nanofillers, an improvement in tensile strength of 36.00 ± 1.85% was achieved in 0.2 wt.% CNT/epoxy samples and 30.00 ± 4.08% in 0.1 wt.% GNP/epoxy compared to the baseline epoxy. Differential scanning calorimetry (DSC) and thermomechanical analysis (TMA) were conducted to determine glass transition temperature (T g ), specific heat capacity (C p ), and coefficient of thermal expansion (CTE) of baseline epoxy and the nanocomposites. Temperature profiles were measured during monotonic tests of nanocomposites using an infrared thermography (IRT) camera, yielding distinctive temperature-stress profiles based on thermoelastic stress analysis (TSA). The initial slopes of these temperature-stress plots, known as the thermoelastic constant (K0), were determined graphically for all the nanocomposite specimens. K0, thus obtained from monotonic testing, was in the same range of the values obtained from equivalent DSC/TMA measured values for the chosen nanocomposites in this study. Thus, K0 measurements from TSA can be used as a novel way to discern a nanocomposite’s microstructural composition.
Keywords
Introduction
Lightweight design using polymer matrix composites (PMCs) is crucial for addressing aviation emissions, improving structural performance, and achieving cost reductions, making it essential from both sustainability and economic considerations.1–3 However, PMC performance is primarily limited by the mechanical strength and toughness of the matrix phase, which is often a thermoset epoxy. It is now well-established that carbon nanofillers (CN) can be used to enhance the mechanical properties of thermoset resins such as epoxy and that the properties of such nanocomposites are highly dependent on CN dispersion,4–8 alignment,9–15 volume and weight fraction,7,16,17 and interactions between the CN and the resin.18–20 For these polymers with nanofillers or nanocomposites, the CN can be zero-dimensional (0D), tube-like or one-dimensional (1D), plate-like or two-dimensional (2D), and three-dimensional (3D). 21 Among the most commonly used CN with an epoxy resin, carbon nanotubes (CNT) fall into the 1D category, and graphene falls into the 2D category. 22
As mentioned earlier, the dispersed CN’s shape/size, interfacial interactions with resin through functionalization, morphology, and volume fractions play an important role in determining the final properties of the nanocomposite.23–25 Inadequate dispersion of CN results in the formation of clusters or agglomerations within the epoxy matrix, as noted in prior studies. 26 These agglomerated CN impair effective load transfer across the composite, leading to diminished mechanical properties, such as reduced tensile strength and stiffness. 27 Ultrasonication and high-shear mixing have been used for uniform dispersions.5,18,28–30 In addition, the size of CN particles plays a substantial role in controlling mechanical properties because interaction with the matrix surface, particle motion, and dispersion depend on that size.6,31 Hsieh et al. 25 reported a 49% increase in fracture toughness with the standard length (140 µm) of 0.5% wt.% multi-walled (MW)CNT and a 29% increase with lower-length MWCNT (32 µm) in the epoxy matrix dispersed using ultrasonication. Kilic et al. 30 reported a 41% increase in tensile strength with 1 wt.% GNP/epoxy sample using ultrasonication. Shen et al. 8 reported an improvement of 12.4% with 0.25 wt.% GNP/epoxy nanocomposites using planetary centrifugal mixture. Cha et al. 32 reported a 23% enhancement in tensile strength with the amine-functionalized GNP/epoxy sample and a 22% enhancement with the amine-functionalized CNT/epoxy sample.
In addition to nanocomposites, CN in the uni-directional (UD) continuous carbon fiber reinforced polymers (CFRP) have also increased mechanical performance. CN enhance intra-laminar resistance that counters in-plane damage, preventing crack growth within a composite layer. Additionally, CN enhance inter-laminar resistance that reduces delamination between layers while boosting overall strength. 33 Saadatyar et al. 28 reported a 28.5% improvement in tensile strength with 0.1 wt.% MWCNT/CFRP. Quan et al. 34 also reported an improvement of 171% in mode-II fracture energy by adding 1 wt.% MWCNT in CFRP. Due to the structure and shape of CN, alignment can play a major role in achieving the anticipated mechanical, electrical, and thermal properties of the composites. 21 Pothnis et al. 17 reported higher values of modulus and hardness in the nanocomposite with a 0.1 wt.% of MWCNT compared to the neat epoxy and found a 27% increase in tensile strength of UD-glass (G) FRP (UD-GFRP) with epoxy-modified with MWCNT compared to the strength of UD-GFRP with baseline epoxy resin. Khan et al. 35 reported that different lengths (short and long) of MWCNT affect their alignment behavior, with over 40% improvement in the stiffness of the nanocomposite. Moaseri et al. 36 reported an improvement of 44% in tensile strength with 0.5 wt.% MWCNT using the magnetic-assisted alignment method. Wu et al. 13 reported the alignment of GNP using an electrical field and found a 900% increase in the mode I fracture toughness. Pothnis et al.9,10,37 demonstrated a scaled-up electric field-based alignment technique with controlled distribution and alignment of MWCNT infused in GFRP around an open hole to mitigate stress concentration. Singer et al. 33 reported an improvement of 32% in tensile strength when MWCNT are aligned via an electric field in CFRP.
While including CN in the epoxy matrix enhances nanocomposite properties, evaluating microstructural features, including the dispersion quality and alignment of CN, is essential for establishing clear relationships between processing conditions, inherent microstructure, and composite systems’ structural/functional performance. Direct measurement techniques such as scanning electron microscopy (SEM),6,19,24,38 transmission electron microscopy (TEM),6,7,39 atomic force microscopy (AFM),25,40 and indirect methods such as Raman spectroscopy9,37–39 and two-probe measurements 37 are commonly used to quantify CN alignment and dispersion state. 41 Discerning the uniformity in the nanocomposite microstructure via direct visual techniques, SEM, TEM, and AFM, is usually challenging. 41 TEM, AFM, and SEM provide high-resolution surface topography and morphology,6,42 and Raman spectroscopy identifies chemical composition and molecular structure. 43 These techniques often have size limitations or are limited to localized analysis. While TEM and AFM provide nanoscale resolution useful for characterizing surface topography, nanofiller concentrations and the dispersion state, for large-scale samples, multiple AFM measurements at multiple locations might be necessary to assess local variations in the nanofillers. Additionally, TEM/AFM demands extensive surface preparation, making nanofiller characterization in nanocomposites an arduous task.6,42 Raman spectroscopy excels in identifying chemical compositions and molecular structure but lacks spatial resolution for heterogeneous materials. 43 While SEM is often used to view fracture surfaces, it is not intended to study process-microstructure-property relations effectively.9,41,44
To address some of these challenges, non-destructive testing (NDT) methods coupled with in situ mechanical testing provide an alternative. 45 Some of the NDT used with in situ mechanical testing are the potential drop method, ultrasonic testing, acoustic emission, eddy current thermography, computerized tomography inspection, and infrared thermography (IRT).45–47 In IRT, defects and other discontinuities are detected based on the change in full-field surface temperatures caused by heat transfer, measured using an infrared camera.46,48 Defects manifest as “hot spots” acting as sentinels for damage initiation under mechanical loading. 47 IRT can be active or passive. In the case of active IRT, an external stimulus (heat source) is required to induce surface temperature variation.47,49 On the other hand, passive IRT does not require an external heat source and relies on measuring changes in the specimens’ surface temperatures undergoing mechanical loading via thermoelastic stress analysis (TSA)—changes in surface temperatures under mechanical loading occur due to thermoelastic coupling or dissipative damage events within the specimen.50,51 Thus, IRT-based TSA facilitates non-destructive measurement of stress and material properties over larger areas. 52
IRT is widely used for large-scale structural applications, spanning structural health monitoring and predictive maintenance, energy efficiency, NDT, and safety monitoring.53–57 With the integration of nanomaterials for improved structural performance and multi-functionality,58,59 IRT-based TSA can provide the additional task of assessing the microstructural architecture at the mesoscale.60–62 By mapping thermal responses to microstructural characteristics, TSA can theoretically identify these variabilities—such as inconsistent nanofiller dispersion or voids—via thermal signatures, enhancing quality control, durability, and reliability. Figure 1 illustrates a typical surface temperature evolution as a function of the applied uniaxial mechanical loading. In the elastic regime, referred to as zone I, the temperature decreases with the increase in applied stress. As the material approaches its elastic limit or proportional limit, the temperature stabilizes in zone II. Upon further loading beyond the material’s elastic limit, the specimen surface temperature is found to increase, often attributed to inelastic dissipative processes until the specimen’s final failure in zone III.63–66 These insights, derived from IRT and TSA, underscore their combined potential for characterizing composite behavior under applied loading. Temperature variation with stress and time (adapted from Vergani et al.
49
).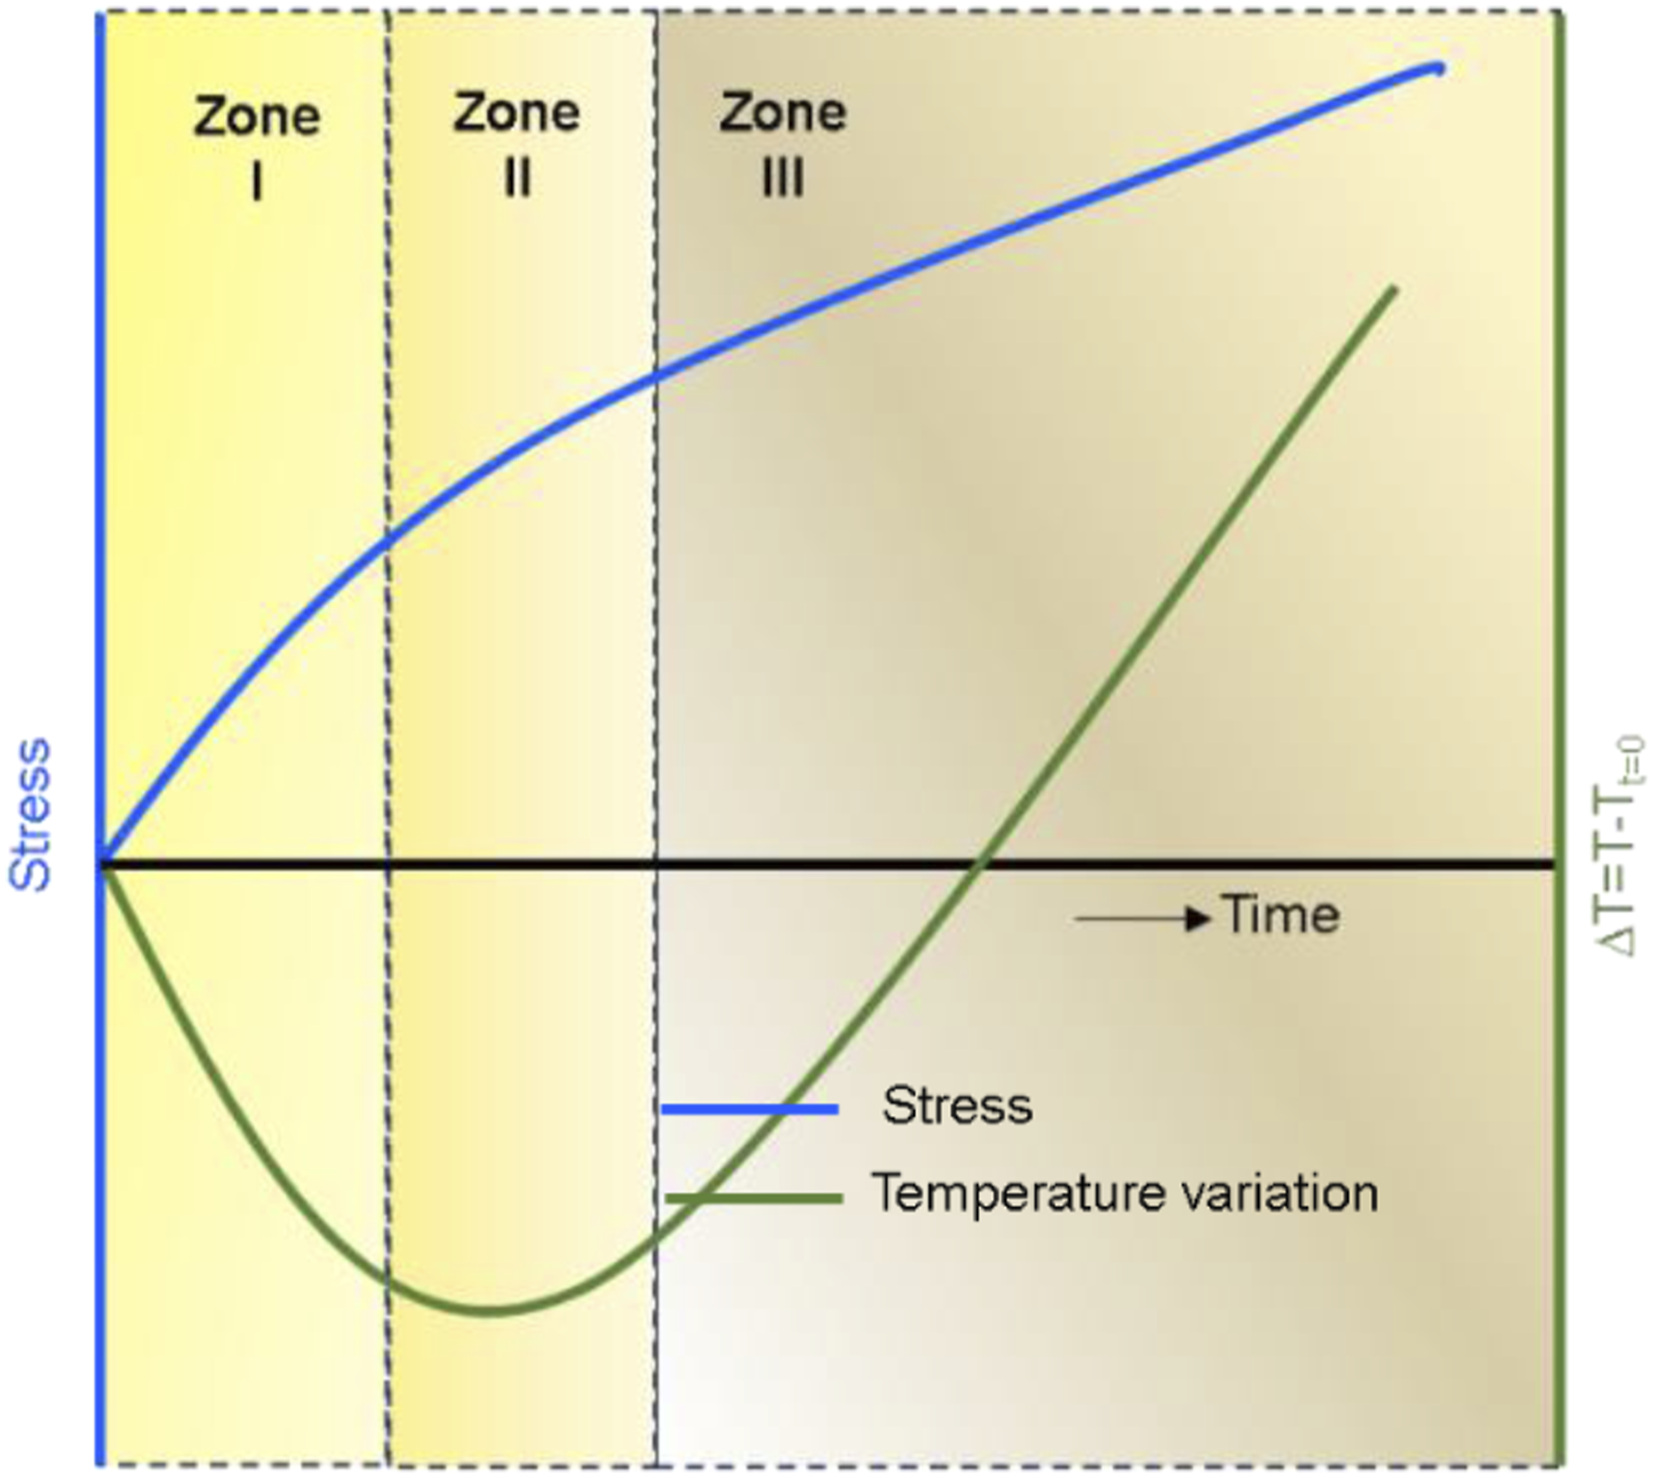
Depending on the material’s constitutivity, the slope of the temperature-stress curve in the elastic regime (zone I) yields a material property, K
0
, defined as the material’s thermoelastic constant. This surface temperature evolution of the specimen is given by the following equation for an isotropic material47,49
In previous studies, TSA, frequently paired with IRT, has been employed to characterize damage evolution and identify the proportional limit. In contrast, the current study expands the scope of TSA to novel material systems, specifically nanocomposites exhibiting diverse microstructural compositions. This research adapts TSA to formulate a methodology for assessing microstructural variations in nanocomposite systems at low-weight fractions, utilizing the K0. The originality of this work stems from the integration of an IRT-based TSA approach to determine K0 of nanocomposites by analyzing the initial slope of temperature change under static loading conditions. This constant serves as a metric to evaluate microstructural alteration resulting from the incorporation of nanomaterials into the epoxy matrix. To substantiate the validity of this method, experimental determinations of the CTE, C P , and ρ are utilized to independently calculate K 0, thereby providing a rigorous verification of the proposed technique.
Materials and methods
Epon-862 (diglycidyl ether of bisphenol F) and EPIKURE curing agent W (bisphenol-F epoxy resin and an aromatic amine) purchased from Miller-Stephenson were used as the resin and hardener with a 100:26.4 wt ratio based on the manufacturer’s recommendations. 70 Amine-functionalized MWCNT (Length: 10∼30 µm, outside dia: 10∼20 nm) purchased from MKnano and amine-functionalized GNP (surface area: >700 m2/g, lateral dimension: 1–2 µm, number of layers: <4 layers) from Cheap Tubes Inc. have been used in this study. The dimensions of the CN were verified via SEM. All the materials were used as received.
Nanocomposite fabrication
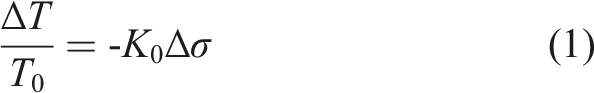
Figure 2 depicts the process flow used for nanocomposite processing. As a first step, nanofillers (MWCNT, GNP) were preheated for 20 min at 105°C to remove any moisture. After adding the necessary amount of preheated nanofillers to the epoxy, an overhead stirrer (ONiLAB Electric Overhead Stirrer) was used to disperse the nanofillers effectively. Stirring was done for 4.5–5 hours at 80°C around 900 rpm with a propeller-shaped stirrer. The next step was to add the hardener (Epikure W) to the mixture, followed by further stirring for 7 minutes. Then, the mixture was moved to the vacuum degassing chamber, and the degassing process was continued for 10–15 min. Parallelly, an aluminum mold was preheated around 80°C. As the temperature decreased during the vacuum degassing process, the mixture was heated again to around 80°C putting it inside the oven for 5 minutes to maintain a low viscosity that would aid the pouring. After heating, the mixture was poured into the preheated aluminum mold. The mold geometry adhered to ASTM D638 Type I standard
71
(see Figure 3(a) for dimensions). The curing cycle was 121°C for 2 hours, followed by 177°C for 2 hours. CNT/epoxy and GNP/epoxy at 0.1 and 0.2 wt.% were prepared using this process. Baseline epoxy samples were also prepared using ASTM D638 Type I geometry. The selection of weight percentages was based on previous studies13,14,17,27 aimed for optimal mechanical performance while avoiding higher weight percentages that tend to agglomerate due to poor dispersion.4,27 Also, in our experimental studies, it is evident that increasing the weight percentage from 0.2 to 0.3 wt.% results in a 21% reduction in tensile strength for CNT/epoxy and 10% reduction for GNP/epoxy. For each wt.% CN/epoxy system, three replicates were prepared for tensile testing under in situ IRT-based TSA. Nanocomposite fabrication process yielding ASTM 638 Type I specimens. (a) ASTM 638 Type-I sample dimensions (All dimensions are in mm), (b) Mechanical testing setup of nanocomposites per ASTM 638 using in situ infrared thermography for TSA analysis and extensometer for strain measurement.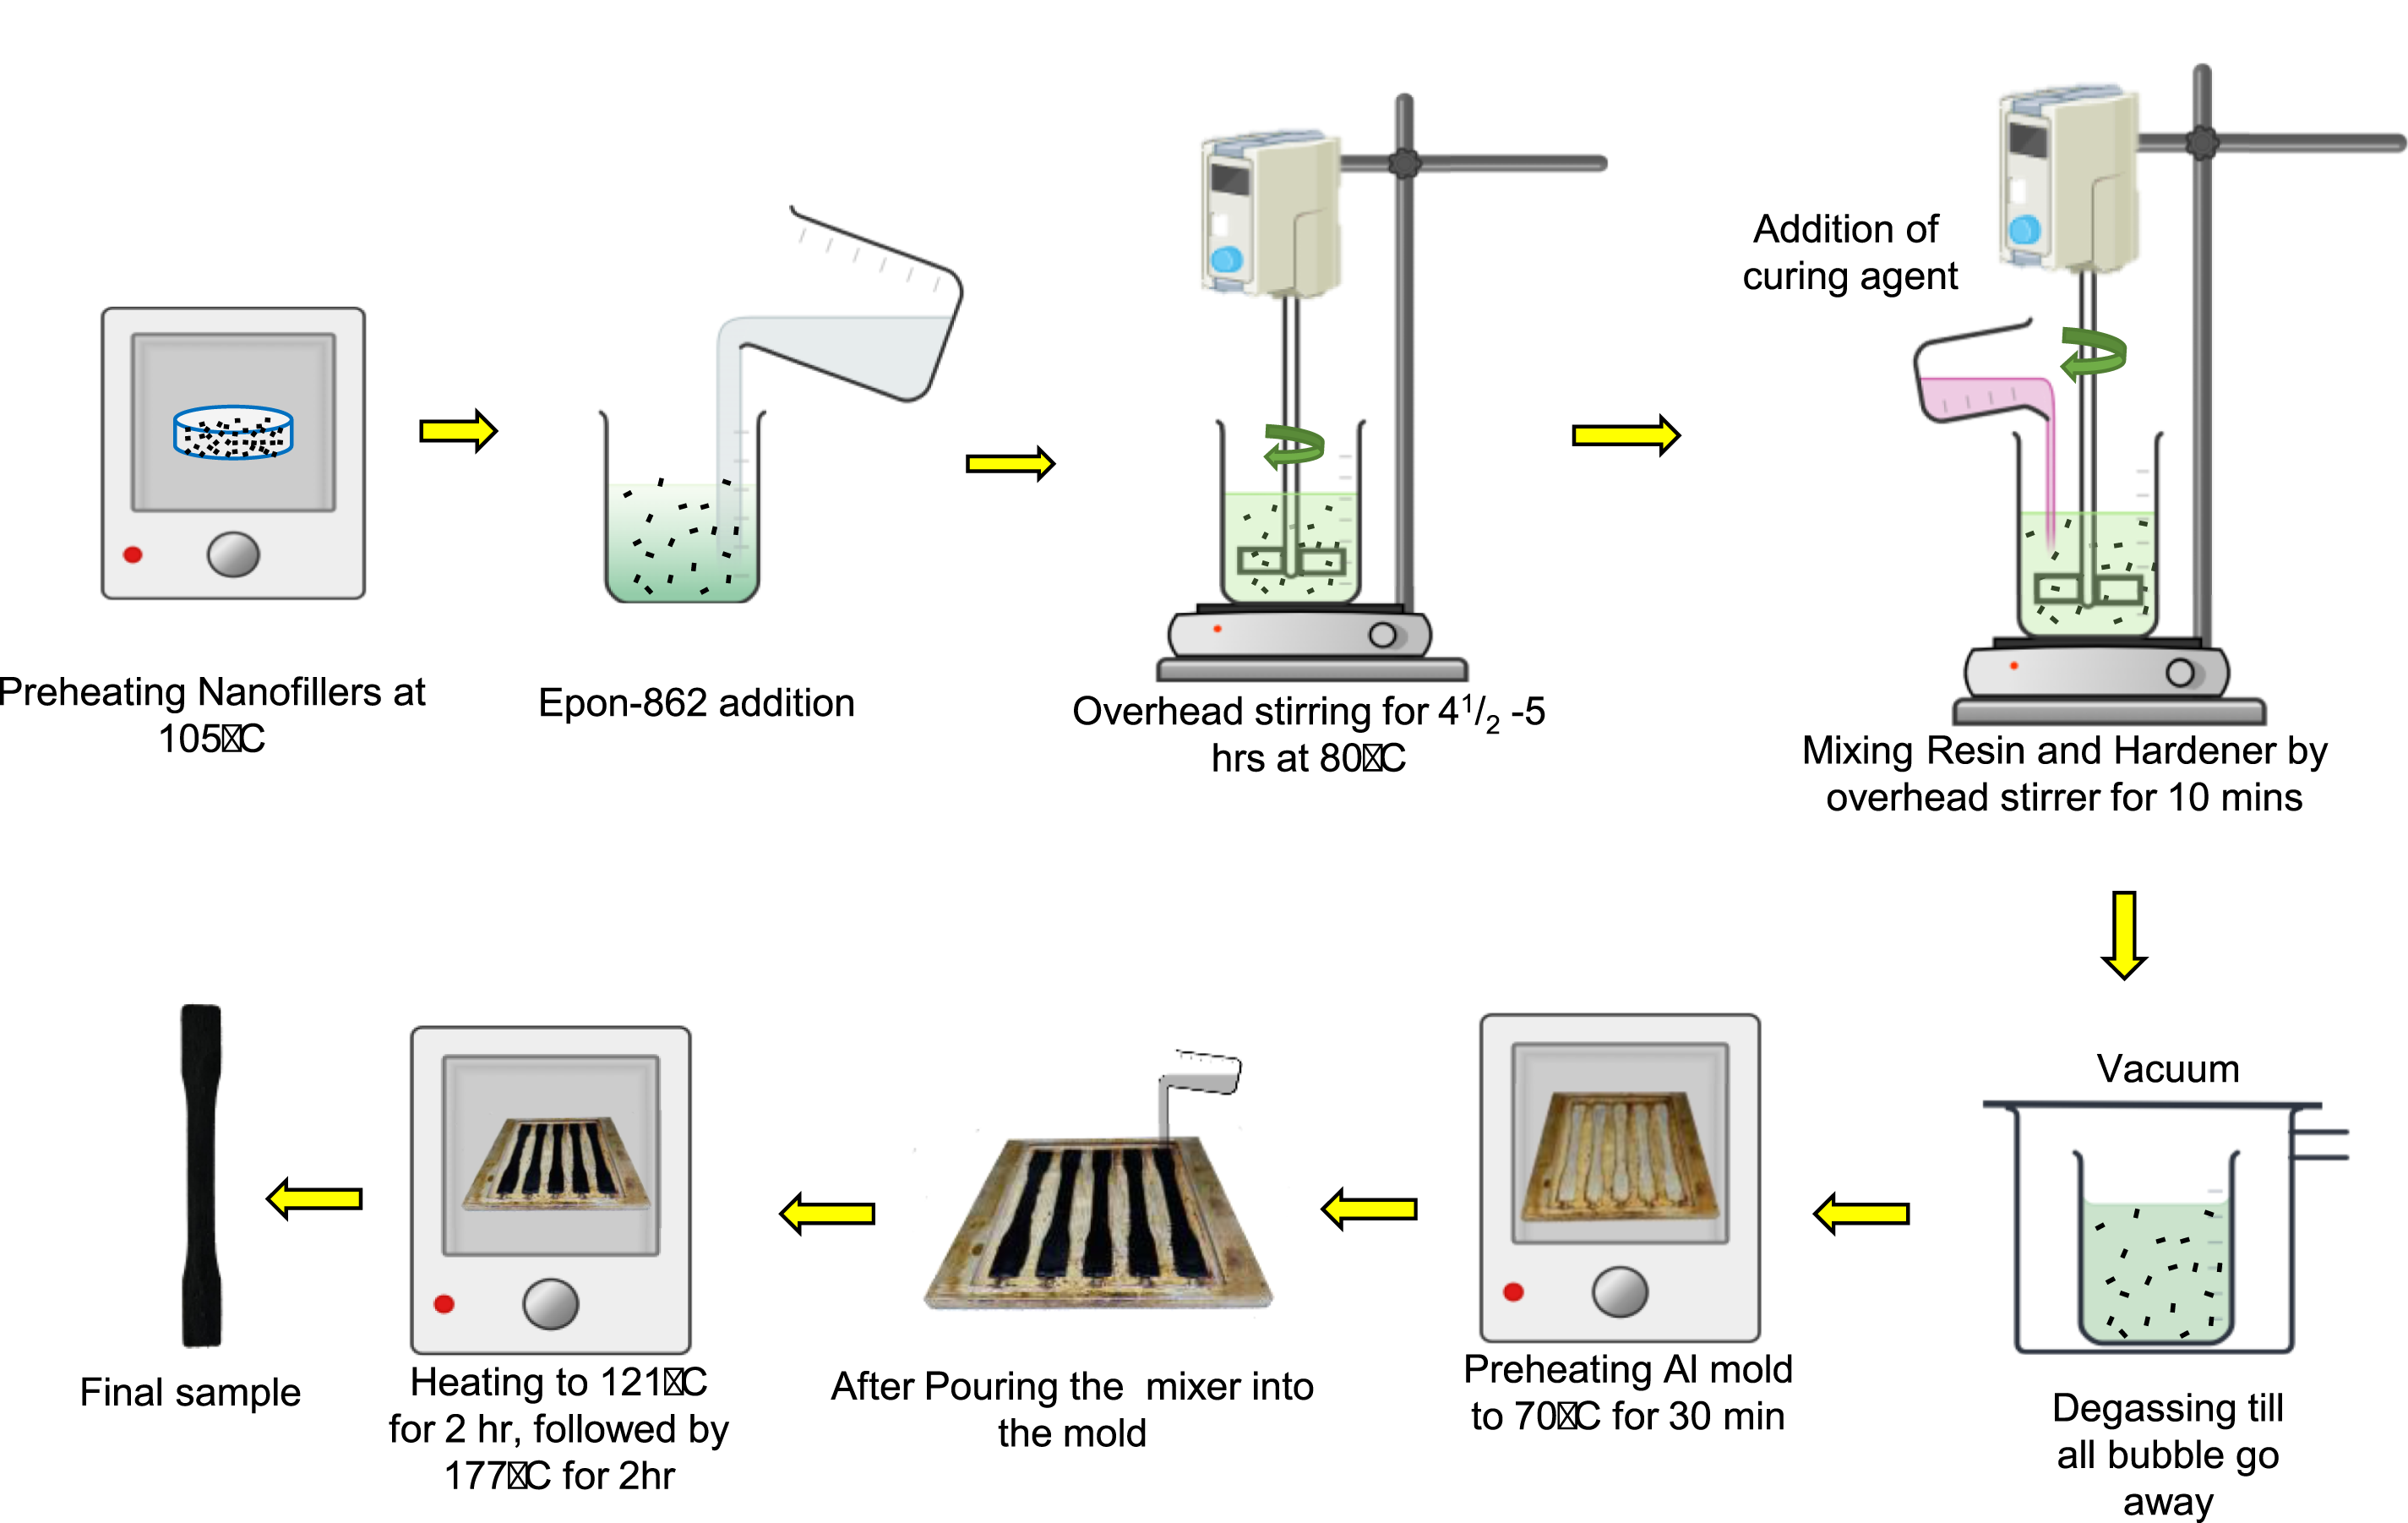
Monotonic tensile testing with in situ IRT
All tensile tests were performed using a 100 kN servo-hydraulic universal testing machine (MTS Landmark 370.25) under displacement-controlled loading of 2 mm/min per ASTM D638 specifications. Strains were measured using an extensometer with a 5 cm gage length. Figure 3(b) depicts a Telops Spark M150 medium-wave infrared (MWIR) camera for in situ temperature measurements during monotonic tensile testing.
The camera features an InSb-cooled detector, a sensor with a resolution of 640 × 512 pixels, a 50 mm lens, and a noise equivalent temperature difference (NETD) of 20 mK. The spectral range of the camera ranges from 3 to 5.4 µm. A rectangular region of interest (ROI) near the failure region was selected for data analysis. The thermographic data of that ROI was extracted using Reveal IR software and subsequently processed in MATLAB. To ensure uniform emissivity of all nanocomposite samples used in this study, all the samples were painted matt black before temperature measurements. This is consistent with past literature, where black paint is used to stabilize the emissivity of samples. Anilchandra et al. 72 investigated the emissivity of UDGFRP-CNT composites, reporting values between 0.94 and 0.99, attributing these to the distinctive structure of CNT enhancing thermographic outcomes. Controlling emissivity is critical as variations can compromise the accuracy of temperature data derived from IRT. Barton et al. 73 determined that matte black paint adequately ensures high emissivity while exhibiting minimal attenuation effects. Thus, black paint is employed to ensure precise temperature readings, which are required for precise K0 calculation in epoxy nanocomposites. As mentioned, three specimens were tested for each configuration—pure epoxy, 0.1 wt.% CNT/epoxy, 0.2 wt.% CNT/epoxy, 0.1 wt.% GNP/epoxy, and 0.2 wt.% GNP/epoxy—to establish repeatability.
Thermomechanical analysis and differential scanning calorimetry
TMA test was performed to determine the CTE (α) of all five configurations using TMA Q400 by TA instruments. All the tests were performed at a temperature ramp of 5°C/min from 25°C to 160°C. Samples of dimensions 4 × 4 × 3 mm size were cut using a precision knife, polished with sandpaper, and used for the experiments. Three specimens for each configuration were used to measure the CTE using the ASTME831 standard. Experimental data was collected and analyzed using Universal Analysis software by TA instruments to determine CTE.
DSC testing was used to determine the C p using DSC Q20 manufactured by TA instruments. A typical DSC sample weighed in the range of 6–9 mg. A 5°C/min ramp was used from 25°C to 200°C. Three specimens for each configuration were tested. Collected data was analyzed using Universal Analysis software by TA instruments to calculate C p . C p and α, K 0 were estimated for the chosen test matrix.
Results and discussion
Tensile test
Figure 4(a) compares the ultimate tensile strength (σ
uts
) for the five configurations chosen in this study, while Figure 4(b) depicts the % improvement in σ
uts
of CN/epoxy systems compared to the baseline epoxy system. For 0.2 wt.% MWCNT/epoxy nanocomposite, a 36% improvement in σ
uts
was observed, while 0.1 wt.% CNT/epoxy showed a 34% improvement. Of the three replicates tested for each CN nanocomposite specimen, good repeatability in test data was observed with less than 2% variation, which can be inferred as an attribute of uniform nanofiller dispersion.
17
For 0.1 wt.% GNP/epoxy nanocomposite, a 30% enhancement in σ
uts
was observed, while 0.2 wt.% GNP/epoxy showed a 26.5% improvement in σ
uts
, relative to the neat epoxy samples. In the case of GNP/epoxy, it is quite likely that the percolation threshold is lower than 0.2 wt.%, and agglomeration effects become prevalent at higher GNP weight fractions.
74
Improvement in the tensile modulus also has been observed for all configurations compared to neat epoxy samples (See Figures 4(c) and (d)). For 0.2 wt.% CNT/epoxy nanocomposites, a 5.5% improvement, and for the 0.1 wt.% GNP/epoxy nanocomposites, a 6.4% improvement is observed. Failure strain improvement has also been observed for all configurations compared to neat epoxy samples (See Figure 4(e)). For 0.1 wt.% and 0.2 wt.% CNT/epoxy nanocomposites, approximately 5% improvement, and for 0.1 wt% GNP/epoxy nanocomposites, a 4% improvement is observed. This improvement in failure strength can be attributed to the distribution of CN in the epoxy matrix, enhancing the interfacial bonding. (a) Mean tensile strength with percentage error for all configurations, (b) Improvement in tensile strength for all configurations, (c) Mean tensile modulus with percentage error for all configurations, (d) Improvement in tensile modulus for all configurations, and (e) Mean failure strain data with percentage error for all configurations.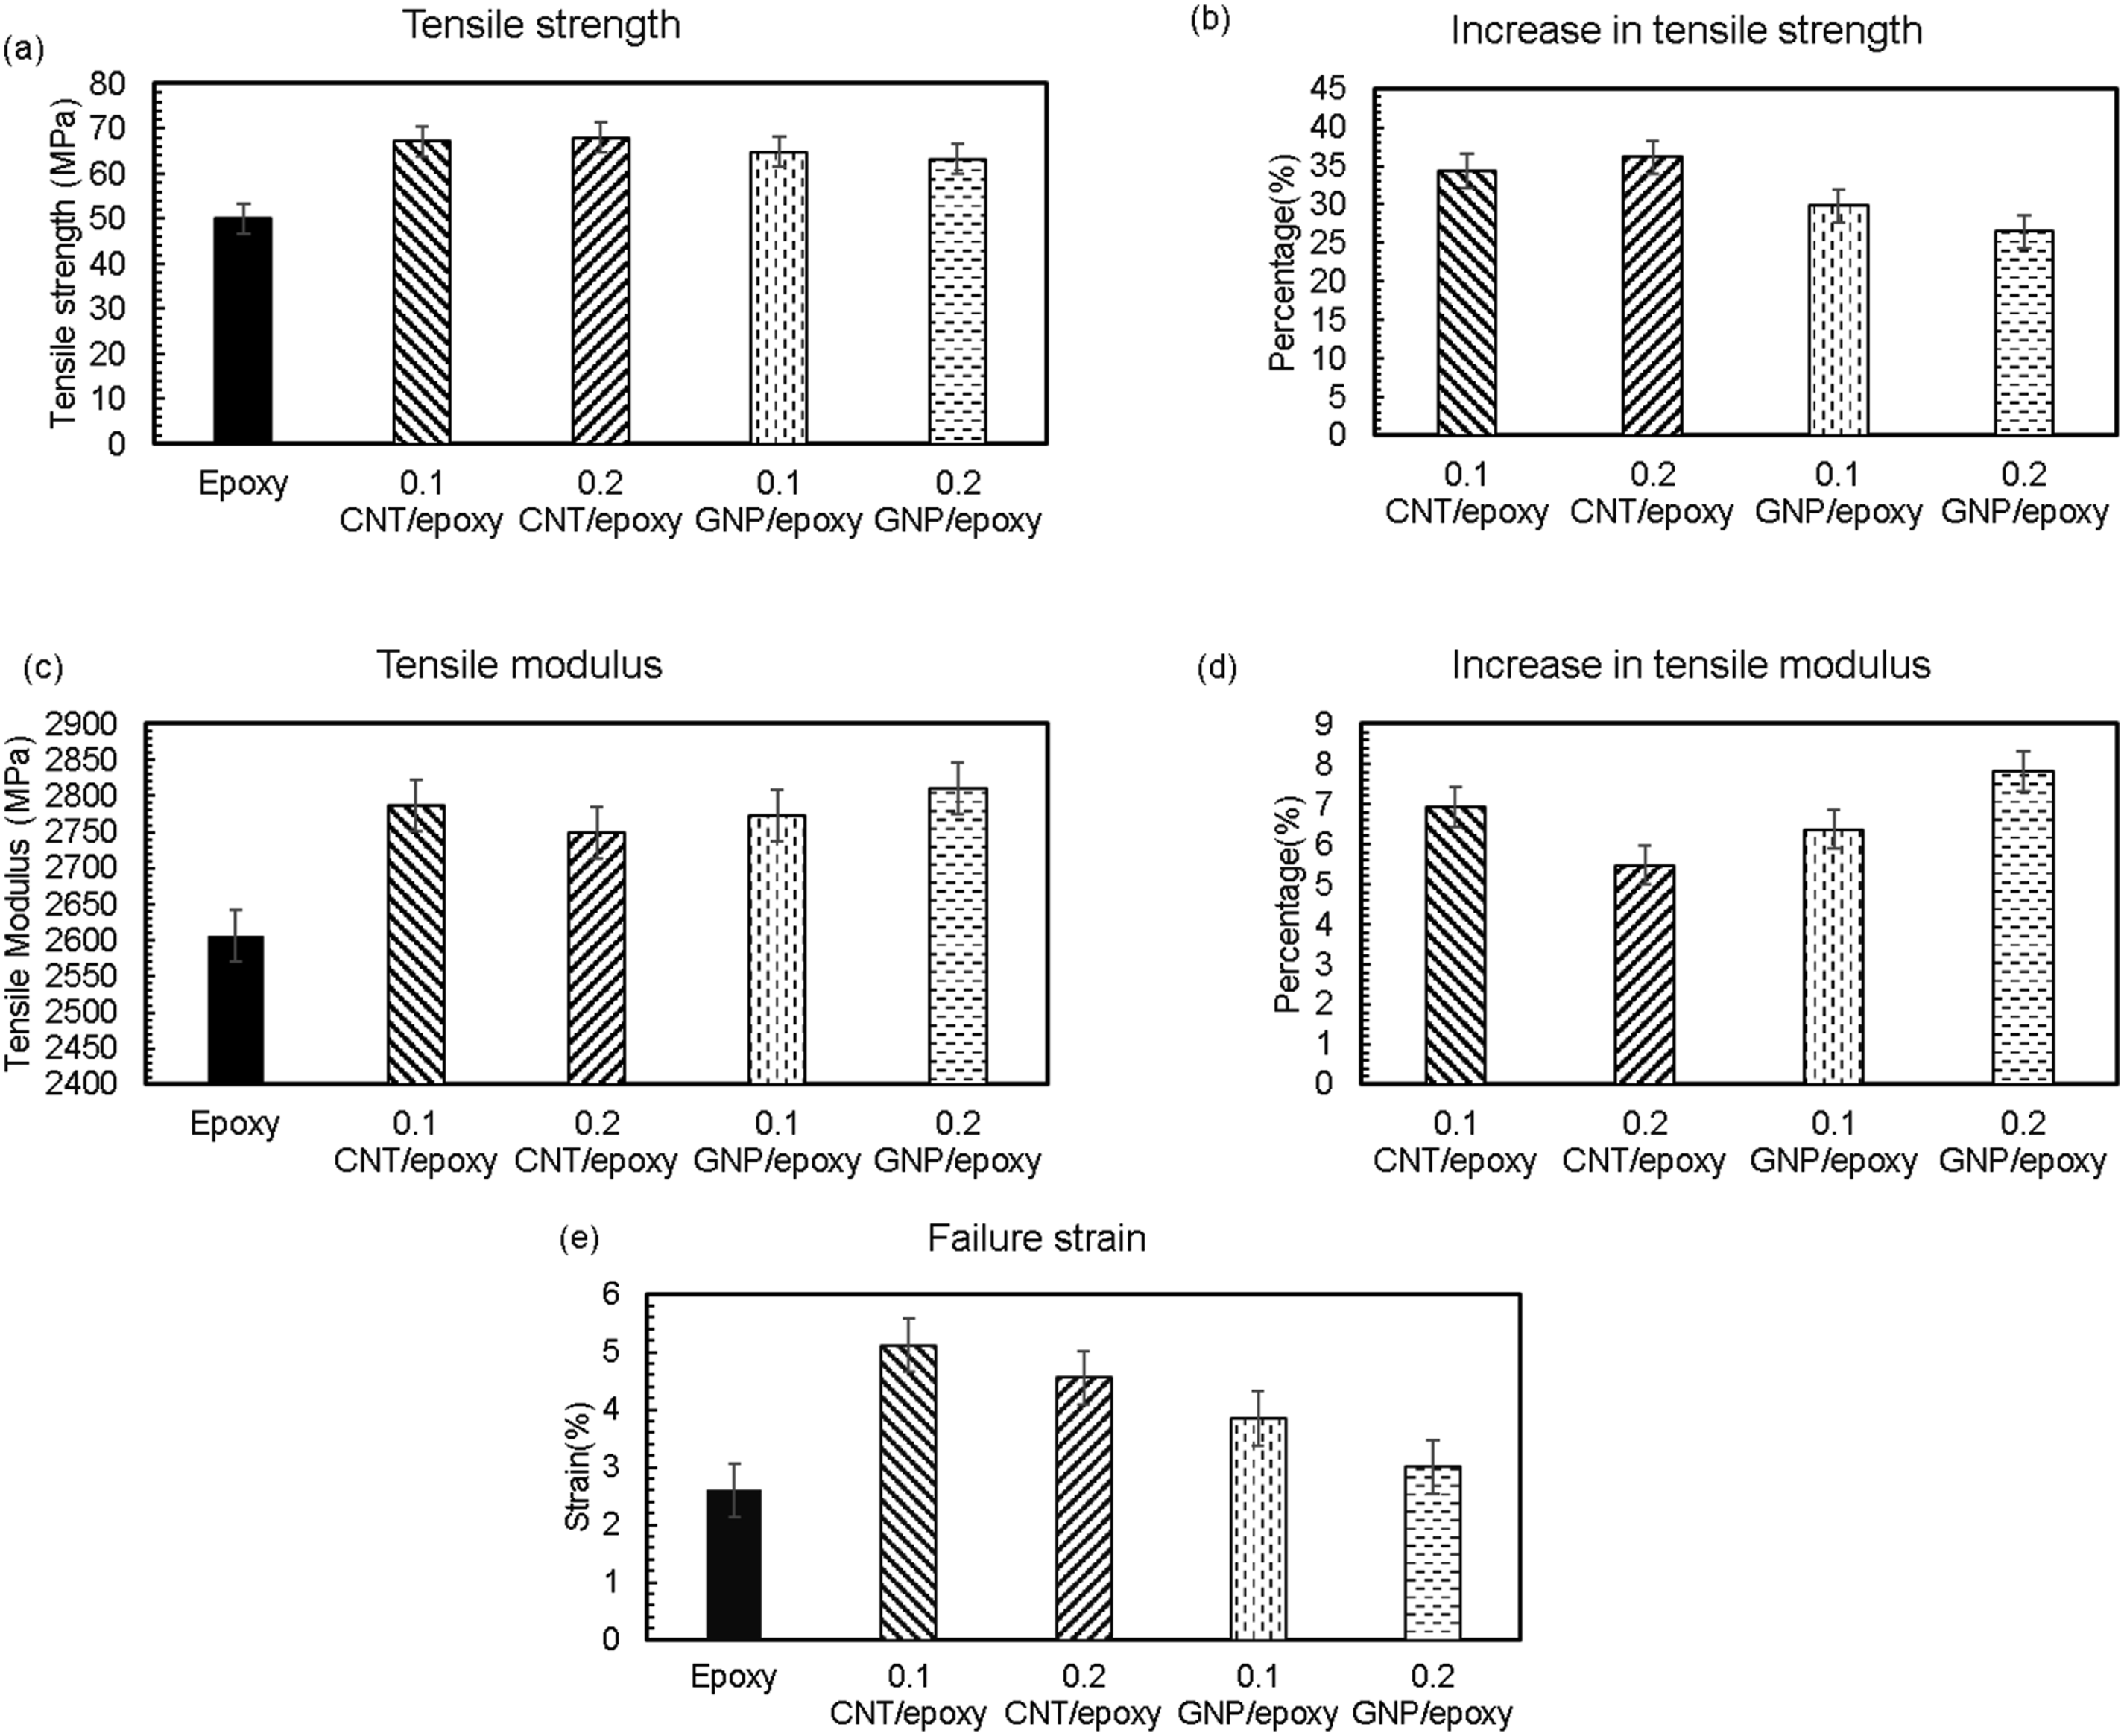
Cha et al. 32 reported that the presence of the amino group (-NH2) provides strong interaction for the covalent bond to the epoxy matrix, which helps the enhanced load transfer. This could also be anticipated as a reason for the observed improvement in tensile properties. These improvements demonstrate CN’s effectiveness in enhancing mechanical properties in epoxy-based nanocomposites.
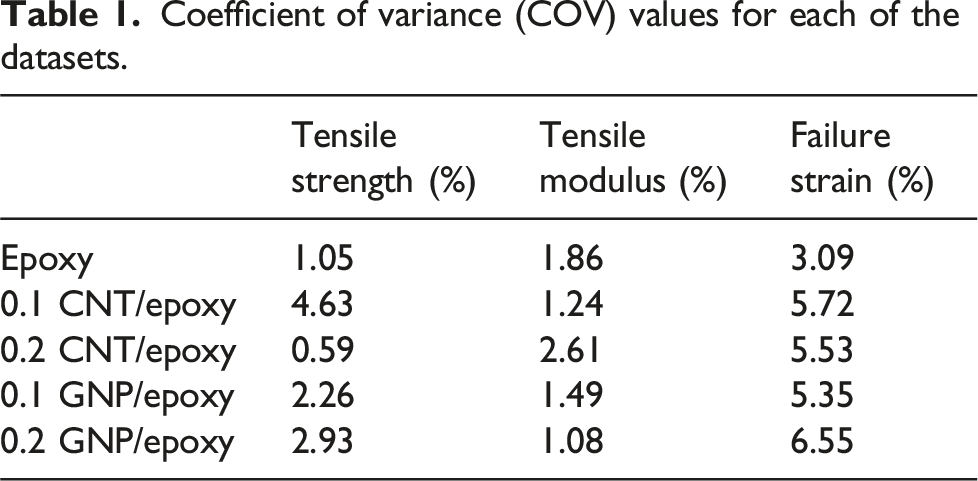
Coefficient of variance (COV) values for each of the datasets.
DSC analysis
Figure 5 shows the DSC curve (Heat flow vs temperature) for each sample, with positive values indicating endothermic and negative values exothermic processes. A notable endothermic peak at or around 388 K corresponds to the glass transition temperature (T
g
), consistent across all samples except for 0.2 wt.% CNT/epoxy where the endothermic peak can be seen around 410 K, suggesting the influence of CNTs on the epoxy matrix. Above 425 K, curves stabilize, with minor fluctuations possibly from thermal degradation. This analysis underscores CN’s effects on epoxy’s thermal behavior, showing modified curing dynamics while preserving T
g
. Also, DSC data has been used to calculate specific heat capacity (C
p
) and is presented in Table 2. C
p
was calculated using C
p
= Q/(m × ΔT) where Q is the heat, m is the mass, and ΔT is the change of temperature. For the determination of K
0
, C
p
at room temperature (299 K) was used. Table 2 shows that the C
p
value increases with the increasing weight fraction in both configurations compared to the neat epoxy sample. DSC curve (heat flow vs temperature) of the chosen material systems. Summary of K0 values using “Method 1.”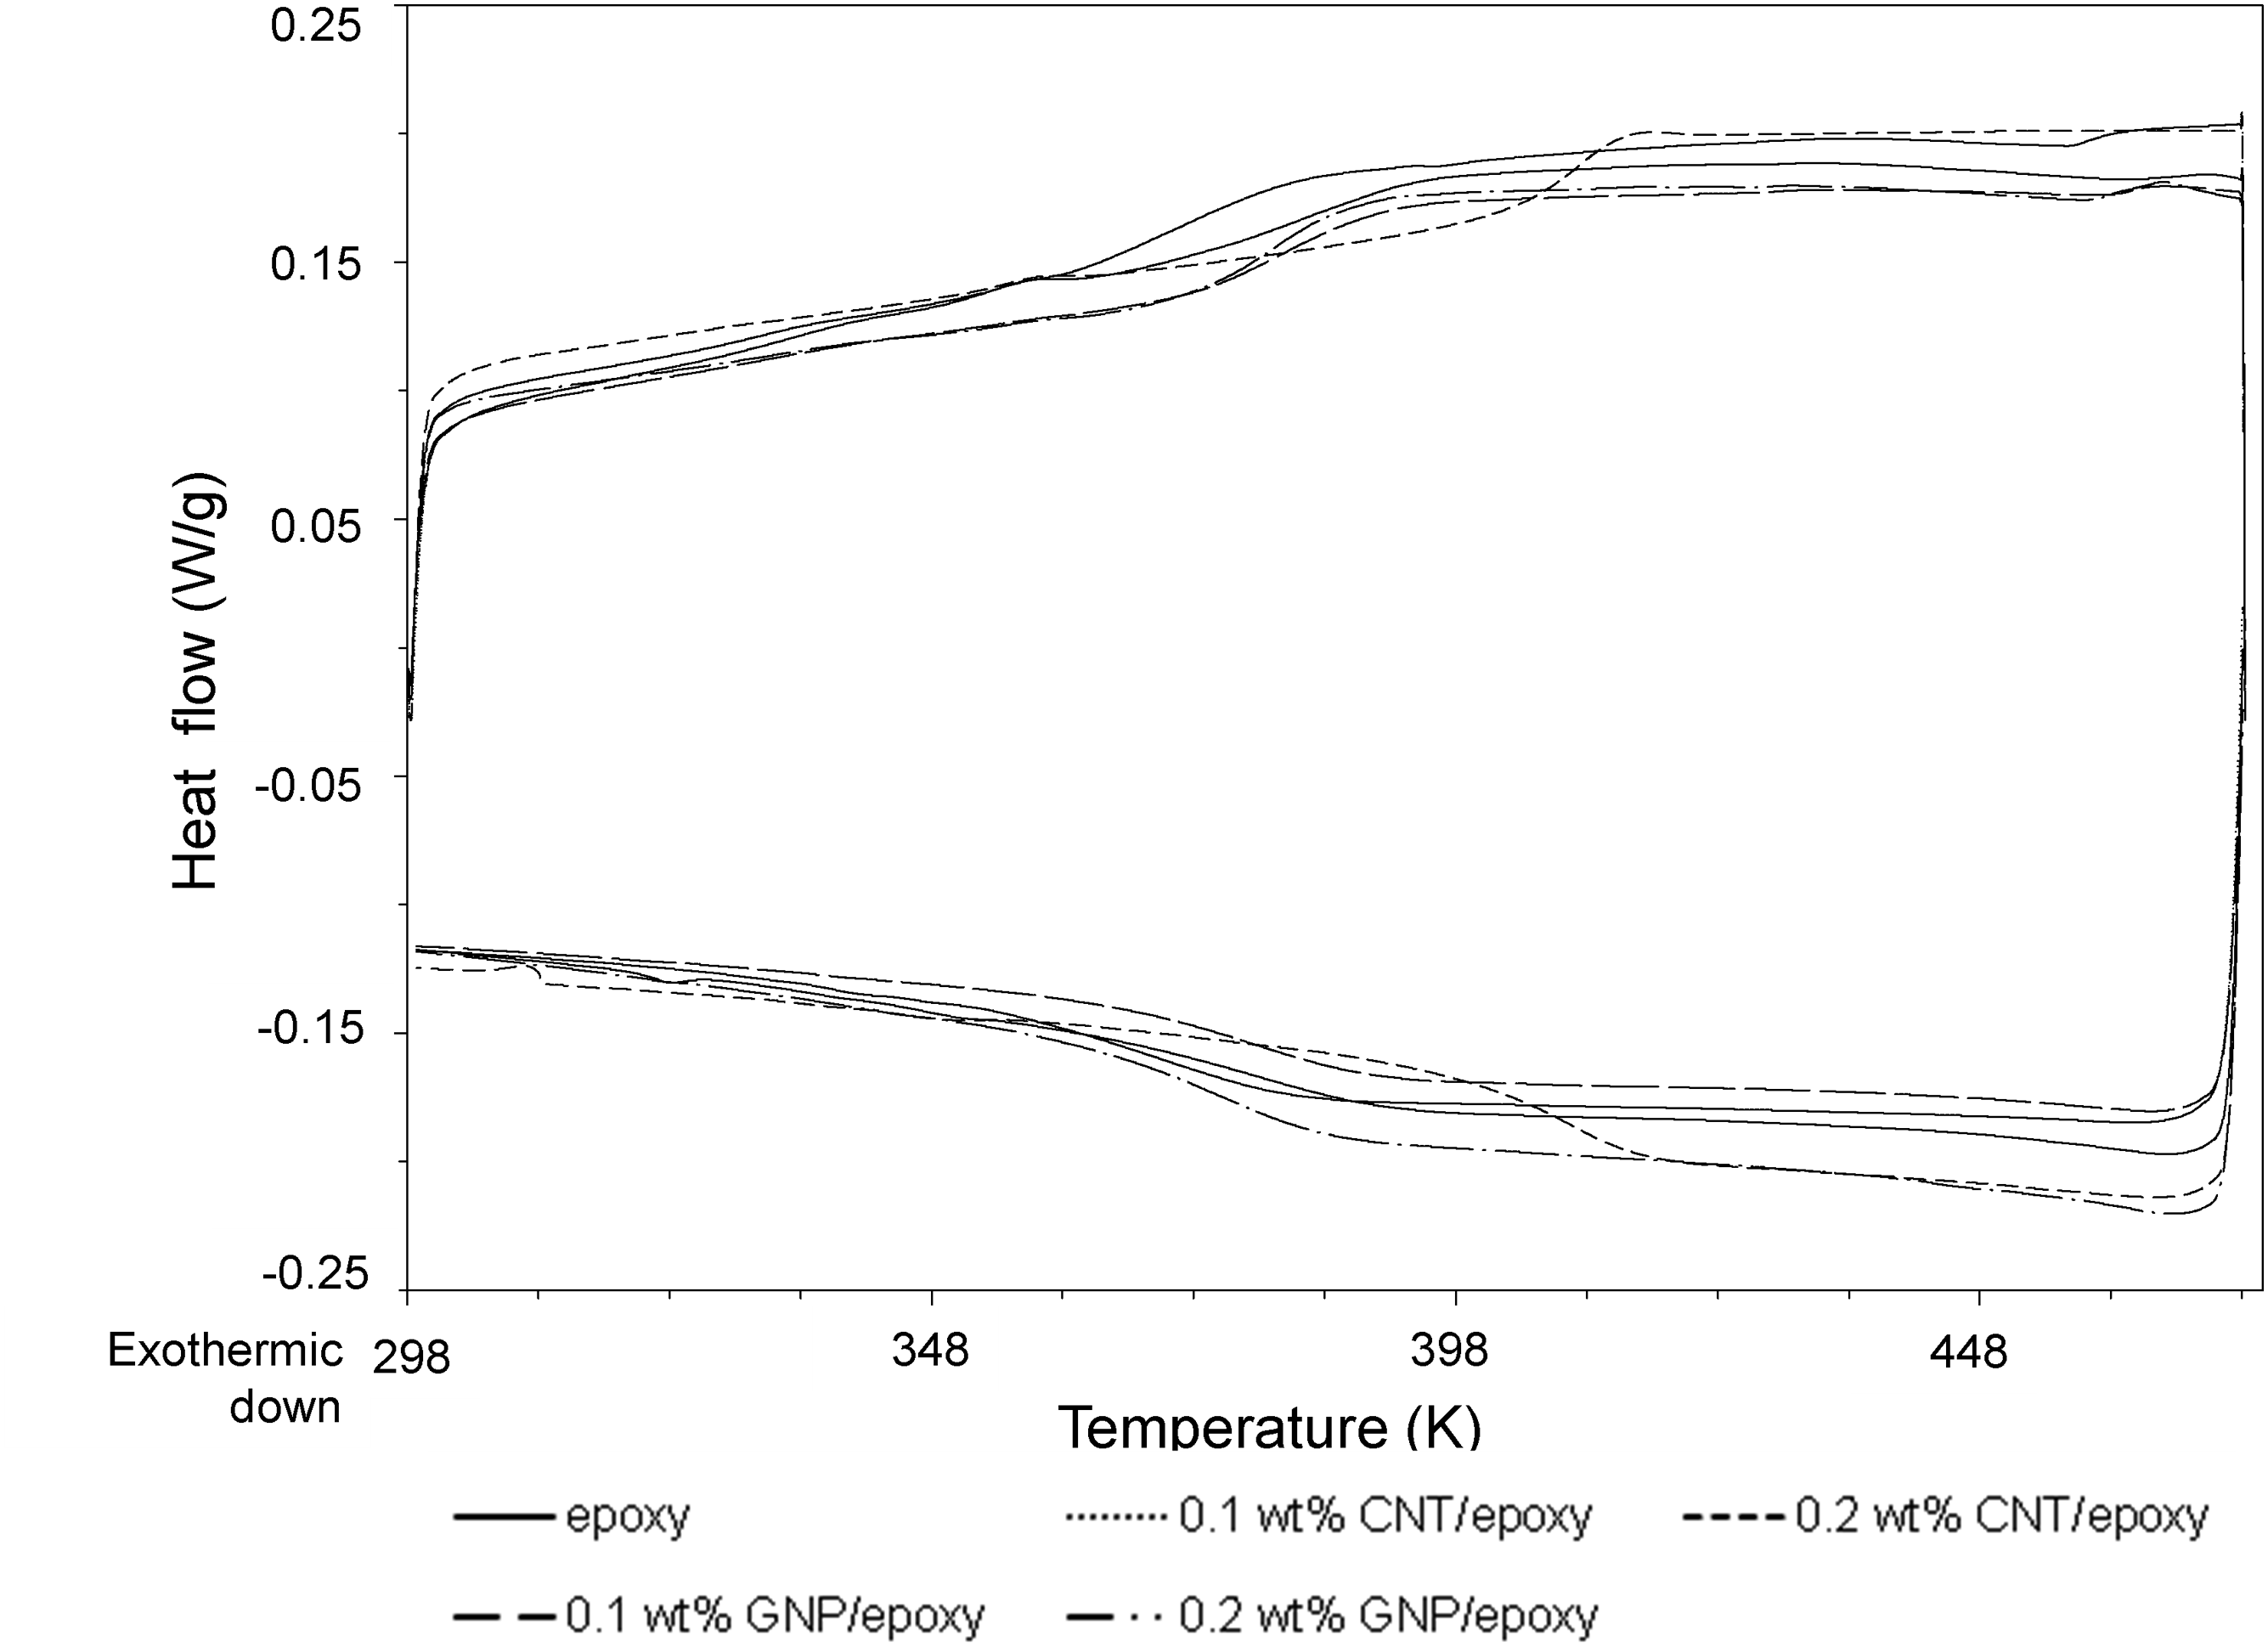
T
g
is another important property to be considered. Epoxy-based polymer composites usually remain in the glassy state in the room-temperature range due to the energy dissipation motion of polymer chains.
77
As it approaches T
g
, the polymers transition to the rubbery phase, rapidly decreasing the storage modulus.77,78 Figure 6 shows the glass transition temperature of each sample. Adding CNTs to the epoxy matrix may influence the polymer chain mobility and reduce flexibility, increasing T
g
.
79
While 0.1 wt.% CNT/epoxy shows very little variation in T
g
compared to pure epoxy, with 0.2 wt.% CNTs, the T
g
increases by over 26K. Jiang et al.
80
reported that the amino groups formed covalent bonds with epoxy groups, eventually affecting the epoxy chain’s mobility and the T
g
. Fiber composites exhibit modest T
g
gains; Warrier et al.
81
noted a 10K increase with CNT-sized UD-GFRP/epoxy driven by fiber-matrix interfacial interactions rather than fiber properties. Gojny et al.
82
reported an 11K increase of T
g
at 0.75 wt.% CNT/epoxy, attributed to interfacial interactions restricting polymer chain mobility. Similarly, Chandrasekaran et al.
83
observed a marginal T
g
rise with GNP/epoxy, linked to elevated cross-linking density in the thermoset matrix. Our study aligns with these trends, showing a T
g
increase at 0.2 wt.% CNT/epoxy and marginal rises at 0.1–0.2 wt.% GNP/epoxy. The restricted chain mobility and improved interfacial rigidity both contributed to the increased stiffness, thereby elevating T
g
and subsequently influencing the C
p
.
79
These changes directly influence the thermoelastic constant K
0
, which remains more thermally stable in the glassy regime. It is important to note that tensile testing is conducted at temperatures significantly below the T
g
, ensuring that the polymer matrix remains in the glassy state throughout the measurement. Glass transition temperature of the chosen material systems.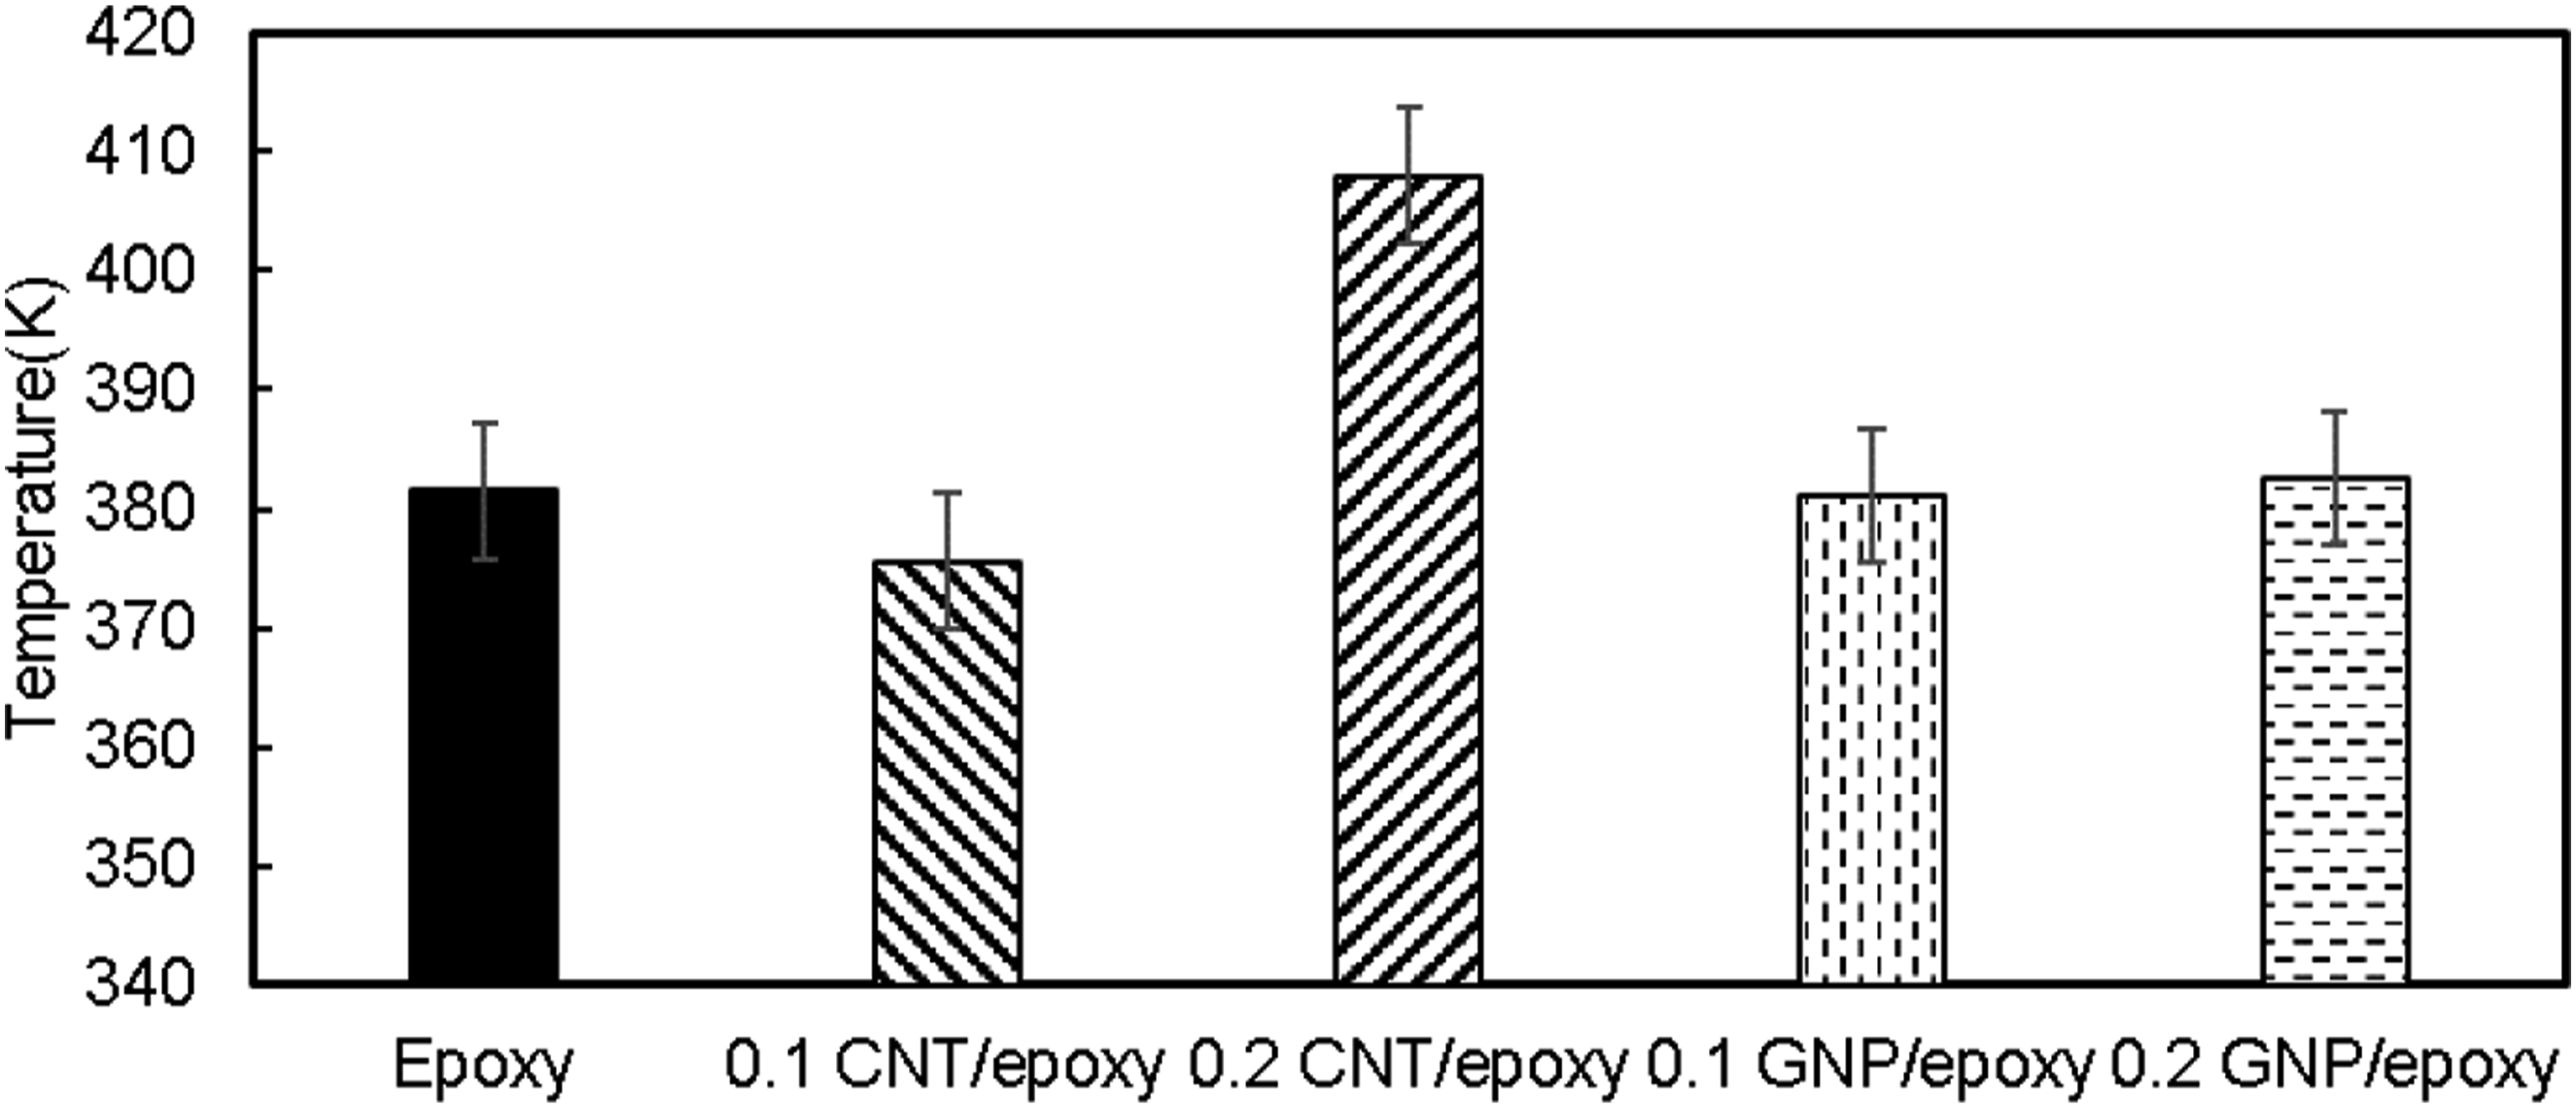
CTE determination
TMA was performed to evaluate the CTE of epoxy, CNT/epoxy, and GNP/epoxy composites by plotting sample length versus temperature. CTE values were calculated from the linear portion (323 K to 373 K) of the graphs below the T g . The data summarized in Table 2 shows that including CNT in the epoxy matrix increases its CTE while adding GNP decreases its CTE. The CTE, critical for dimensional stability, exhibits significant reductions in nanocomposites. Choi et al. 84 documented a 20% CTE decrease at 1 vol% CNT/epoxy in the glassy state, tied to particle size effects. Shokrieh et al. 85 reported a 20% reduction at 1 wt.% GNP/epoxy, due to GNP’s planar rigidity and interfacial contact. Fiber-reinforced composites also lower CTE, but their efficacy depends on fiber orientation and volume fraction. Fiber composites, like GF/epoxy, achieve a CTE of 11 × 10−6 K−1 parallel to fibers, 86 a reduction compared to neat epoxy, although these are higher in the perpendicular direction.
This study observed CTE reductions of 10–15% (GNP/epoxy) and 5% (0.1 wt.% CNT/epoxy). However, a 5% CTE increase at 0.2 wt.% CNT was observed, which suggests possible agglomeration effects.
Methodology of thermal analysis and thermoelastic constant determination
The surface temperatures during tensile testing were monitored through the static tests for all specimens. Simultaneously, an extensometer was used to measure the strains during tensile testing. The surface temperature of each sample was recorded at an acquisition frequency of 30 Hz at 132 × 512 pixels (spatial resolution of 0.2 mm/pixel). As mentioned earlier, all samples were painted matte black to avoid emissivity effects. Figure 7 displays images of samples taken at three different stages: 30% σ
uts
, 60% σ
uts
, and during failure using Reveal IR software. These images illustrate the representative evolution of surface temperature fields during static loading for each configuration. The temperature-time data from each sample up to elastic limit—acquired through the IRT setup—was employed to calculate the slope of temperature change versus stress, which forms the basis for determining the K
0
. Surface temperature evolution at 30% UTS, 60% UTS, and during failure (a) epoxy, (b) 0.1 CNT/epoxy, (c) 0.2 CNT/epoxy, (d) 0.1 GNP/epoxy, and (e) 0.2 GNP/epoxy.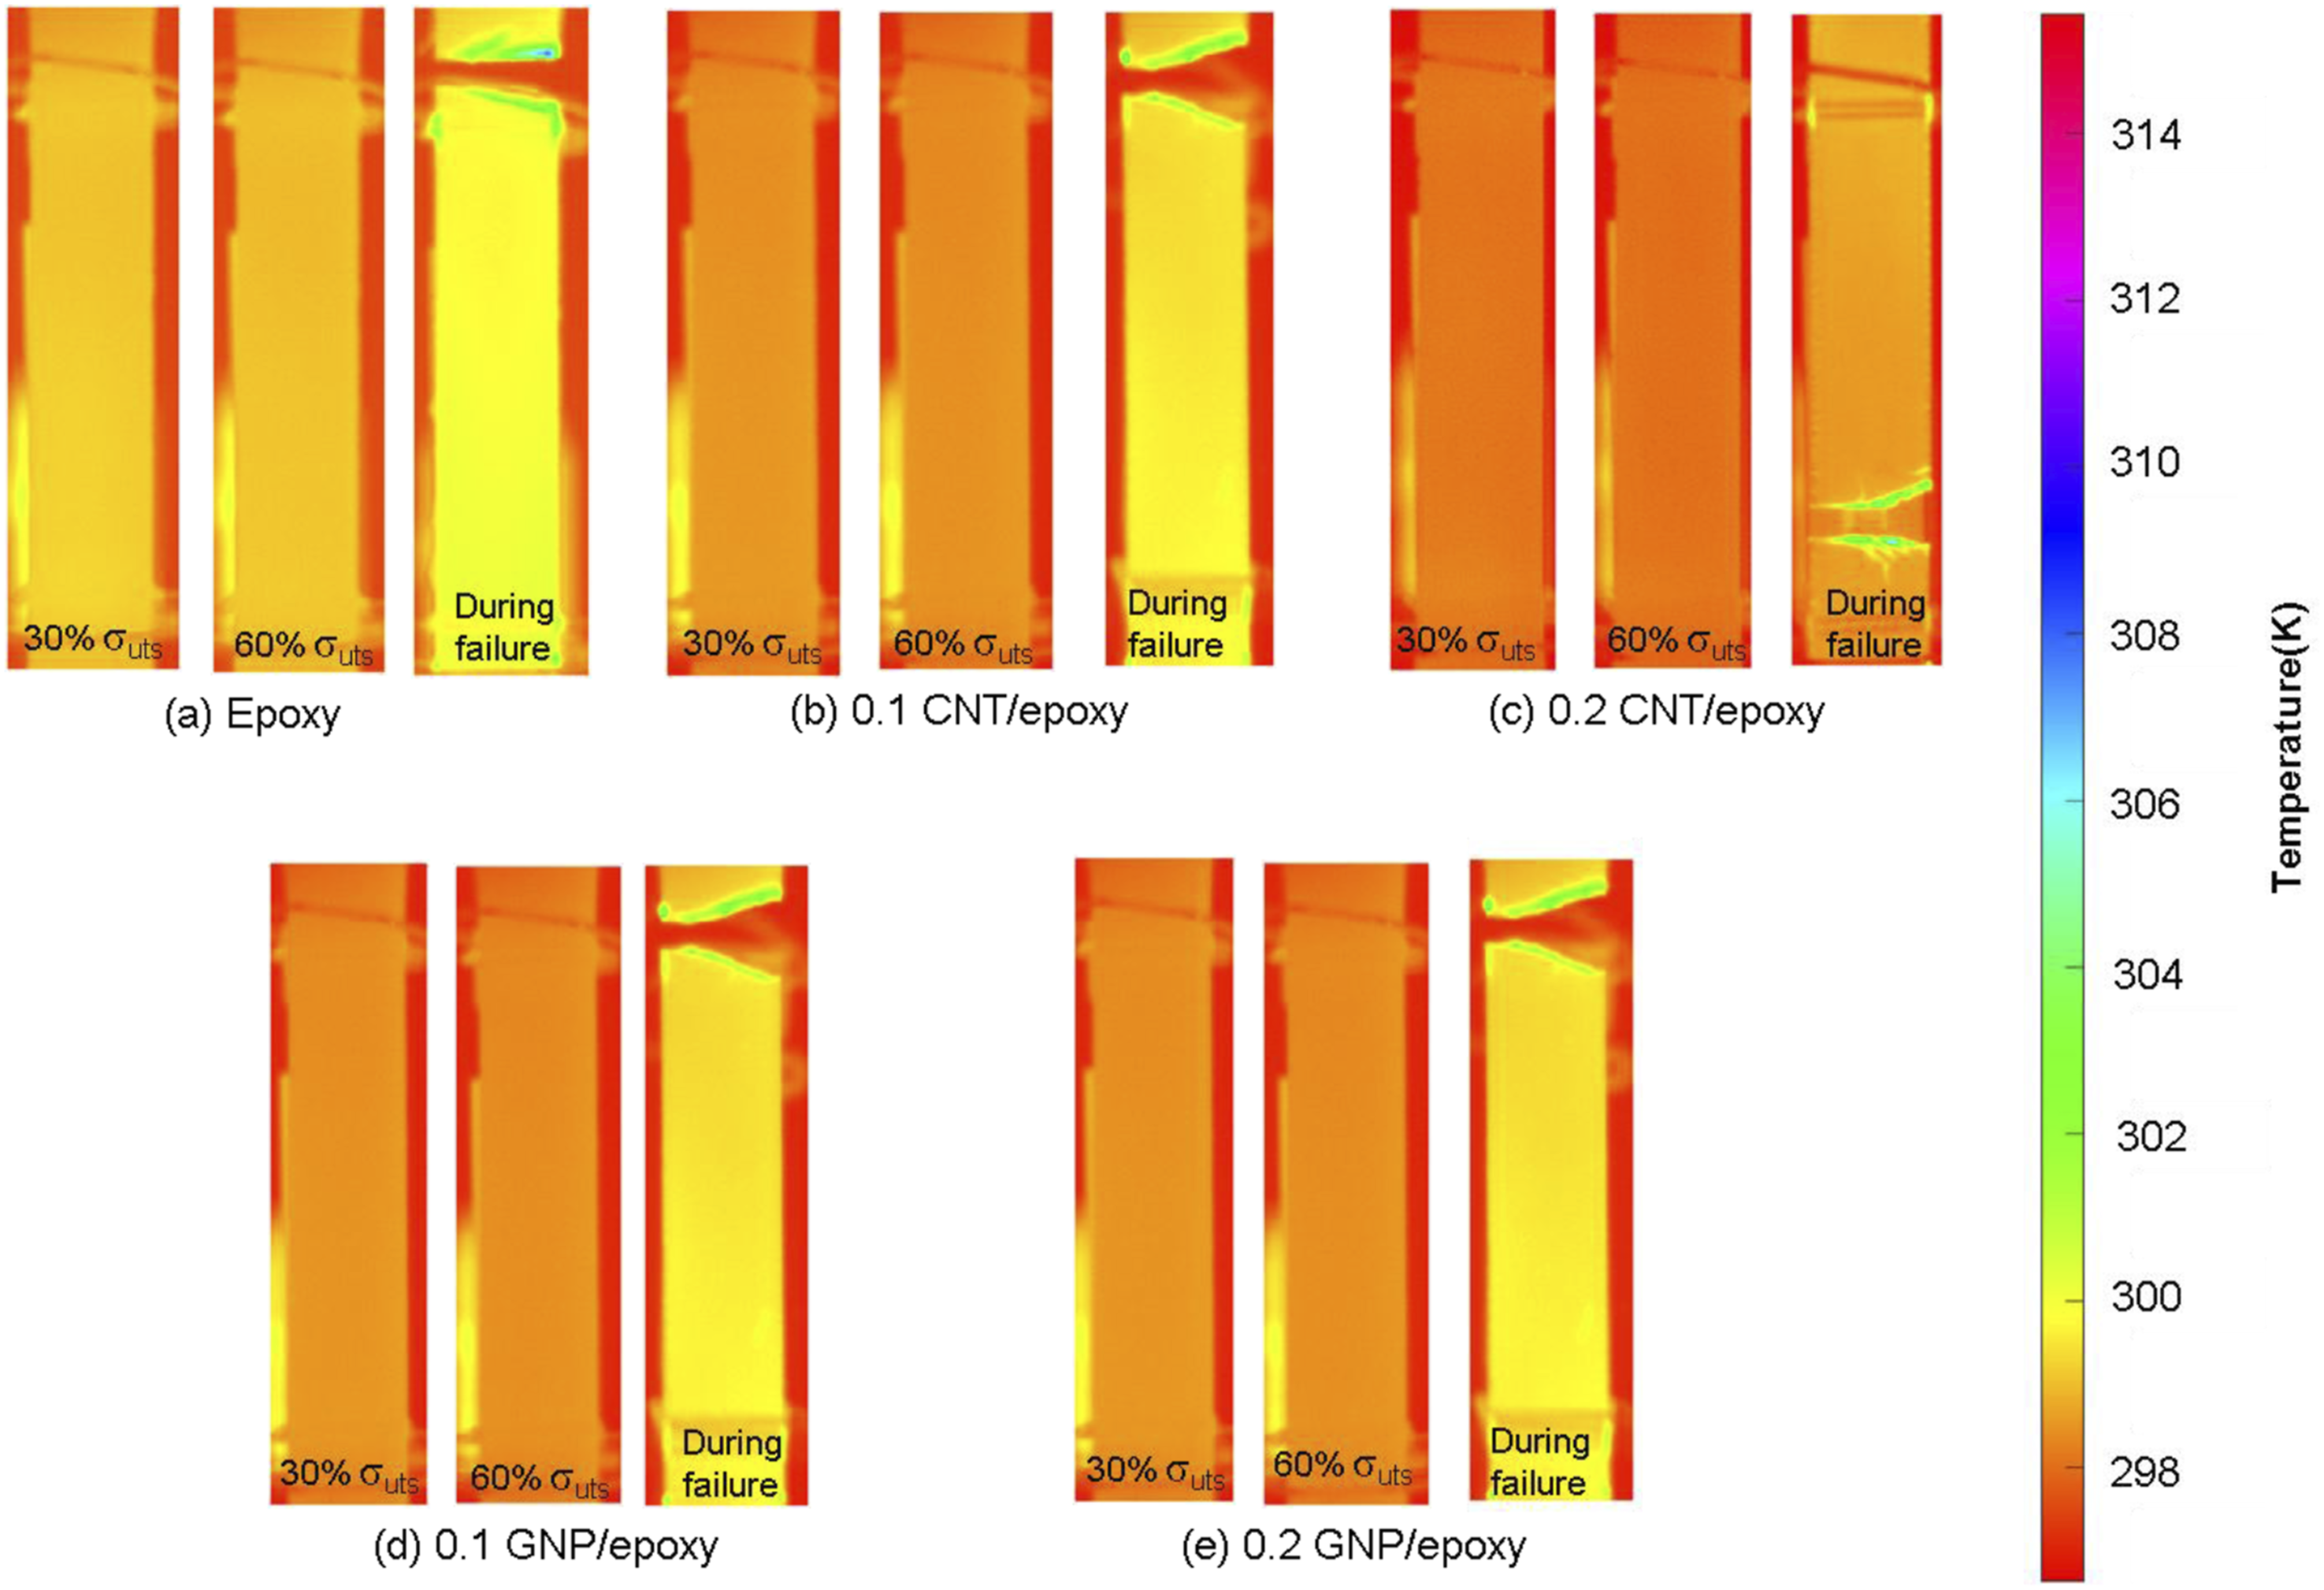
Similar to Figure 1, three distinct zones of temperature evolution were observed: a linear temperature decrease due to the thermoelastic effect (zone I), followed by a plateau in temperature (zone II).
49
This plateau region is often attributed to the onset of inelastic material behavior coupled with heat dissipation.
66
The material’s proportional limit can be determined when transitioning from zone I to zone II. Finally, there is a sudden temperature increase when the failure happens, as described in Zone III in Figure 1. The temperature increase during failure is also shown in Figure 7 for all the configurations.
66
The temperature increase was in the range of 0.56–0.78 K. In Reveal-IR software, a designated ROI shown in Figure 8 was selected (approximately 92 × 28 pixel area) and positioned around the zone where the specimen failure occurred. Gage length with failure zone also has been considered as another ROI. After taking the initial and final position of pixel, width, and height of that ROI, the data was analyzed using MATLAB. The mean temperature data of the chosen ROI was recorded during tensile testing. Selection of ROI for the analysis (showing failure).
The initial reference temperature (T0) was measured, and the subsequent temperature difference (ΔT) was monitored during uni-axial tensile testing. Then, stress and temperature difference (ΔT) data was graphed in Figure 9. In all cases, the same phenomena of decreasing temperature with increasing load already mentioned in the introduction and Figure 1 were observed. At the proportional limit, the rate of temperature change decreases, and the sample is found to emit heat due to inherent dissipative effects. To determine the K0, the proportional limit should be identified for each sample. To achieve this, a linear curve-fitting approach was employed. Data points corresponding to the temperature decrease were selected and used for linear fitting. Two lines were fitted using the MATLAB program. The intersection points of both fitted lines were determined (shown in Figure 9) to find the proportional limit. The proportional limit for each sample has been summarized in Table 2. From the fitted data, the slope (ΔT/Δσ) was determined and used to calculate the K0 graphically. The slope (ΔT/Δσ) and mean initial temperature (T
0
) were plugged into the following equation (2) generated from equation (1) to obtain the K
0
graphically Temperature variation with stress versus time graph (a) epoxy, (c) 0.1 CNT/epoxy, (e) 0.2 CNT/epoxy, (g) 0.1 GNP/epoxy, (i) 0.2 GNP/epoxy. Proportional limit and initial slope determination graph (b) epoxy, (d) 0.1 CNT/epoxy, (f) 0.2 CNT/epoxy, (h) 0.1 GNP/epoxy, and (j) 0.2 GNP/epoxy.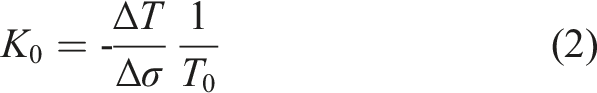
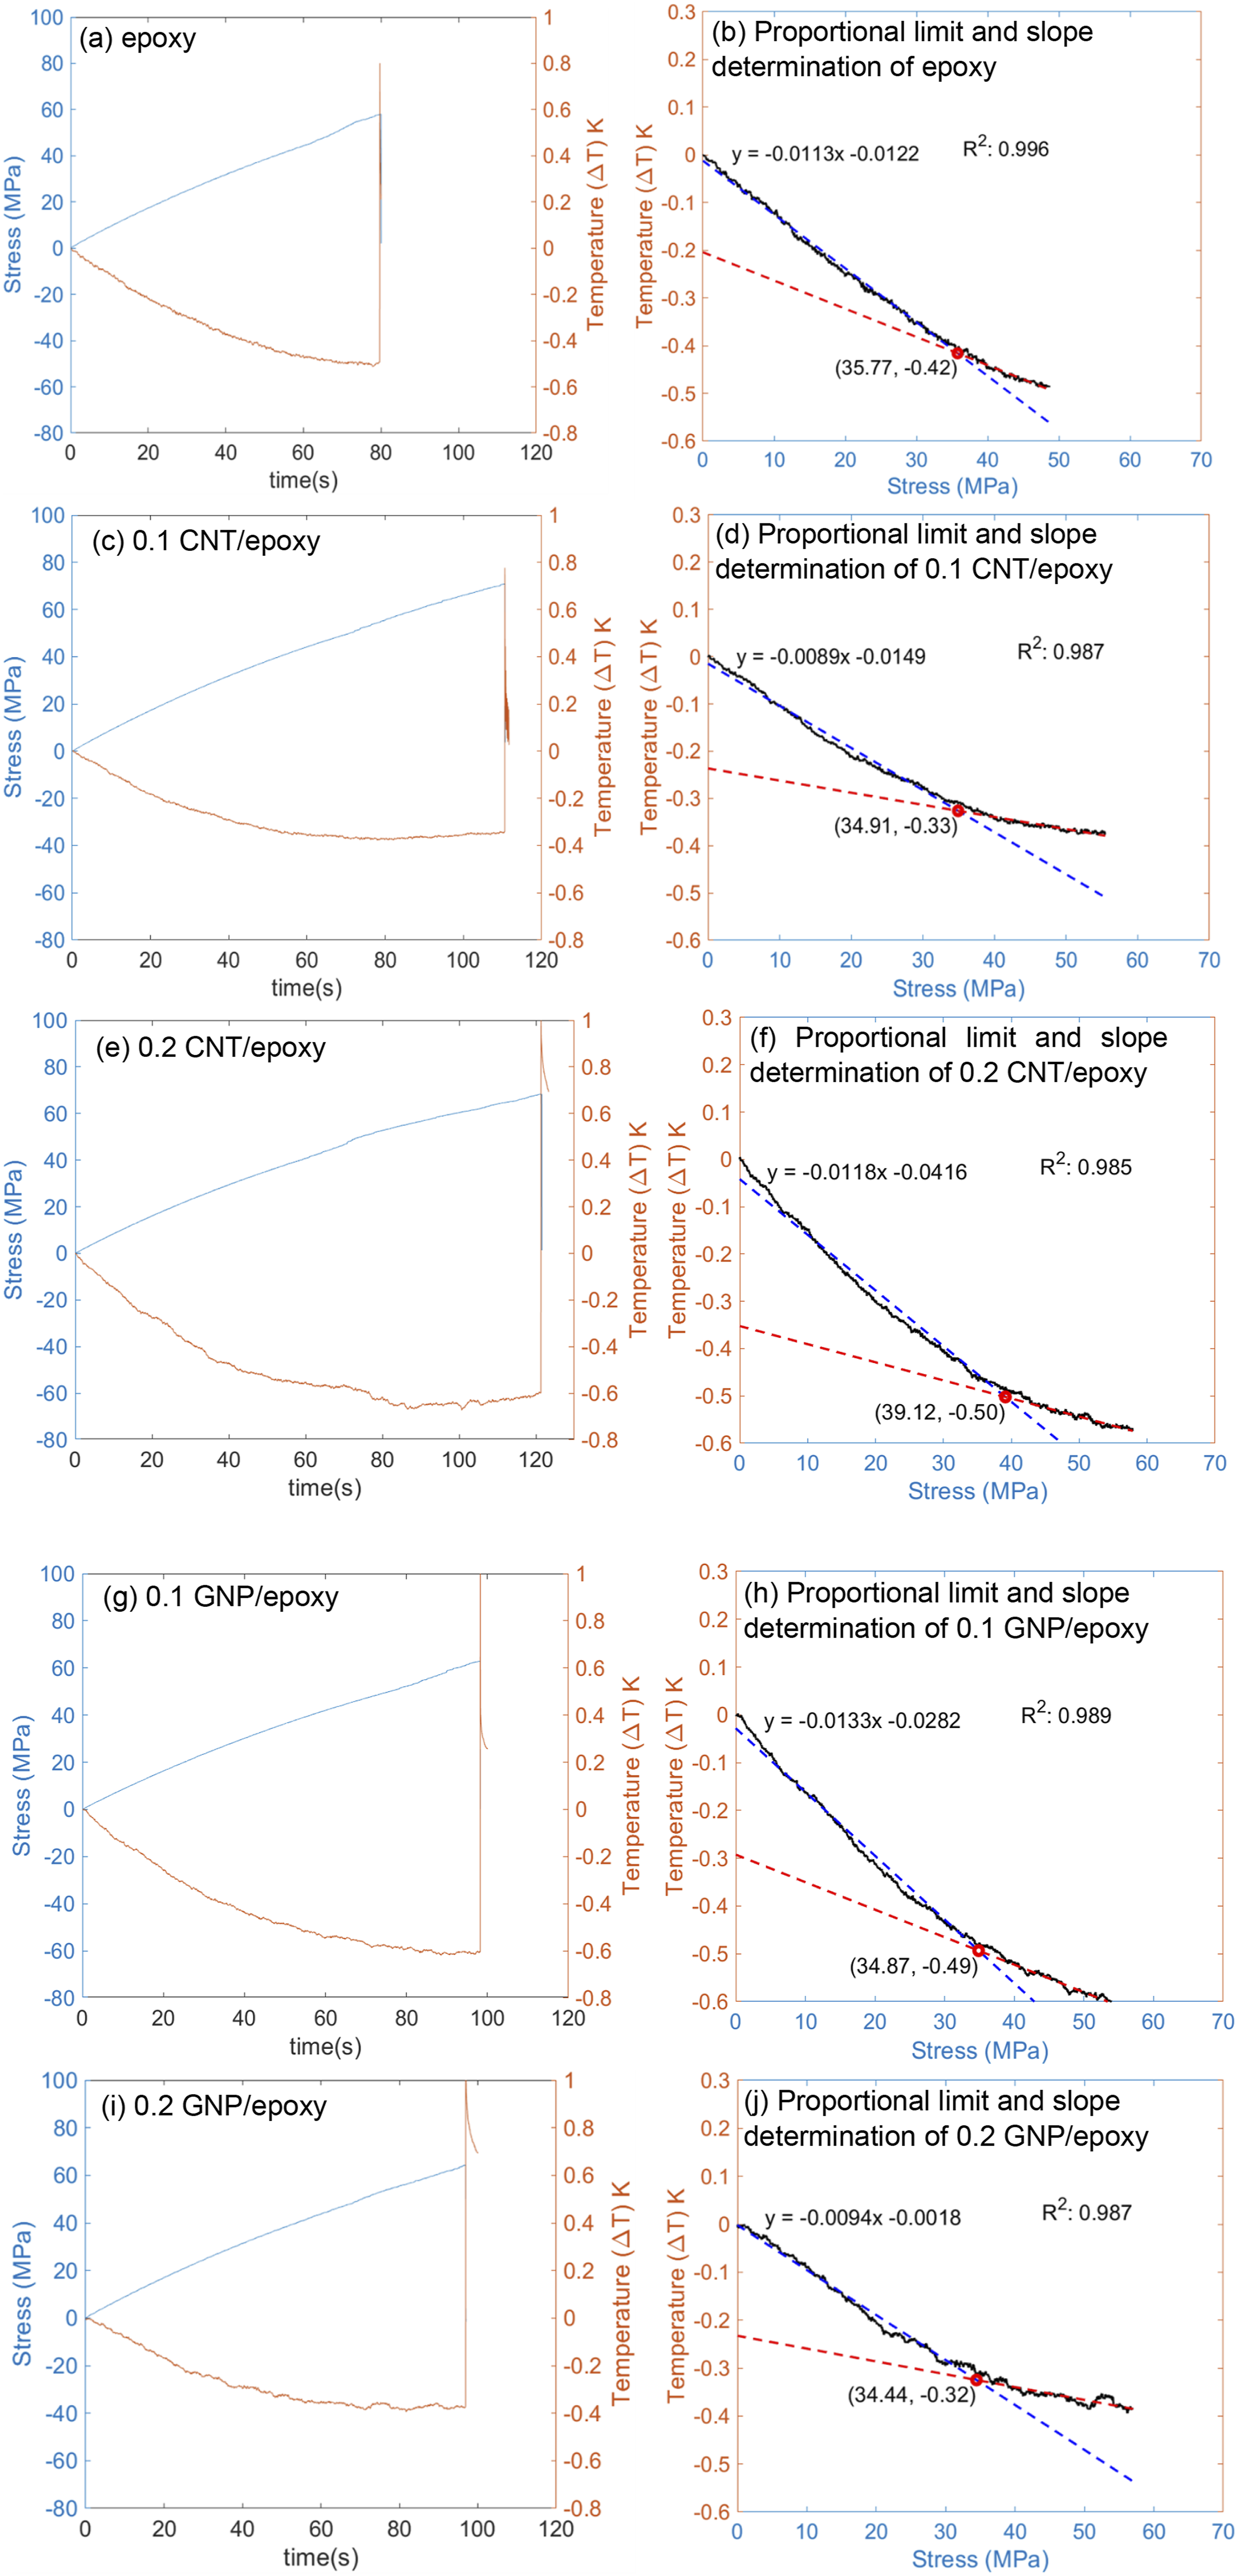
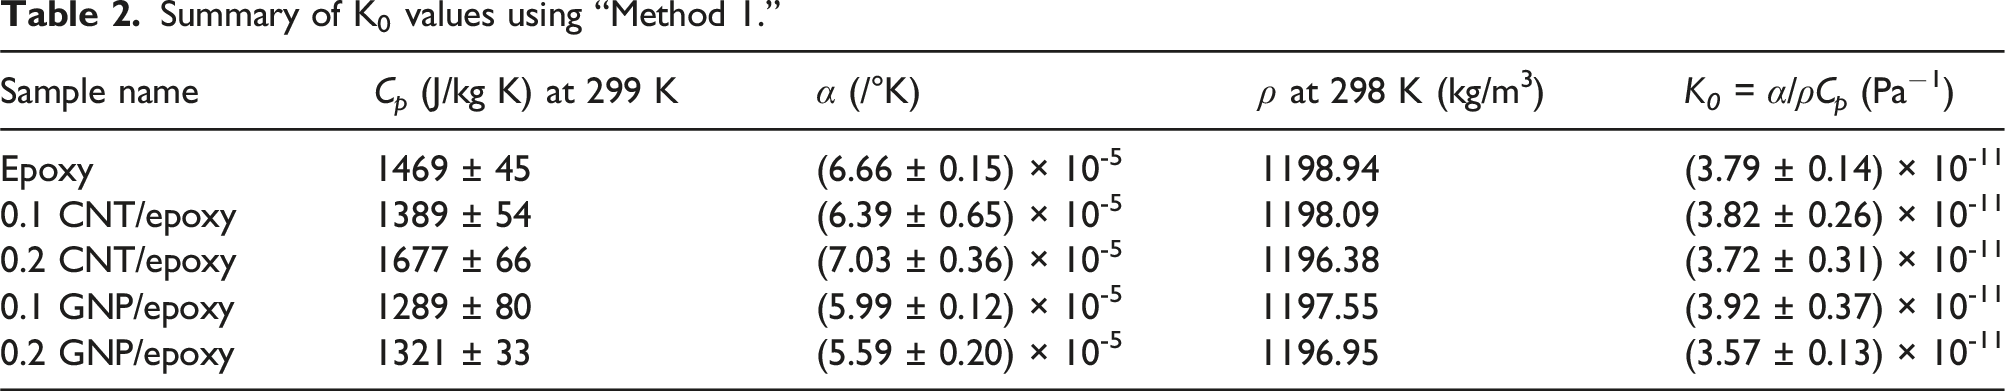
Table 2 summarizes the K 0 determined using (K0 = α/ρ C p ), referred to as “Method 1.” As mentioned, experimentally evaluated CTE (α) and the specific heat capacity (C P ) are used in this method. Density has been measured using a gas pycnometer (a volume-based density measurement tool).
Comparison of K0 values using “Method 1” and “Method 2.”
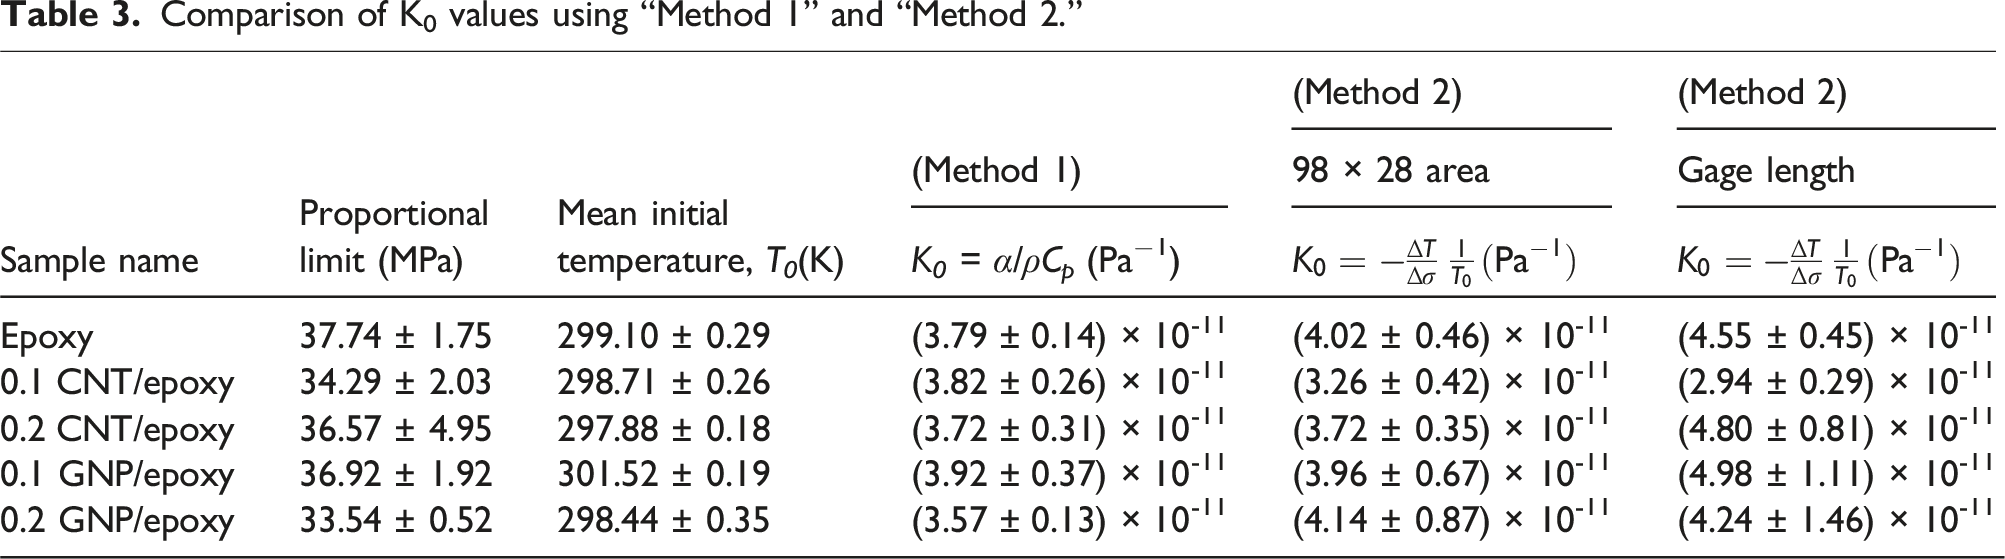
It should be noted that the results reported in Table 3 are the average of three samples tested under uniaxial loading and capture the material variability due to processing. Analysis of the obtained K0 values using “Method 2,” for 92 × 28 ROI reveals a clear trend: K0 increased with a higher concentration (0.2 wt.%) of CN compared to 0.1 wt.% samples of the same configuration. For CNT/epoxy samples, a significant increase in K0 can be observed from 0.1 wt.% CNT/epoxy to 0.2 wt.% CNT/epoxy samples obtained from TSA. Experimental investigations of CTE (α) also indicate a significant increase in α for 0.2 wt.% CNT/epoxy compared to 0.1 wt.% CNT/epoxy. GNP/epoxy specimens follow a similar trend, although the magnitude of increase in K0 is not as significant as CNT/epoxy specimens. It should also be noted that there is more scatter in the measurements for GNP/epoxy specimens than for CNT/epoxy specimens. However, the GNP/epoxy data exhibit greater scatter likely due to the challenges in achieving uniform dispersion of GNPs in the epoxy matrix.
For the gage length ROI, “Method 2” reveals an intriguing trend: K0 decreases with increasing GNP concentration, mirroring the behavior observed in “Method 1.” This consistent reduction suggests a strong correlation between nanofiller inclusion and thermomechanical properties across both methods. In contrast, CNT/epoxy samples exhibit a diverging trend in the gage length ROI. For instance, at 0.1 wt.% CNT/epoxy, the reduced K0 corresponds closely with a lowered T g relative to neat epoxy, indicative of agglomeration effects that compromise matrix-filler interactions. As the agglomeration sites are more prone to be the damage initiation points during testing, the thermal signatures might be influenced by these agglomeration sites affecting TSA assessment. These variations underscore the sensitivity of “Method 2” to the ROI selection, offering valuable insights into the behavior of epoxy nanocomposites.
Their distinct experimental foundation can rationalize the divergence between “Method 1” and “Method 2.” “Method 1” relies on measurements from small sample masses, which present significant challenges in sample preparation, particularly for epoxy nanocomposites with dispersed nanomaterials. Also, the efficacy of nanomaterial dispersion may be influenced by several factors, including the mixing speed, mixing propeller, the type of nanomaterial utilized (specifically MWCNT and GNP), and their respective concentrations have an effect on both methods. On the other hand, “Method 2” takes advantage of the initial slope of temperature-time curves derived from IRT plots, calculated with the equation of TSA. Maintaining adiabatic conditions during static testing poses a significant challenge, as deviations from ideal conditions can skew the results. Collectively, the complementary strengths of “Method 1” and “Method 2” are bridging microscale material properties with macroscale performance. “Method 2” offers a robust and efficient approach by leveraging macroscopic testing conditions to provide rapid insights, enabling comprehensive analysis of the sample in a streamlined manner.
Despite the constraints, TSA could serve as a rapid method for assessing the in situ microstructure. In short, a mapping between obtained K0 and concentration and possibly type of CN can be established that could be used to discern the nanocomposite composition. Thus, TSA can be adopted as a potential rapid microstructure discernment tool, reducing the need for time-consuming experiments.
Fractography
Figure 10 depicts the SEM micrographs of the fracture surfaces of neat epoxy, 0.1 wt.% CNT/epoxy, 0.2 wt.% CNT/epoxy, 0.1 wt.% GNP/epoxy, and 0.2 wt.% GNP/epoxy. Failed specimens of neat epoxy were presented in Figures 10(a) and (b). Figures 10(c)–(f) depict the failed specimens of CNT/epoxy nanocomposites, and Figures 10(g)–(j) refer to the GNP/epoxy nanocomposites. Failure surfaces for epoxy specimens in 10(a) and 10(b) are smooth compared to all other specimens, suggesting minimal resistance to crack propagation.
9
The inclusion of nanofillers increases the roughness of the surface, evident in Figures 10(c), (e), (g), and (i), where parallel features
87
are observed for all the samples. This parallel feature represents individual crack growth steps and suggests enhanced resistance to crack propagation due to the presence of CN. The presence of the CNT and GNP in the epoxy matrix is a barrier to crack propagation, and their resistance leads to greater energy dissipation.
9
This leads to the overall improvement in the tensile strength and failure strains compared to the neat epoxy specimen (see Figure 4). Figures 10(d) and (f) present highly magnified fracture surfaces of 0.1 CNT/epoxy and 0.2 CNT/Epoxy samples. CNT pullout from the epoxy matrix was apparent in both images, consistent with findings reported in previous studies.9,80 Similarly, a rougher surface is observed for GNP/epoxy samples in Figures 10(g) and (i). The tilting and twisting of the cracks are observed for both 0.1 and 0.2 wt.% GNP/epoxy samples. The rigid GNP, well bonded with the epoxy matrix, deflected cracks observed in the fracture surfaces presented in Figures 10(h) and (j). Interlayer delamination due to weak interlayer forces led to micro-cracks originating within the graphitic layers.
83
All these features collectively contributed to the significant enhancement in tensile strength and failure strains compared to the epoxy sample as discussed in an earlier section. Fractography using SEM (a and b)-epoxy; (c and d)-0.1 wt% CNT/epoxy; (e and f)-0.2 wt% CNT/epoxy; (g and h)-0.1 wt% GNP/epoxy; (i and j)-0.2 wt% GNP/epoxy.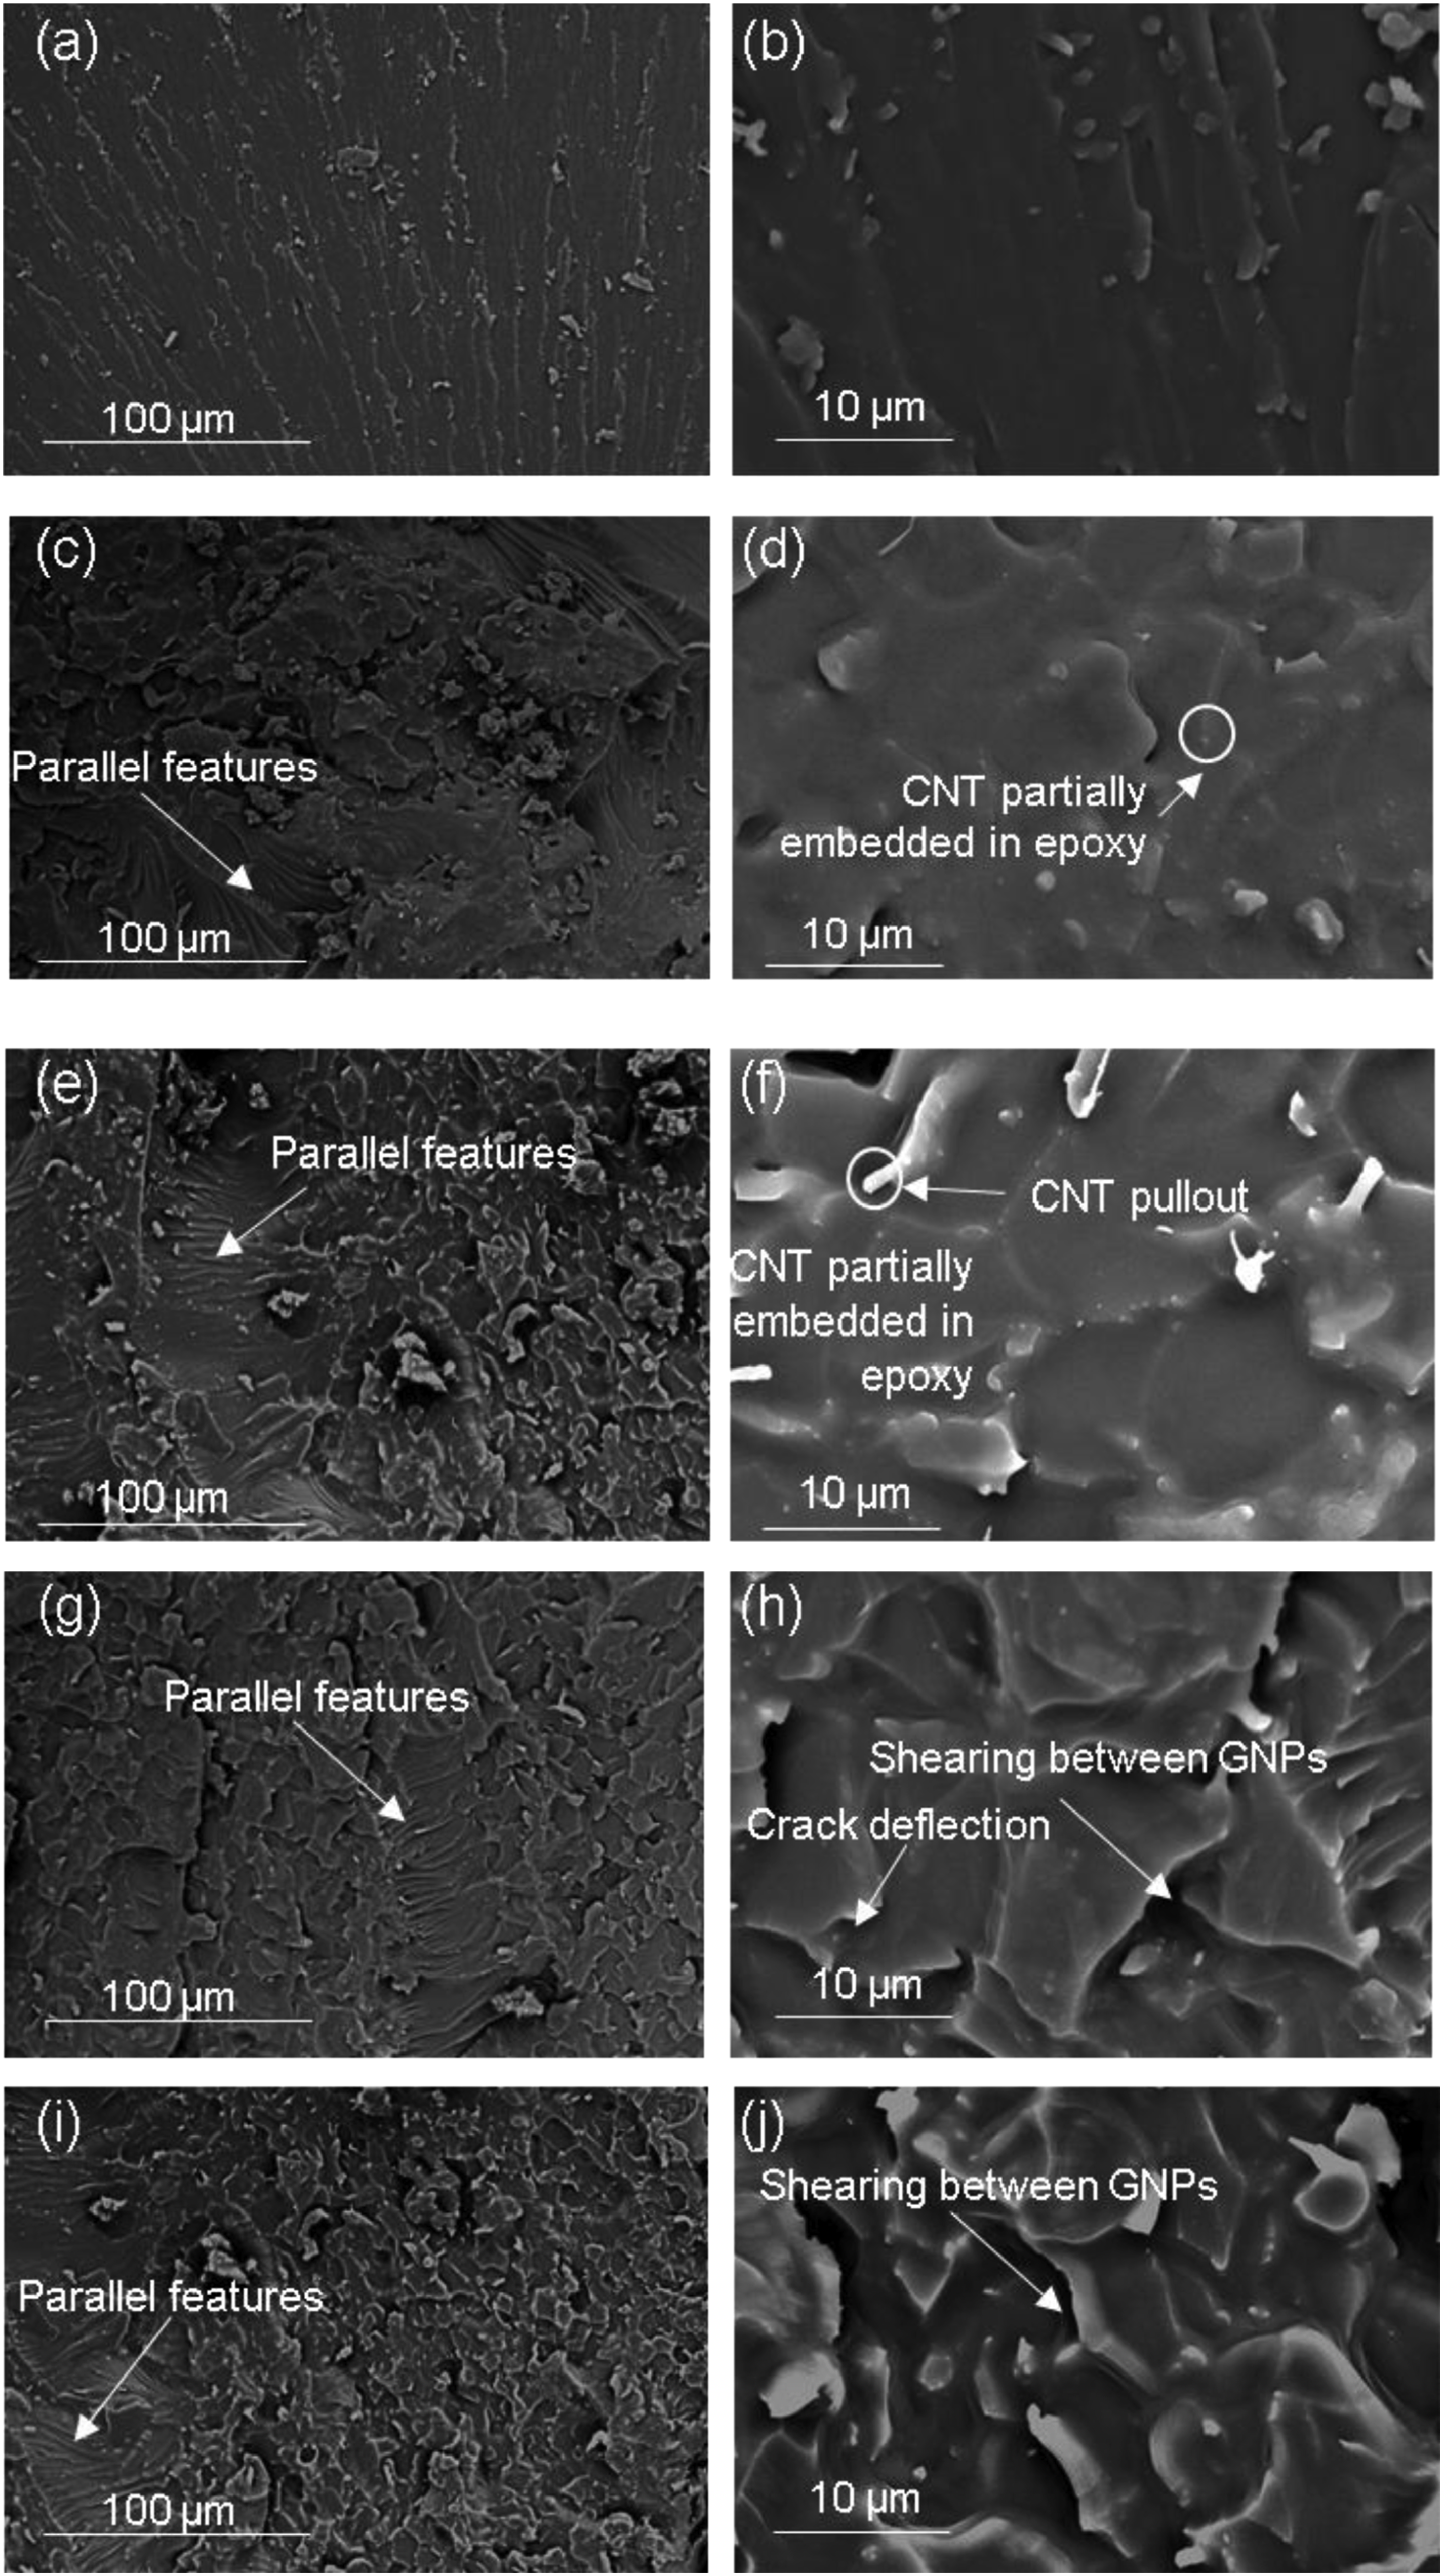
Conclusions and future work
IRT-based TSA approach for determining thermoelastic constant has been presented for epoxy, CNT/epoxy, and GNP/epoxy nanocomposite. The graphically (Method 2) obtained K0 has been compared with experimentally (Method 1) determined K0. The following conclusions can be drawn: • Incorporating 0.1 and 0.2 wt.% CNT into the epoxy matrix resulted in significant enhancements in both tensile strength and failure strains compared to the base epoxy. Additionally, the CNT/epoxy composites exhibited a notable increase in the T
g
and a reduction in the CTE. • The addition of 0.1 and 0.2 wt.% GNP to the epoxy matrix also led to improvements in tensile strength and failure strains relative to the neat epoxy. • K0 determined graphically (Method 2) using the IRT approach can be proposed as a rapid assessment tool for evaluating microstructure. This method offers a quicker alternative to conventional NDT as it relies on surface temperature measurements during static testing. In our experiments, graphical K0 was within 1% of the theoretically measured K0 for 0.2 CNT/epoxy and for 0.1 GNP/epoxy samples. • The DSC results provided an essential thermophysical parameter (namely C
p
), while TMA measurements yielded the CTE (α), both were directly utilized to experimentally calculate the value of K0. The K0 value obtained from the IRT-based TSA approach (Method 2) exhibits agreement with the experimentally determined K0 (Method 1), which was derived using measured thermophysical properties. This concordance substantiates the validity of the proposed microstructural assessment framework. • This study enhances IRT and TSA by predicting K0 through initial temperature slope analysis under static load. Unlike localized techniques such as TEM, AFM, SEM, or Raman spectroscopy, which excel in surface topography, morphology, or chemical analysis but face size constraints, this non-invasive TSA based approach captures dynamic thermal-stress interactions across entire components. • SEM microscopy showed crack deflection in GNP/Epoxy samples, and CNT pullouts in CNT/Epoxy samples contributed to the improvement in the tensile strength and toughening mechanism. The rougher surface signifies added energy dissipation compared to the epoxy sample during fracture. • Regarding the quality control process of nanocomposites, the presence of agglomeration in the mixture or the alignment of nanomaterials in a certain direction will lead to different values in the initial slope. To verify that, our future work involves extending this proposed method with improved mixing protocol to assess random and aligned CNT, GNP in the epoxy matrix to investigate the effect on the K0. • The results presented in this work are expected to provide a basis for mapping the nanocomposite microstructural characteristics—volume fractions, dispersion, and alignment/size/shape—with the K0. This mapping would assess the inherent microstructure under in-service loads that large-scale structures witness. • The proposed approach of predicting K0 based on the initial slope using IRT and TSA enables large-scale material characterization of nanomaterial-infused composite structures.
Footnotes
Author contributions
Julkarnyne Rahman: Conceptualization, methodology, validation, investigation, and writing—original draft. Virginia Davis: Funding acquisition and writing—review and editing. Suhasini Gururaja: Conceptualization, funding acquisition, supervision, and writing—review and editing.
Declaration of conflicting interests
The author(s) declared no potential conflicts of interest with respect to the research, authorship, and/or publication of this article.
Funding
The author(s) disclosed receipt of the following financial support for the research, authorship, and/or publication of this article: The authors acknowledge the support rendered by Auburn University through the Intramural Research Support Program.
Data Availability Statement
Data will be made available on request.