
Abstract
Accurately predicting the fatigue life of laminated structures remains challenging, given the wide range of fiber and matrix types, lay-up sequences, and stress ratios. This paper proposes an optimal small-sample fatigue testing strategy based on a unified S–N curve model spanning LCF, HCF, and UHCF fatigue regions. This strategy eliminates the need for segmented fitting, reduces the number of parameters to be identified, and thereby minimizes the need for extensive fatigue testing. Based on the amount of available test data, four S-N curve models with two, three, or four parameters are developed, which each parameter reflects a clear physical meaning in relation to the fatigue strength. Experimental generalization capability validation on various laminate materials and stacking sequences as well as loading conditions demonstrates strong correlation (R2 > 0.93). Moreover, the number of fatigue tests was reduced 40%, while maintaining a 95% confidence interval for a GFRP example. The proposed models support engineers in quickly and accurately obtaining material-level S-N curves, thereby finding practical application in material and layup comparison at the conceptual design stage and serving as input for detailed finite element simulations of FRP structures in aerospace and automotive industries.
Keywords
Highlights
(1) Construct a unified S-N curve model for full range fatigue life. (2) Propose an optimal design scheme of small-sample fatigue testing. (3) Reveal the relationship of parameters with the fatigue resistance of laminates.
Introduction
In industries like automotive, aerospace, and wind energy, fiber-reinforced plastics (FRP)1,2 are increasingly replacing metals in lightweight structural applications due to their high “specific strength” and “specific stiffness,” strong designability, and excellent fatigue resistance. The prior acquisition of material-level S-N curves of various laminates is the foundation for the conceptual design of fatigue resistant laminated structures, including material selection, fiber orientation determination, and stacking sequence arrangement, as well as for subsequent detailed fatigue life evaluation of composite structures via finite element simulation under cyclic loading conditions.
The characterization of composite fatigue behavior poses significant challenges due to time-consuming test cycles, high costs, and substantial data scatter stemming from material anisotropy and interface effects.3,4 These constraints render the acquisition of sufficient experimental data difficult, especially as small sample sizes and inherent variability often fail to accurately represent the true fatigue life of laminates. 5 Although combining quasi-static strength tests with limited fatigue data is a common practice, 6 determining the minimum number of tests required for reliable life prediction remains unresolved. Current small-sample methodologies exhibit clear limitations: statistical techniques produce wide confidence intervals with high uncertainty in data-scarce conditions, while machine learning methods are prone to overfitting and demonstrate poor generalizability, their performance being highly sensitive to the chosen evaluation strategy. Consequently, the development of fatigue life prediction methods that combine high accuracy with robust physical interpretability under small-sample conditions is crucial to enhance testing efficiency, lower costs, and enable reliable engineering applications.
The S-N curve is an empirical model used in composite fatigue research to describe the relationship between cyclic loading and fatigue life, allowing for the rapid prediction of structural fatigue performance.7,8 S-N curve models are generally classified as either segmented9,10 or unified models,
11
both cover the low-cycle fatigue (LCF) at high stress level (HSL), high-cycle fatigue (HCF) at low stress level (LSL), and ultra-high-cycle fatigue (UHCF) regions,12–14 as shown in Figure 1. Fatigue life S-N curve of composite laminates.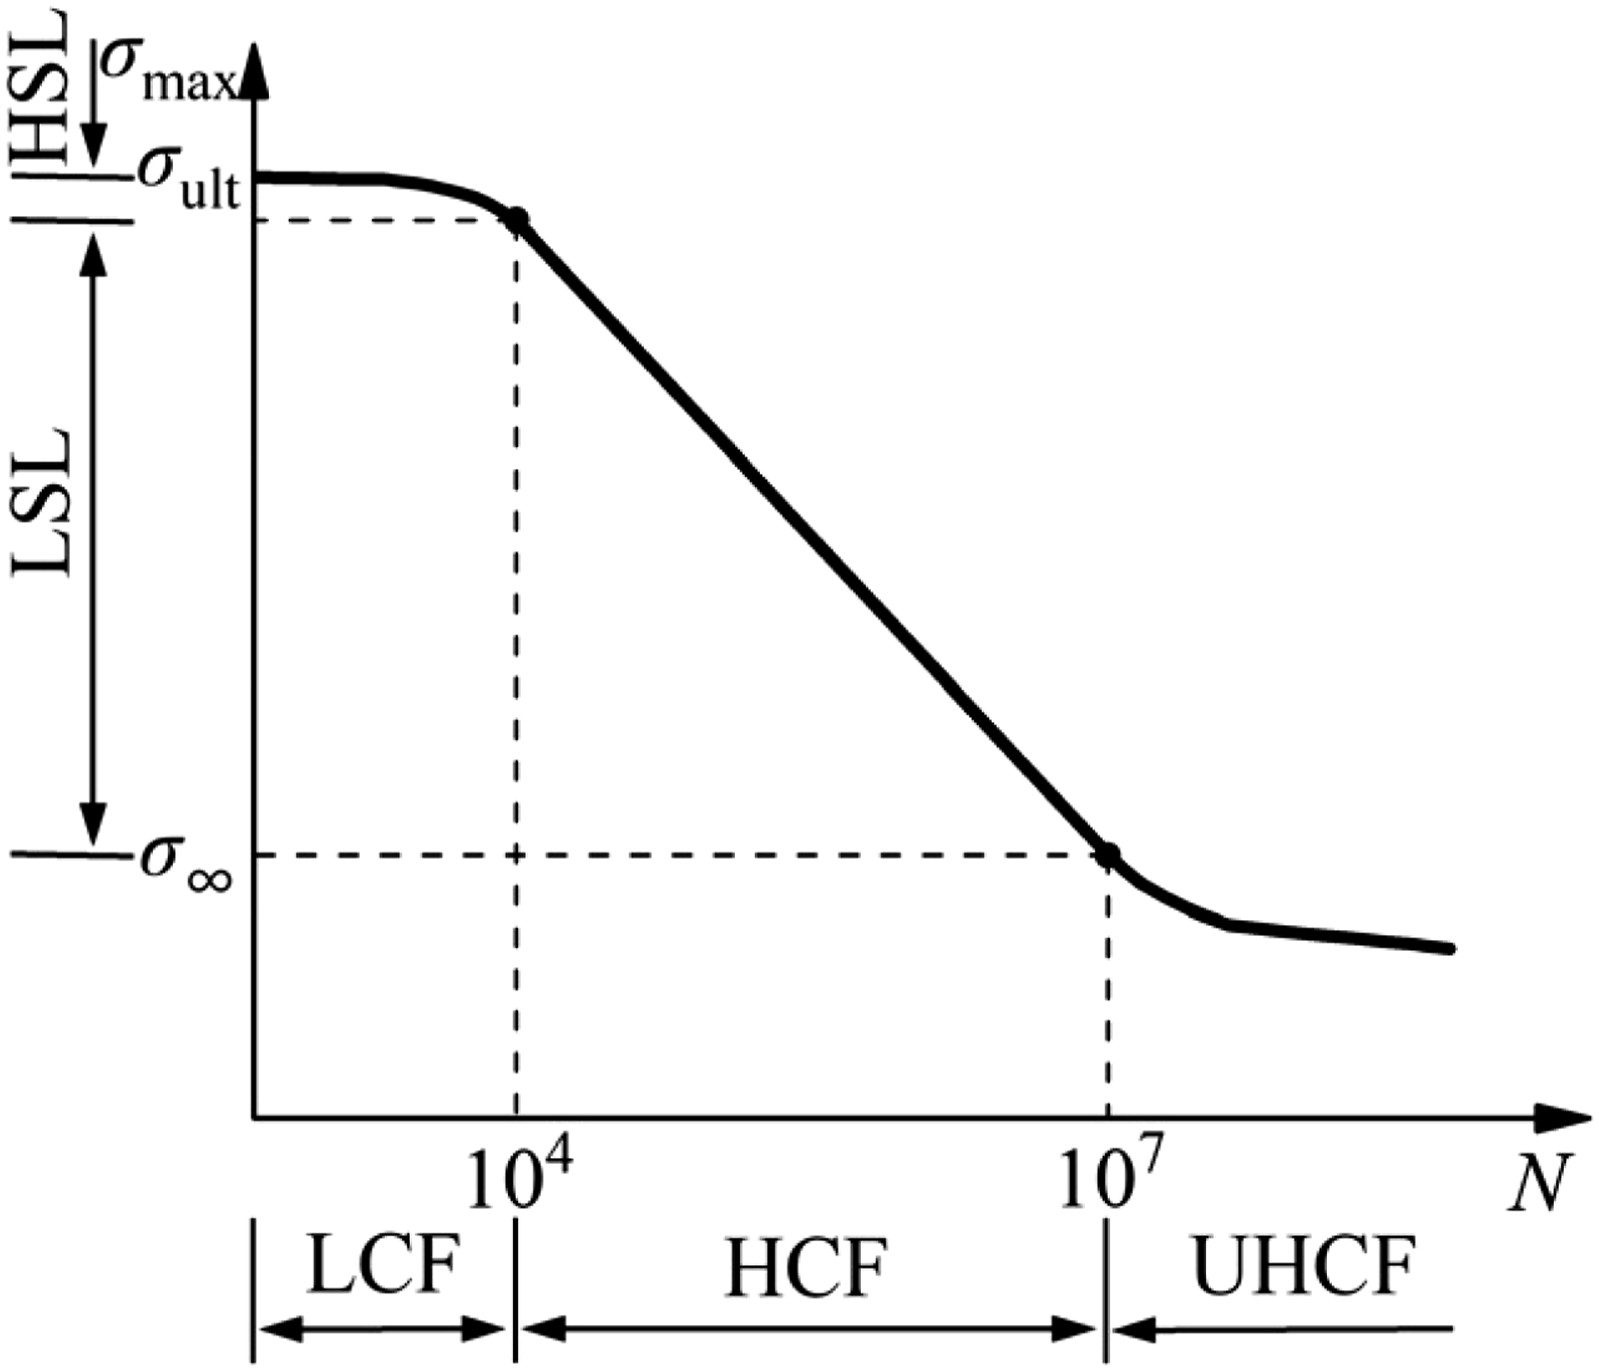
Based on the three stages of fatigue life, the S-N curve model is categorized into four types according to fatigue life region: the HCF region, the LCF and HCF regions, the HCF and UHCF regions, and the full range fatigue life, as shown in Figure 2. The segmented S-N curve models are composed of multiple linear functions to accommodate the different fatigue life regions of the laminate. In the study of the relationship between stress and fatigue life of composites, it is critical to identify the fatigue stress values near two critical points at 104 and 107 cycles. These two points are important turning points in the fatigue life curve, marking the transitions from LCF to HCF, and from HCF to UHCF, respectively. To accurately determine these stress values, a series of exploratory fatigue tests are required. Not only increases the fatigue test time and cost but also the multiple linear functions increase the number of fitting parameters, which reducing the fitting efficiency. The unified S-N curve model utilizes a single function to describe the different fatigue life regions of the laminate. The S-N model does not require precise transitions at critical points, it naturally transitions to the next fatigue life region through the inherent features of the function. This reduces the number of fatigue testing and consequently lower test costs. Although these models can effectively fit the stress-fatigue relationship, the lack of a clear physical interpretation for model parameters limits their practical application. Types of S-N curve models.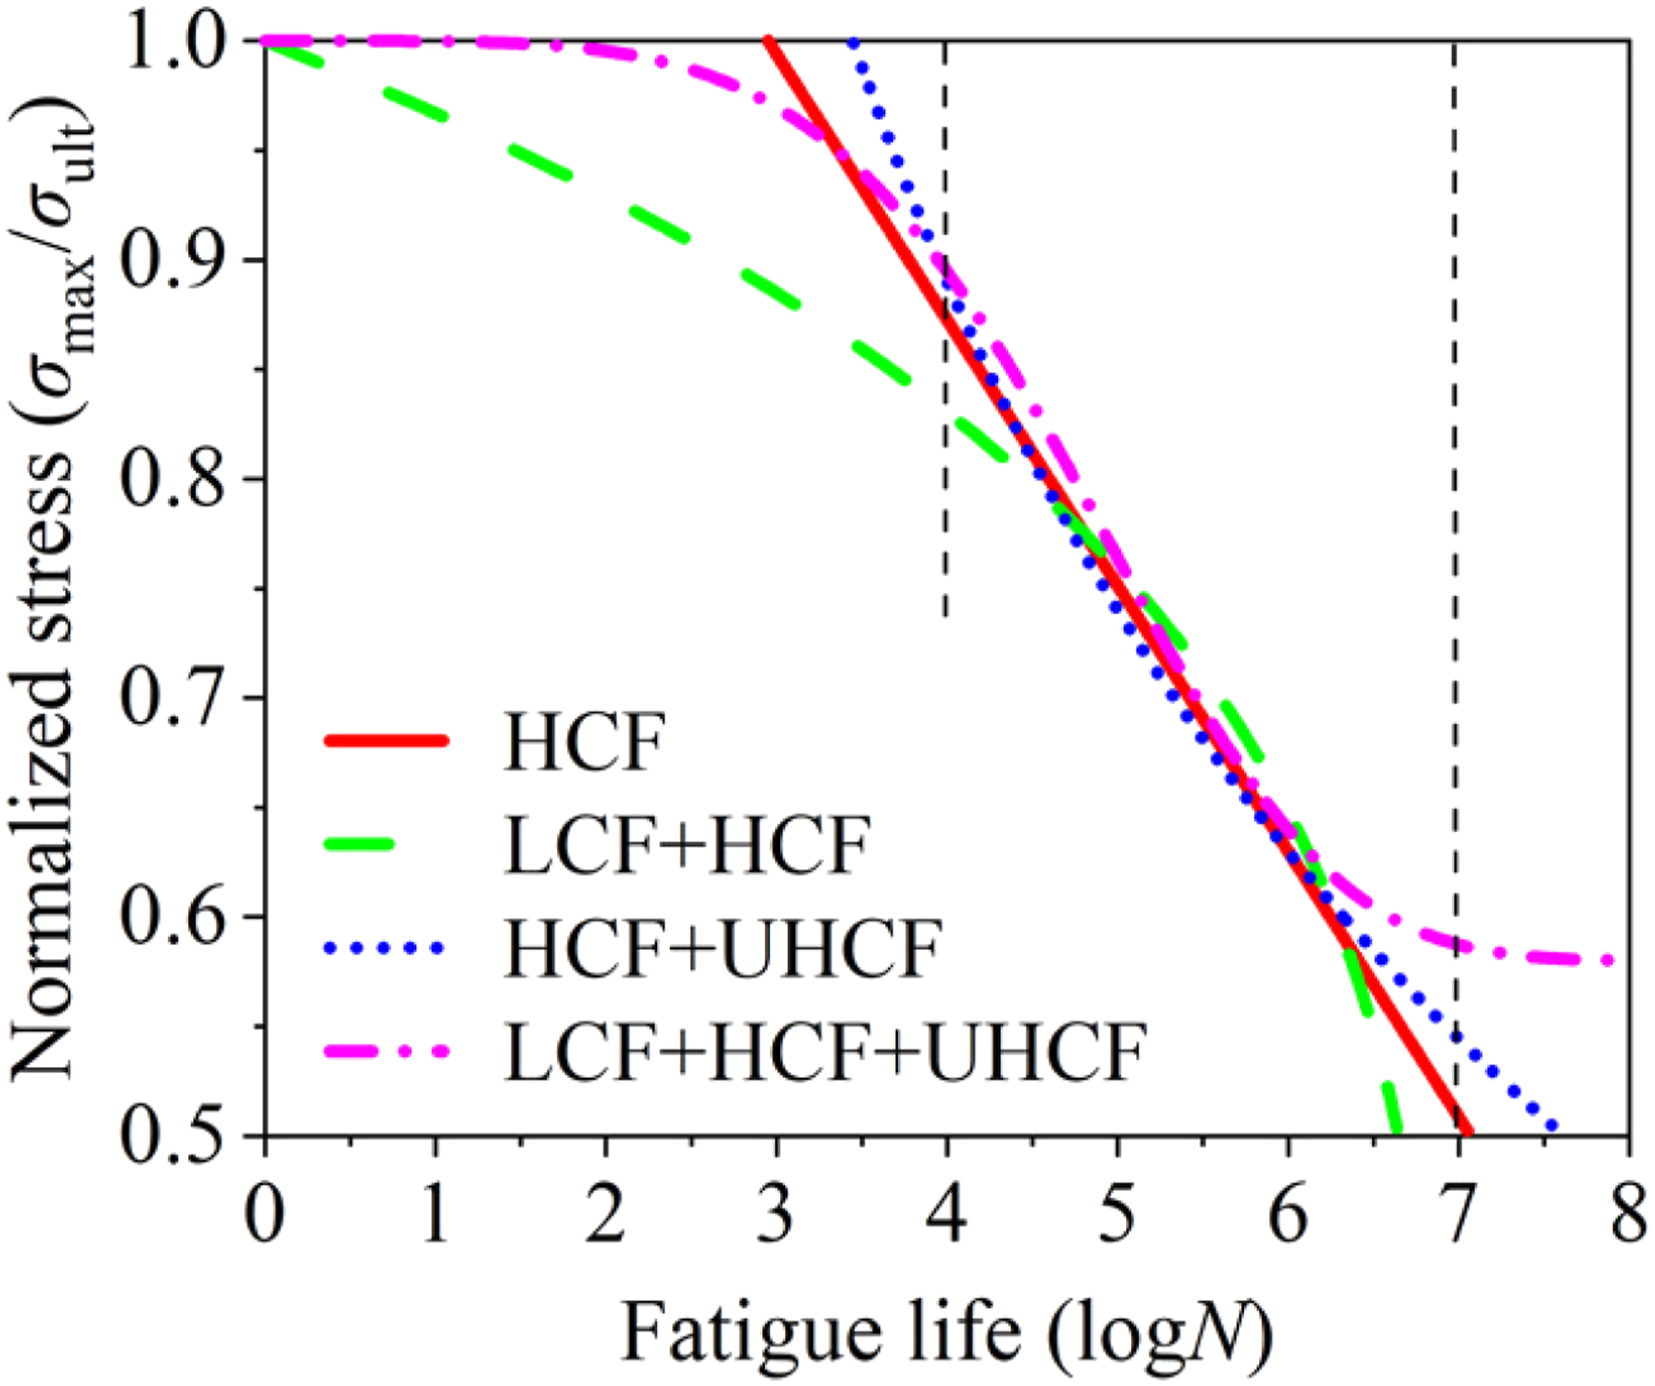
Typical S-N curve models for FRP composite laminates.
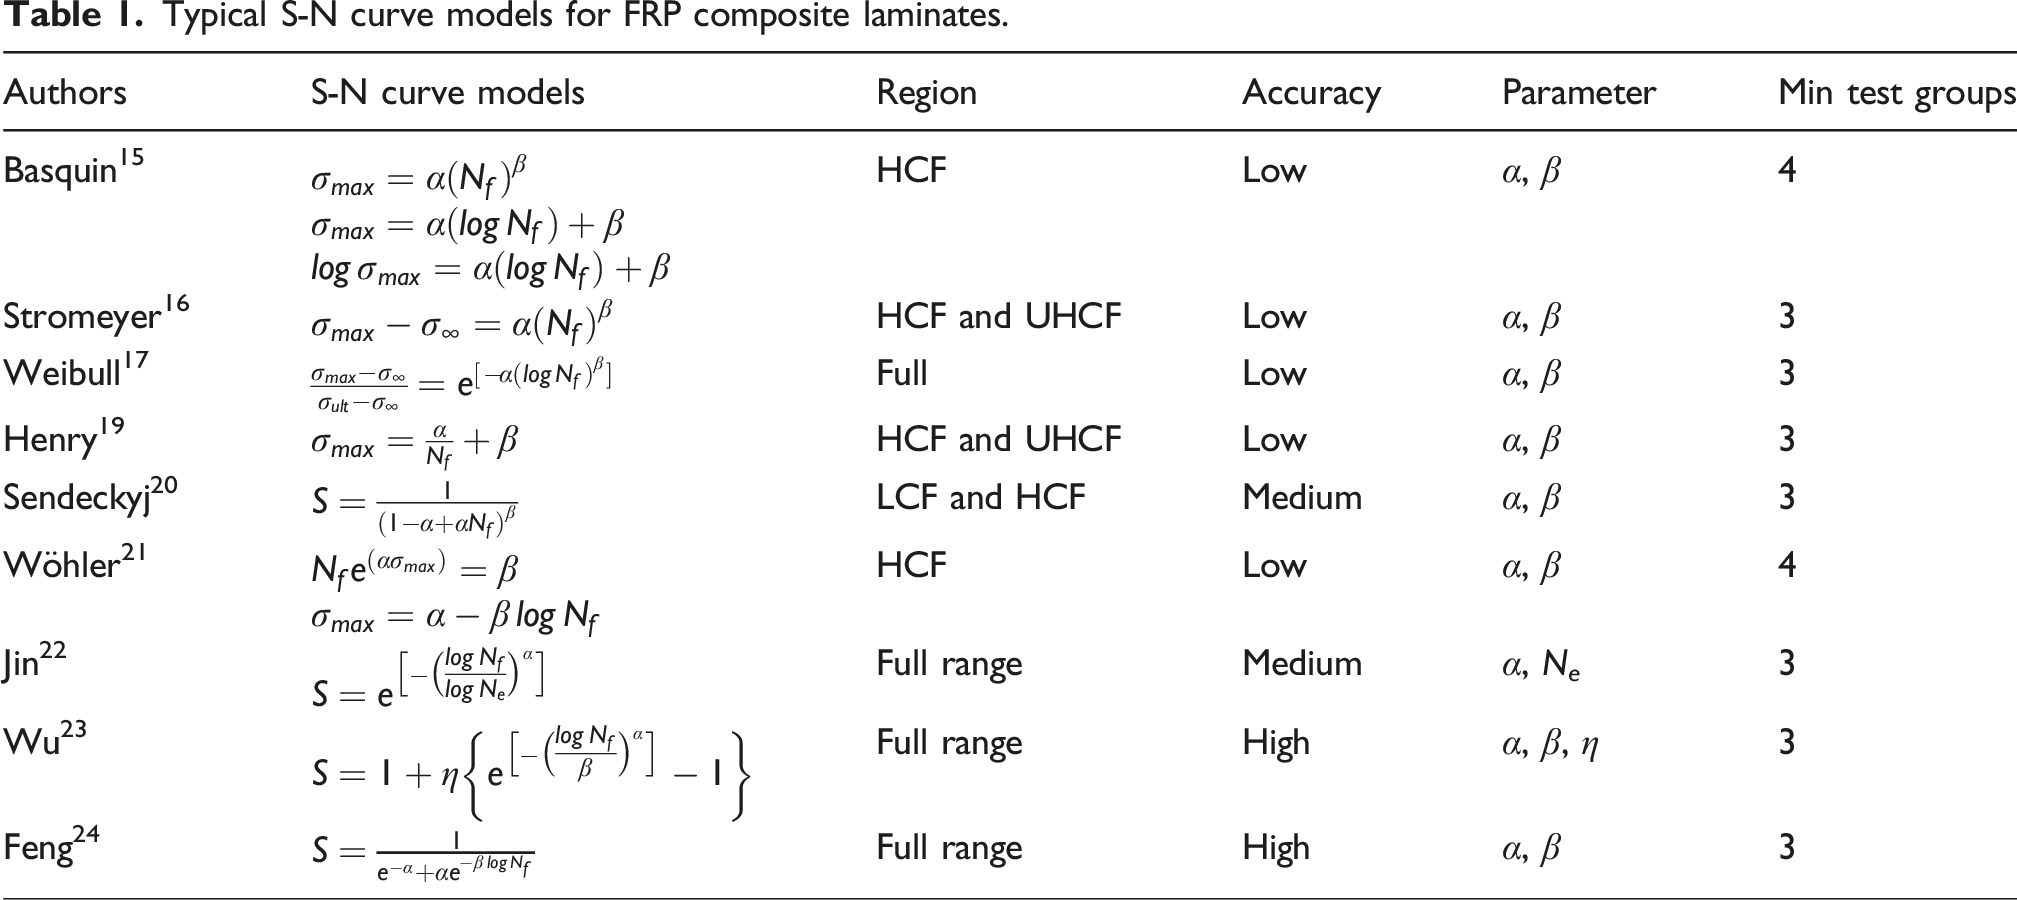
Table 1 shows that most current S-N models only describe fatigue behavior in specific cycle ranges. Owing to the highly nonlinear nature of fatigue damage evolution in composite laminates, the development of high-precision models necessitates comprehensive data spanning the entire life regime, frequently requiring a segmented modeling approach. While models such as those proposed by Weibull, 17 Jin, 22 Wu, 23 and Feng 24 are capable of full life-region assessment, their parameters typically lack well-defined physical interpretation. Furthermore, the Feng model suffers from a boundary discrepancy wherein the fatigue life does not equate to unity when the maximum stress equals the static strength, thereby constraining the predictive accuracy of these models in small-sample scenarios.
Moreover, the requirement to manufacture unique specimens for different materials and stacking sequences results in substantial material, preparation, and testing expenditures. Varied load types necessitate distinct loading methods and spectra, whilst manufacturing variability and environmental influences introduce considerable performance scatter and diminished prediction reliability. The central challenge in practical FRP fatigue simulation thus lies in leveraging small-sample testing to curtail costs and accelerate modeling through enhanced generalization and interpretability. Current small-sample methodologies 23 are generally confined to specific specimens and conditions, employing empirical data fitting without clear physical justification for their parameters. Consequently, they exhibit poor generalization to differing stacking sequences, stress ratios, or full-life regimes, and their reliability remains unverified.
This study aims to construct a generalized high-accuracy material-level full-range S-N model with clear physical significance via a small-sample fatigue testing strategy. Section 2 introduces four multi-parameter S-N models, which include two, three, or four parameters, respectively, and elucidates the relationship of each parameter with the fatigue resistance of composites. Section 3 assesses its accuracy and generality by comparing the proposed models with five widely used models. Section 4 introduces the optimal scheme of small-sample fatigue testing and how to choose the most suitable model from the proposed models. Section 5 verifies the reliability of small-sample method by comparing the test results and simulation results, taken the four-parameter S-N model IV for GFRP laminates as an example at a 95% confidence level.
S-N curve models for composite laminates
Four kinds of full range S-N curve models
The S-N curves of composites are monotonically decreasing and exhibit significant variability. For instance, even with consistent fiber and matrix materials, altering the lay-up sequence of the laminate results in different S-N curves. 25 Therefore, a robust fitting capability is required for the constructed S-N curve model.
Originally proposed by Verhulst for modeling population growth, the Logistic equation has since found widespread application in fields such as biology, medicine, and economics.26,27 Its mathematical expression is depicted in equation (1)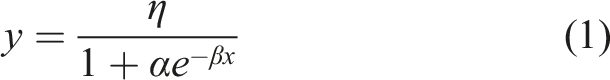
The curve shape of the Logistic equation shows a similar trend to the S-N curve of composites. Assuming that the cyclic load and fatigue life of the composite material follow a Logistic distribution, the Logistic equation can be expressed as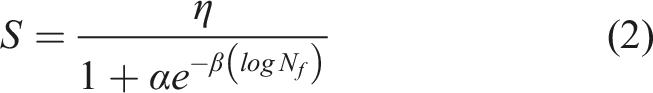
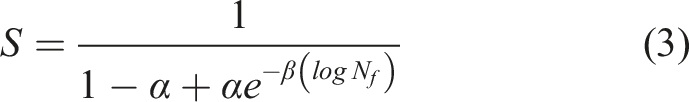
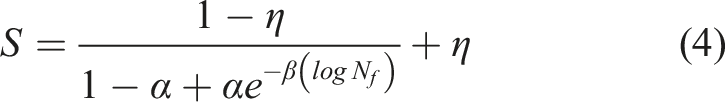
To meet initial constraint conditions, equation (2) is modified to form the two-parameter and three-parameter S-N curve models
28
To enhance the accuracy of the S-N curve model of the composite, five multi-parameter S-N curve models are constructed based on the Logistic function, combined with the power and exponential functions.
The power and exponential functions are introduced into equation (3) to construct the three-parameter S-N curve model I with the entire denominator as the base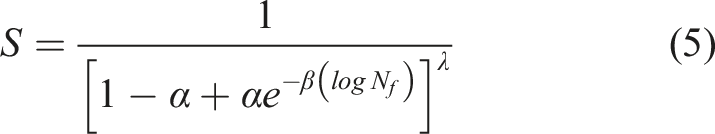
Using the fatigue life (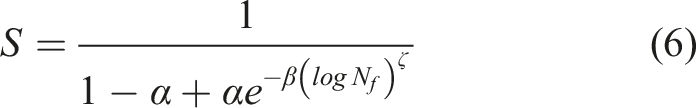
The fatigue life (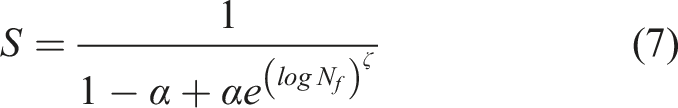
Utilizing the fatigue life (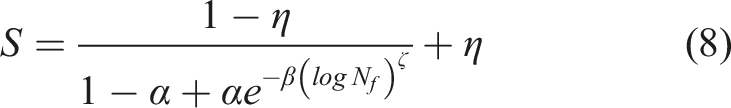
The proposed four constructed S-N curve models.
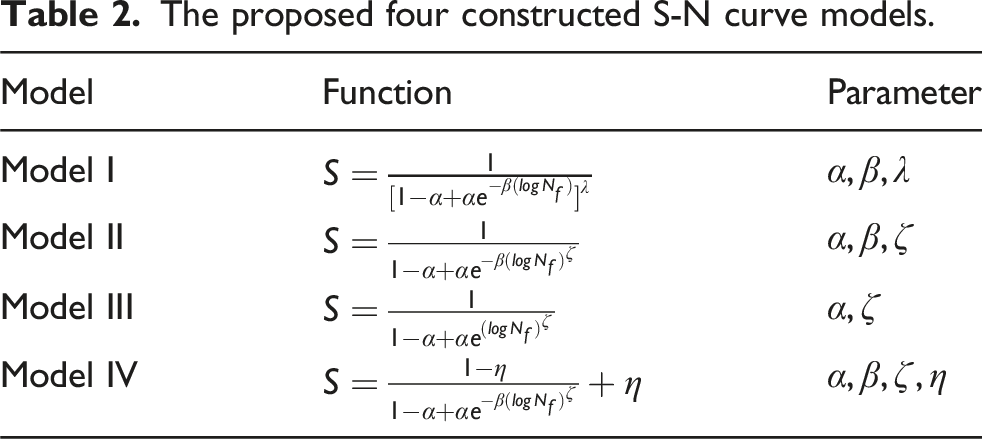
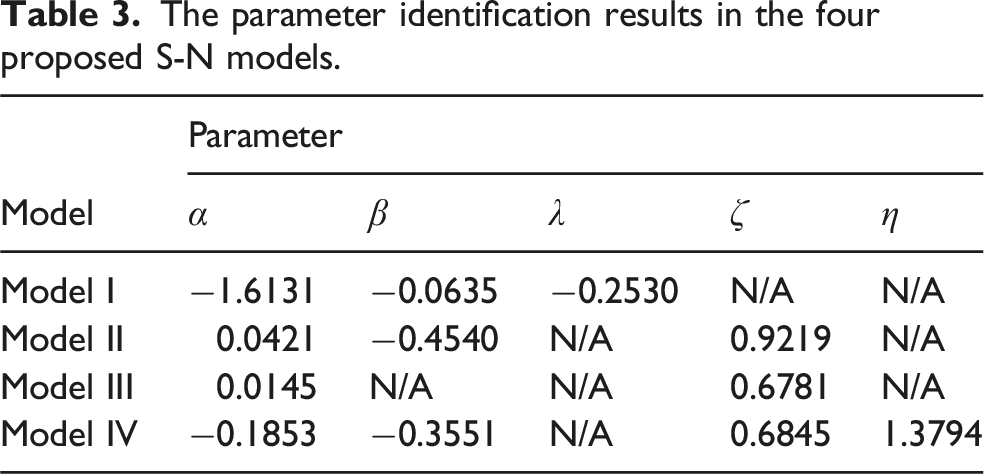
All parameters presented in Table 2 are determined via the proposed small-sample fatigue testing approach, following the procedure outlined below. (1) Data acquisition: Quasi-static tensile tests are conducted to obtain static strength data, while multi-stress level fatigue testis generates fatigue life data covering LCF, HCF, and UHCF regimes. (2) Model selection: The choice of model depends on the number of available datasets.
One fatigue dataset combined with one static strength dataset necessitates the use of the two-parameter model III. Two fatigue datasets along with one static strength dataset justify the application of either the three-parameter model I or model II. Three or more fatigue datasets together with one static strength dataset enable the use of the four-parameter model IV. (3) Parameter identification: Parameters are identified via least-squares regression, with iterative optimization aimed at maximizing the R2 and minimizing the RMSE, leading to an optimal estimation of parameters. (4) Prediction accuracy: The accuracy of prediction is assessed using R2 and RMSE as evaluation metrics.
Physical interpretation of all parameters in S-N curve models
The fatigue life curves of composites with different materials and lay-up sequences have exhibit distinct trends in curve variation, which are primarily manifested as differences in the parameters of the S-N curve models. By analyzing the variation in parameter values, this study investigates the influence of these values on the fatigue life S-N curve models of the composite, thereby reveal the physical interpretation of each parameter.
Different parameter values are used to plot various fatigue life S-N curve models for composites, as shown in Figure 3. The parameter α controls the inflection point between the LCF and HCF regions. As the absolute value of parameter α increases, the number of cycles required to reach HCF region decreases, indicating that a poorer fatigue resistance of composites. The parameters β, λ, and ζ control the fatigue strength reduction exponent. The larger the absolute values β, λ, and ζ, the steeper the S-N curve, and the higher the sensitive of the fatigue life to stress variations. A slight increase in stress can lead to a significant reduction in fatigue life, which indicates the poorer the fatigue resistance of the laminate. The parameter η controls the position at which fatigue life approaches the fatigue limit. An increase in the absolute value of the parameter η leads to a higher fatigue limit, which indicates an improvement in the fatigue resistance of the laminate. Four constructed S-N curve models exhibit an “S” shape, consistent with the three typical stages of fatigue life in composites. These models also satisfy the initial constraint condition that when the σmax is equal to the σult, the Nf of the composite is equal to 1. The relationship between model parameters and fatigue resistance. (a) Parameter α of models I, II, III, and IV. (b) Parameter β of models I, II, and IV. (c) Parameter λ of model I. (d) Parameter ζ of models II, III, and IV. (e) Parameter η of model IV.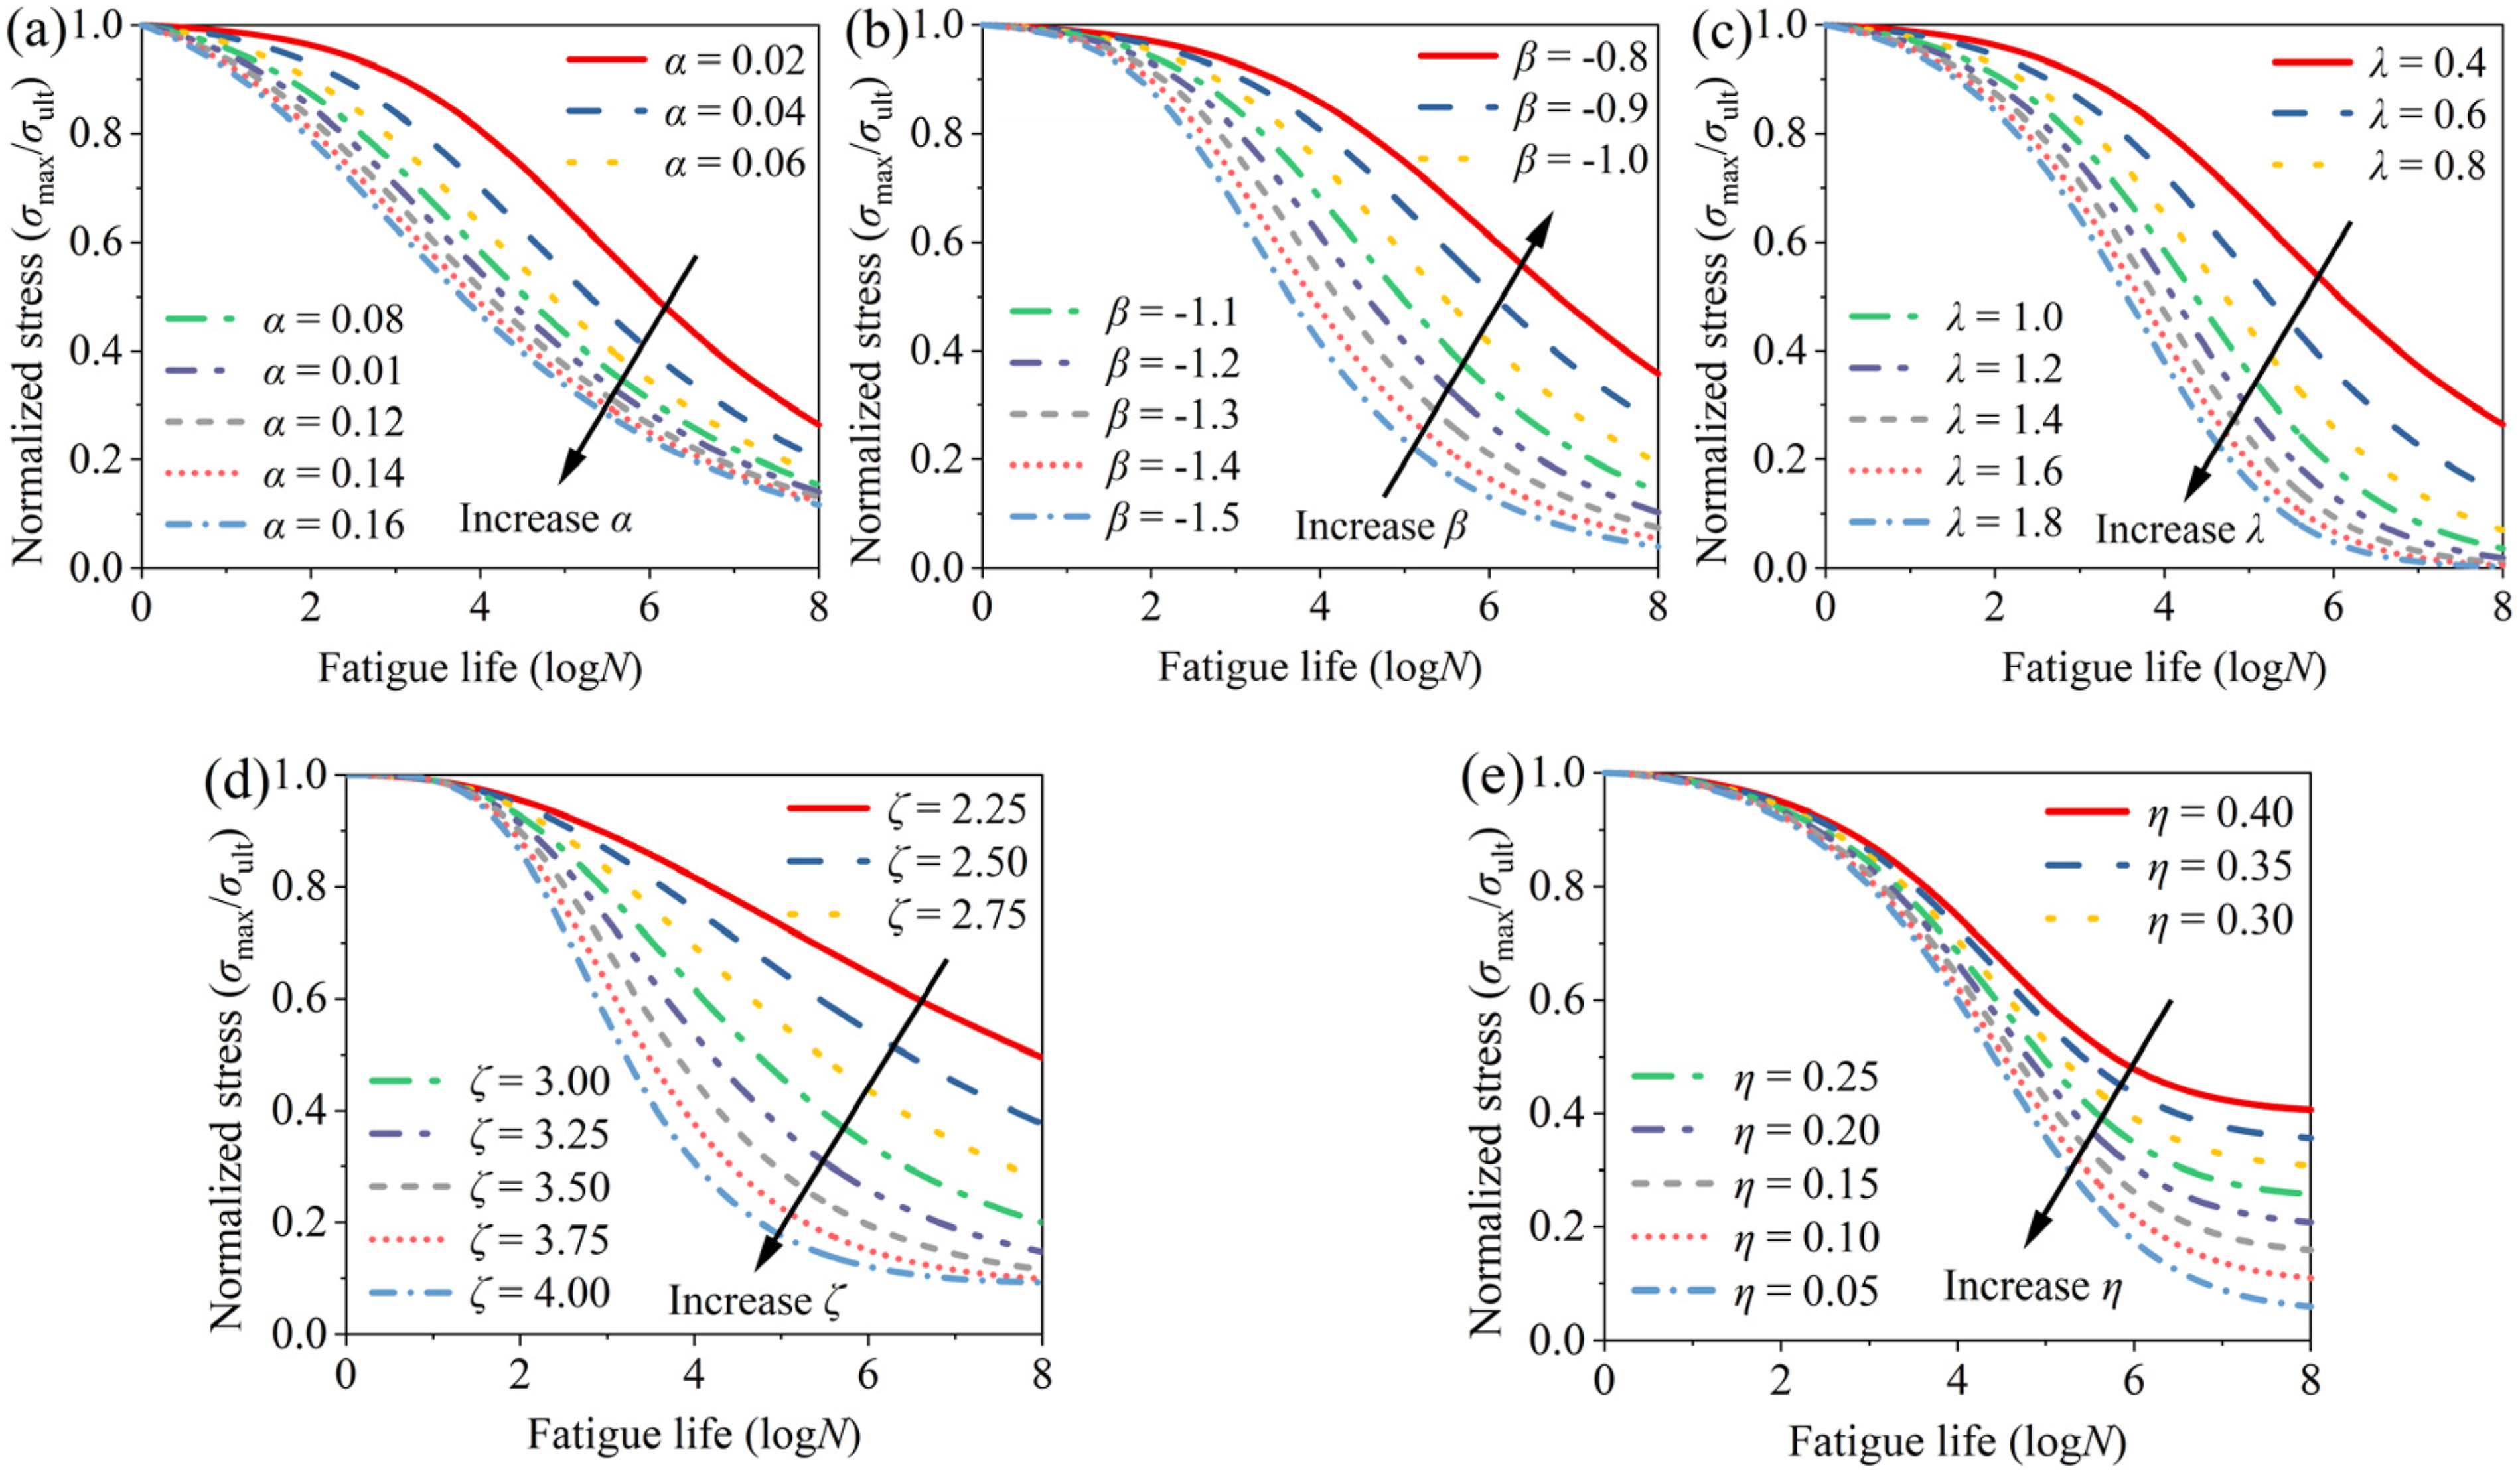
Accuracy and generalizability validation of S-N models for typical laminates
Accuracy validation
Feng 24 provided fatigue data on T700/MTM46 quasi-isotropic composite laminate of [45/90/-45/0/45/0/-45/90/0]S lay-up sequence. The stress-fatigue life relationship of the T700/MTM46 laminate was analyzed by four constructed S-N curve model, as well as the Basquin model, 15 Sendeckyj model, 20 Wu model, 23 Feng model, 24 and Mu model. 28
The predicted fatigue life curves and experimental data of laminates are presented in Figure 4. The four constructed S-N curve models can effectively describe the decay pattern of the fatigue life of laminates with the change of normalized stress. Except for the Basquin model and Sendeckyj model, the other seven S-N curve models meet the initial constraint condition, that is, when the normalized stress equals 1, the σult is equal to the σmax, and the laminate undergoes one cycle of loading. Comparison of various S-N models with test data.
24
(a) Proposed models. (b) Literature models.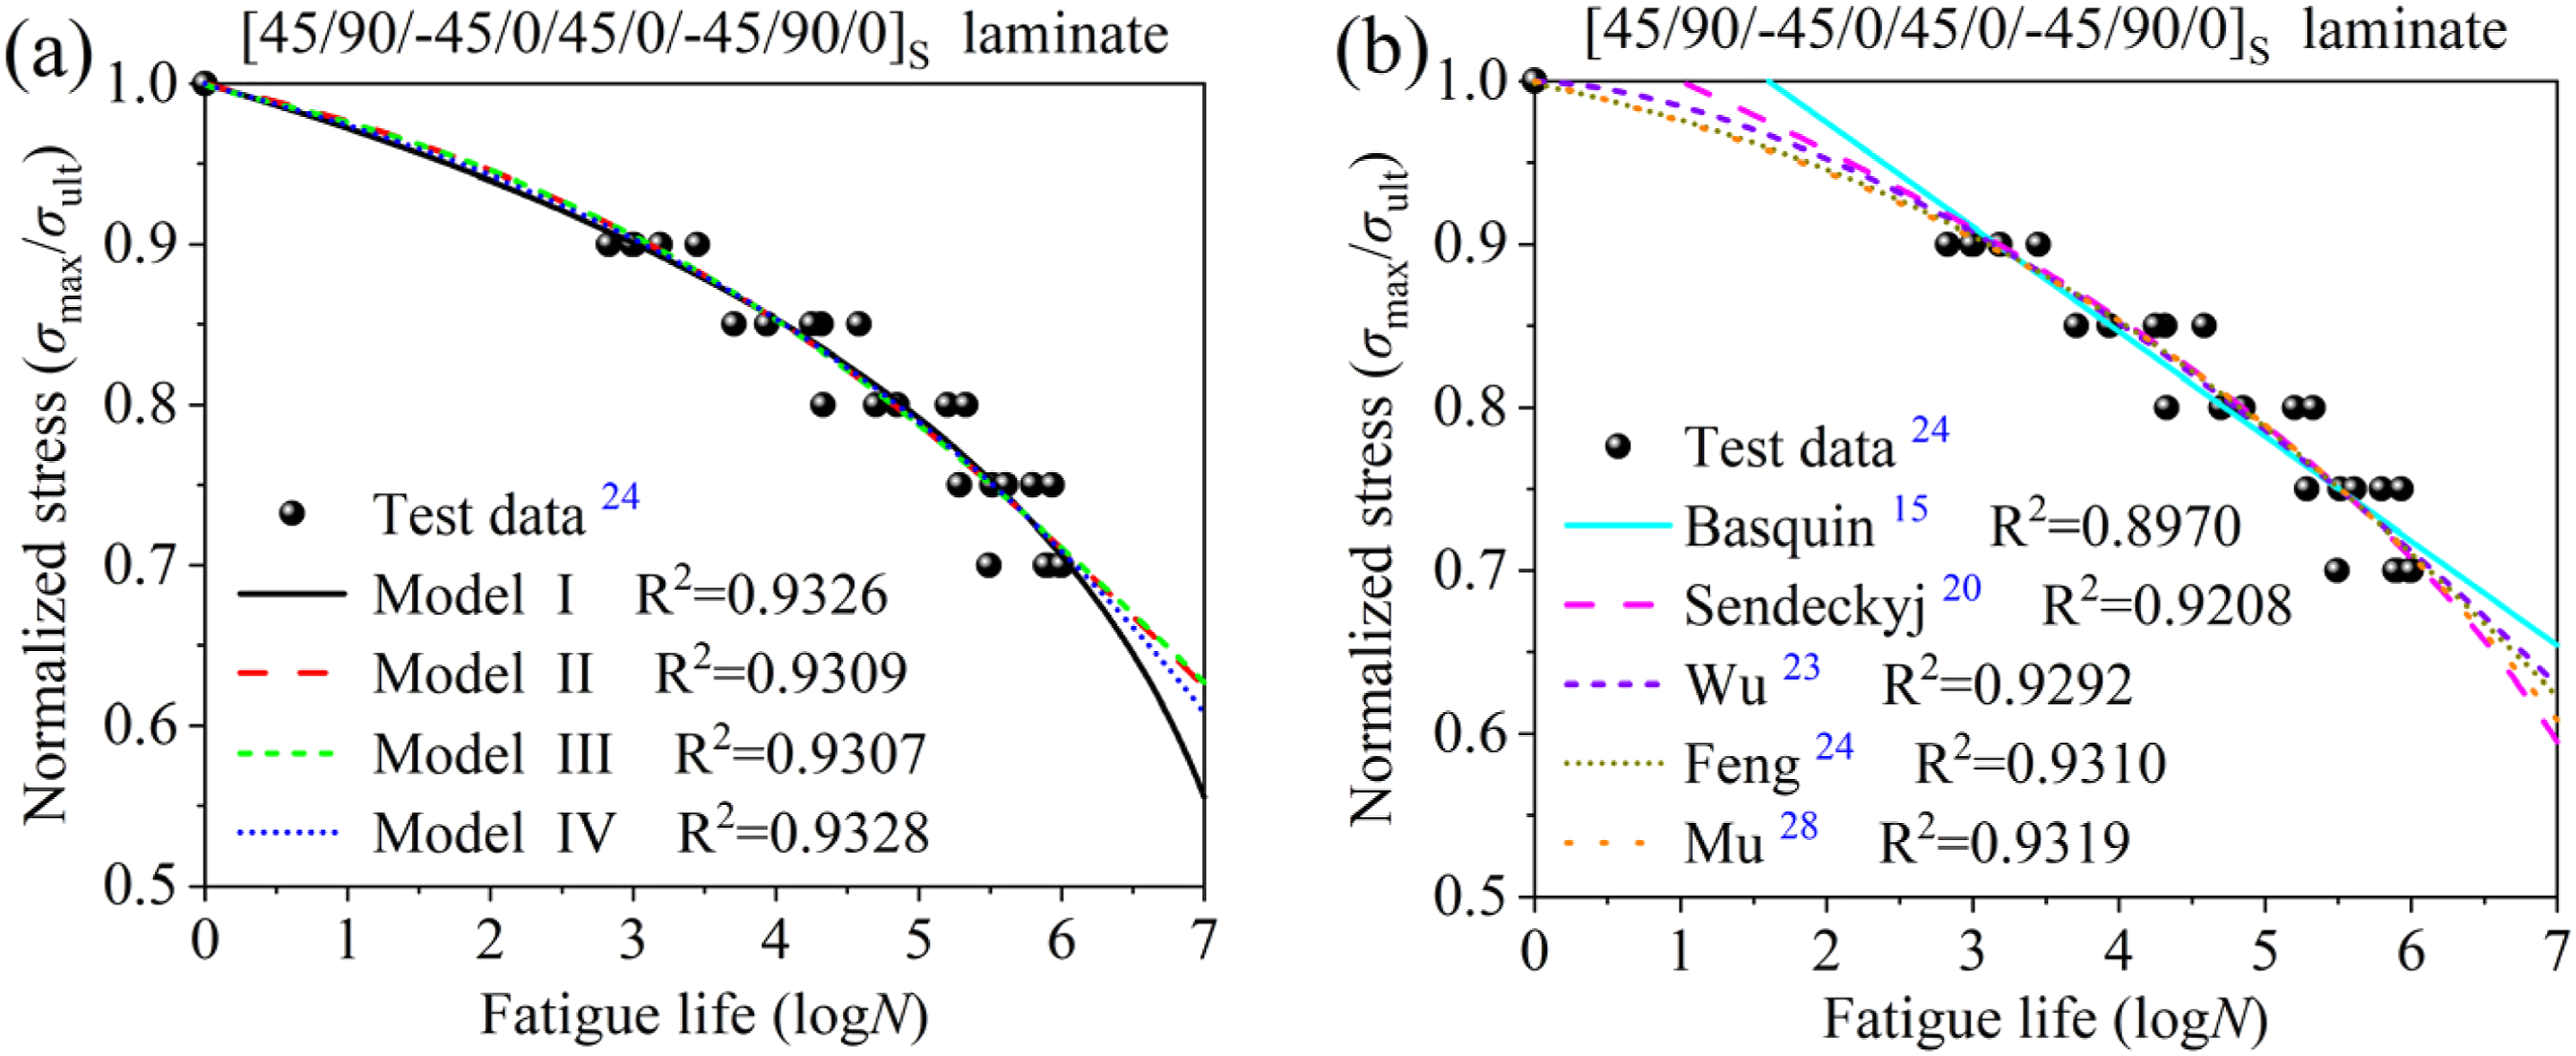
The parameter identification results in the four proposed S-N models.
The predictive accuracy of the nine S-N curve models is not adequately captured solely by the fatigue life curves. Consequently, the R2 and RMSE are employed to quantify the discrepancies between the predicted and experimental values. Figure 5 illustrates that Model IV exhibits the highest R2 and the lowest RMSE, indicating a superior fit compared to the other models evaluated. In contrast, the Basquin model and Sendeckyj model exhibit relatively lower R2 values and higher RMSE values, suggesting poorer fitting accuracy. The four constructed S-N curve models I-IV, when compared to the Wu, Feng, and Mu models, which are widely recognized for their high fitting accuracy, show little difference in both R2 and RMSE values, demonstrating that the constructed models all possess high fitting accuracy. Among the four constructed S-N curve models I-IV, the model III has a lower R2 value compared to the other three models, but the relative difference is always less than 0.003. It also has a higher RMSE value, but the relative difference is always less than 0.001, indicating that the model III still maintains a high degree of fitting accuracy. Accuracy comparison of various S-N curve models. (a) R2. (b) RMSE.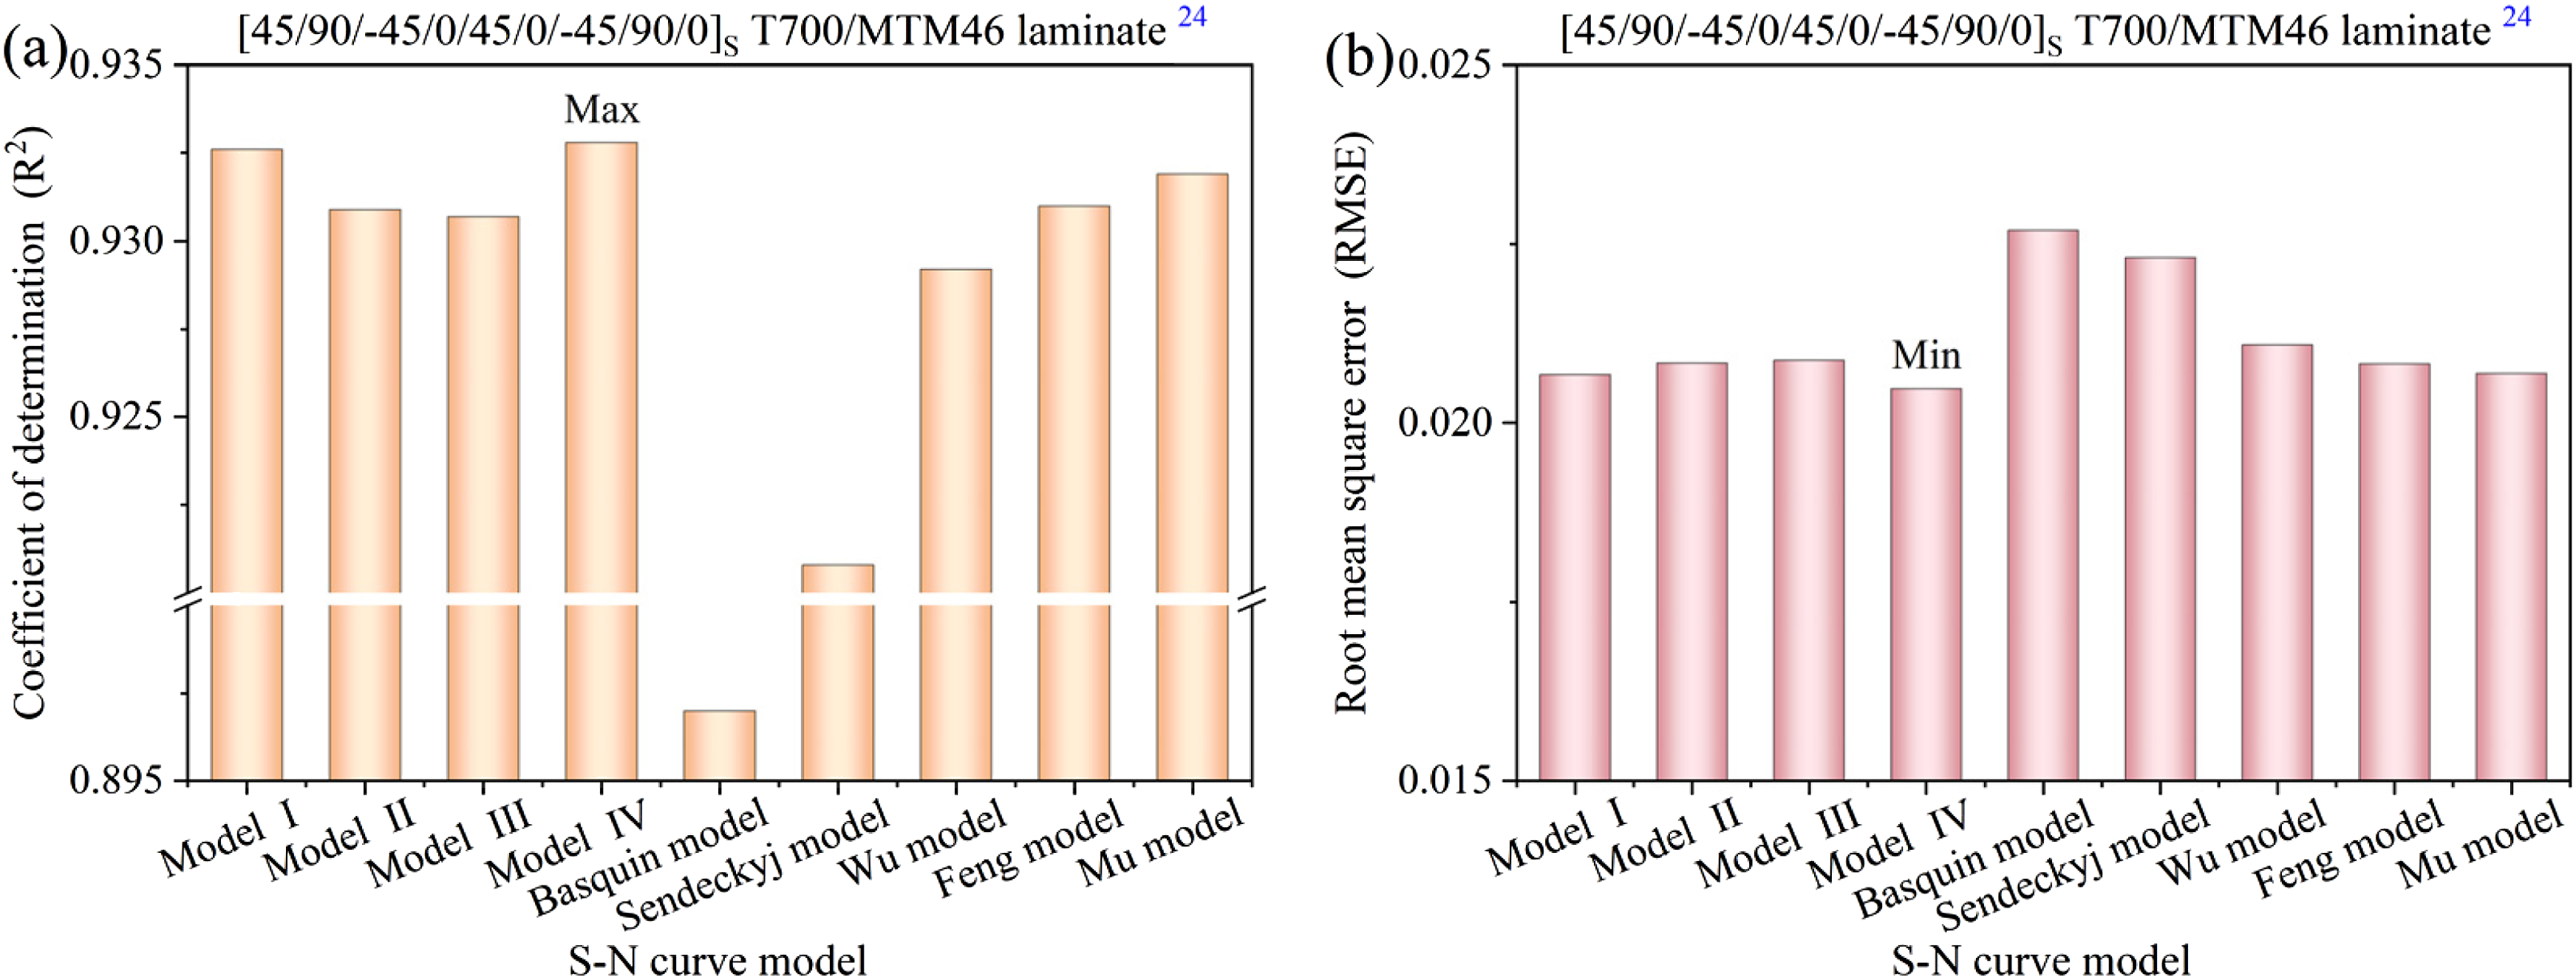
In summary, it can be concluded that: (1) The four constructed S-N curve models can describe the stress-fatigue life relationship of laminates. (2) Among the four S-N curve models, the model IV exhibits the highest fitting accuracy, while the model III has the lowest fitting accuracy relative to the others, but still maintains a high level of fitting accuracy. (3) All four S-N curve models can characterize the relationship between the static ultimate strength and the fatigue strength, and they satisfy the initial constraint conditions of the fatigue life curve for laminates.
Generalization validation for typical materials, lay-up sequences, and stress ratios
The fatigue life of laminates is influenced by various factors, including material properties, lay-up sequences, and loading conditions. To accurately predict the fatigue life of laminates, it is essential that the constructed models possess a high degree of generalization capability. Different combinations of reinforcing fibers and matrix materials can significantly affect the fatigue life of the laminate. Altering the lay-up sequences and fiber orientation angles can change the stress distribution and damage propagation pathways within the laminate, thereby affecting its fatigue life. Applying cyclic loads with different stress ratios to the laminate also affects its fatigue life. For the three scenarios, it is necessary to assess whether the four constructed S-N curve models possess a certain level of generalization ability.
Kim 29 applied constant amplitude cyclic loading with a stress ratio R = 0.4 on polyethylene terephthalate glycol-modified (PETG) to obtain fatigue test data. Feng 24 applied cyclic loading with a stress ratio R = 0.1 to T700/MTM46 composite laminates with a lay-up sequence of [45/90/-45/0/45/0/-45/90/0]S. Mu 28 applied a constant amplitude cyclic load to the T300/QY8911 composite laminate with a lay-up sequence of [-45/0/45/90/-45/0/45/0]S. The laminate specimens are subjected to a tension-tension fatigue load in the fiber direction (T-T-x) with a stress ratio of R = 0.1. The laminate specimens are subjected to a tension-tension fatigue load in the matrix direction (T-T-y) with a stress ratio of R = 0.1. The laminate specimens are subjected to a tension-tension fatigue load along the in-plane shear direction (Ip-S) with a stress ratio of R = 0.1. The laminate specimens are subjected to a tension-compression fatigue load in the fiber direction (T-C-x) with a stress ratio of R = −1.
Accuracy of nine S-N models under different scenarios.
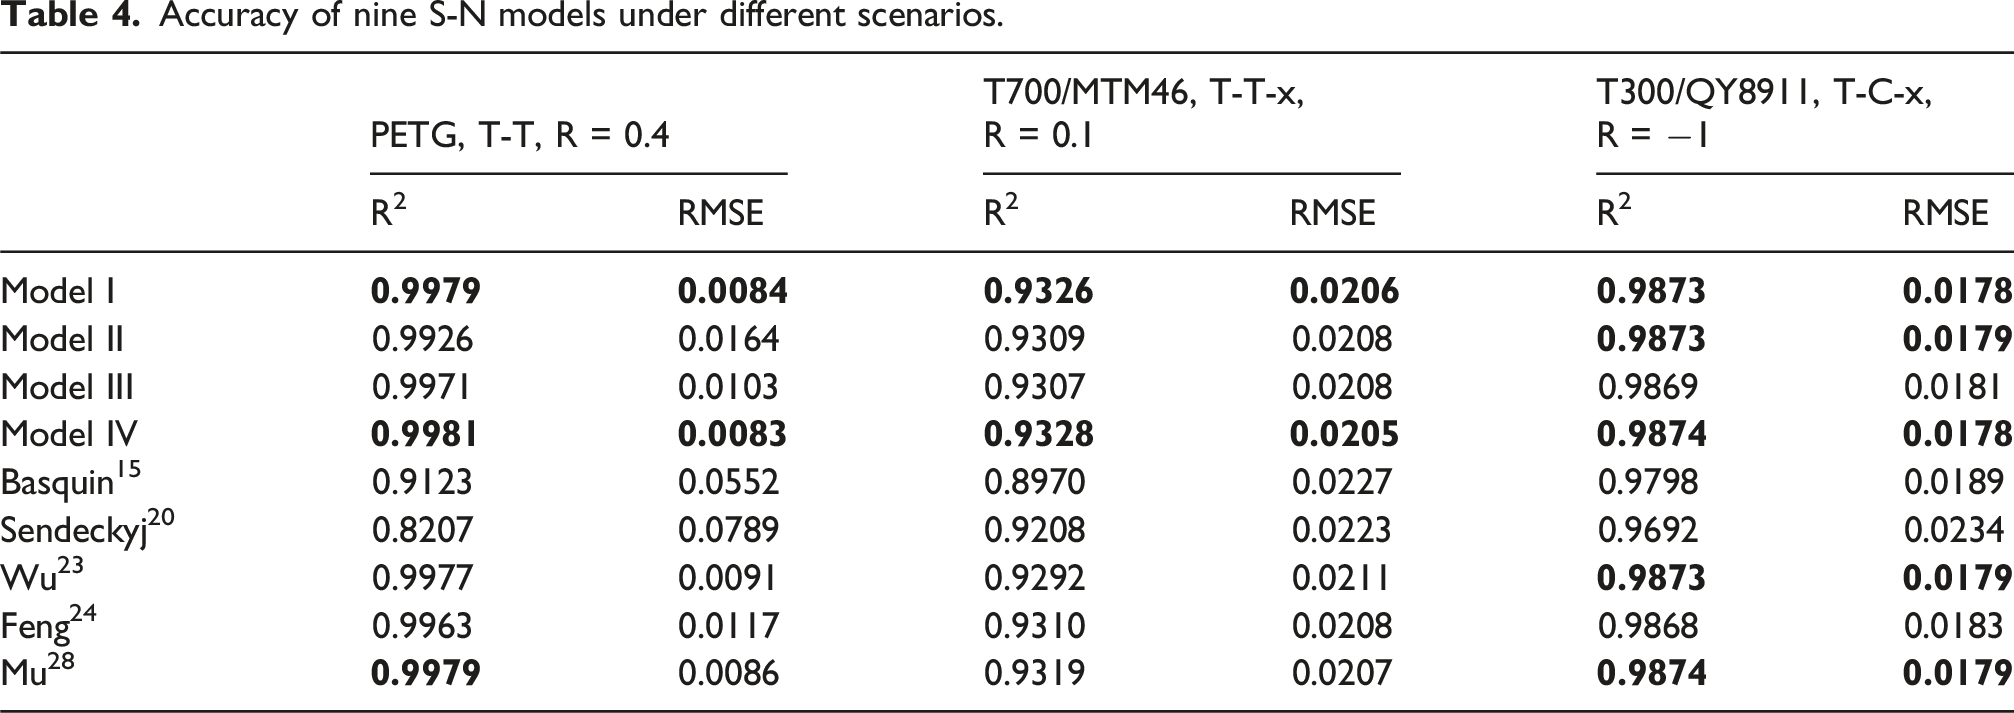
We found that the proposed model IV consistently demonstrated the highest prediction accuracy across all scenarios, while model I ranked second. In contrast, existing models from the literature only achieved high accuracy under specific conditions. These results indicate that the proposed model possesses superior generalization capability compared to the others.
Utilizing the fatigue test data from the aforementioned literature, the model IV with the highest accuracy and the model III with lower accuracy were used to describe the fatigue characteristics of laminates under constant amplitude cyclic loading. The predicted fatigue life curves and experimental data for the composites are illustrated in Figure 6. The following observations can be made: (1) Both the model III and the model IV can describe the fatigue life of laminates with different materials, lay-up sequences, and loading methods, demonstrating the generality of Models III and IV. (2) The R2 of model IV is greater than that of model III, indicating that the model IV has higher fitting accuracy. (3) The model III has fewer parameters, making it easier to determine the initial iterative values for the parameters, thus achieving higher fitting efficiency. (4) Even when the S-N curve exhibits a nonlinear form that is not the typical “S” shape, the constructed S-N curve models can still adequately describe the relationship between stress and fatigue life of the laminate. (5) The constructed S-N curve models have the capability to effectively characterize the full-range fatigue life of the laminate. (6) The S-N curve shows a monotonically decreasing trend, with the fatigue life of laminates gradually increasing as the normalized stress ‘S’ decreases. Comparison of models III and IV for different materials, lay-up sequences, and stress ratios. (a) PETG under T-T loading. (b) The [45/90/-45/0/45/0/-45/90/0]S T700/MTM46 laminate under T-T-x loading. (c)–(f) The [-45/0/45/90/-45/0/45/0]S T300/QY8911 was tested under T-T-x, T-T-y, Ip-S, and T-C-x, respectively.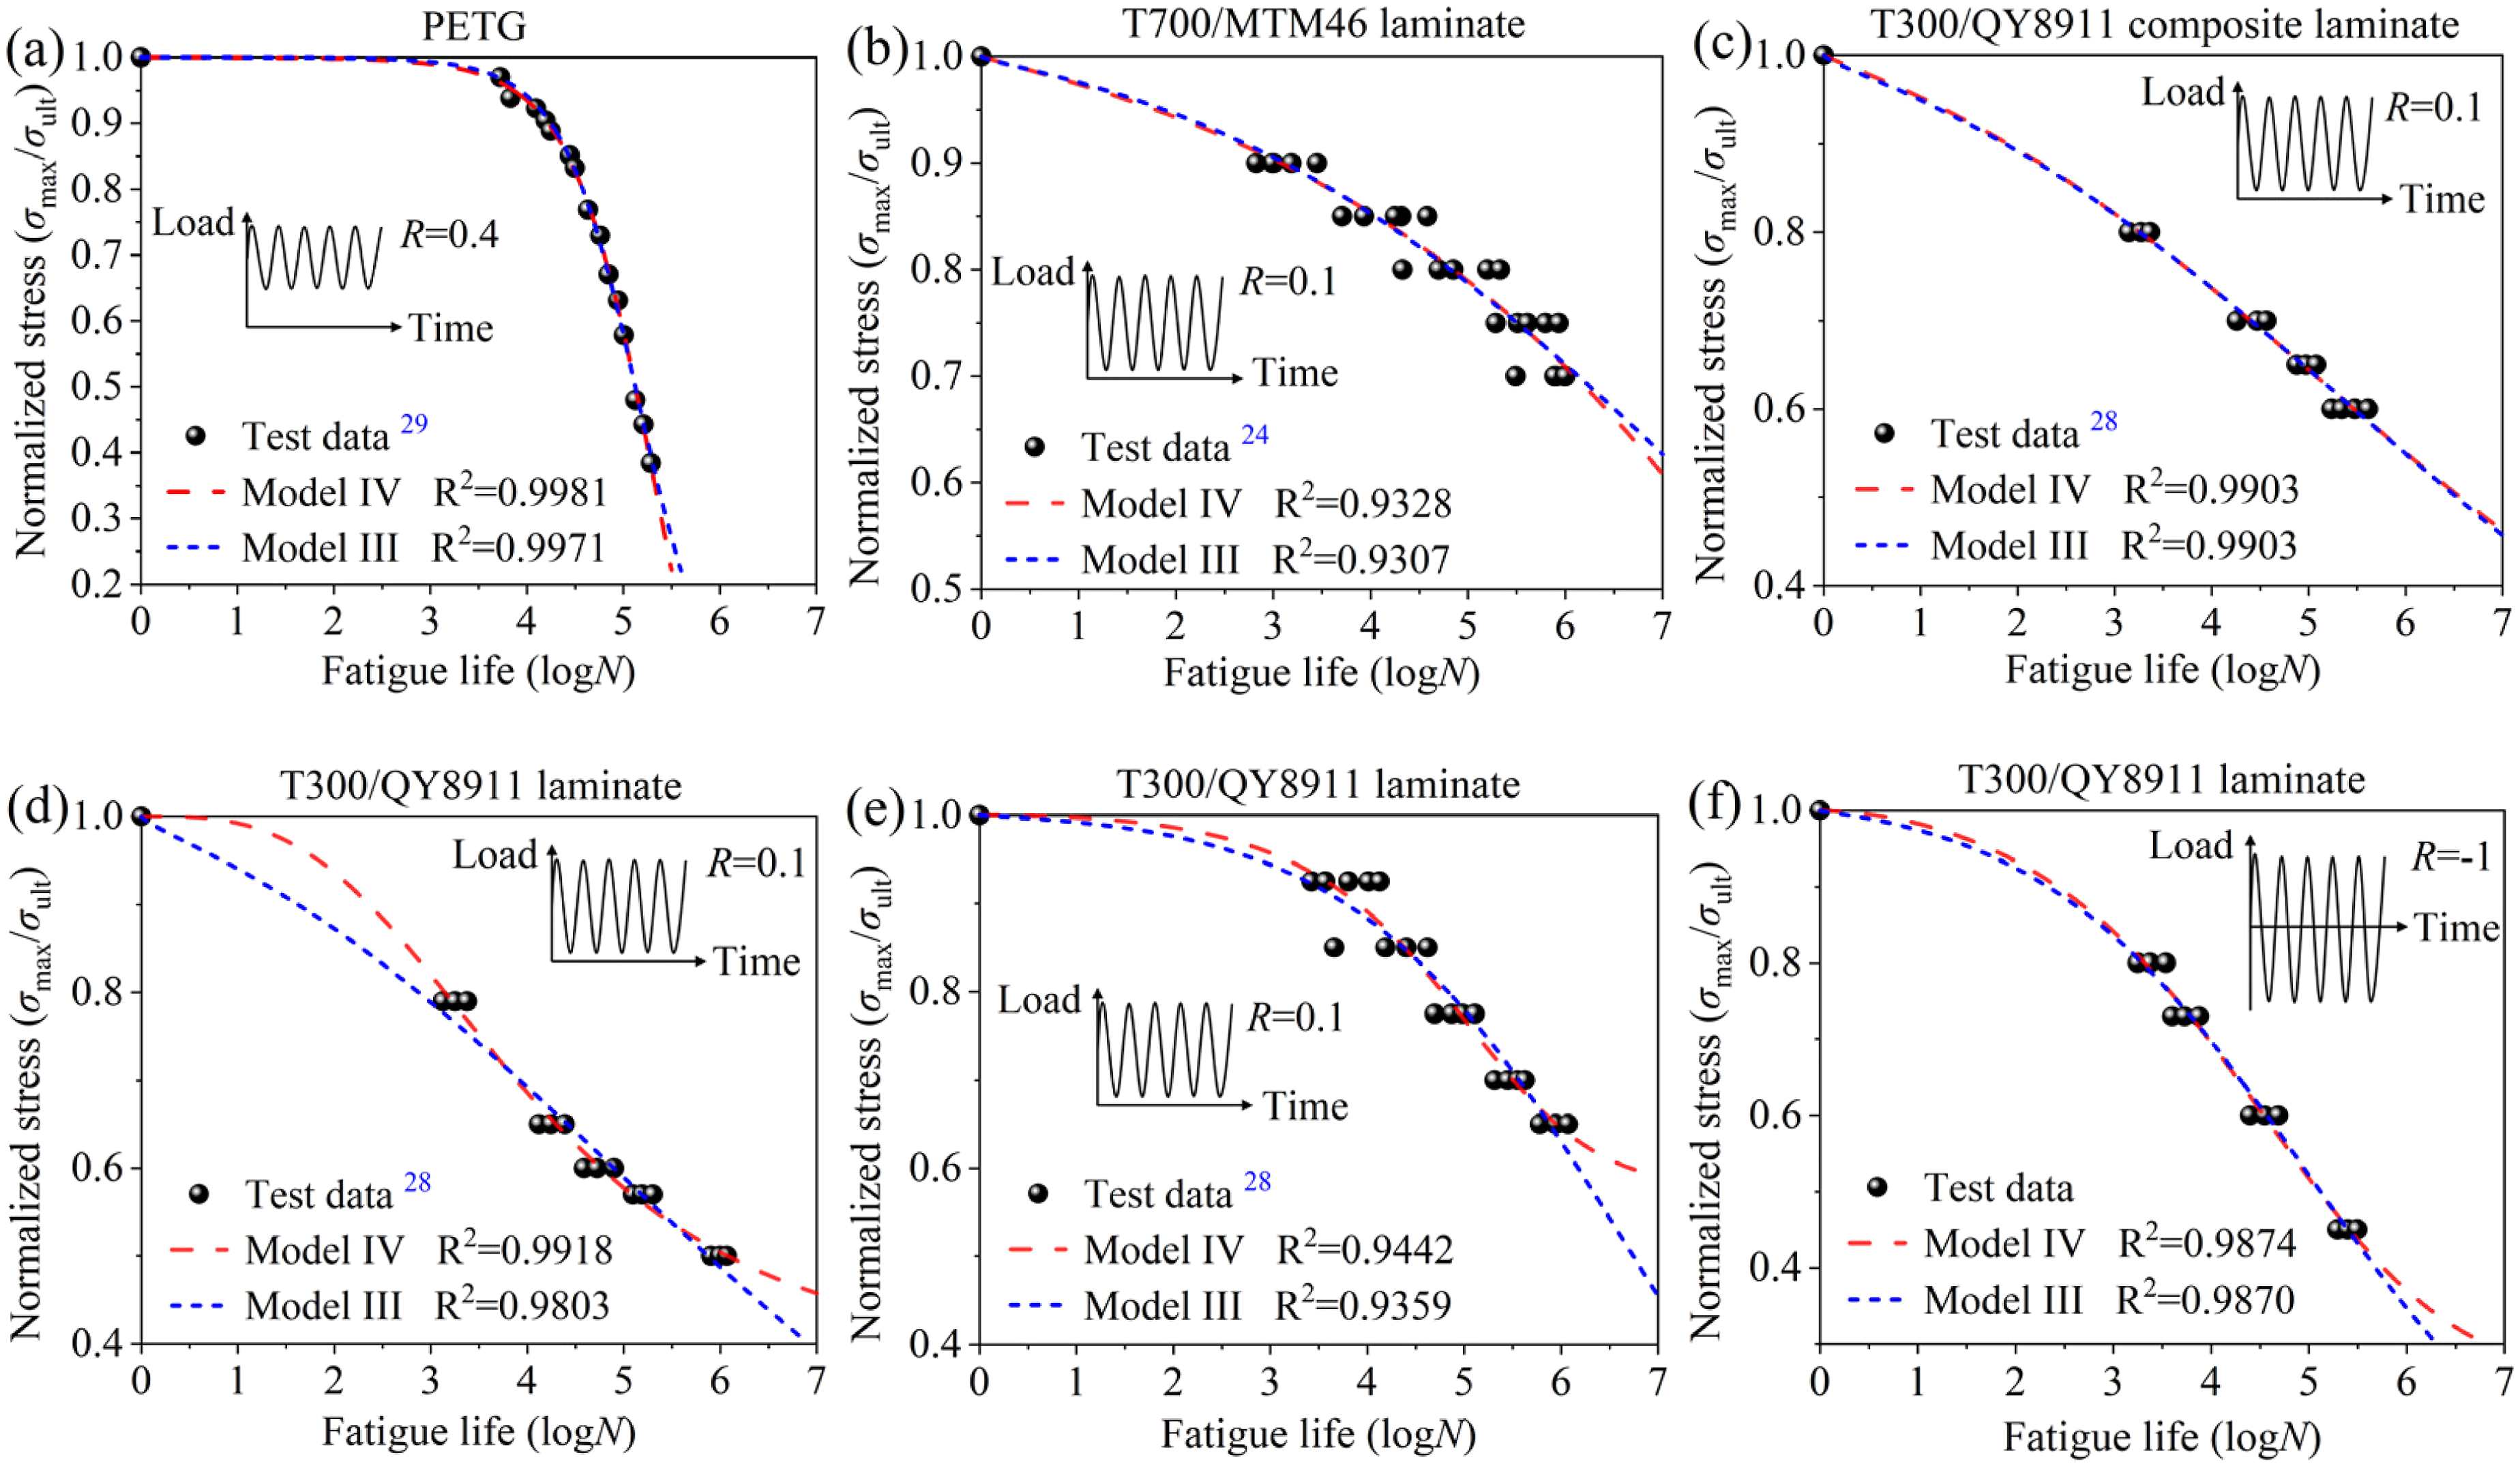
The constants of each S-N curve model were estimated using the least squares method, and the R2 and RMSE between the predicted and actual values were calculated. The fitting accuracy of the four S-N curve models for laminates with different materials, lay-up sequences, and loading conditions was compared, as shown in Figure 7. The following conclusions can be drawn: (1) As shown in Figure 7(a), the four S-N curve models can describe the relationship between stress and fatigue life of thermoplastics under cyclic loading. (2) As shown in Figures 7(b) and (c), the four S-N curve models can describe the fatigue life of laminates with different lay-up sequences and fiber orientation angles. (3) As shown in Figures 7(c) to (f), the four S-N curve models can describe the fatigue life of laminates under different loading methods. (4) The R2 and RMSE values for models I to IV are closely matched, with R2 values exceeding 0.93 and RMSE values less than 0.03, indicating that both S-N curve models possess a high degree of precision. Accuracy of four S-N models. (a) R2 and RMSE of PETG under T-T. (b) R2 and RMSE of T700/MTM46 under T-T-x. (c)–(f) R2 and RMSE of T300/QY8911 under T-T-x, T-T-y, Ip-S, and T-C-x, respectively.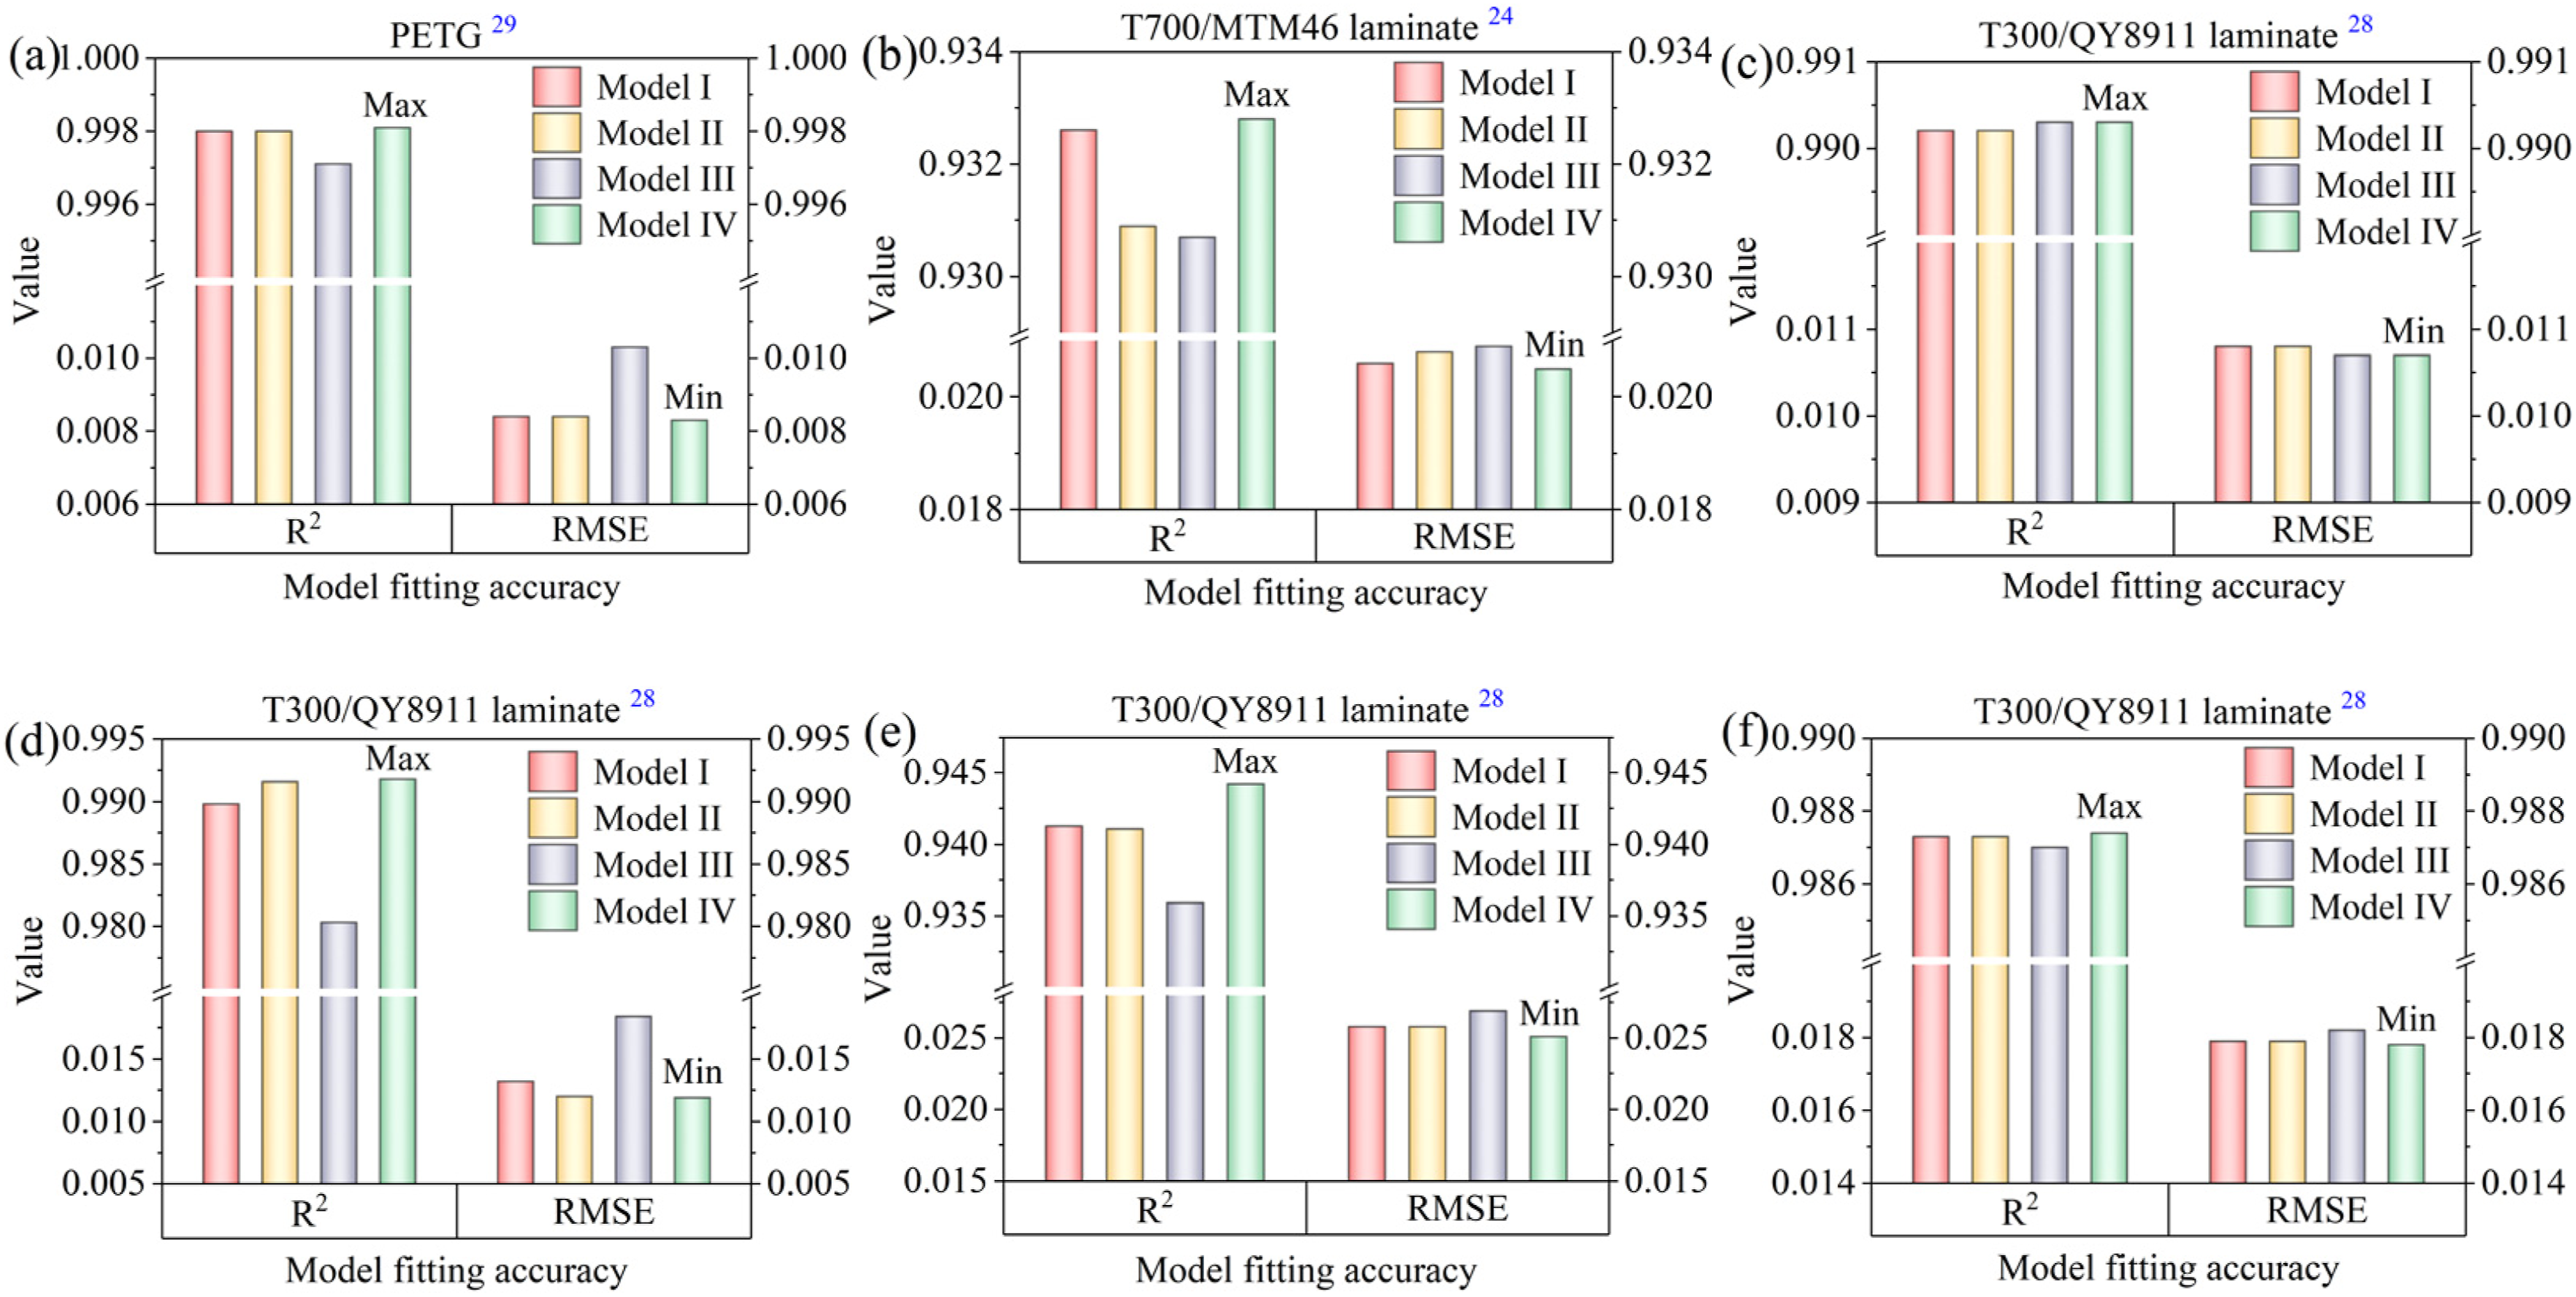
From the above, it can be concluded that when comparing models I to IV, the following observations can be made: (1) Among the four S-N curve models, the model IV exhibits the highest fitting accuracy, while the model III has the lowest relative fitting accuracy. However, the R2 and RMSE of four S-N curve models are almost identical, indicating that all four S-N curve models possess a high degree of fitting accuracy. (2) The constructed S-N curve models are capable of characterizing the stress-fatigue life relationships for thermoplastic materials, as well as fiber reinforced resin matrix composites with different lay-up sequences and stress ratios. (3) All four S-N curve models can characterize the relationship between the static ultimate strength and fatigue strength. (4) The fatigue life curves of laminates with the same material and the lay-up sequence under different loading conditions are fitted with the same S-N curve model, and the fatigue limit strengths are different. (5) Composite laminates with the same material and lay-up sequence under identical loading conditions, when fitting with different S-N curve models, still show differences in the fatigue strength reduction exponent and the fatigue limit strength.
Small-sample fatigue testing method
Sample matching method for high/low stress level
The S-N curves of laminates typically exhibit three distinct fatigue regions, namely the LCF, HCF, and UHCF regions. In small-sample fatigue testing, it is important to span the entire fatigue region as much as possible. In the UHCF region, researchers determine the fatigue strength corresponding to 107 cycles by conducting multiple fatigue tests using the up-down method, which is time-consuming and increases experimental costs. Therefore, researchers only need to design the number of sample groups for fatigue tests in the LCF and HCF regions.
Sample matching scheme for high/low stress level.
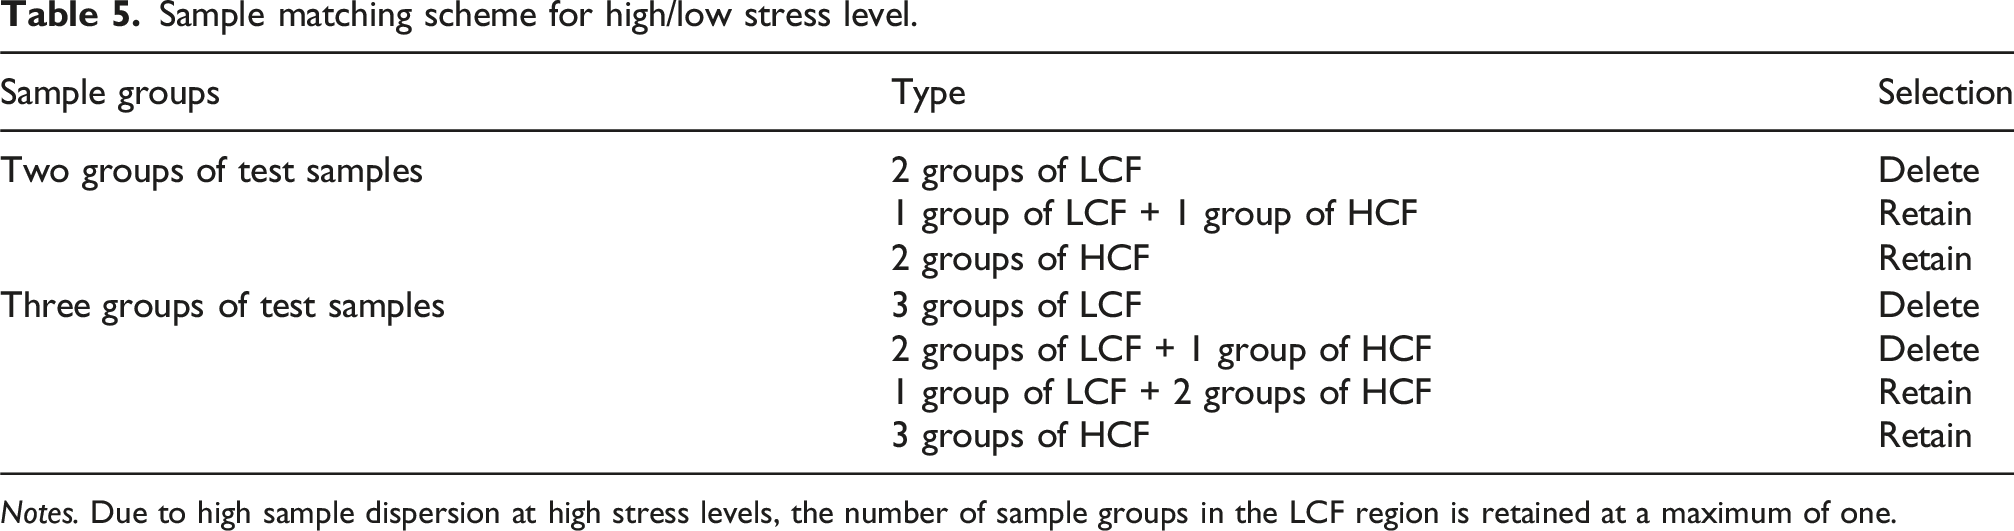
Notes. Due to high sample dispersion at high stress levels, the number of sample groups in the LCF region is retained at a maximum of one.
Accuracy assessment of different matching design schemes
Broer
30
conducted a constant amplitude cyclic load with a stress ratio R = −0.6 to carbon fiber/epoxy composite laminates with a lay-up sequence of [90/0/90]2S. Broer conducted static tests to obtain one group of quasi-static ultimate load data and conducted fatigue tests to obtain four groups of fatigue life data. The four groups of fatigue test data include one group (A) of fatigue test data in the LCF region under HSL and three groups (B, C, and D) of fatigue test data in the HCF region under LSL, as shown in Figure 8. Fatigue test specimen groups and fatigue life curves for [90/0/90]2S carbon-epoxy laminate.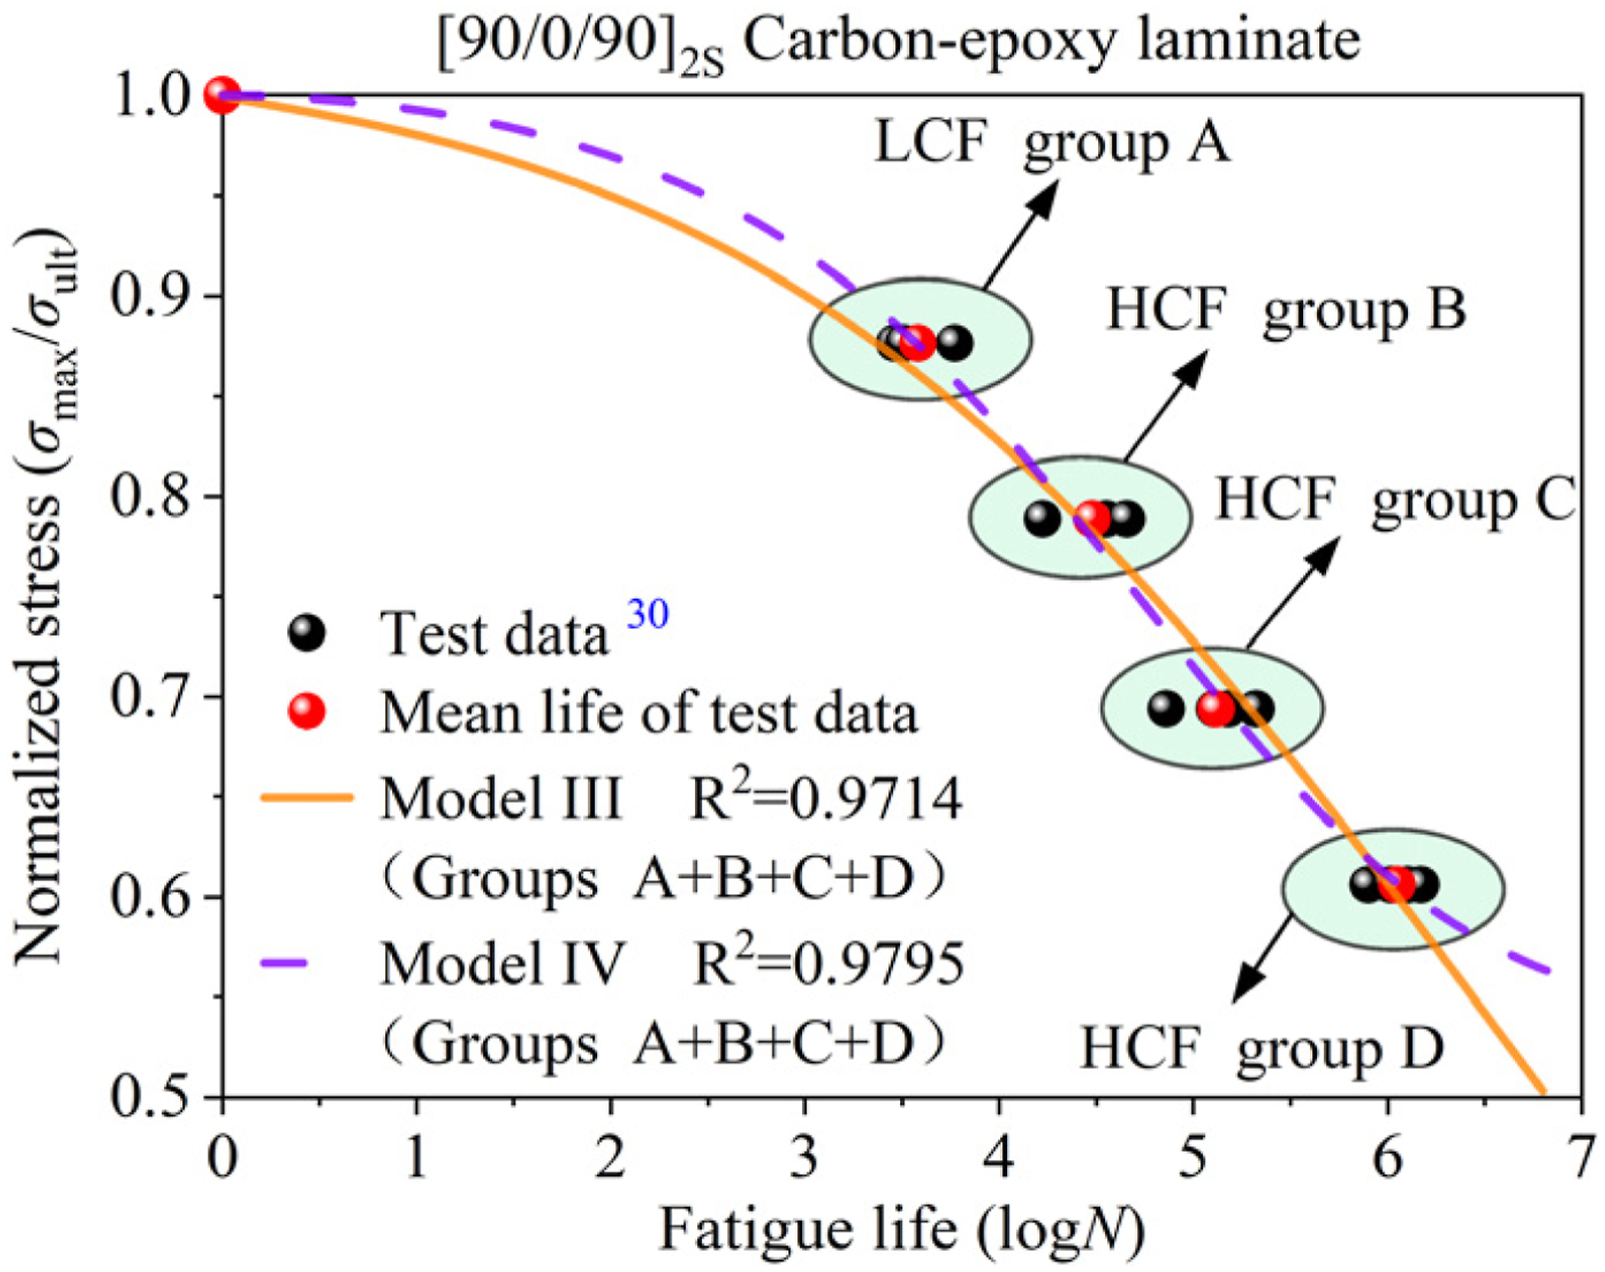
According to Section 3, the fitting accuracy of the four models is similar. Due to space limitations, only the two-parameter model III and the four-parameter model IV are applied to predict the fatigue life of laminates. Four groups of fatigue test data of carbon fiber/epoxy composite laminates with a lay-up sequence of [90/0/90]2S were fitting using models III and IV. The fatigue life curves are depicted in Figure 8. Models III and IV accurately predicted the fatigue life of the [90/0/90]2S carbon-epoxy laminates with R2 values of 0.9714 and 0.9795, respectively. The research indicates that both S-N curve models demonstrate a high degree of fitting accuracy.
To reduce the time and financial costs associated with large-scale fatigue testing, it is necessary to employ small-sample experiments to obtain fatigue life data. Models III and IV are used to compare the fitting accuracy of laminates with different fatigue specimen groups to determine the optimal fatigue testing scheme for laminates.
Two groups of fatigue tests
The S-N curve model III contains two unknown parameters, so at least two groups of experimental data are needed to solve the unknown parameters. To ensure the fitting accuracy of S-N curve model III, one group of static tests and two groups of fatigue tests are employed to solve for the unknown parameters. The two groups of fatigue test data can be categorized into two types: Category 1 includes the one group of fatigue life data in the LCF region and another group in the HCF region. Category 2 comprises two groups of fatigue life data in the HCF region. Category 1 includes three small-sample fatigue testing schemes, which are groups A and B, groups A and C, groups A and D. Category 2 also includes three small-sample fatigue testing schemes, which are groups B and C; groups B and D; and groups C and D. The fatigue life of the six small-sample fatigue testing schemes was fitted using the two-parameter S-N curve model III, as shown in Figure 9. Compare the predictive accuracies of model III for two sample groups. (a) 1 LCF + 1 HCF. (b) 2 HCF.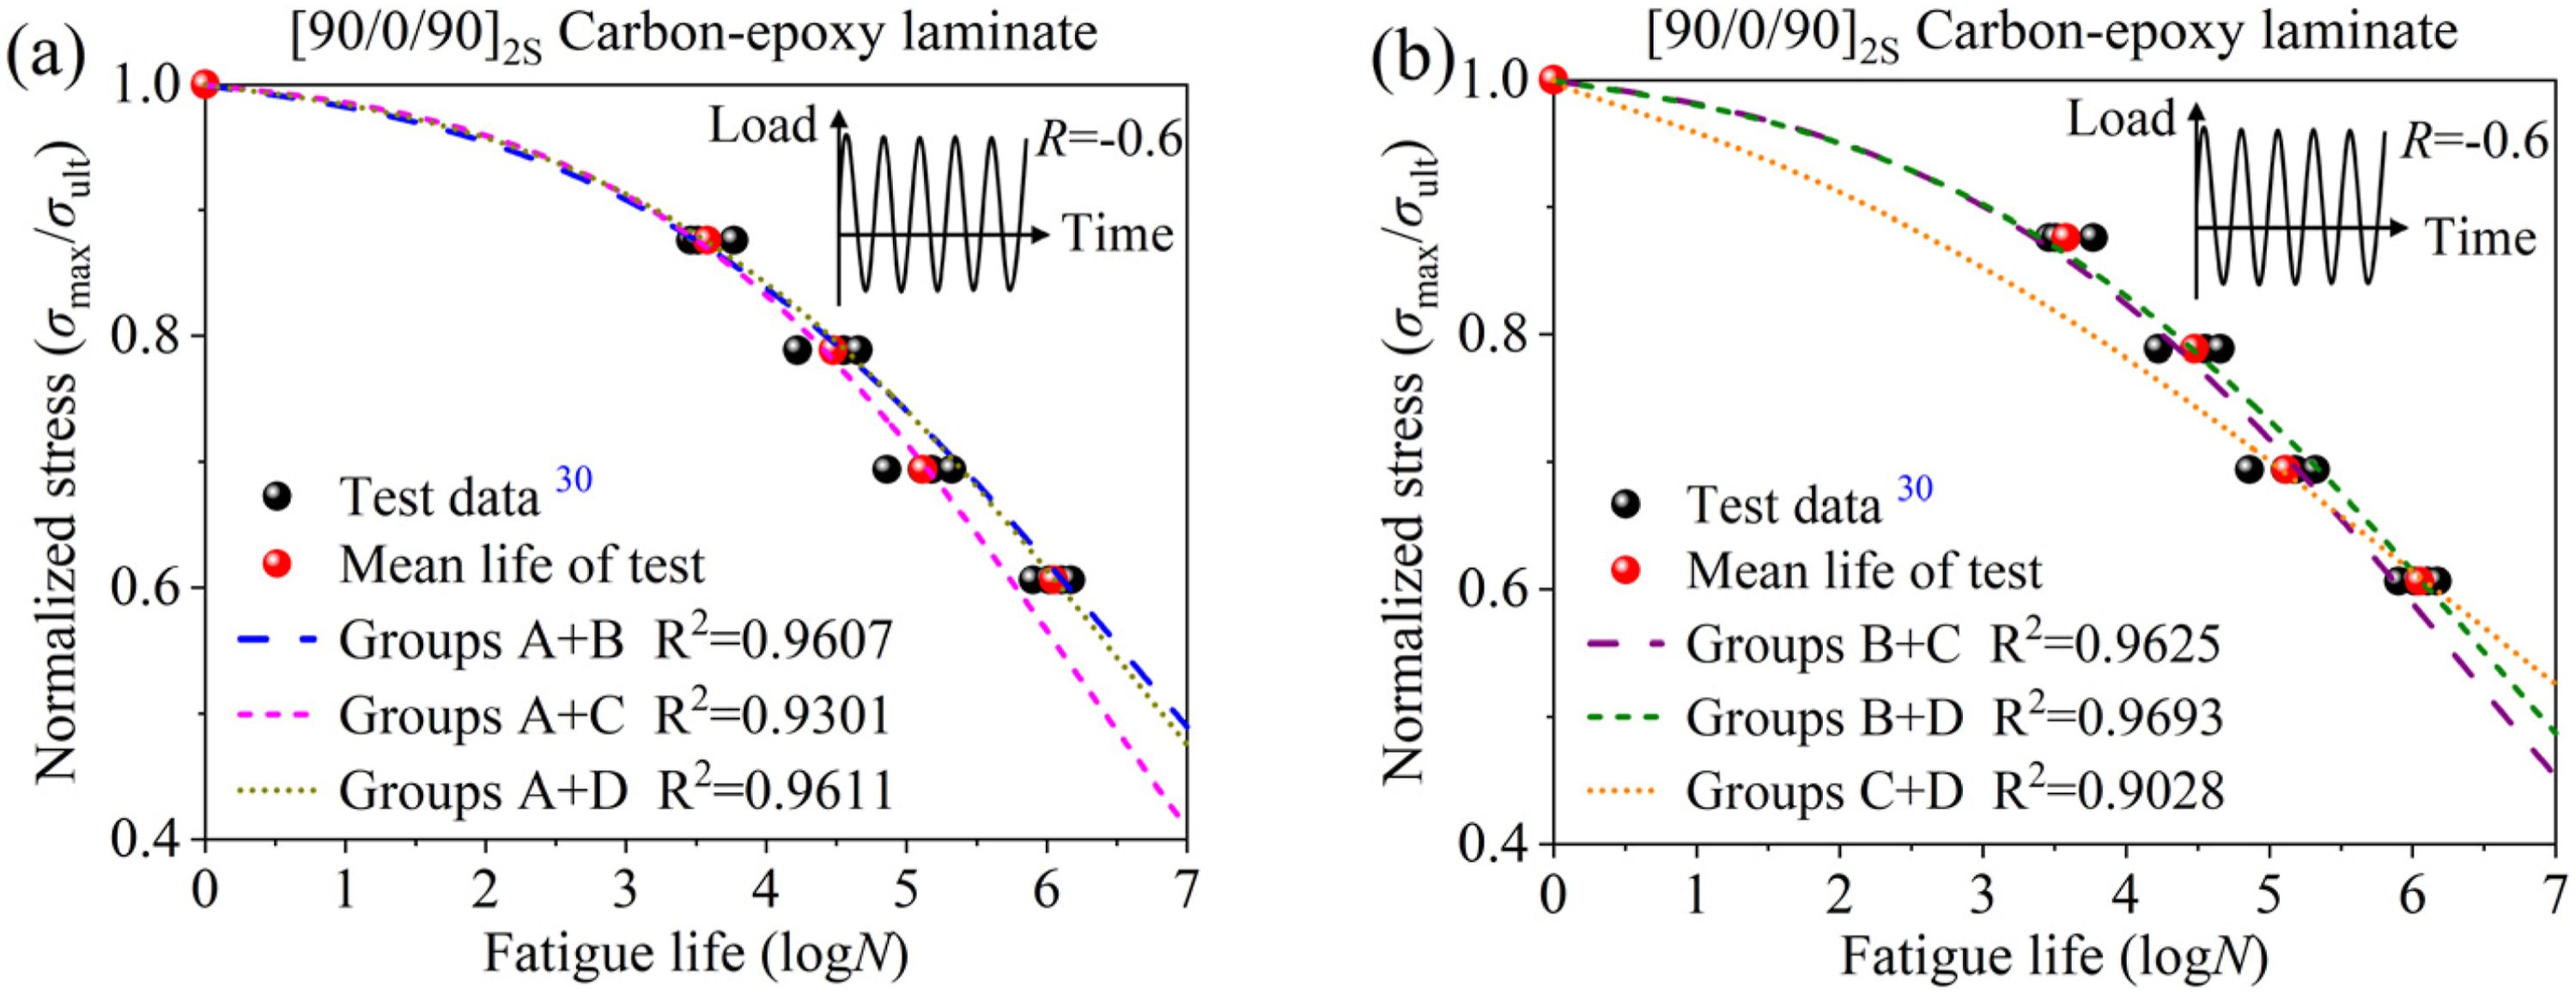
The model III was employed to fit the fatigue life of the six testing schemes, yielding the R2 of laminates, as shown in Figure 9. Among the three small-sample testing schemes in category 1, the R2 values of laminates exhibited low variability, with the maximum deviation of the R2 values being 0.0301. In contrast, the three small-sample testing schemes in category 2 displayed a higher variability in R2, with the maximum deviation in R2 values reaching 0.0665. Based on the above analysis, it can be concluded that model III demonstrates higher fitting accuracy when one group of fatigue life data in the LCF region and another group in the HCF region.
Model III was employed to characterize the fatigue life of small-sample design schemes from two groups of fatigue tests on laminates, comparing the mean and predicted life of unused fatigue sample groups as depicted in Figure 10. Analyze the three small-sample design schemes with the relatively high R2. As depicted in Figure 10, when model III is used to describe S-N curves for the testing data of sample groups A and D, the predicted life of sample group B falls within the error bars of the testing data, while the predicted life of sample group C is slightly higher than the experimental life. When model III is applied to plot the S-N curves for the testing data of sample groups B and C, as well as sample groups B and D, the predicted lives of the remaining sample groups are slightly biased towards the testing data. Considering the R2 and RMSE values of laminates, the S-N curves fitted using the testing data from sample groups A and D predicts fatigue lives that are closer to the experimental life. When one group of LCF tests at HSL and another group of HCF tests at LSL are carried out, with a significant disparity between the stress levels of the two fatigue testing groups, the predicted values of fatigue life more closely approximate the actual values. Compare the predicted life of the unused data when using model III for two sample groups. (a) 1 LCF + 1 HCF. (b) 2 HCF.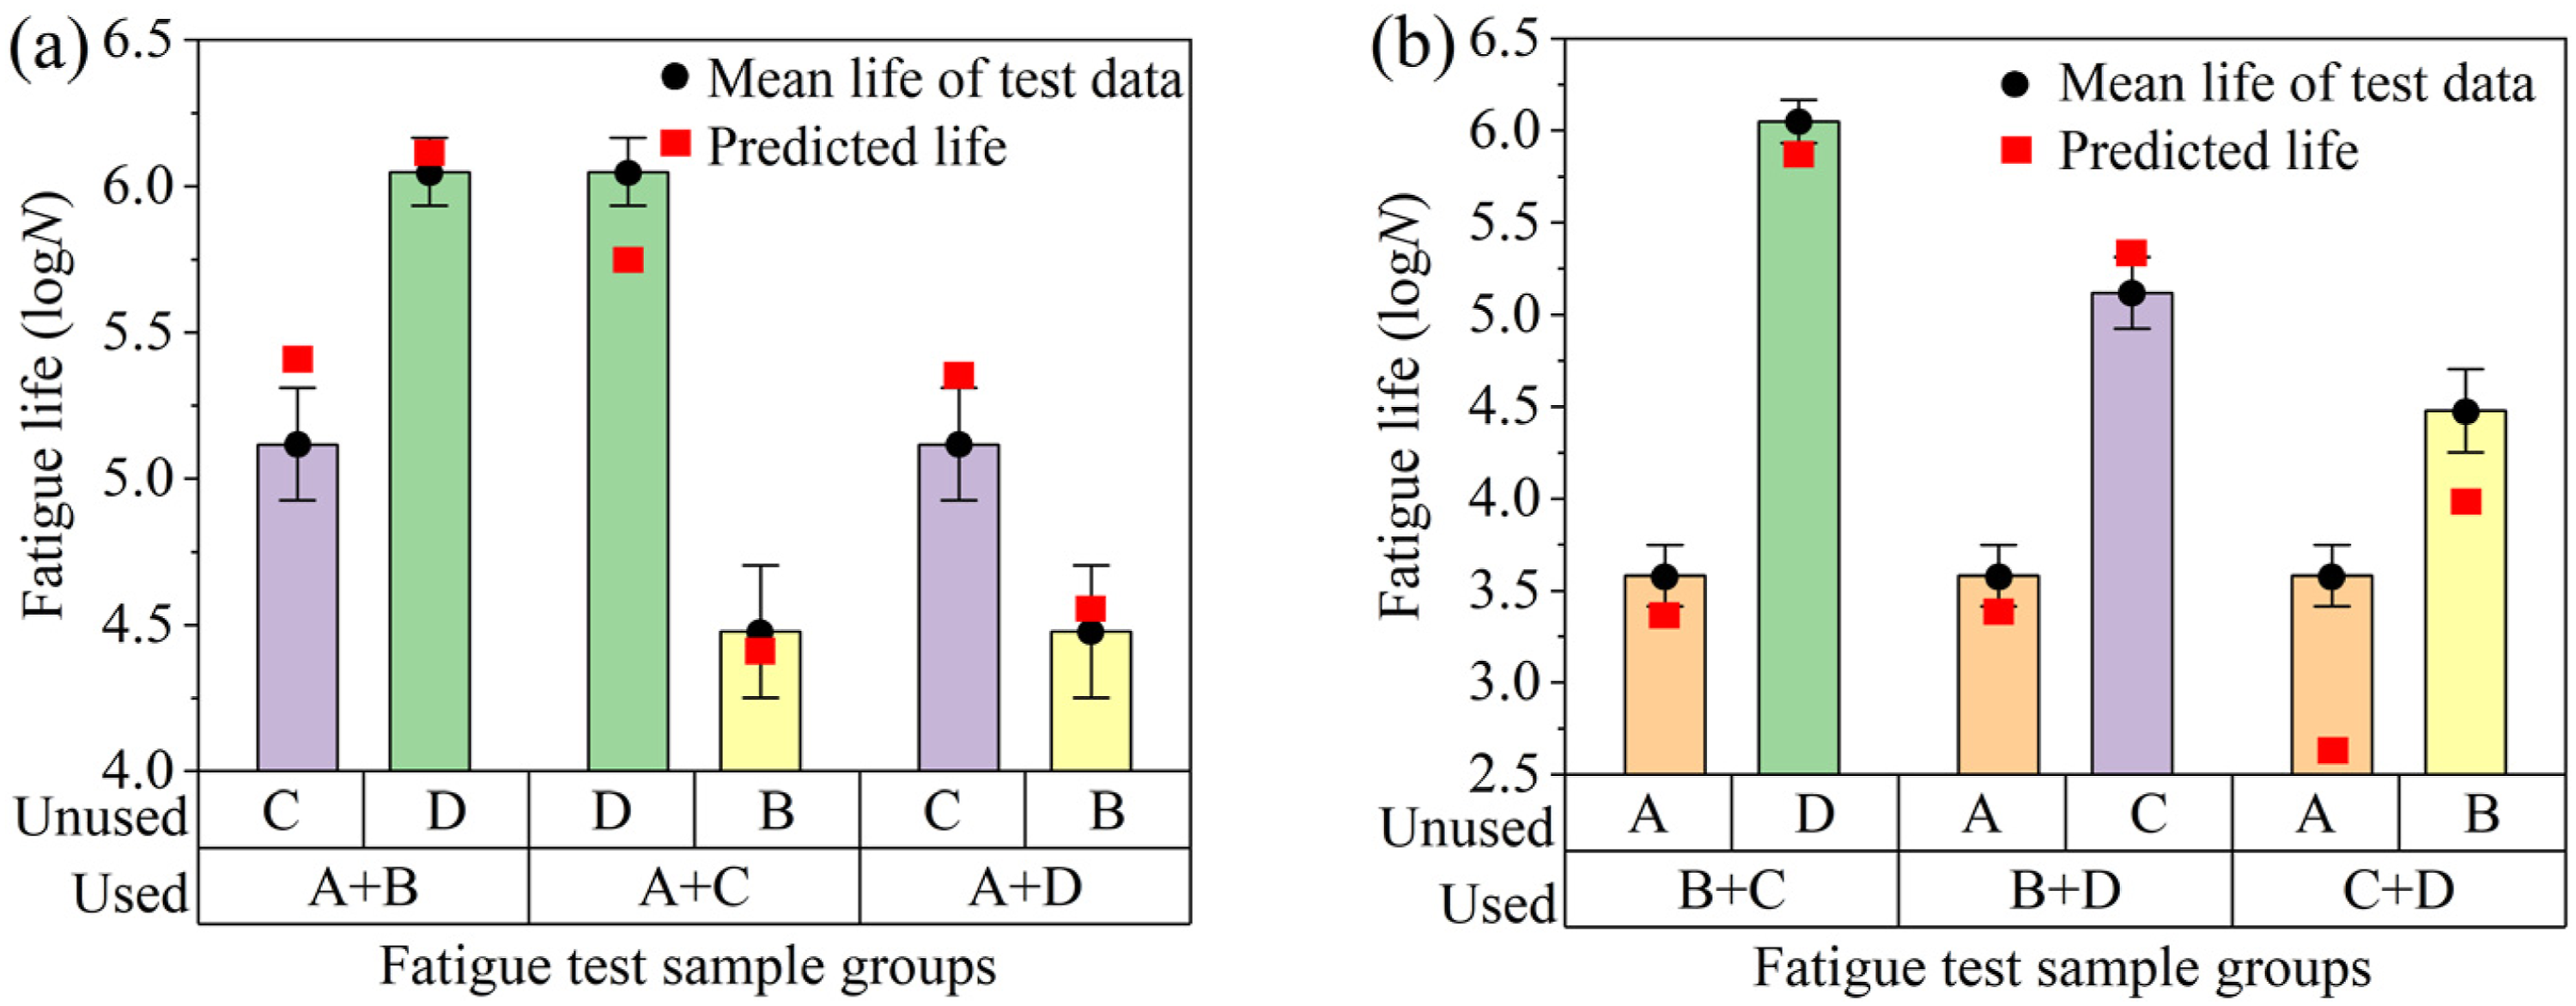
Three groups of fatigue tests
The unknown parameters of the model III are solved by one group of static tests and three groups of fatigue tests. The three groups of fatigue testing data can be divided into two categories: Category 1 consists of one group of fatigue life data in the LCF region and two groups of fatigue life data in the HCF region. Category 2 comprises three groups of fatigue life data in the HCF region. Category 1 includes three small-sample fatigue testing schemes, which are groups A, B and C, groups A, B and D, groups A, C and D. Category 2 has only one small-sample fatigue testing scheme, which is groups B, C and D. The fatigue life of the four small-sample fatigue testing schemes was fitted using the S-N model III, as illustrated in Figure 11. Compare the predictive accuracies of model III for three sample groups. (a) 1 LCF + 2 HCF. (b) 3 HCF.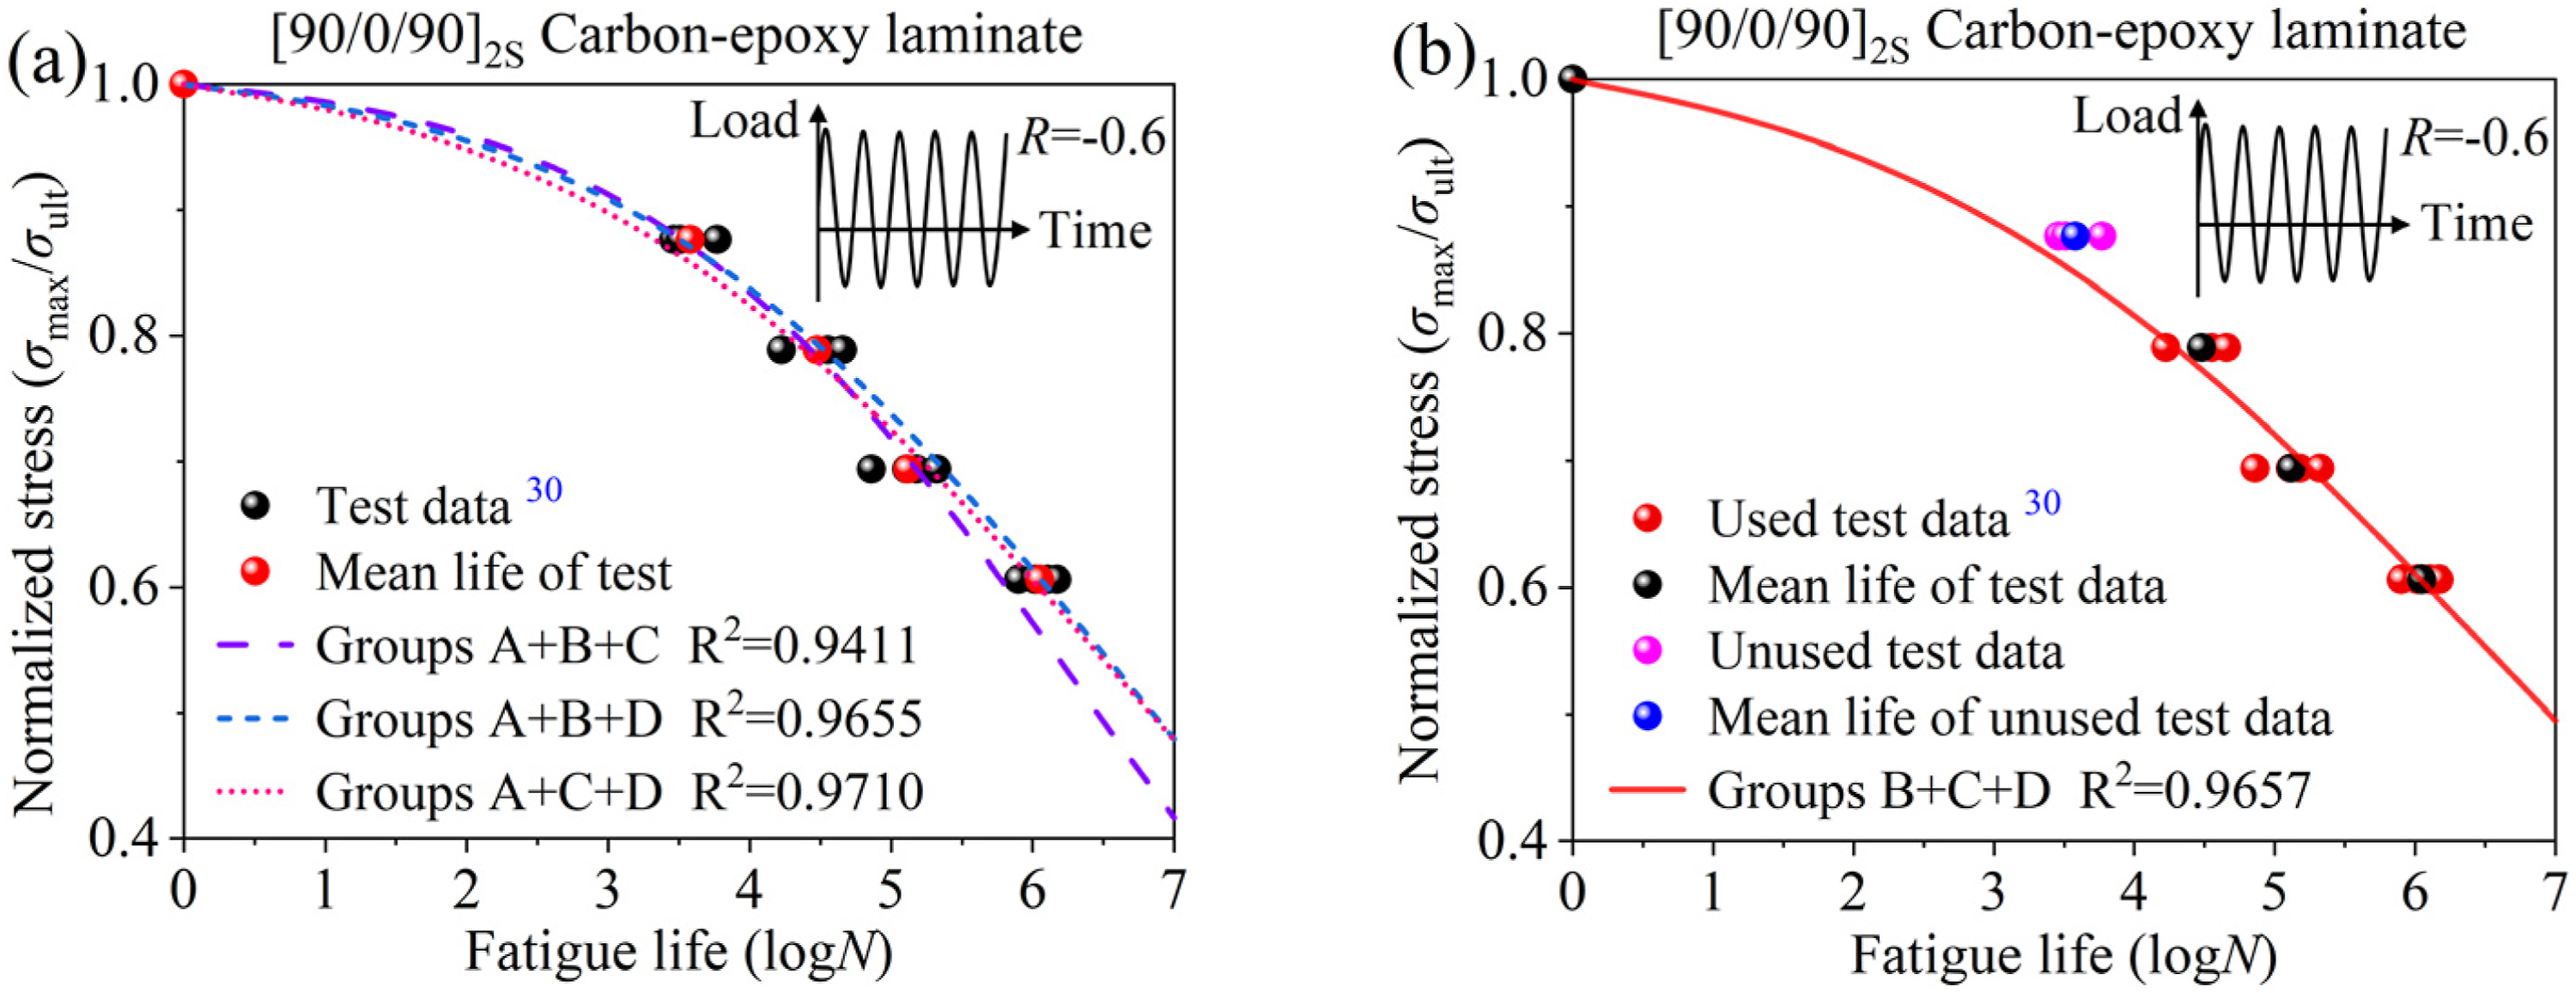
The S-N model III was utilized to fit the fatigue life of the four small-sample fatigue testing schemes, yielding the R2 values for the CFRP laminate, as shown in Figure 11. For the three small-sample test schemes in category 1, the average values of R2 for the laminate were R2 = 0.9592. For the small-sample testing scheme in category 2, the values of R2 for the laminate were R2 = 0.9657. Based on the above analysis, the small-sample fatigue testing scheme in category 2 demonstrated higher fitting accuracy. However, the difference in R2 values between category 1 and category 2 is only 0.0065, indicating that the small-sample fatigue testing schemes in category 1 also has a good fitting accuracy. The fatigue life of CFRP laminates is predicted by fitting the used test data using model III. The errors between the mean values of the unused test data and the predicted values were 4.51%, 0.14%, 0.89%, and 0.15%.
Model III was used to describe the fatigue life of small-sample design schemes from three groups of fatigue tests on laminates, comparing the mean and predicted life of unused fatigue sample group as shown in Figure 12. Only when model III is applied to fit the testing data of sample groups A, C, and D, the predicted life for sample group B aligns within the error bars of the testing data. The predicted lives for the other three small-sample design schemes are slightly biased toward the testing data. When model III is used to fit the fatigue life curve of the laminate, it is imperative to conduct a group of LCF tests at HSL and two groups of HCF tests at LSL, with the low stress values being as distinct from the high stress values as possible, to ensure that the predicted fatigue lives more closely approximate the actual values. Compare the predicted life of the unused data when using model III for three sample groups.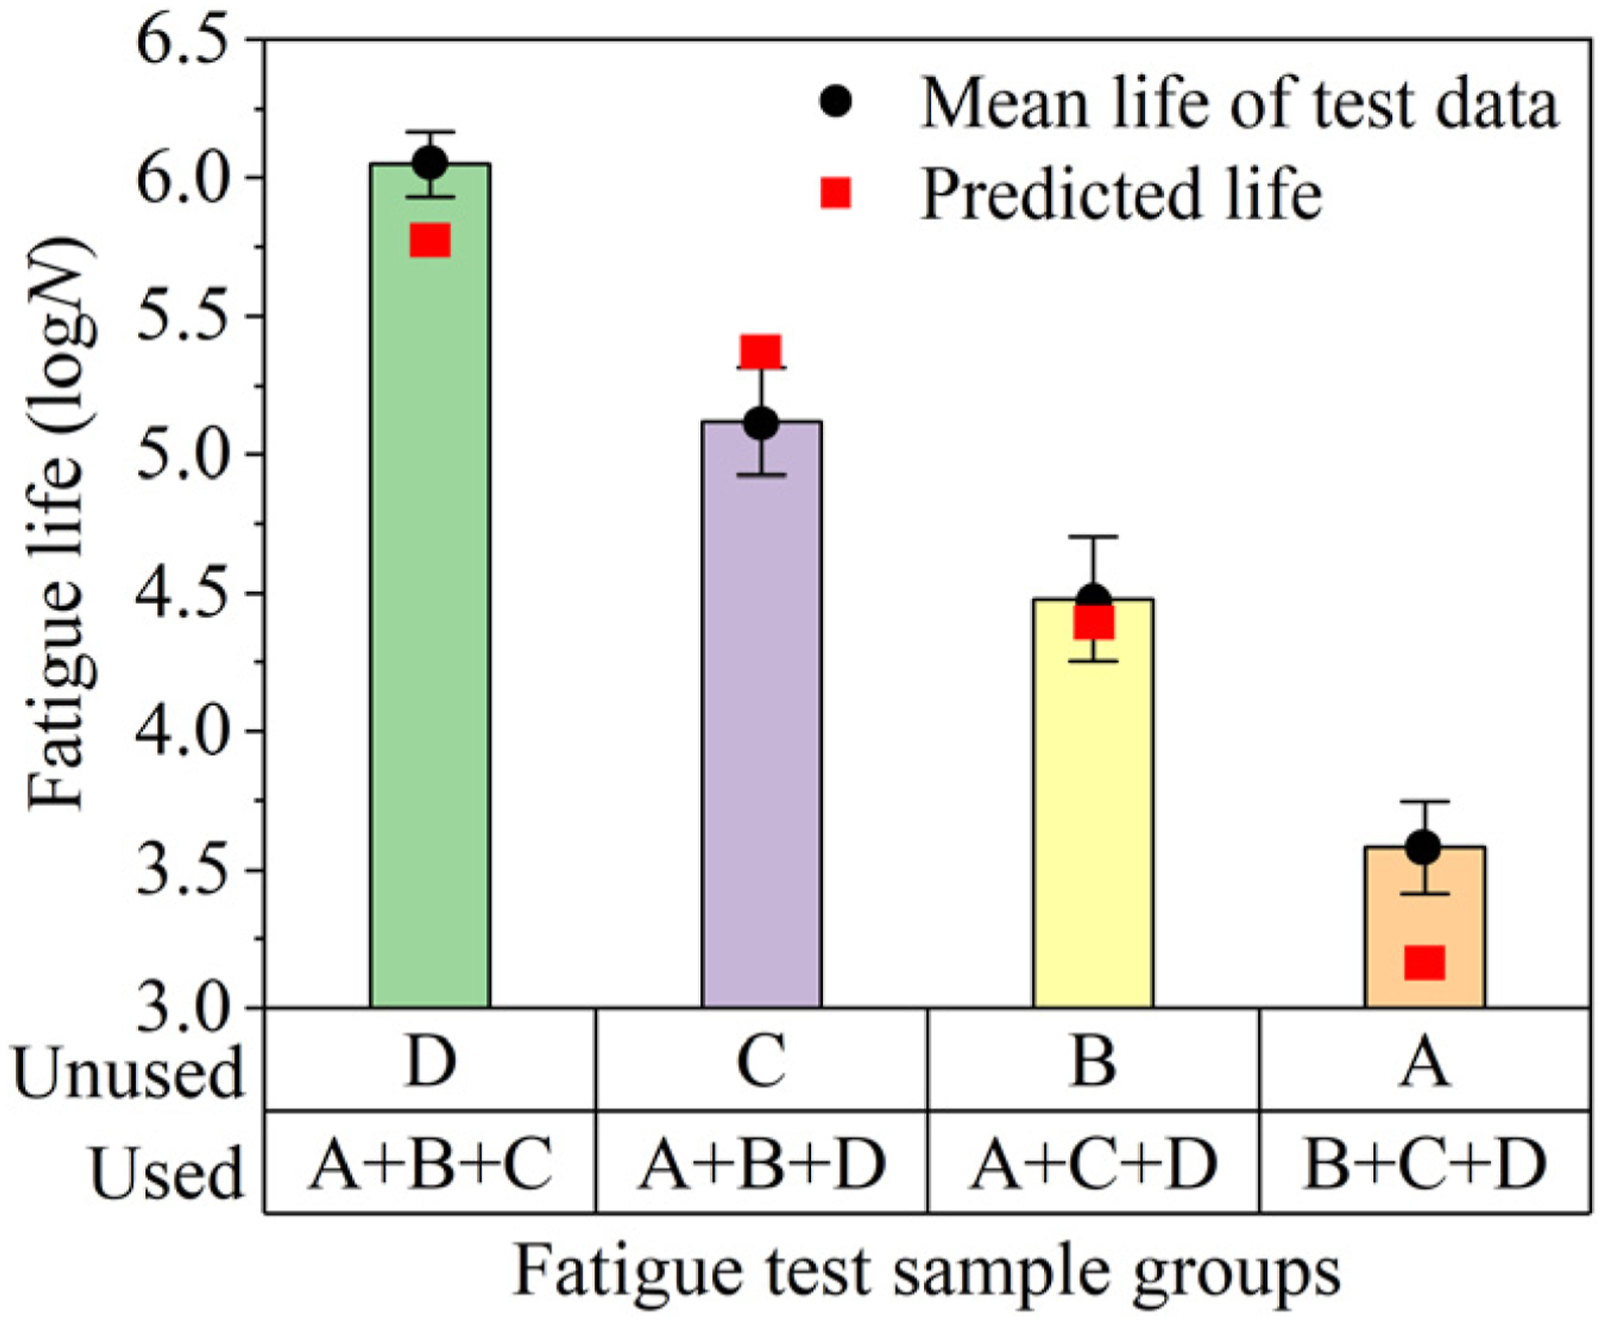
The S-N model IV contains four unknown parameters, necessitating at least four groups of fatigue testing data for the resolution of these parameters. Therefore, one group of static tests and three groups of fatigue tests are used to determine the unknown parameters of model IV. The three groups of fatigue testing data can be categorized into four small-sample fatigue testing schemes, the specifics of which have been previously described. The S-N model IV is utilized to describe the relationship between stress and fatigue life for the four small-sample fatigue tests, as illustrated in Figure 13. Compare the predictive accuracies of model IV for three sample groups. (a) 1 LCF + 2 HCF. (b) 3 HCF.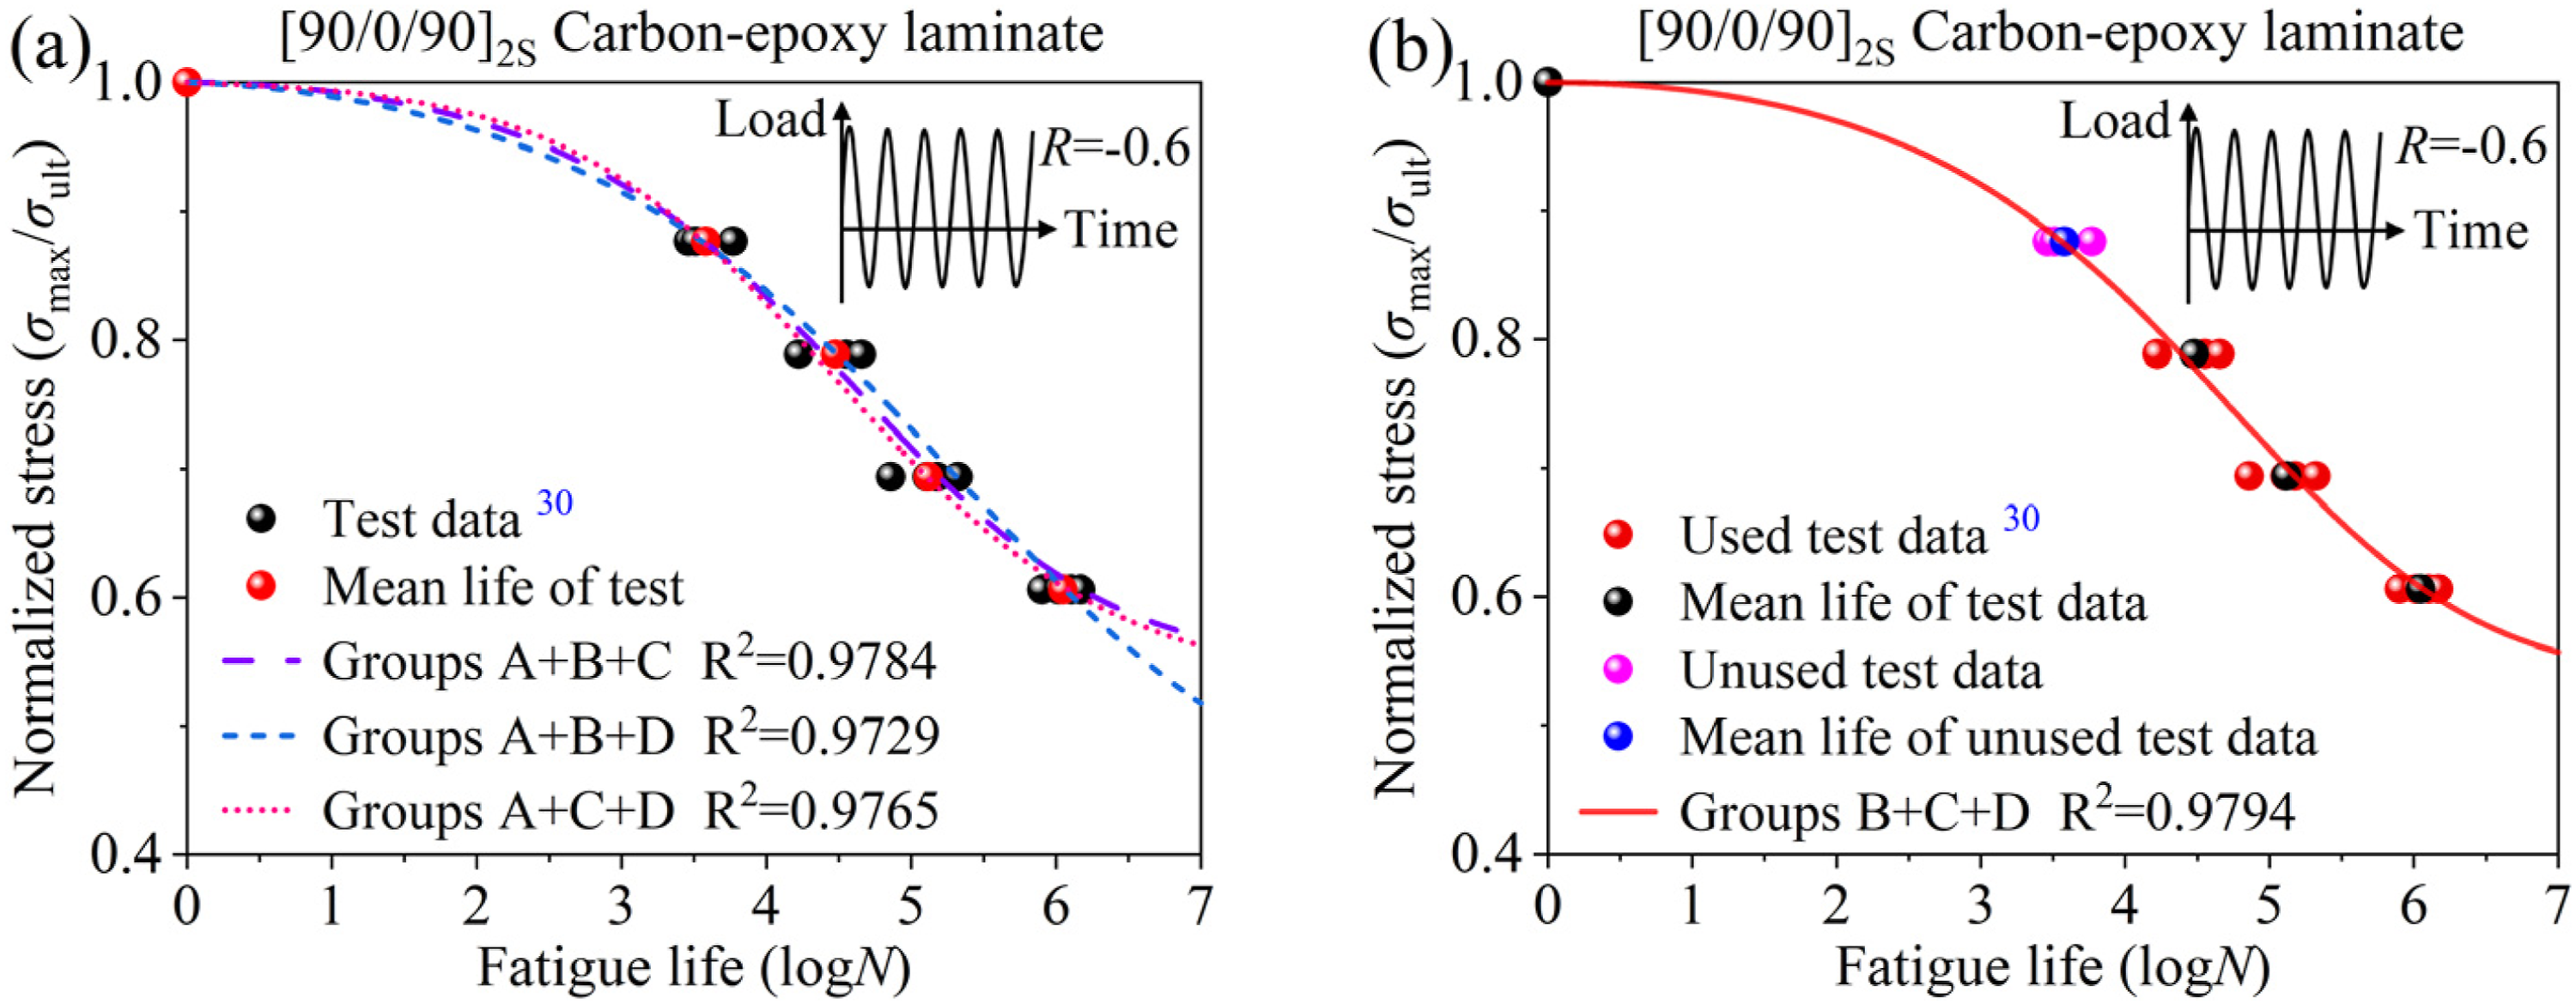
The fatigue life of four small-sample fatigue testing schemes was fitted using the S-N model IV, resulting in the R2 values for the laminate, as presented in Figure 13. For the three small-sample testing schemes in category 1, the average R2 values for the laminates were R2 = 0.9759. For the small-sample testing scheme in category 2, the R2 values were R2 = 0.9794. Based on the analysis, the small-sample fatigue testing scheme in category 2 exhibited higher fitting accuracy. However, the difference in R2 values between category 1 and category 2 is only 0.0035, indicating that the small-sample fatigue testing schemes in category 1 also demonstrates a high level of fitting accuracy. The fatigue life of CFRP laminates is predicted by fitting the used test data using model IV. The errors between the mean values of the unused test data and the predicted values were 2.07%, 0.22%, 0.56%, and 0.25%.
Model IV was utilized to characterize the fatigue life of small-sample design schemes from three groups of fatigue tests on laminates, comparing the mean and predicted life of unused fatigue sample group as depicted in Figure 14. When model III was applied to fit the testing data for two small-sample testing schemes involving sample groups A, C, and D, as well as sample groups B, C and D, the predicted fatigue lives for the remaining sample groups were observed to fall within the error bars of the experimental data. The predicted fatigue lives for the other two small-sample testing schemes were slightly biased from the experimental data. When model IV is utilized to fit the S-N curve of the laminate, two distinct small-sample design approaches were considered: one approach entails conducting a group of LCF tests at HSL and two groups of HCF tests at LSL, with the low stress values being as different as possible from the high stress values; the other approach involves performing three groups of HCF tests at LSL, which results in predicted fatigue lives that more closely approximate the actual values. Compare the predicted life of the unused data when using model IV for three sample groups.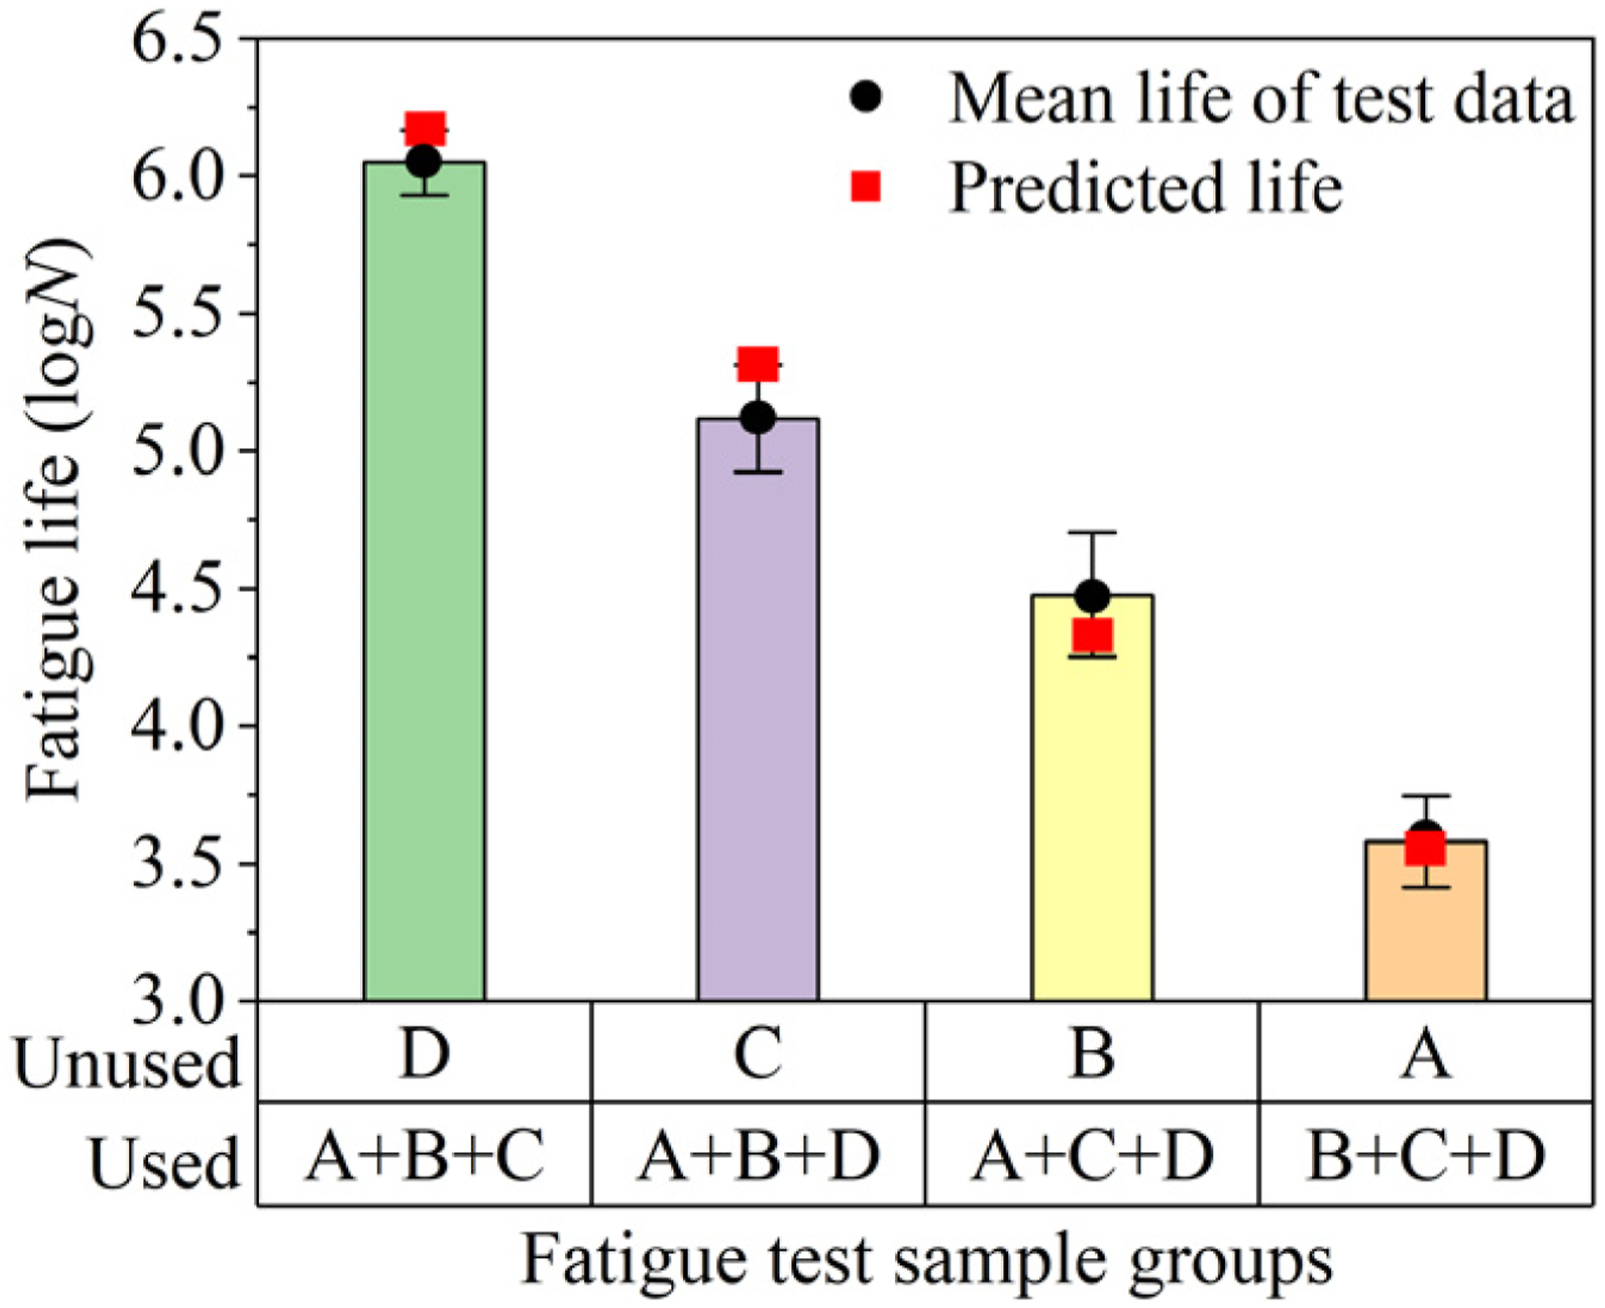
In summary, the S-N model IV demonstrated higher R2 values compared to the model III, indicating superior fitting accuracy. Therefore, when the number of groups of small-sample fatigue tests is three, the S-N model IV should be employed to predict the fatigue life of laminates.
Discussion on test reduction and selection of prediction models
The reasons for reducing the number of fatigue tests required for laminate fatigue life prediction are described below. Owing to the physical interpretability inherent in the model parameters and the treatment of static strength as representative of a single fatigue cycle, the constructed S-N curve model facilitates highly accurate predictions across the entire lifetime domain, necessitating only one suite of static strength tests in conjunction with two to three sets of fatigue tests. This approach, which constrains parameter identification via physical mechanisms, substantially mitigates the risk of overfitting and is particularly well-suited to small-sample scenarios. Notably, model III exhibits superior performance under two sets of fatigue tests, whereas model IV attains enhanced predictive accuracy when a greater number of test groups are employed.
The model selection is guided by the amount of available data, following the outline below: (1) If one set of quasi-static ultimate strength tests along with two sets of fatigue tests are conducted, a combination of one LCF and one HCF group with clearly differentiated stress levels is recommended, using model III for life prediction. (2) If three sets of fatigue tests are performed, either one LCF plus two HCF groups or three HCF setups can be used, with model IV providing high prediction accuracy in both cases. (3) For four sets of fatigue tests, a setup consisting of one LCF and three HCF groups is suggested, again prioritizing model IV.
In all cases, sufficient variation in stress levels must be ensured to improve model applicability and prediction accuracy.
Reliability verification based on fatigue test
Specimens fabrication and fatigue test
The laminate specimens are manufactured from E-glass fiber/epoxy resin prepreg provided by Weihai Guangwei Composites Co., Ltd. through a high-temperature molding process. The lay-up sequences of the laminates were [0]16, [90]16, [45]16, and [0/90/45/90/-45/0/90/0/]S.
Quasi-static tensile tests and tension-tension fatigue tests were conducted on the MTS testing machine, with a stress ratio of R = 0.5. To prevent overheating during testing, the loading frequency of 10 Hz was employed. The testing environment was maintained at room temperature, with the temperature controlled at 25 ± 3°C and the relative humidity at 50% ± 10%. The fatigue tests were carried out in accordance with the standard GB/T 35465.3-2017. At least three specimens were tested effectively for each sample group.
Initially, quasi-static tensile tests were conducted, and the ultimate tensile strength (UTS) of the laminate was obtained by averaging all effective results. Subsequently, fatigue tests with stress levels of 93% UTS, 80% UTS, and 67% UTS were conducted. The glass fiber reinforced plastics (GFRP) composite specimens and the testing setup are depicted in Figure 15. GFRP composite laminate specimens and testing setup.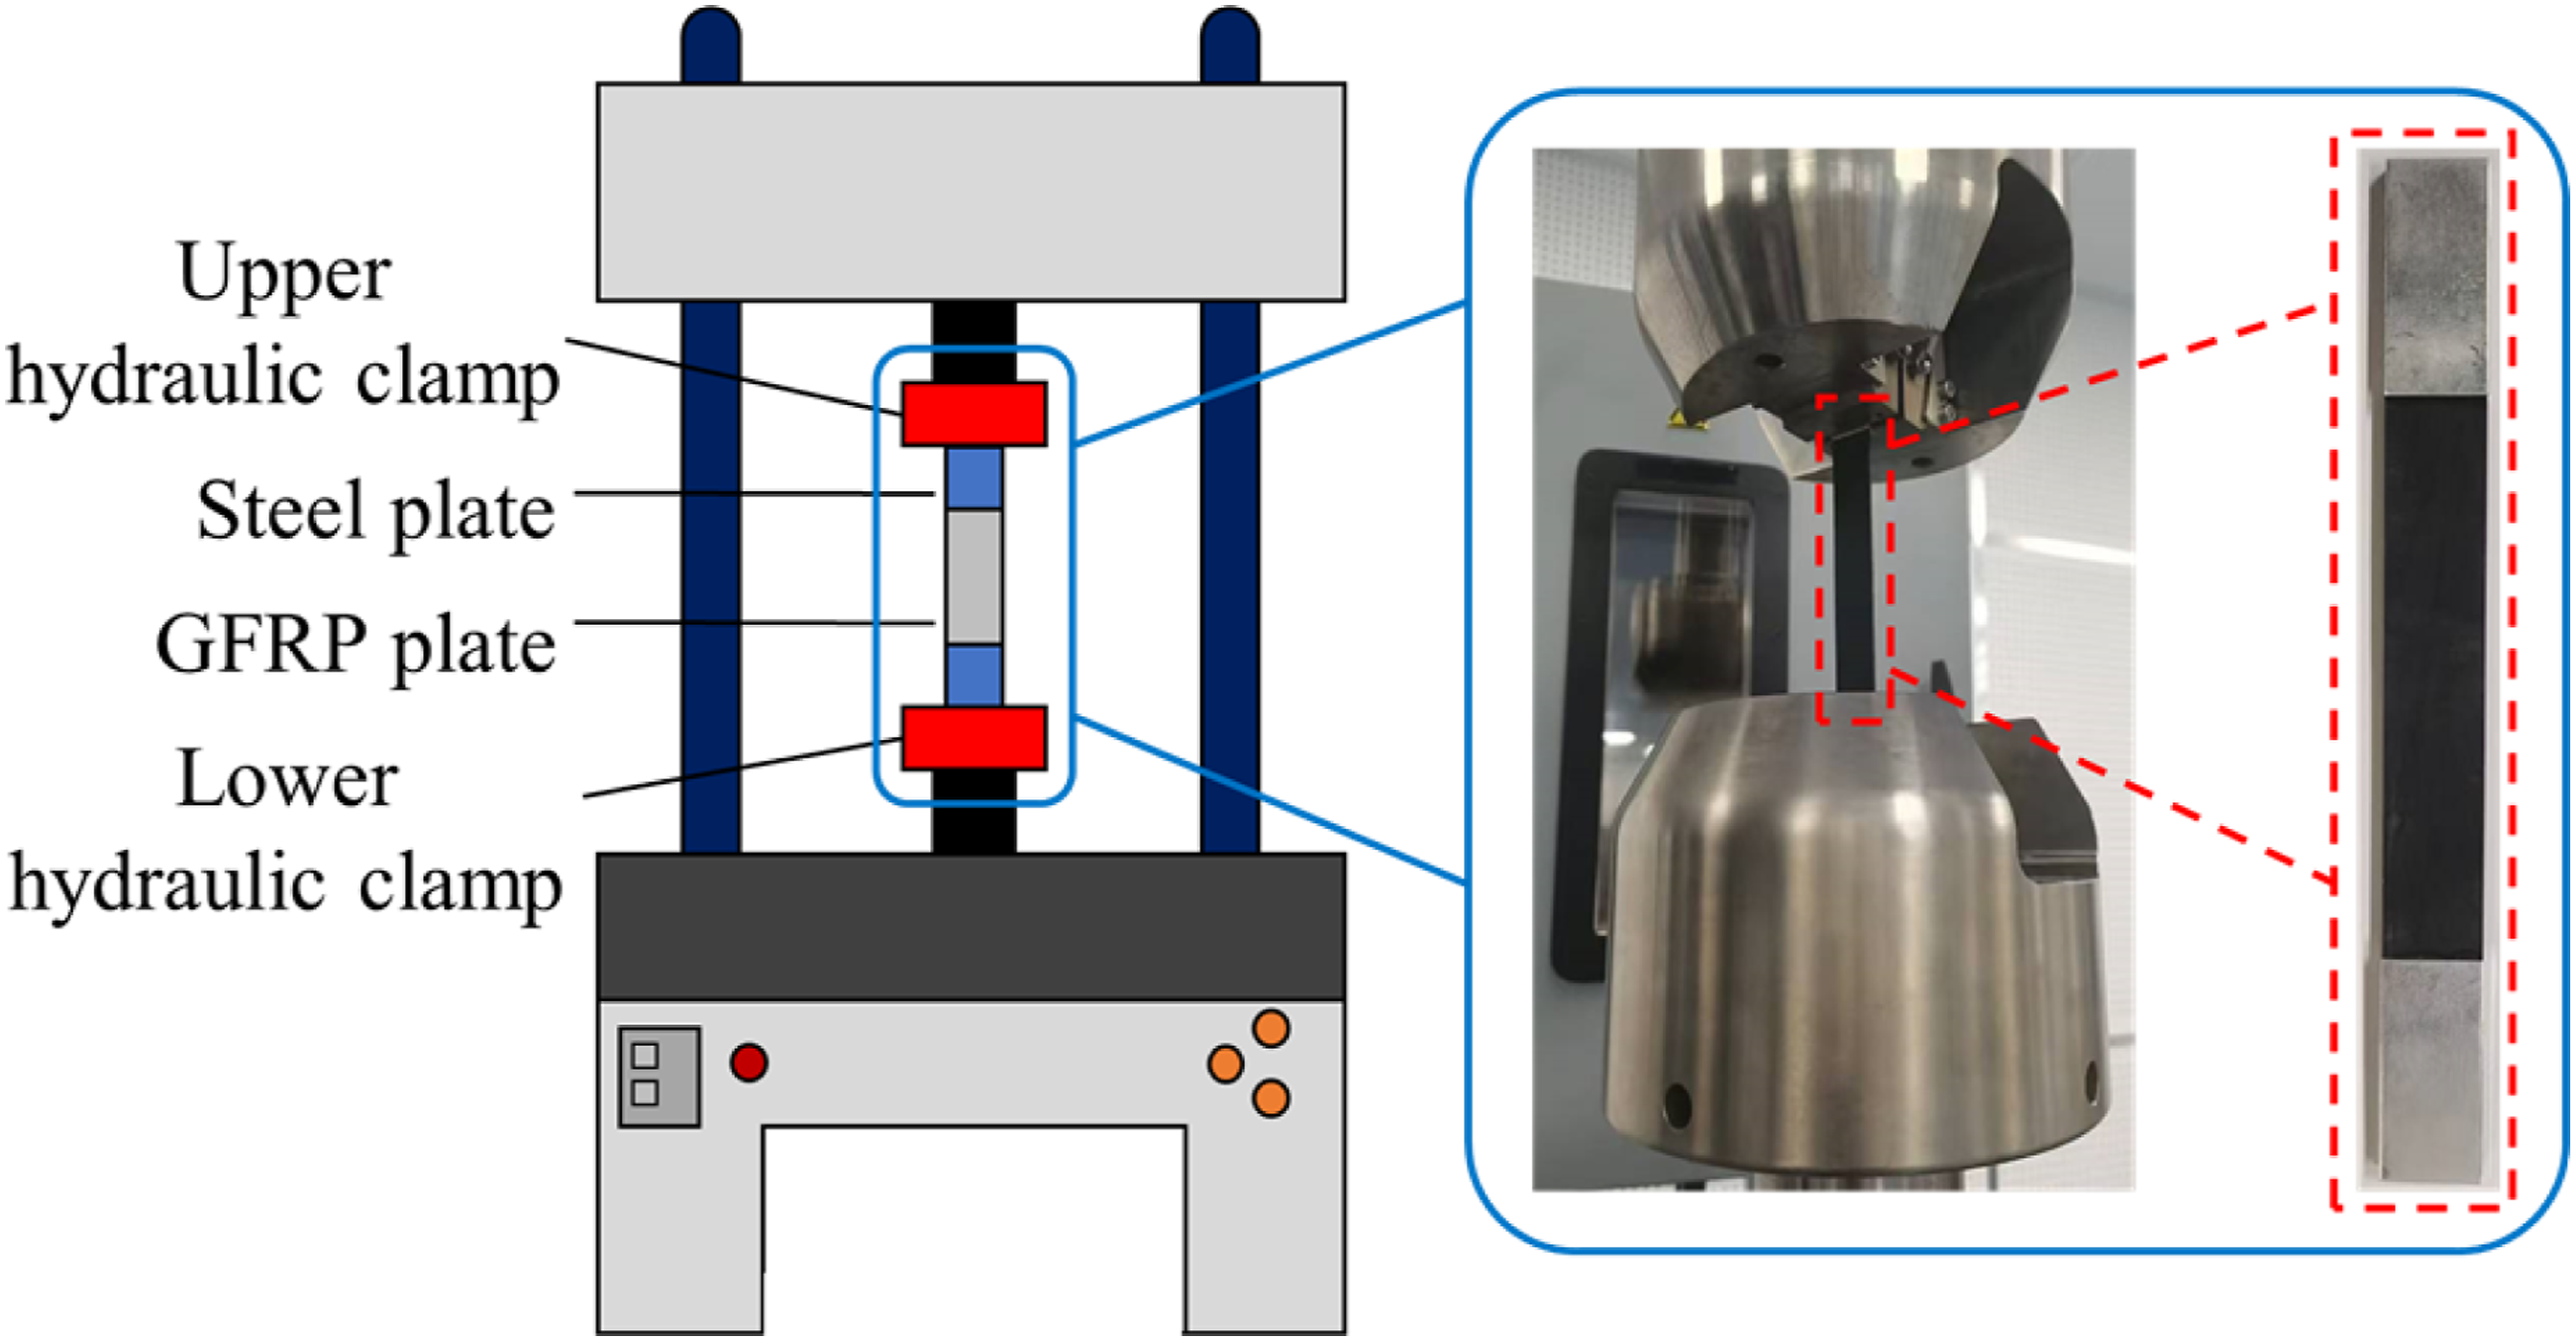
Reliability verification on model IV
In Figure 16, the fatigue life prediction accuracy of the four proposed and five classical models are compared with our test data using both R2 and RMSE. The samples are fabricated from GFRP laminates with four kinds of different stacking sequences. The results indicate that all four developed models exhibit excellent and consistent predictive accuracy, with all R2 > 0.95 and RMSE<0.03, and model IV demonstrates the highest prediction accuracy. Prediction accuracy comparison of GFRP laminates with different lay-up sequences. (a) and (b) R2. (c) and (d) RMSE.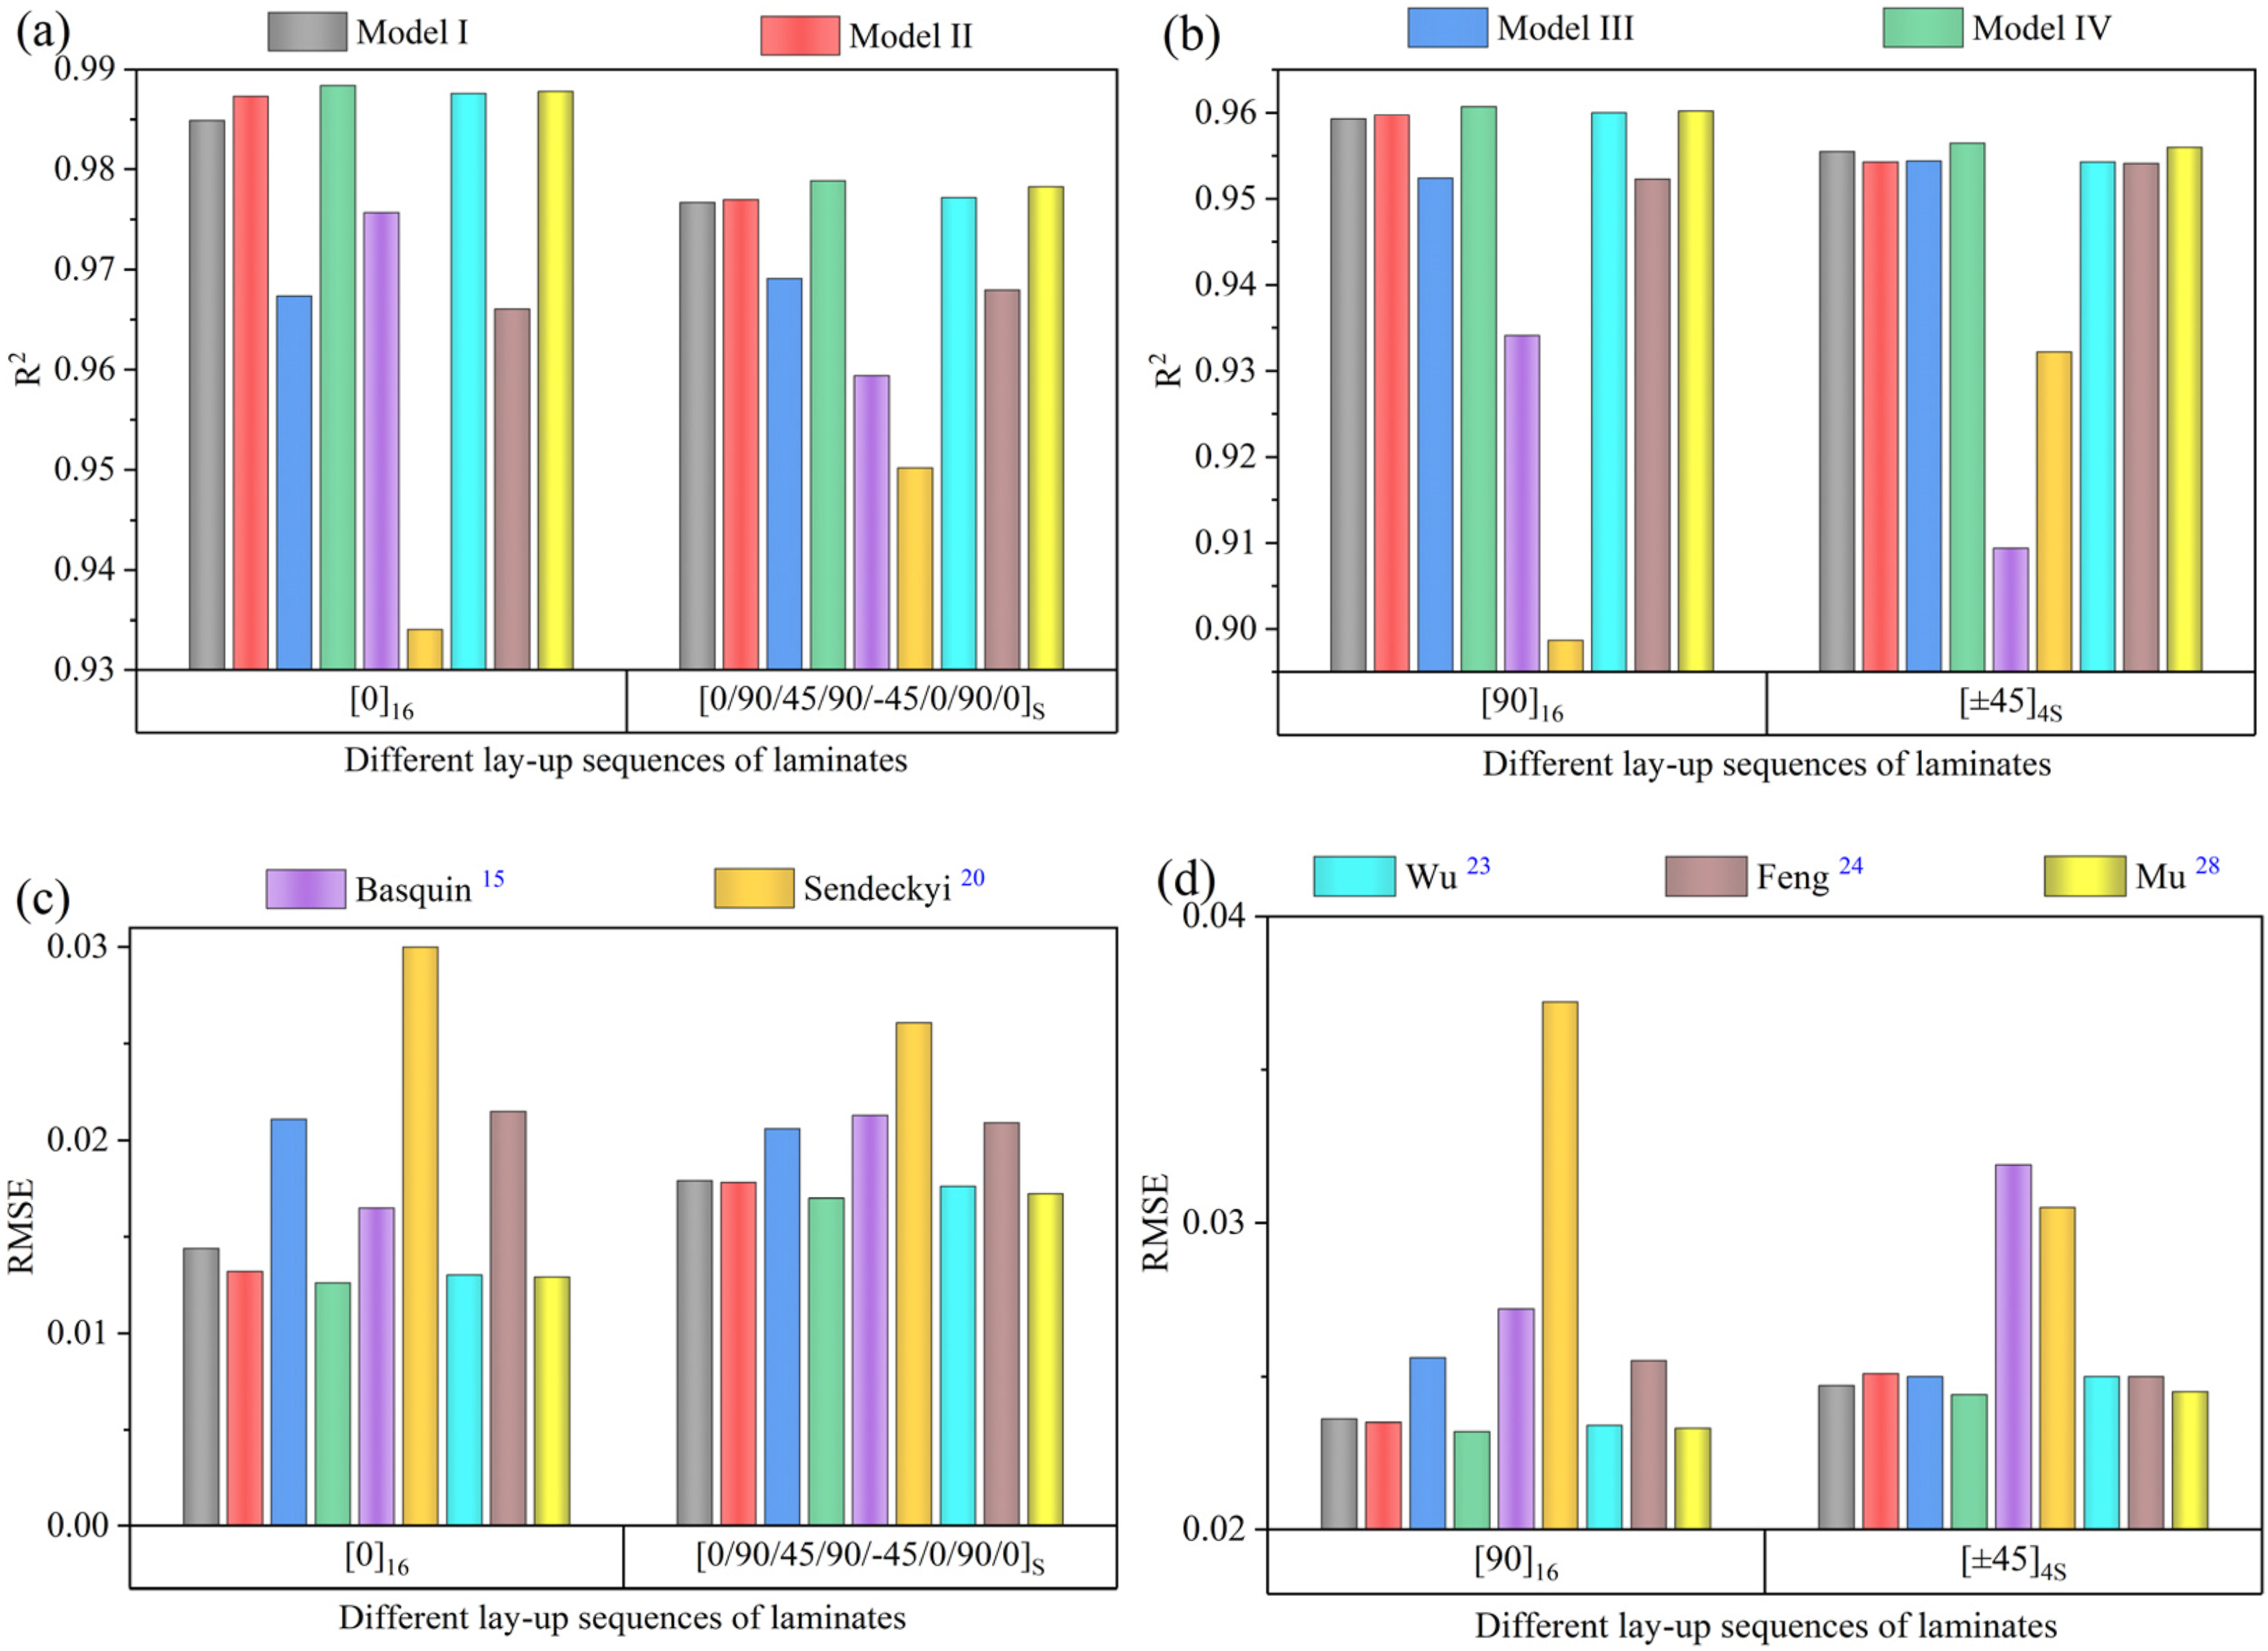
The fatigue life of GFRP laminates with various lay-up sequences were fitted using the S-N model IV, and the resulting fatigue life curves along with the 95% confidence and prediction intervals are illustrated in Figure 17. The R2 for the average fatigue life of the [0]16 laminate is 0.9997; for the [90]16 laminate, it is 0.9981; for the [45]16 laminate, it is 0.9926; and for the [0/90/45/90/-45/0/90/0]s laminate, it is 0.9979, which indicates that model IV has good fitting accuracy. Fatigue life curve of different GFRP laminates within 95% confidence interval. (a) [0]16, (b) [90]16, (c) [45]16, and (d) [0/90/45/90/-45/0/90/0]S GFRP laminates, respectively.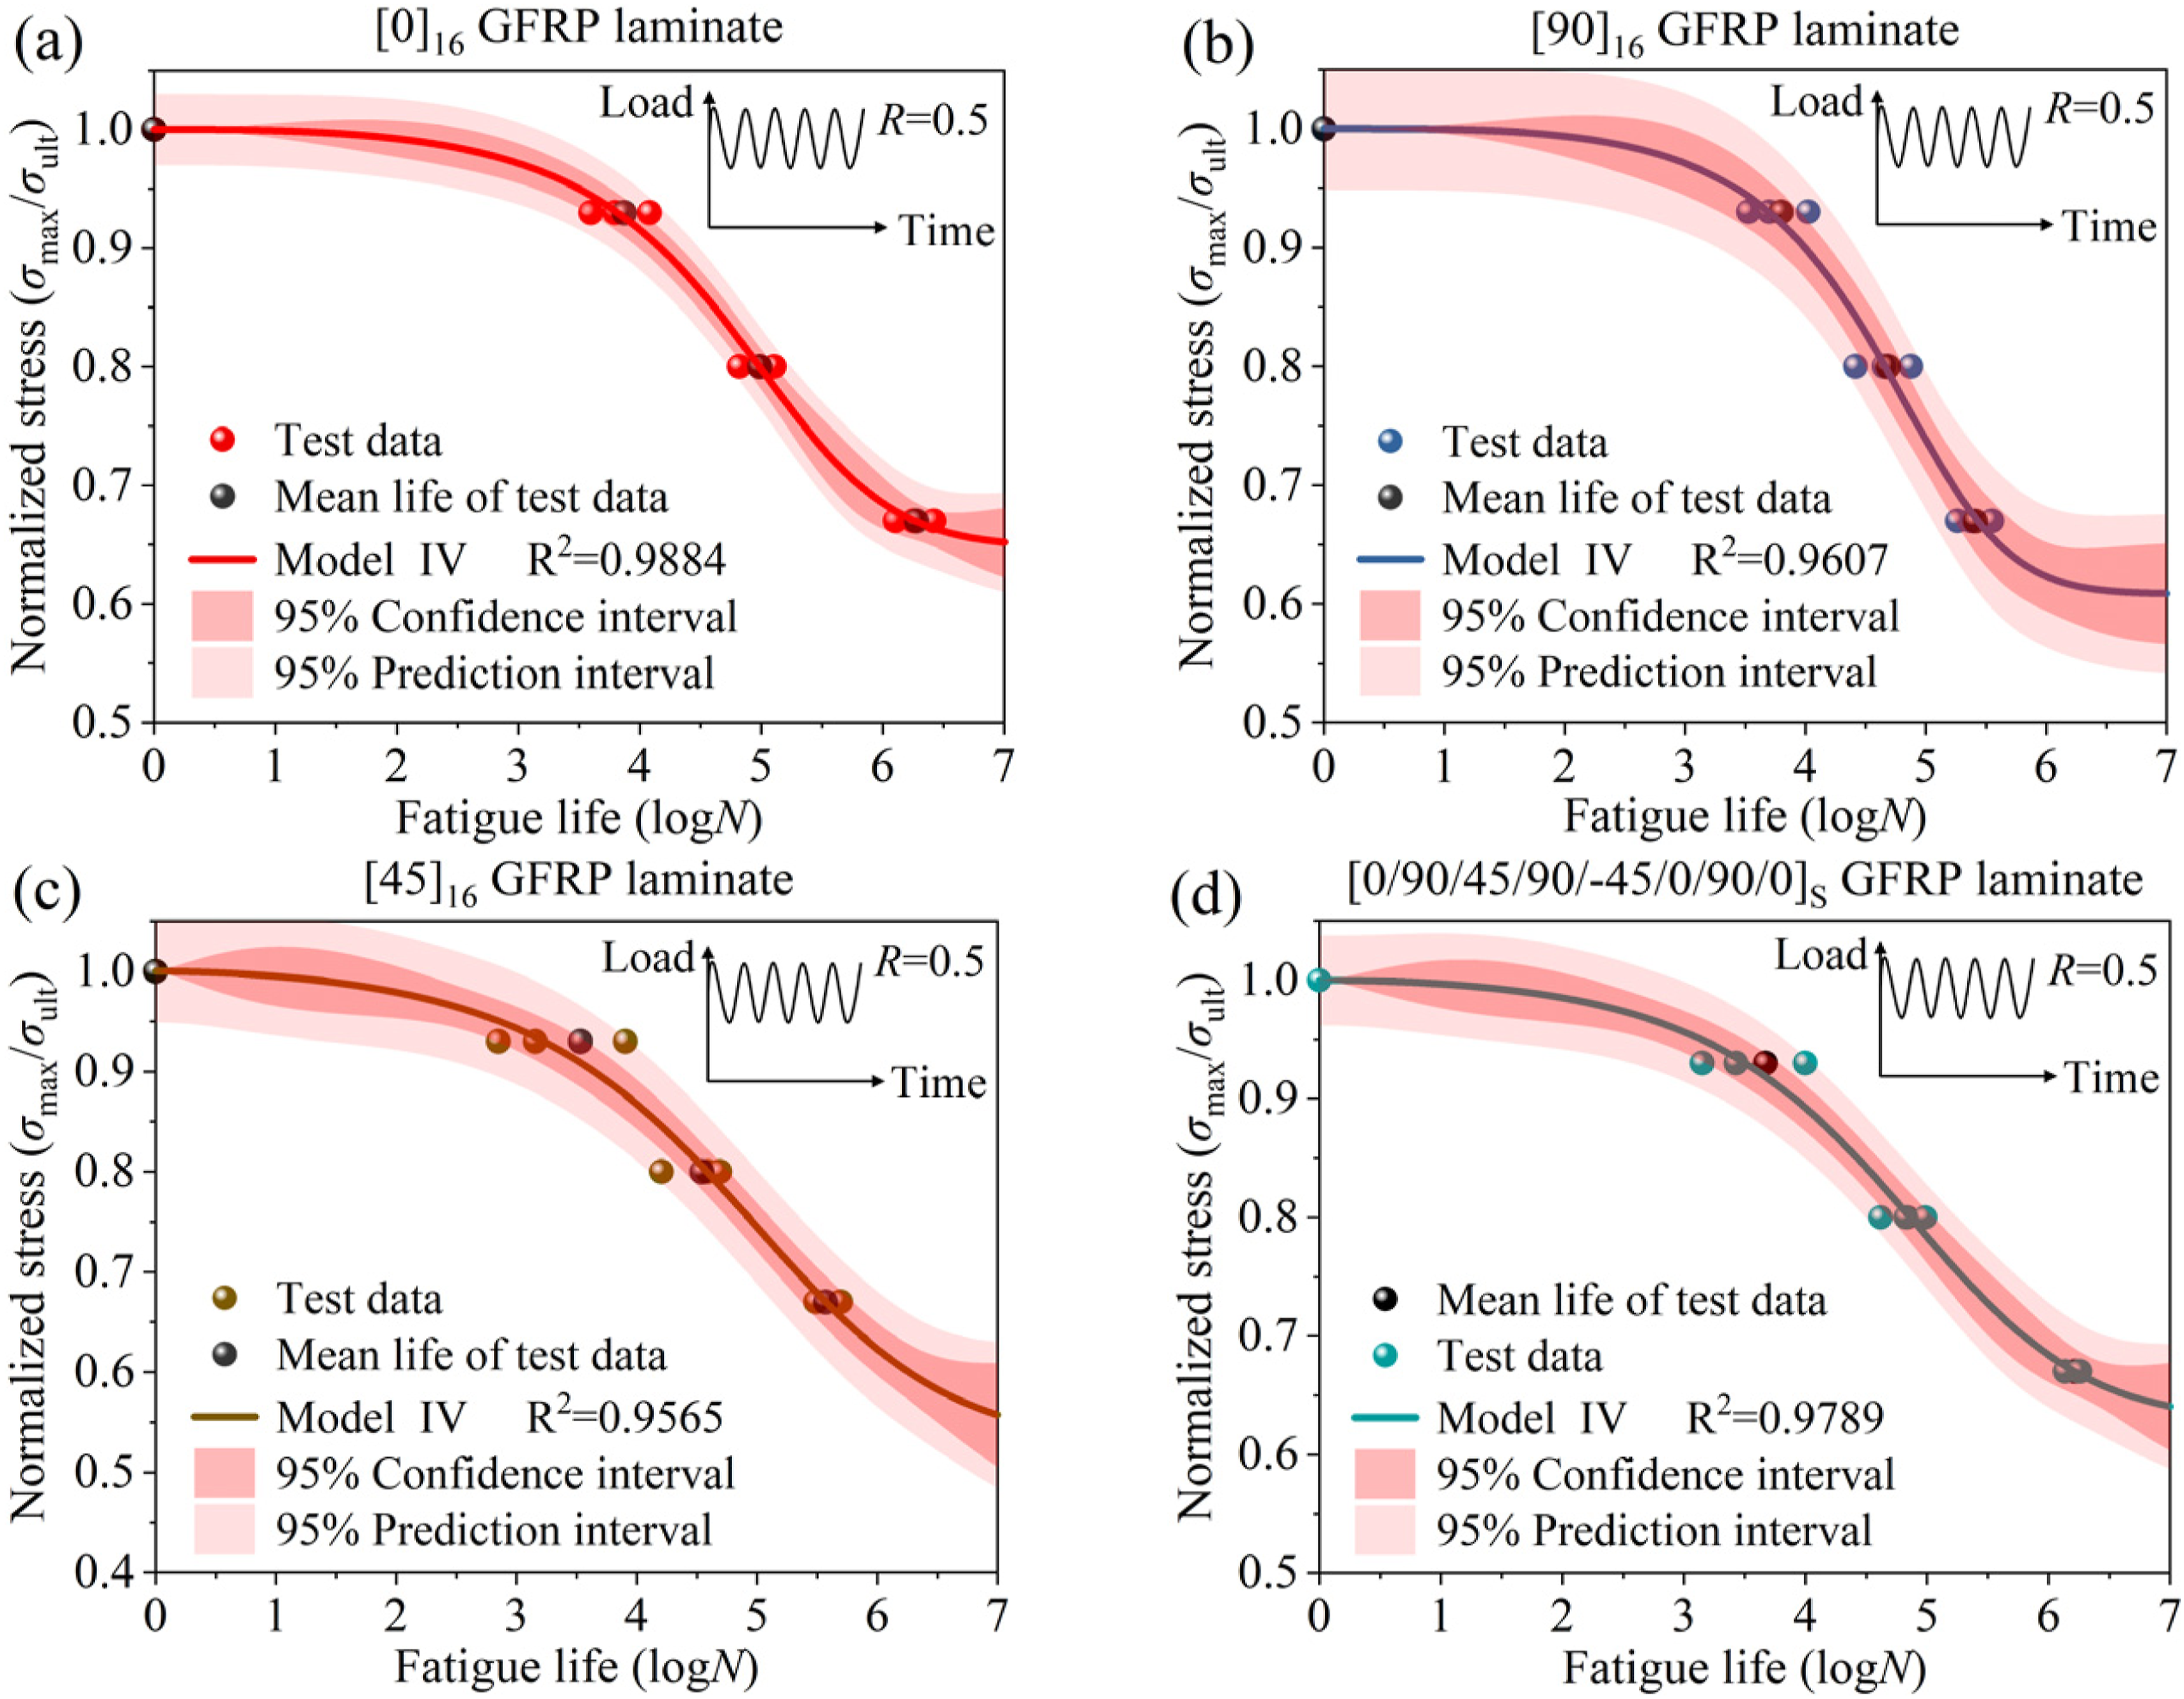
This investigation employed specimen groups encompassing varying stress levels to perform fatigue testing on GFRP laminates. Based on the acquired data, the t-distribution was used to calculate 95% confidence intervals for the S-N curve model’s predicted values, thereby ensuring the statistical significance of the evaluation across the entire life prediction range.
The results of this study indicate that model IV shows acceptable predictive consistency using a test scheme with one HSL and two LSL. The standard deviation in fatigue life for GFRP specimens remained below 0.4. Most experimental data points fall within the 95% confidence interval produced by the model, confirming the high prediction accuracy and reliability of the S-N curve while meeting engineering confidence requirements. Only one high-stress samples showed slight deviations, with their fatigue life being marginally underestimated. These differences mainly arise from the inherent heterogeneity of composites, manufacturing variations, and test environment factors, which together lead to increased variability in fatigue data at high stress levels. However, this statistical deviation range is within expectations and does not affect the overall model validity or confidence assessment, proving that the fitting results obtained from limited stress-test data have high value for engineering applications.
Conclusions
To facilitate the acquisition of the material-level S-N curve, which serves as the input for FE simulations, and to enable rapid determination of material type, fiber orientation, and stacking sequence during the conceptual design of FRP laminated structures in industry, a small-sample fatigue testing strategy is proposed based on full-range unified S-N curve models. In comparison with several existing classical models, the proposed approach not only improves predictive accuracy but also reduces testing requirements, while ensuring that all parameters retain clear physical meanings. The main conclusions are as follows: (1) According to the available testing data, four unified S-N curve models achieving full-range and high-precision have been formulated and verified experimentally. They were created using logistic functions combined with power functions and exponential functions. For multiple application scenarios characterized by variations in materials, stacking sequences, and types of loading, most of them have accuracy matching or exceeding that of five widely used S-N models, with the lowest R2 value above 0.93, and model IV shows the highest fitting accuracy. (2) A small-sample fatigue testing and model selection method suitable for full-life assessment has been proposed. When only two fatigue tests are available, a “1 LCF + 1 HCF” testing scheme is adopted, and model III is selected for prediction. When three fatigue tests are available, either a “1 LCF + 2 HCF” or a “3 HCF” scheme is implemented, using model IV. With four fatigue tests, a “1 LCF + 3 HCF” scheme is employed, again with model IV. Validation testing on GFRP laminates showed that this strategy reduces the number of test groups to 3, with the vast majority of data points within the 95% confidence band, and reduces testing cost and time by 40%. (3) The physical relationships between model parameters and the fatigue resistance of laminates have been elucidated. Parameter α controls the transition point between LCF and HCF regions. As the absolute value of α increases, the number of cycles needed to reach the HCF region decreases, indicating worse fatigue resistance of the laminate. Parameters β, λ, and ζ control the fatigue strength reduction exponent. Increases in the absolute values of β, λ, and ζ correspond to greater sensitivity of fatigue life to stress changes, meaning reduced fatigue resistance. Parameter η controls where the fatigue life approaches the fatigue limit. As the absolute value of η increases, the fatigue limit increases, showing better fatigue resistance. The strong interpretability of these parameters provides a theoretical basis for optimizing engineering test plans.
The S-N curves in this paper correspond to the fatigue life at a 50% probability of fatigue, and the FRP laminates are just limited to polymer-based composite materials. In the future, the statistical relationship between stress and fatigue life under different failure probability and more material types should be explored.
Footnotes
Author contributions
Funding
The authors disclosed receipt of the following financial support for the research, authorship, and/or publication of this article: This work was supported by the National Natural Science Foundation of China (No. 52072019). The support is gratefully acknowledged.
Declaration of conflicting interests
The authors declared no potential conflicts of interest with respect to the research, authorship, and/or publication of this article.
Data Availability Statement
Data will be made available on request.