
Abstract
Thermal stresses and residual deformations in composite structures arise from the mismatch in the coefficients of thermal expansion (CTE) between fibers and the resin, chemical shrinkage during curing, and non-uniform temperature distributions through the laminate thickness. These effects cause shape distortions such as spring-in, spring-out, and warpage, which increase tooling correction effort and manufacturing time. In large-scale composite structures, repeated mold modification is particularly costly, and therefore a practical prediction method is required.
This study proposes a practical methodology to predict the thermal residual deformation of a 4 m-scale composite structure manufactured via the resin transfer molding (RTM) process. The approach employs coupon-level segment panels fabricated under processing conditions identical to those of the full-scale structure. The fiber volume fractions (FVFs) of the segment panels were experimentally characterized and used to establish an effective segment-level calibration procedure that accounts for manufacturing-induced ply-wise variability. The calibrated FVF distributions were then transferred to the full-scale finite element model without further adjustment using the full-scale deformation data. The proposed methodology was validated using a 4 m-scale composite main wing structure, achieving a maximum prediction error of 5.4% (approximately 0.214 mm), thereby demonstrating its practical applicability and reliability for large-scale composite structures.
Introduction
Thermal stresses in composite materials arise primarily from mismatches in the coefficients of thermal expansion (CTE) between fibers and the matrix, chemical shrinkage of the resin during curing, and non-uniform temperature distributions through the laminate thickness.1–4 These stresses often result in residual thermal deformations such as spring-in, spring-out, and warpage, which consequently require extensive mold modifications and increase manufacturing effort. Accordingly, numerous studies have been conducted to understand and predict residual thermal deformation in composite structures, with the aim of reducing development cost and manufacturing time.5–20
Golestanian 7 established a framework for quantifying the combined effects of thermomechanical and thermochemical responses on the development of process-induced residual stresses and deformations in resin transfer molded composites.
Kim et al. 8 investigated process-induced stress relaxation and demonstrated that the relaxation behavior strongly depends on the degree of cure and cooling rate. Albert et al. 9 reported that both design and process parameters—including part angle, thickness, lay-up sequence, flange length, and tool material—have significant effects on spring-in and warpage, with notable interactions among these parameters. Sung et al. 10 examined the influence of CTE mismatch between composite parts and molds, showing that larger mismatches lead to increased spring-in.
Ding et al. 11 predicted process-induced distortions in L-shaped composite profiles using a path-dependent constitutive law and validated its reliability through finite element homogenization. Svanberg et al. 12 proposed a finite element implementation of a path-dependent constitutive model and demonstrated that it outperformed fully viscoelastic models in predicting residual deformation. Liu 13 et al. investigated the effects of cure heating rate and dwell time using a multiscale thermo-viscoelastic modeling approach to predict process-induced deformation, and demonstrated that lower heating rates reduce both process-induced deformation and residual stress. Li et al. 14 analyzed cure shrinkage and residual stresses in microscale composite structures using three constitutive models—elastic, cure hardening instantaneously linear elastic (CHILE), and viscoelastic—and compared the resulting numerical predictions. Ruiz et al. 15 developed constitutive models to describe variations in composite mechanical properties as functions of fiber volume fraction, temperature, and resin degree of polymerization, and performed numerical analyses of curing temperature evolution and internal stresses in thin and thick resin transfer molding (RTM) parts. More recently, Yoon et al. 16 demonstrated that incorporating ply-wise fiber volume fractions (FVFs) significantly improves prediction accuracy compared with the conventional assumption of uniform FVF across all plies.
Brauner 17 investigated micro-level manufacturing process simulations to analyze the effects of chemically and thermally induced residual stresses, and identified key aspects for interpreting process-induced stresses at the macroscale. Kinugawa 18 developed a multiscale modeling framework—comprising quantum chemical reaction path calculations, molecular dynamics simulations, and both microscopic and macroscopic finite element analyses—to predict process-induced residual deformation in carbon fiber-reinforced plastics, and validated the approach experimentally. Cameron 19 proposed a rapid method for residual cure stress analysis based on path-dependent cure kinetics, accounting for tool–part interaction, forming pressure, and the evolution of composite modulus during the rubbery phase of matrix curing. Sung 20 investigated deformation of fiber preforms during processing and analyzed the influence of flow rate to identify controllable factors for minimizing undesired deformation.
Although numerous studies have been conducted to predict thermal residual deformation in composite structures, it is commonly observed that even identical products fabricated by different manufacturers exhibit substantial variations not only in overall dimensions, including thickness, but also in the resulting residual deformation profiles. These discrepancies arise from a wide range of manufacturing-related factors, such as differences in curing equipment, part support and fixturing methods, location-dependent temperature distributions during curing, mold geometry and material, and the type and dimensions of curing accessories. Consequently, accurately predicting thermal residual deformation through numerical analysis requires that all these variables be adequately accounted for, which inevitably entails significant modeling effort and computational cost. For large-scale composite structures, mold fabrication entails substantial expense; consequently, minimizing the number of mold modifications while maintaining high prediction accuracy is of critical importance. Moreover, compared with autoclave molding, resin transfer molding (RTM) generally produces larger composite structures with relatively lower performance quality and a higher susceptibility to pronounced residual deformations, further increasing the need for reliable and practical prediction methodologies.
In this study, a robust and practical numerical methodology is proposed to predict the thermal residual deformation of a 4 m-scale composite structure manufactured via the resin transfer molding (RTM) process. The proposed approach employs coupon-level segment panels fabricated under processing conditions identical to those of the large-scale structure. The fiber volume fractions (FVFs) of the segment panels were experimentally characterized and calibrated at the segment-panel level to account for manufacturing-induced ply-wise variability. The calibrated FVF distributions were subsequently incorporated into the thermal residual deformation analysis of the 4 m-scale composite structure without additional fitting to the full-scale deformation data. The prediction accuracy was quantitatively evaluated through comparison with experimentally measured deformation of the full-scale structure, which was reserved exclusively for validation purposes. The primary contribution of this study is not the case-specific reproduction of the deformation behavior of a single structure, but the establishment of a transferable experimental–numerical framework in which segment-level manufacturing characteristics are quantified and propagated into a large-scale structural model. This distinction is essential for demonstrating the predictive capability of the proposed methodology rather than simple curve fitting.
Geometry and materials
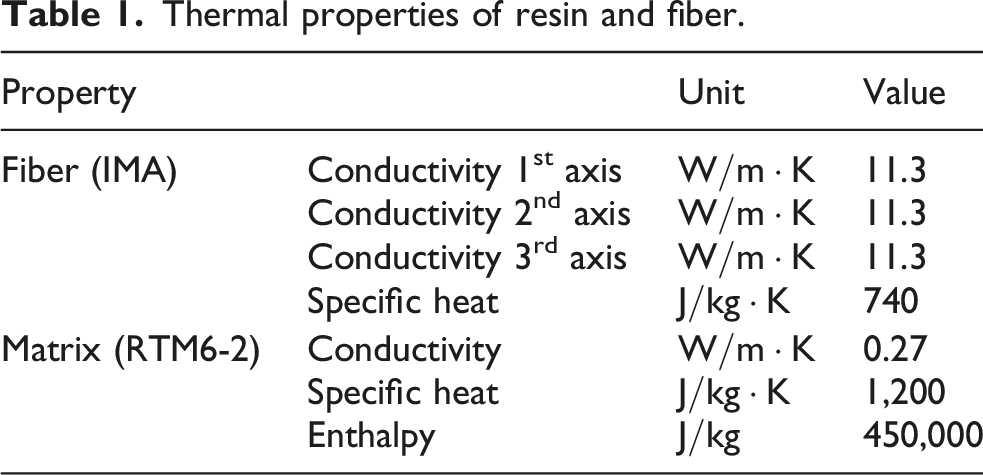
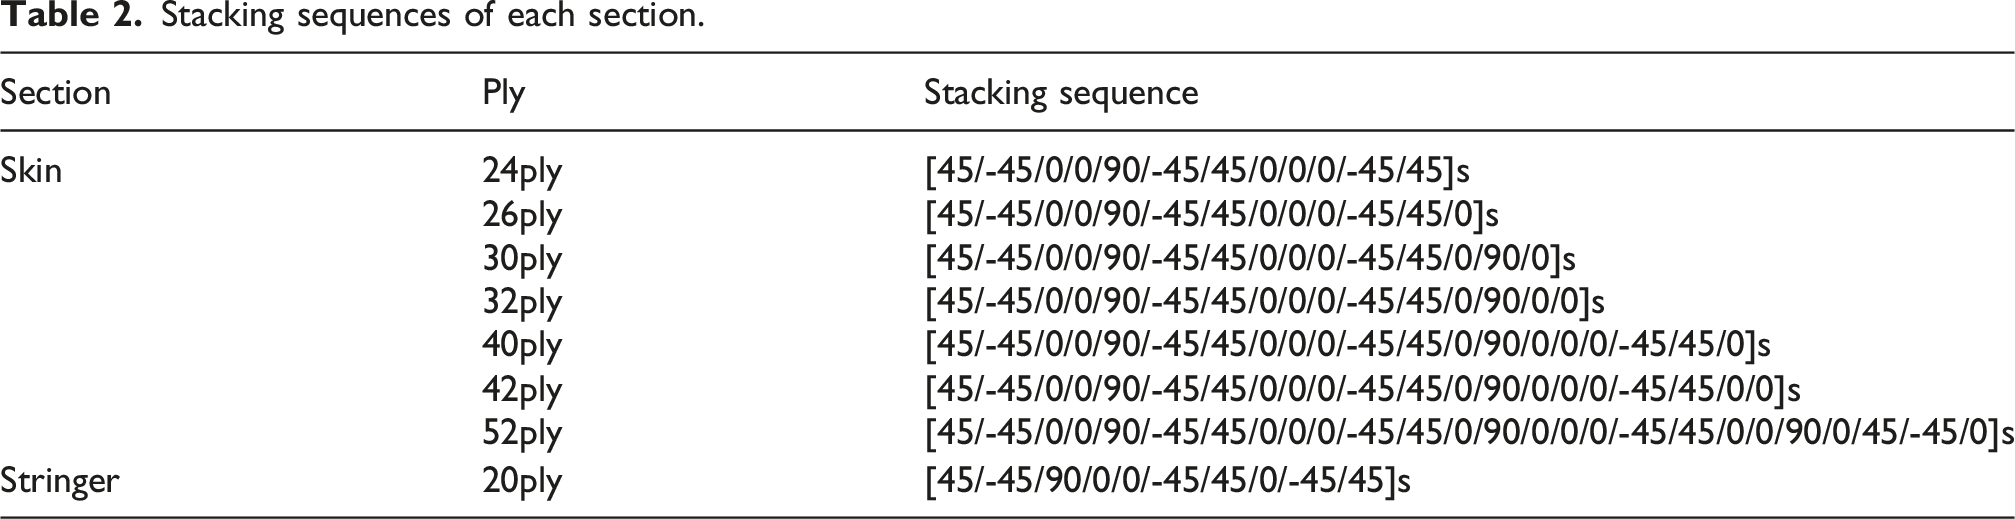
This study aims to predict the thermal residual deformation of a 4 m-scale composite main wing structure for a single-aisle commercial aircraft in the 200-passenger class. The geometry and dimensions of the structure are shown in Figure 1. IMA unidirectional carbon fibers and RTM6-2 resin, supplied by Hexcel, were used, and their material properties, as provided by the manufacturer, are summarized in Table 1. The stacking sequences of each section are presented in Table 2. 4 m-scale main wing composite structure. Thermal properties of resin and fiber. Stacking sequences of each section.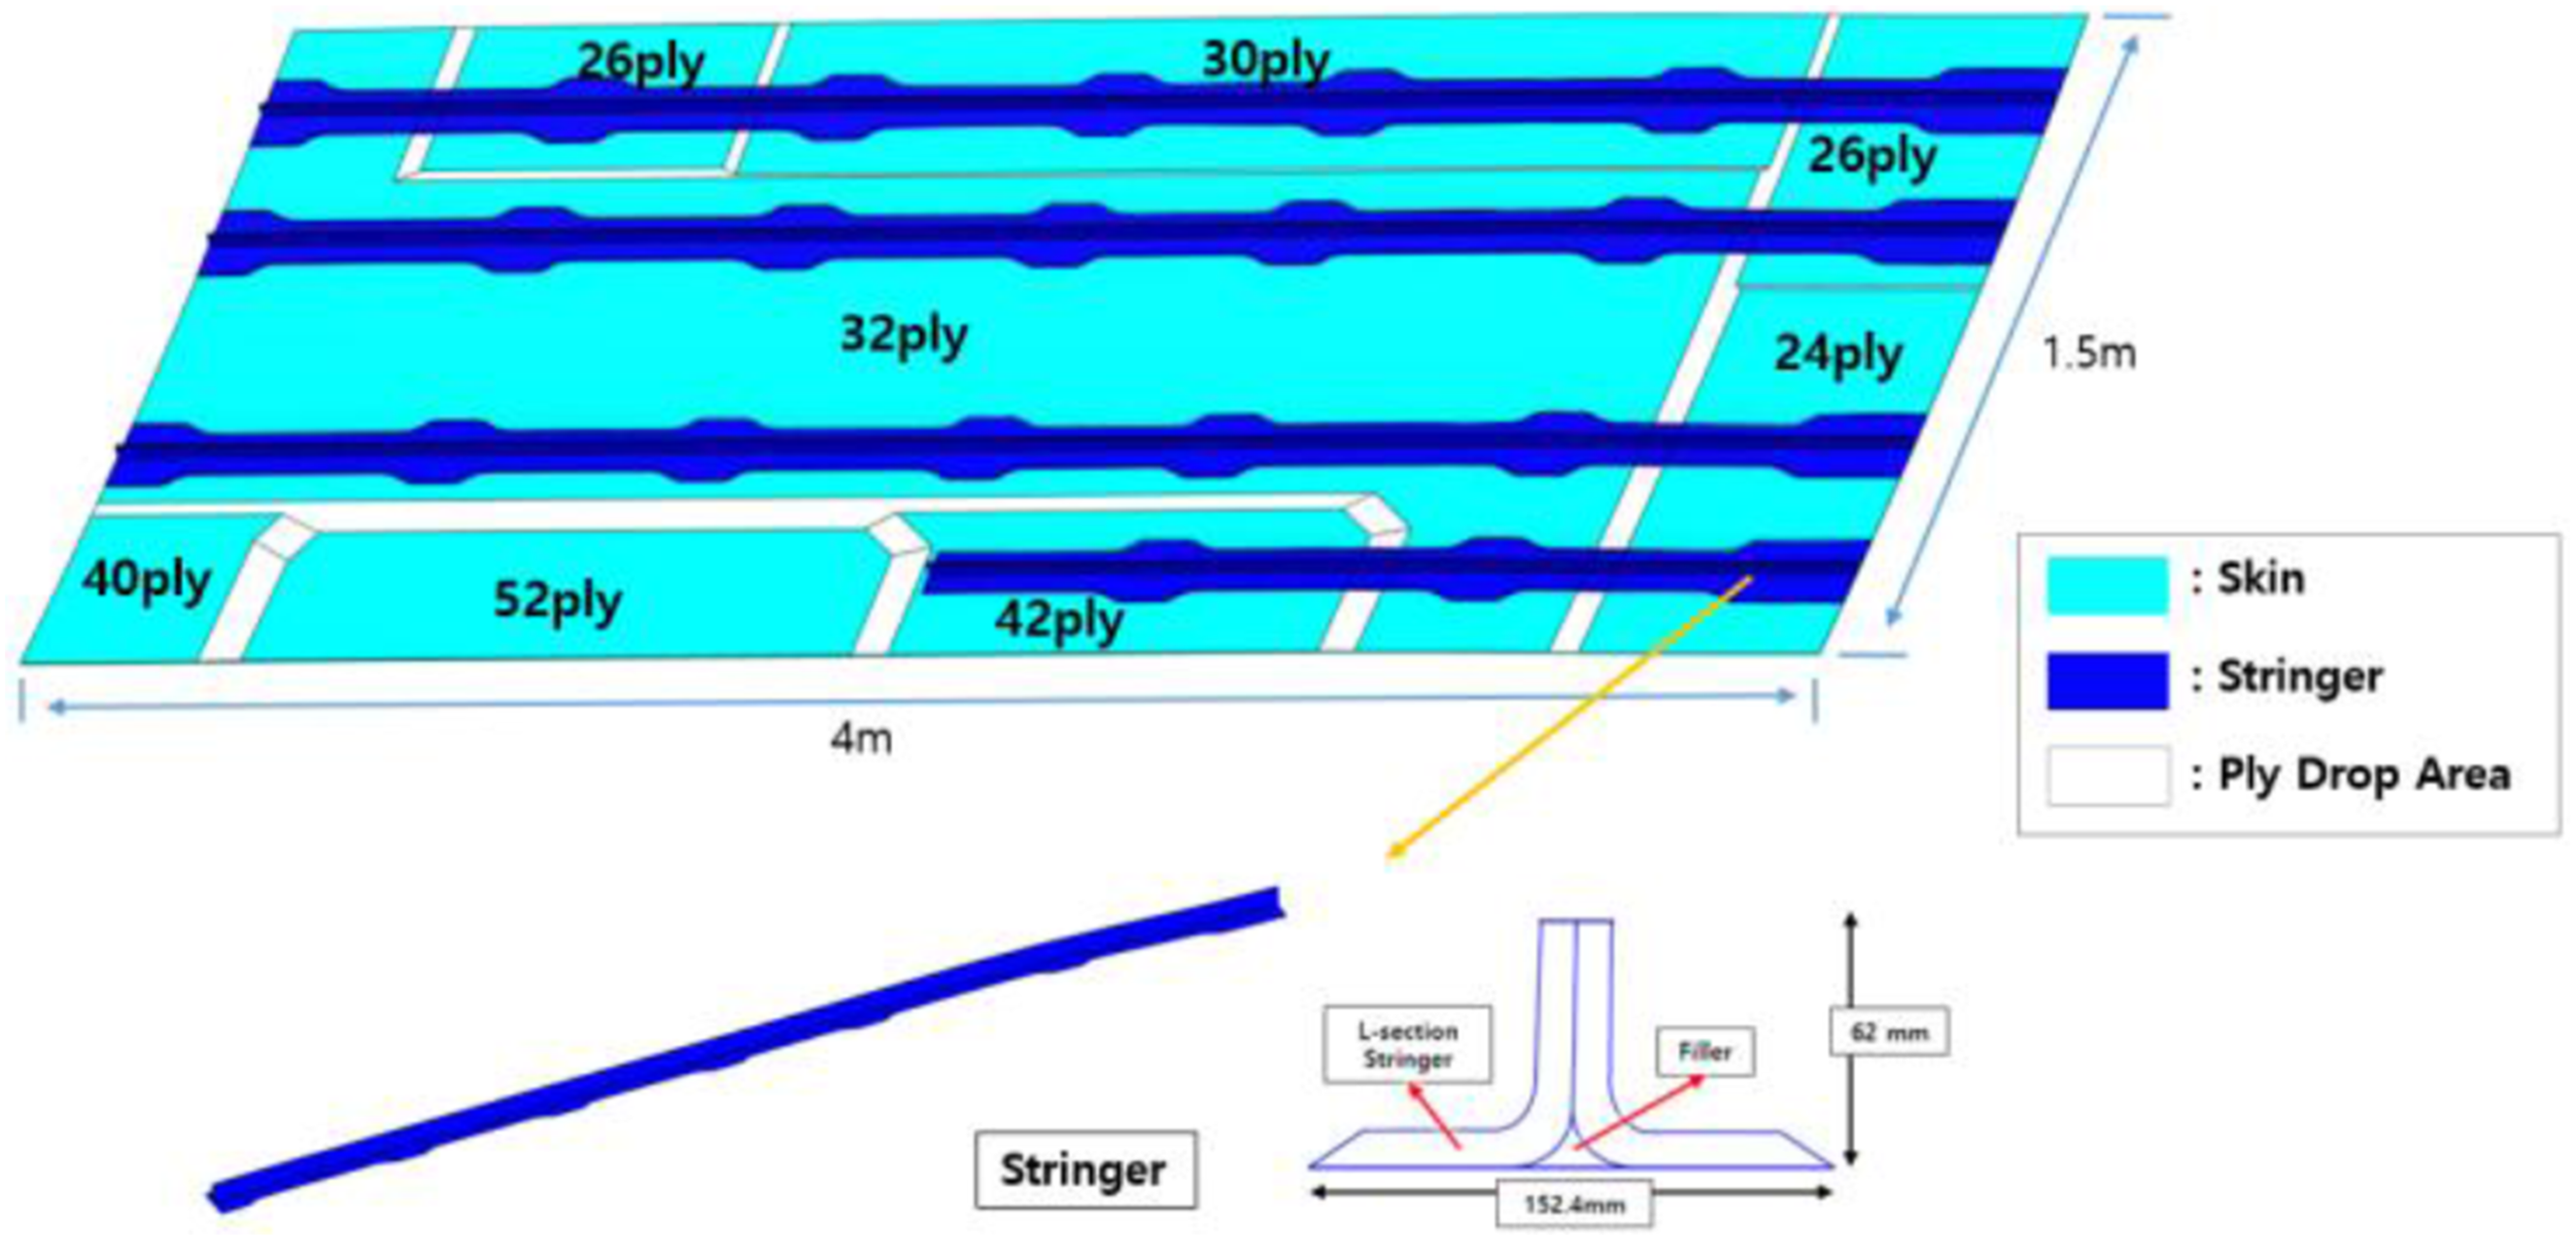
Residual deformation prediction method
This study proposes a robust and practical methodology for predicting the thermal residual deformation of large-scale composite structures manufactured via the RTM process, using coupon-level segment panels. Resin flow analysis of a 4 m-scale structure was performed to determine spatial variations in processing conditions, from which the inlet and outlet pressure conditions for each segment were defined, and the structure was subsequently partitioned into representative segments. Segment panels were then fabricated under identical RTM conditions, and their thermal residual deformation and ply-wise fiber volume fractions (FVFs) were experimentally characterized. The measured FVFs were first incorporated into the segment-panel finite element models. Because local intra-ply and ply-to-ply FVF fluctuations cannot be fully represented in a practical large-scale model, an effective ply-wise FVF calibration was performed only at the segment-panel level using the experimentally measured segment-panel deformation. The calibrated FVF distributions were then transferred to the global finite element model of the full-scale structure. No additional calibration was performed using the deformation measurements of the 4 m-scale structures; these measurements were used solely for validation of the proposed prediction methodology.
Resin flow analysis of large-scale composite structure by RTM process
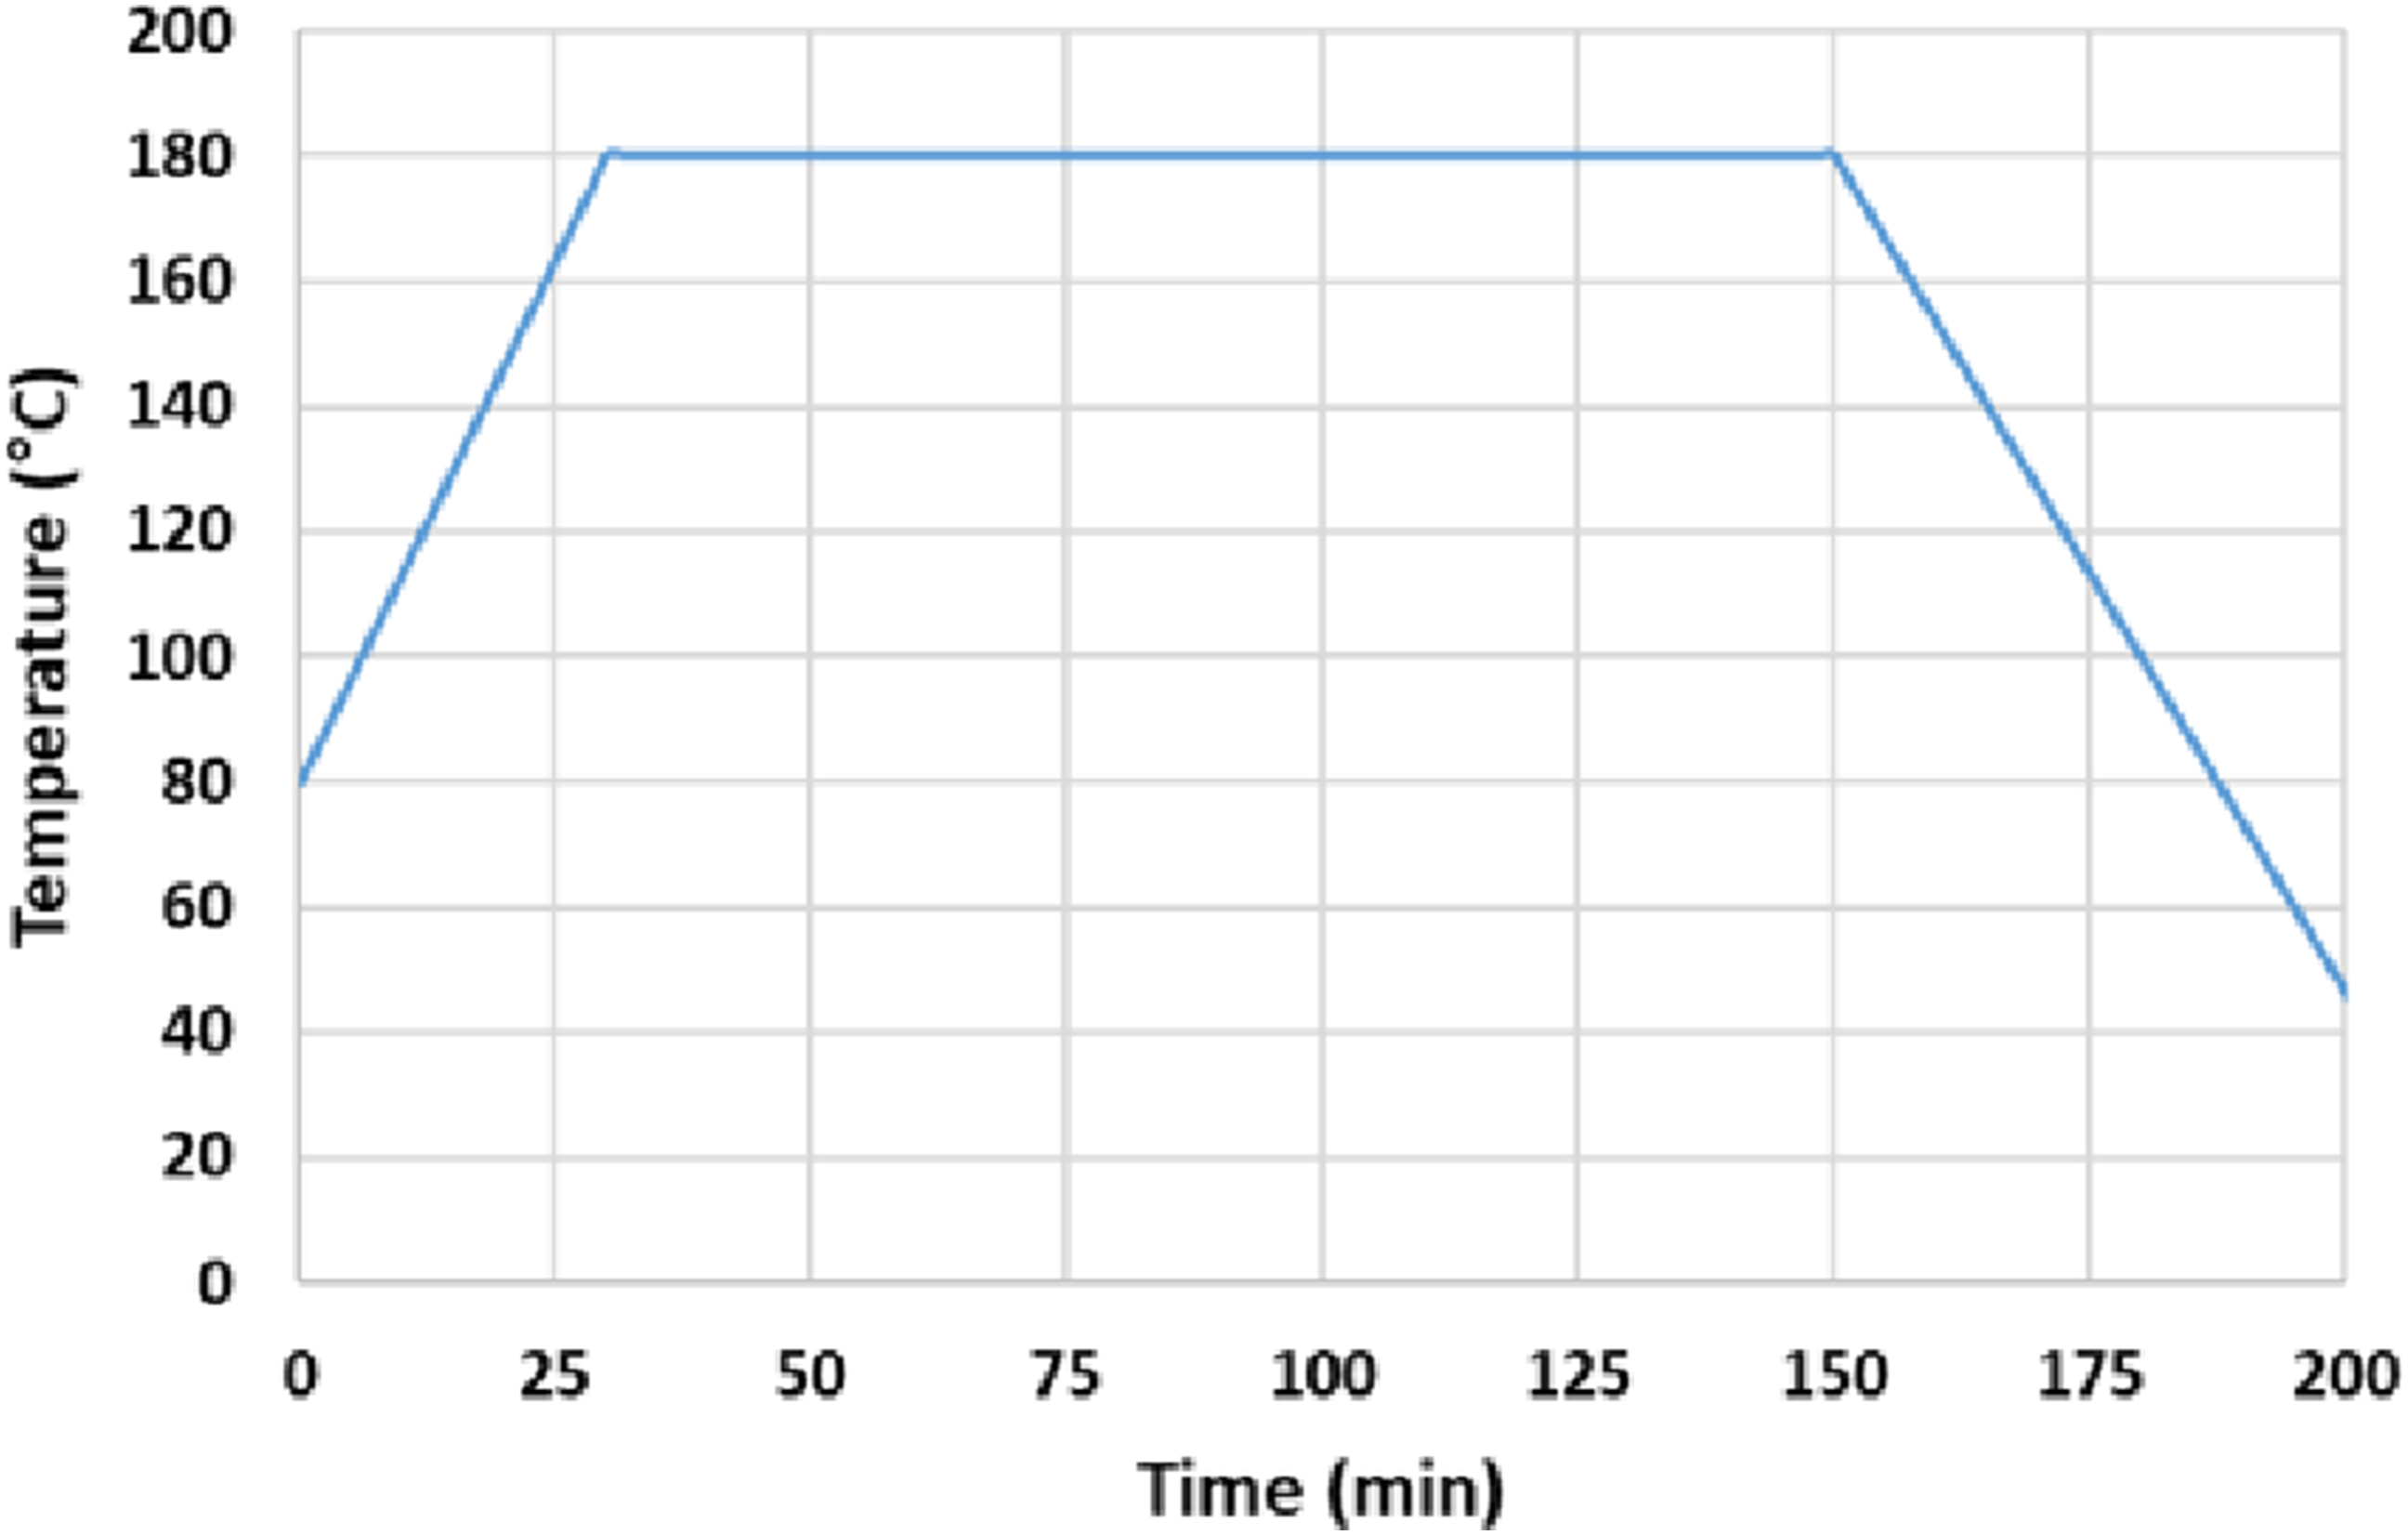
To analyze the manufacturing process of this large-scale structure, resin flow simulations were first performed, and pressure variations at different locations were calculated as a function of time. Figure 2 shows the cure cycle of the composite structure. The resin filling process was analyzed using the PAM-RTM program. The permeability of the preforms was measured using Darcy’s law and the Kamal–Sourour cure kinetic model was used for cure kinetics.
16
Cure cycle of the composite structure.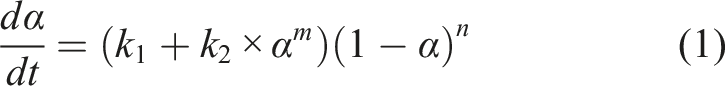
In equation (1), 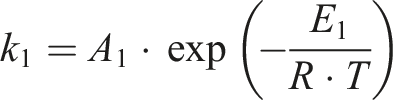
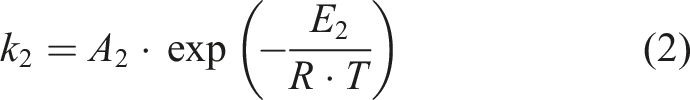
Curing constant of resin and permeability of preform.
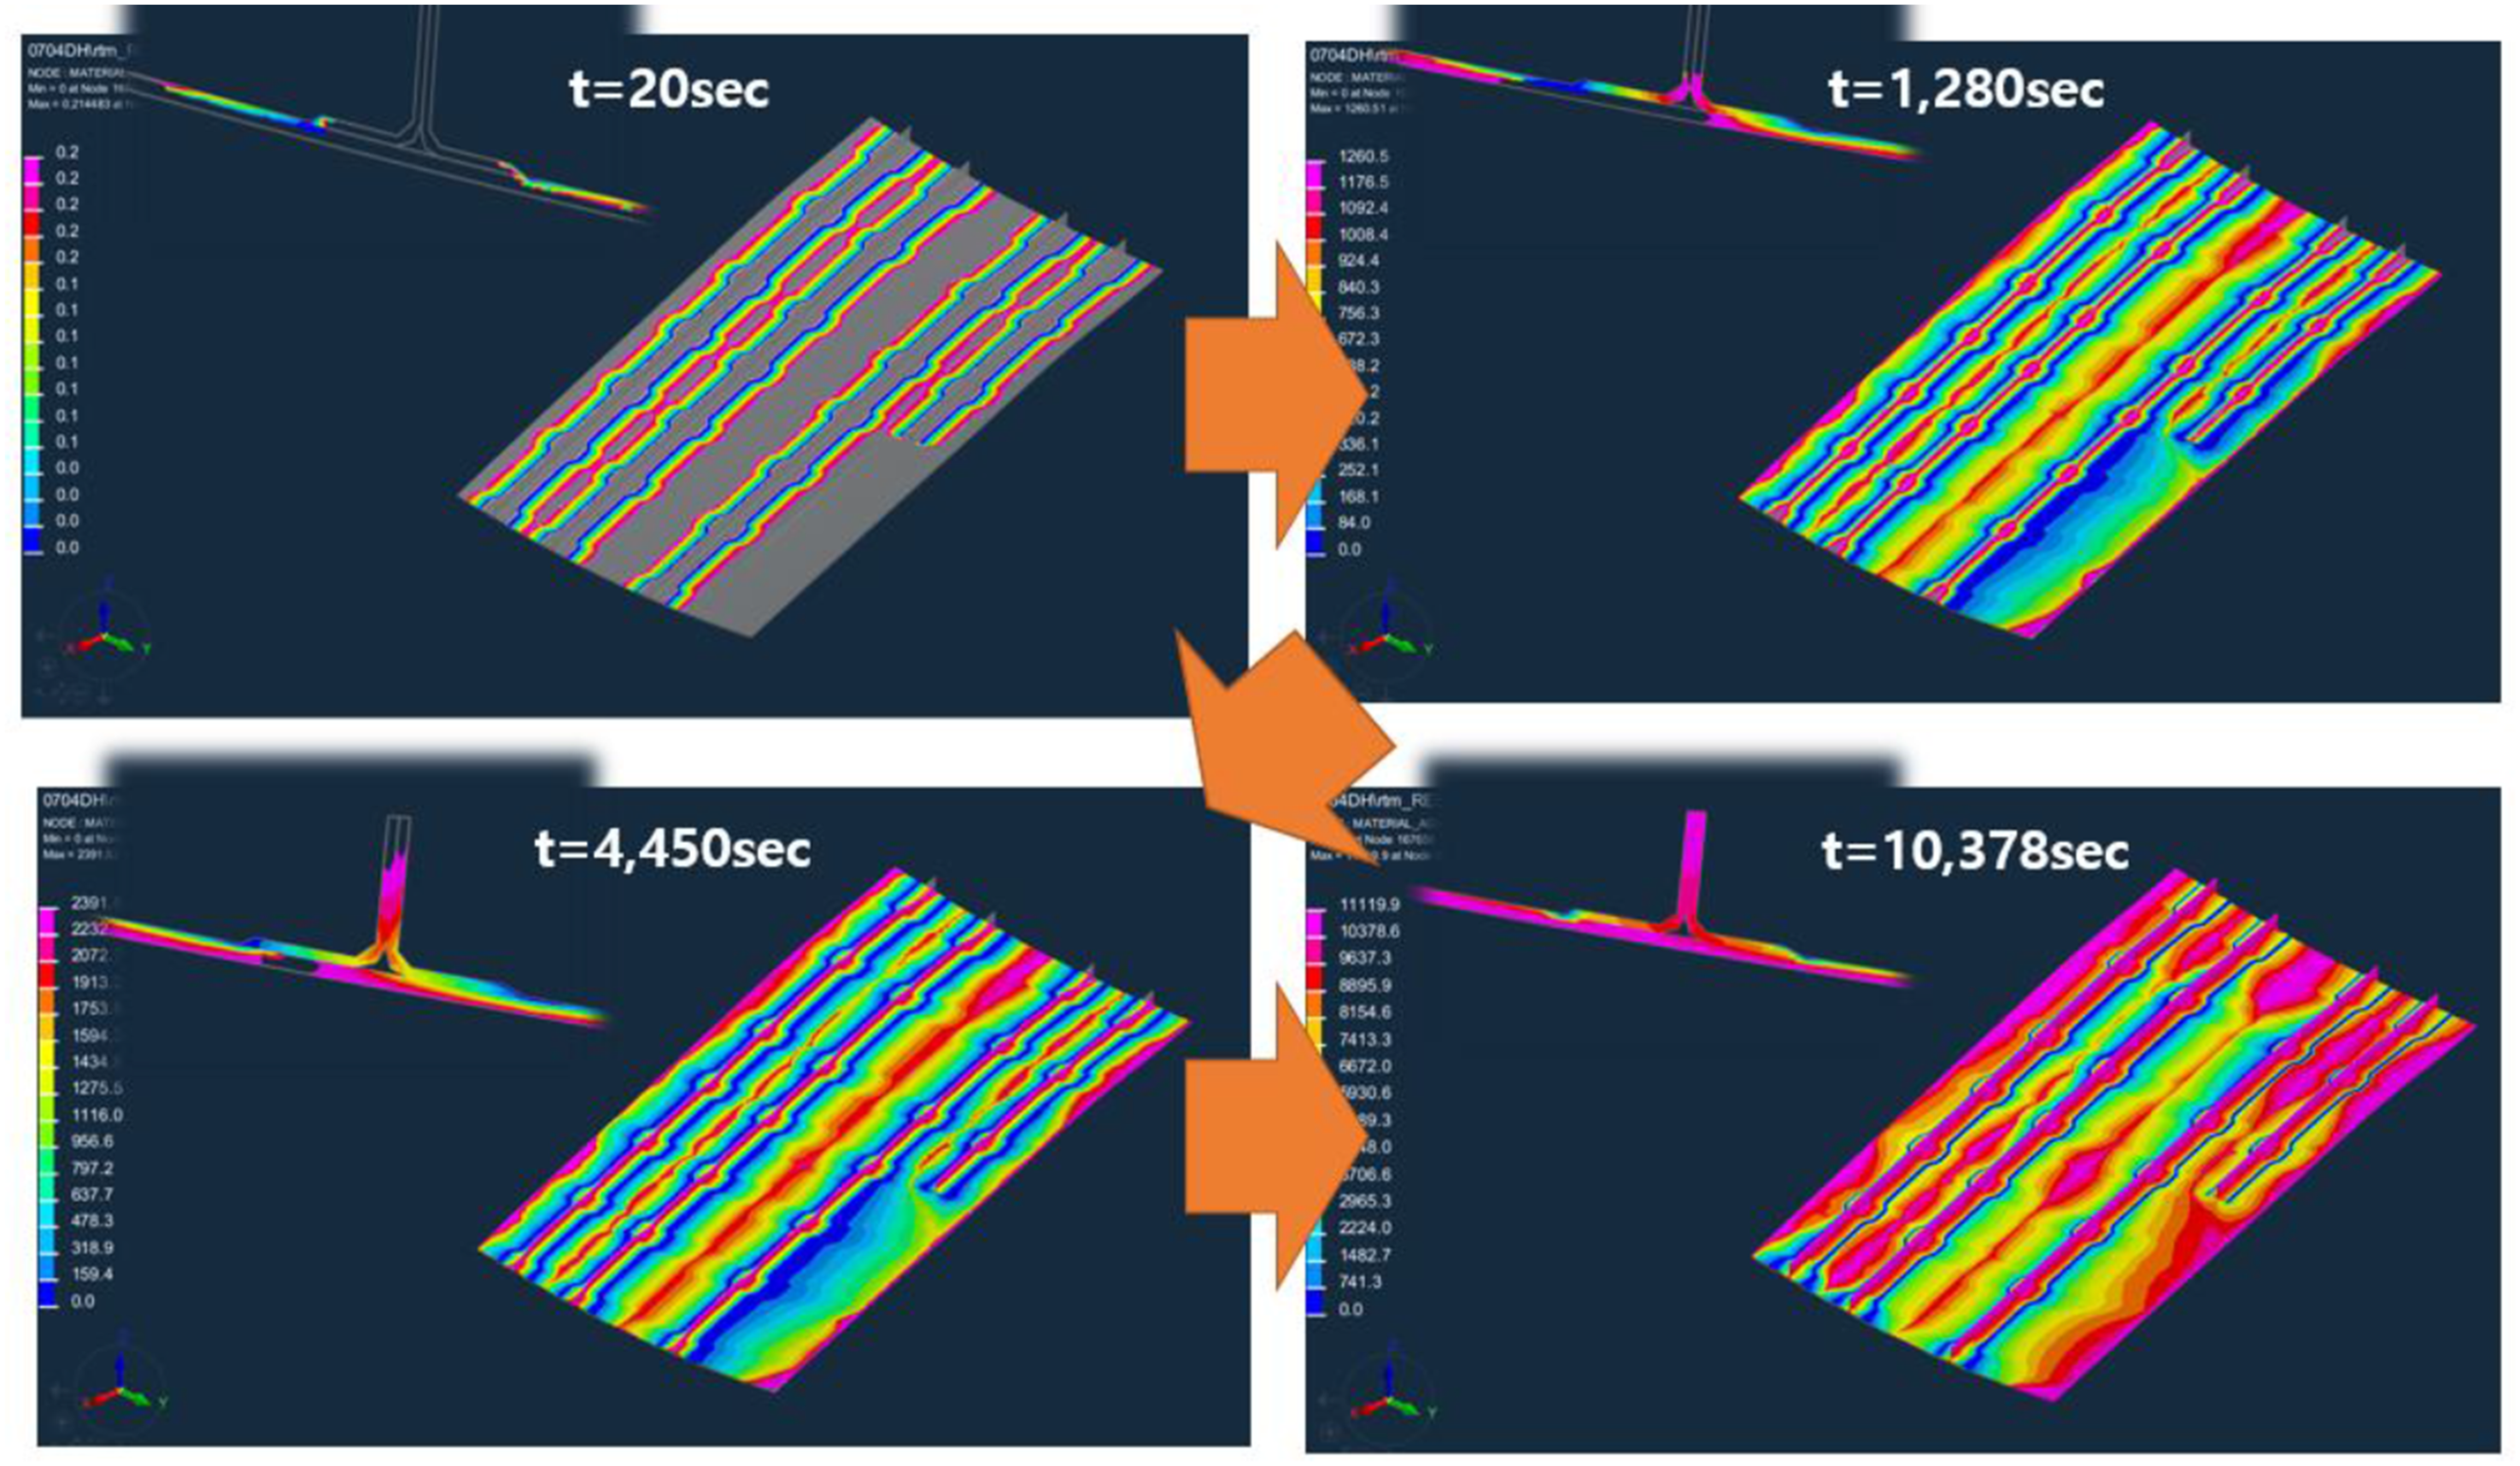
Figure 3 shows the finite element (FE) model used for the analysis along with the inlet and outlet locations. Four inlets were positioned along the stringer direction, while ten outlets were placed on the skin, replicating the actual manufacturing configuration. In addition, a mesh flow layer was modeled on the preform surface, and the inlets and outlets were positioned along the preform edges. The resin flow simulation results are also presented in Figure 4. The total filling time of the structure was predicted to be approximately 3 h and 5 min. FE model and inlet/outlet of main wing composite structure. Resin flow analysis.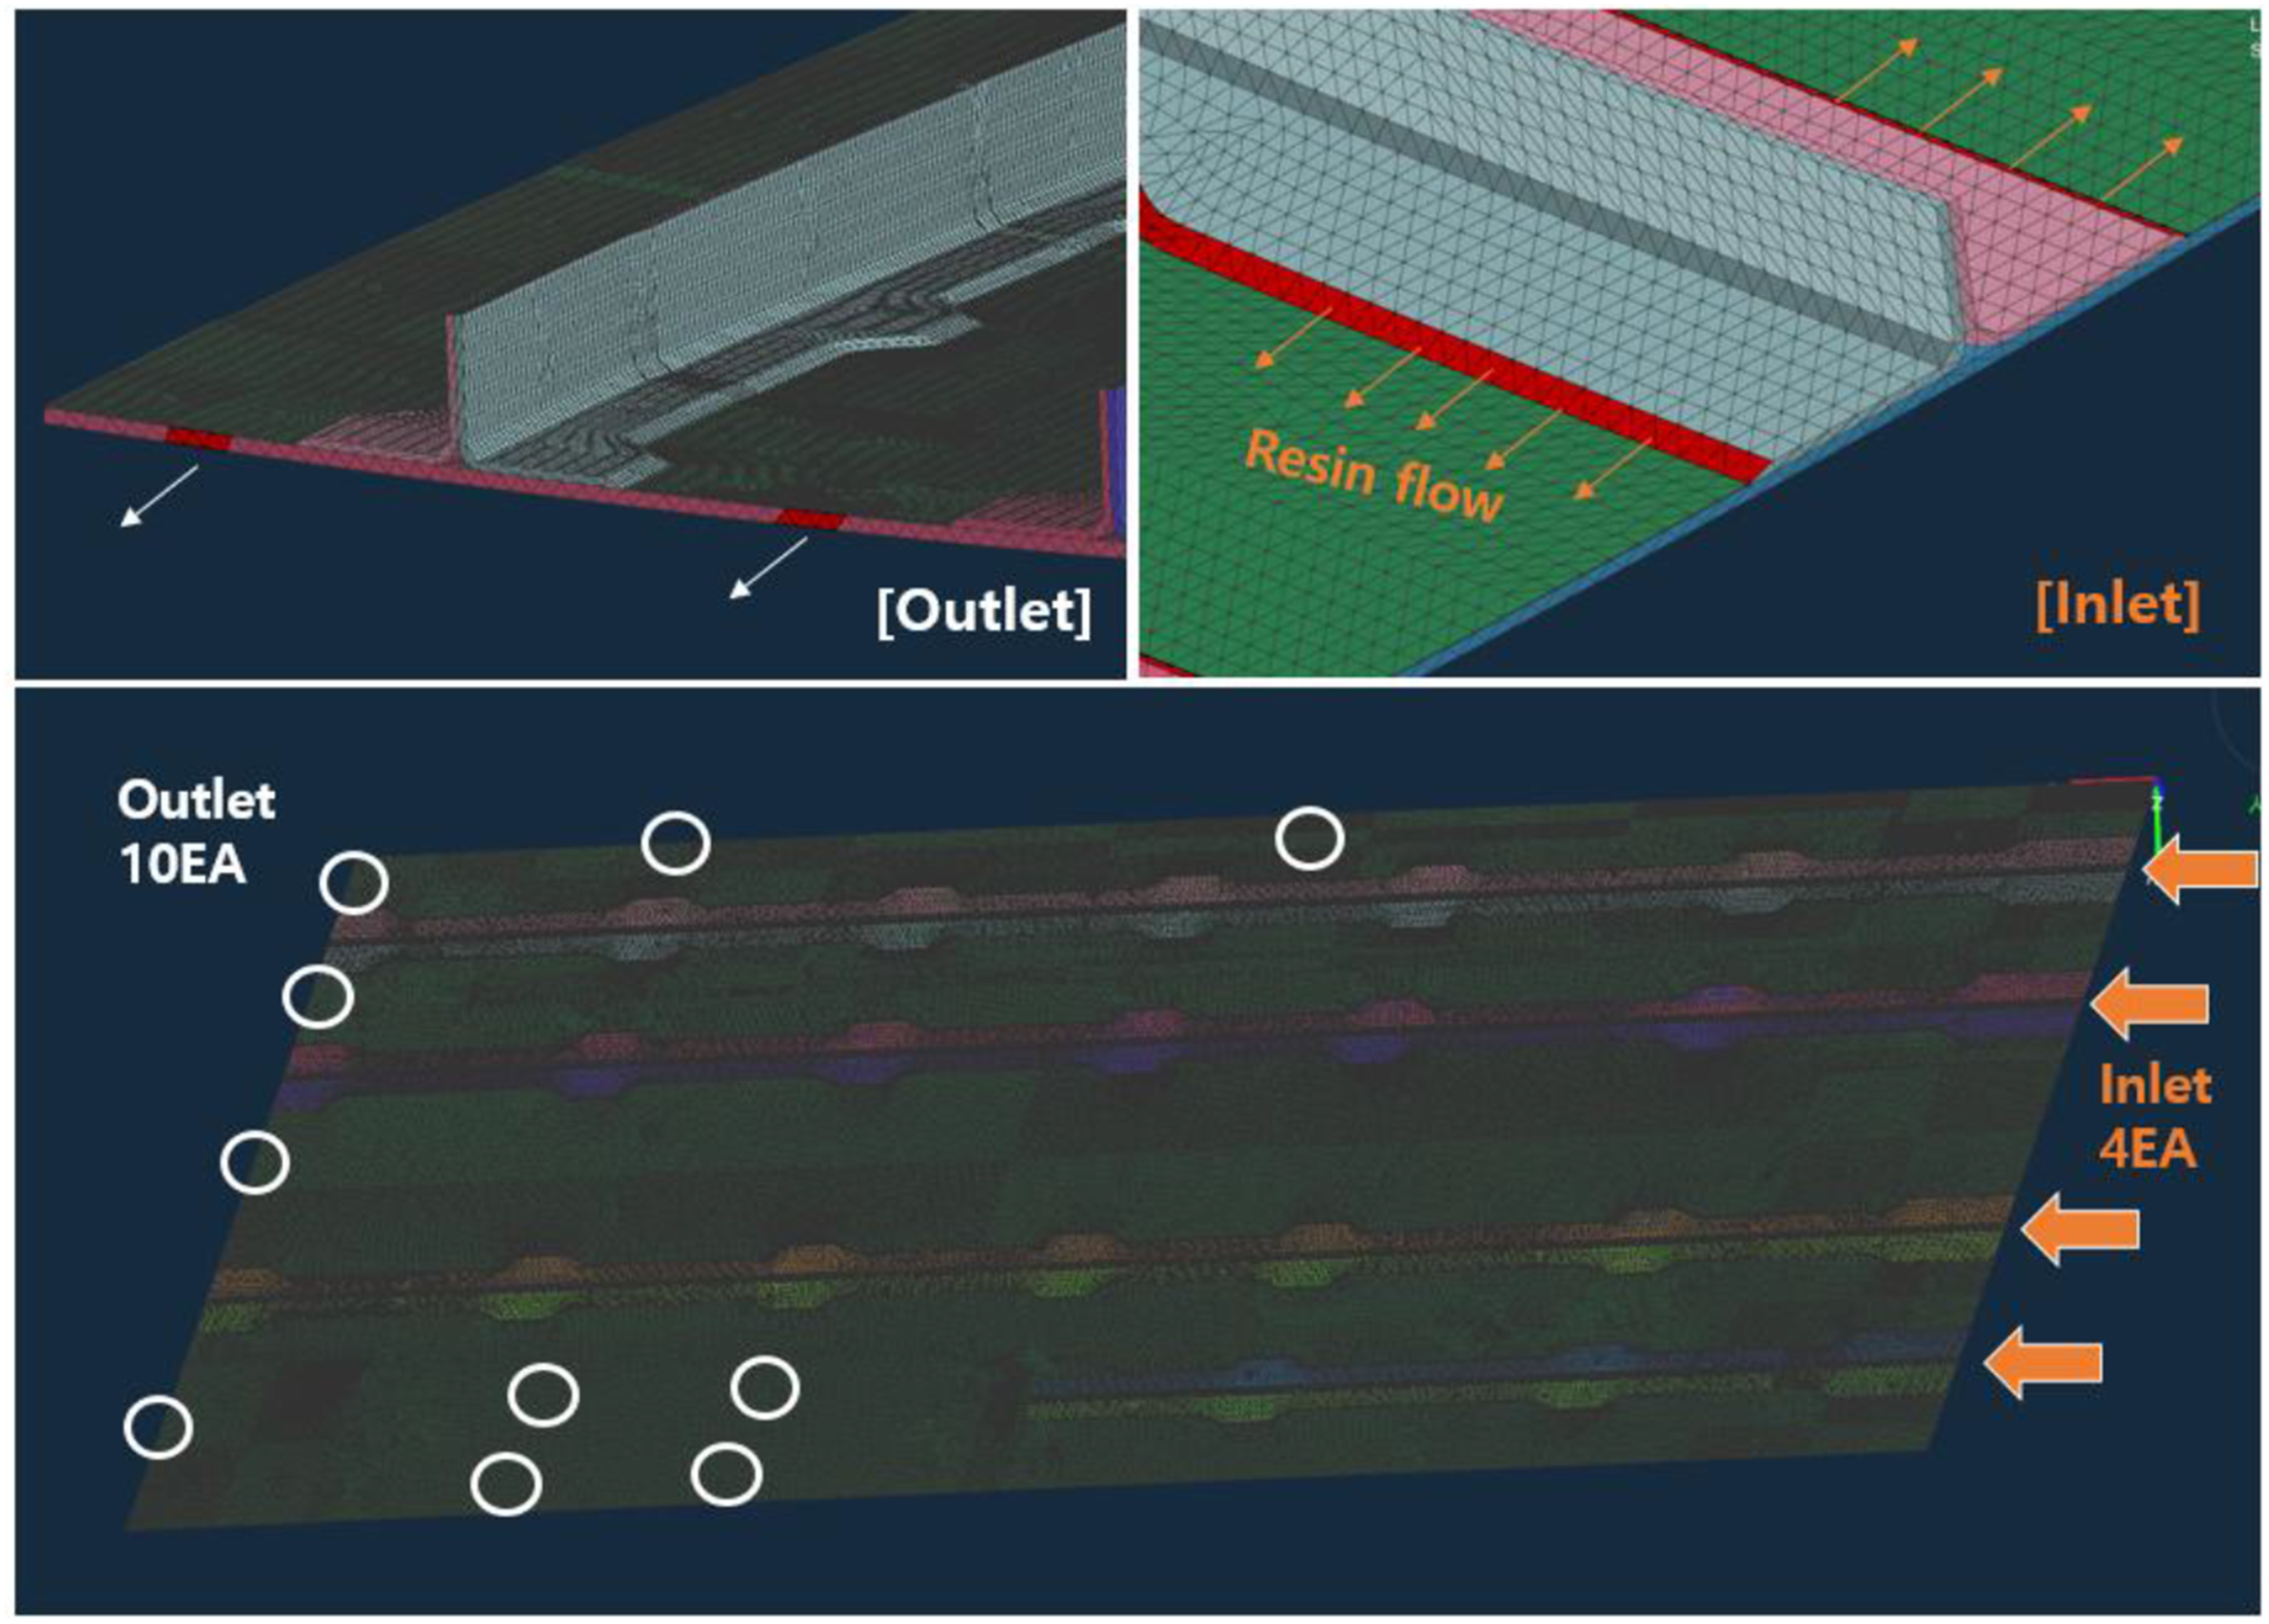
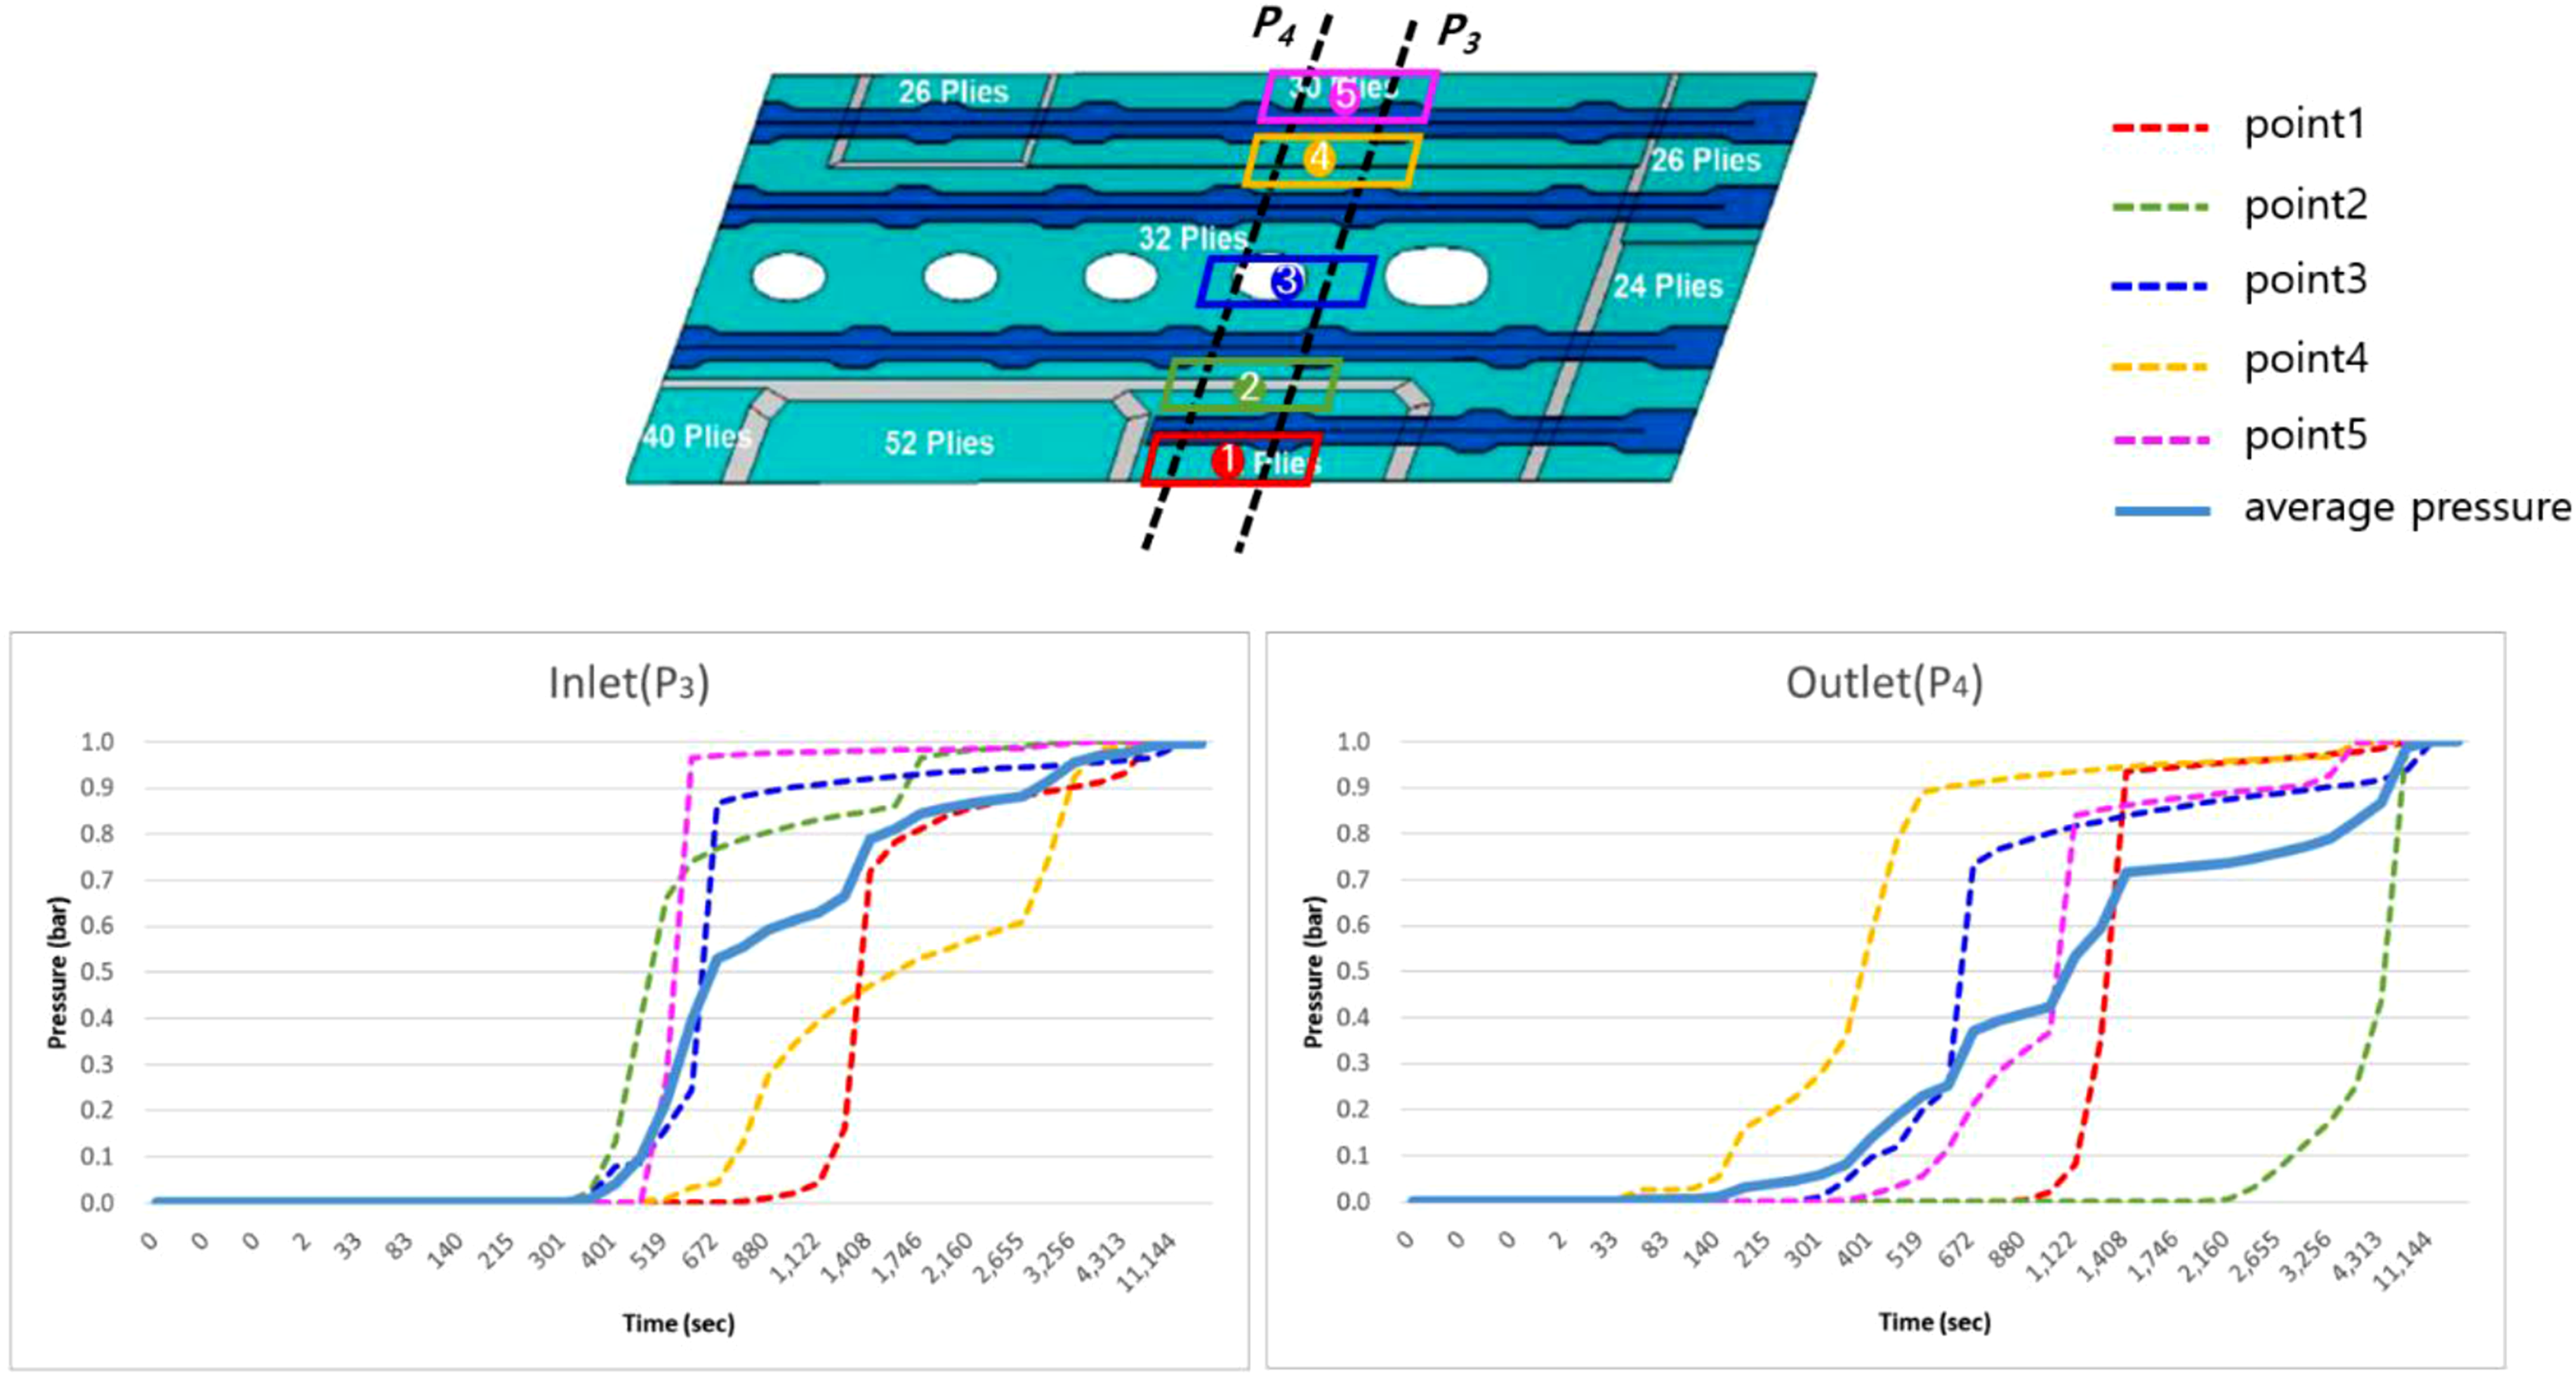
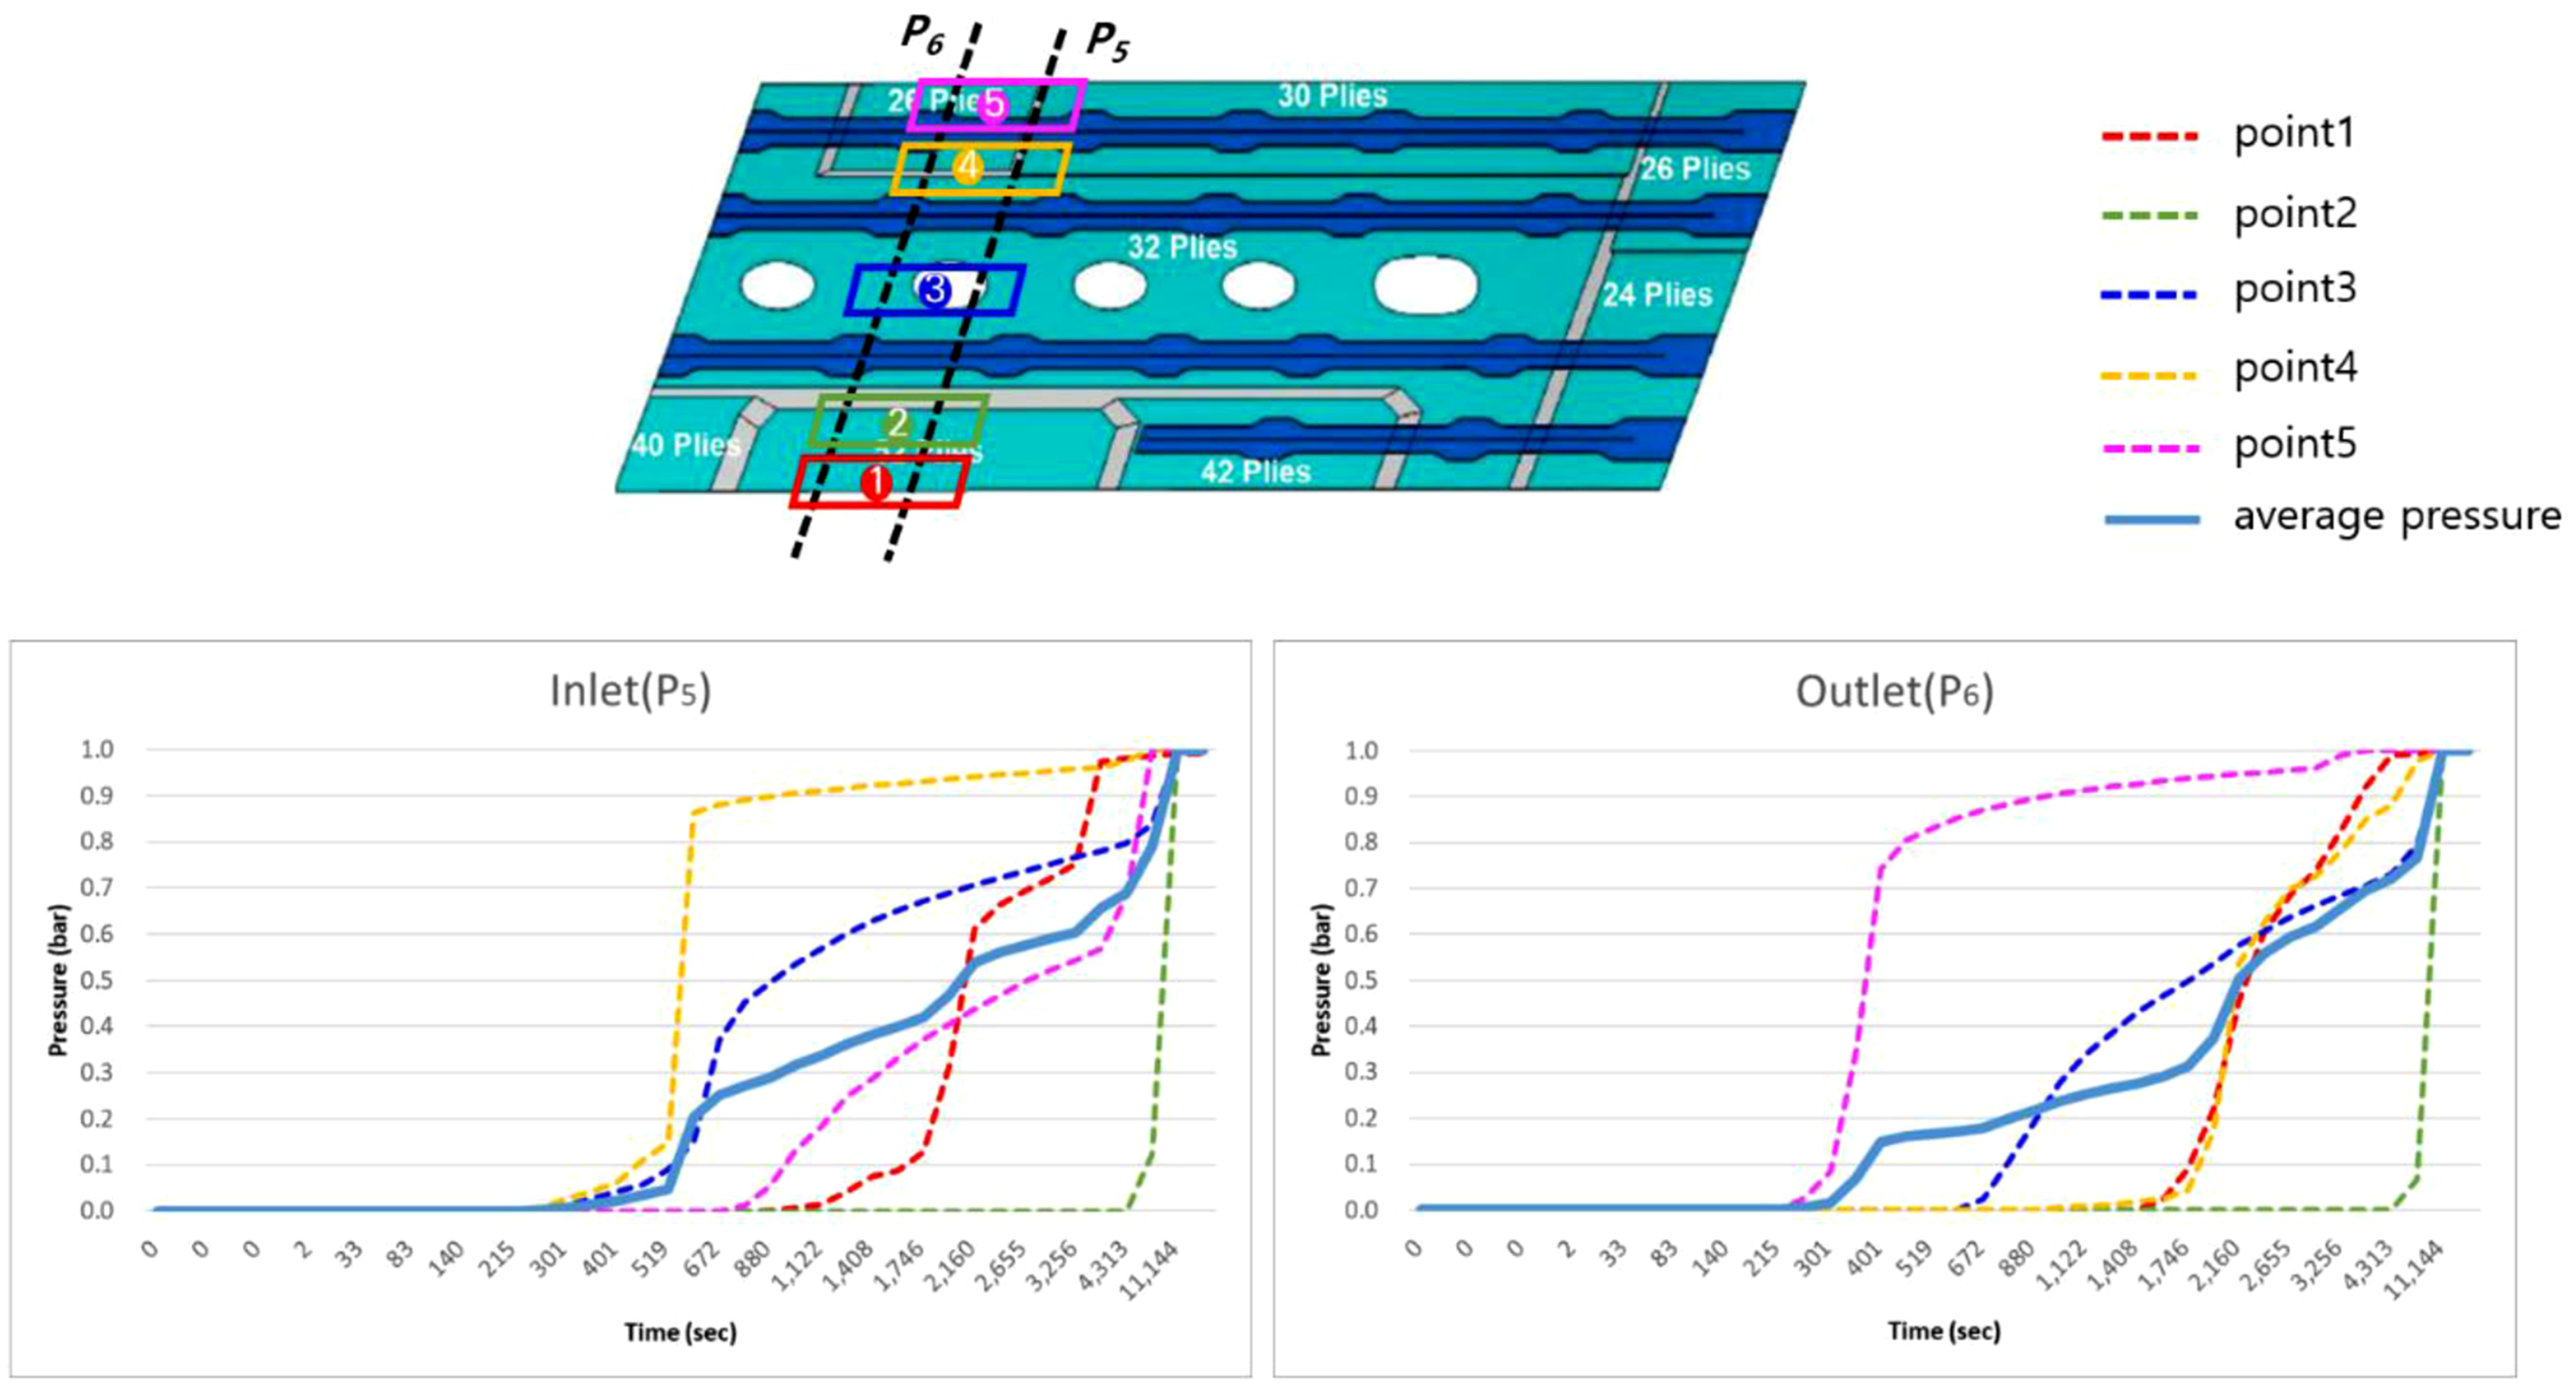
Based on these flow analysis results, the large-scale structure was divided into three segments, as shown in Figure 5, and the inlet/outlet pressure variations for each segment were evaluated. 3 Segments of main wing composite structure.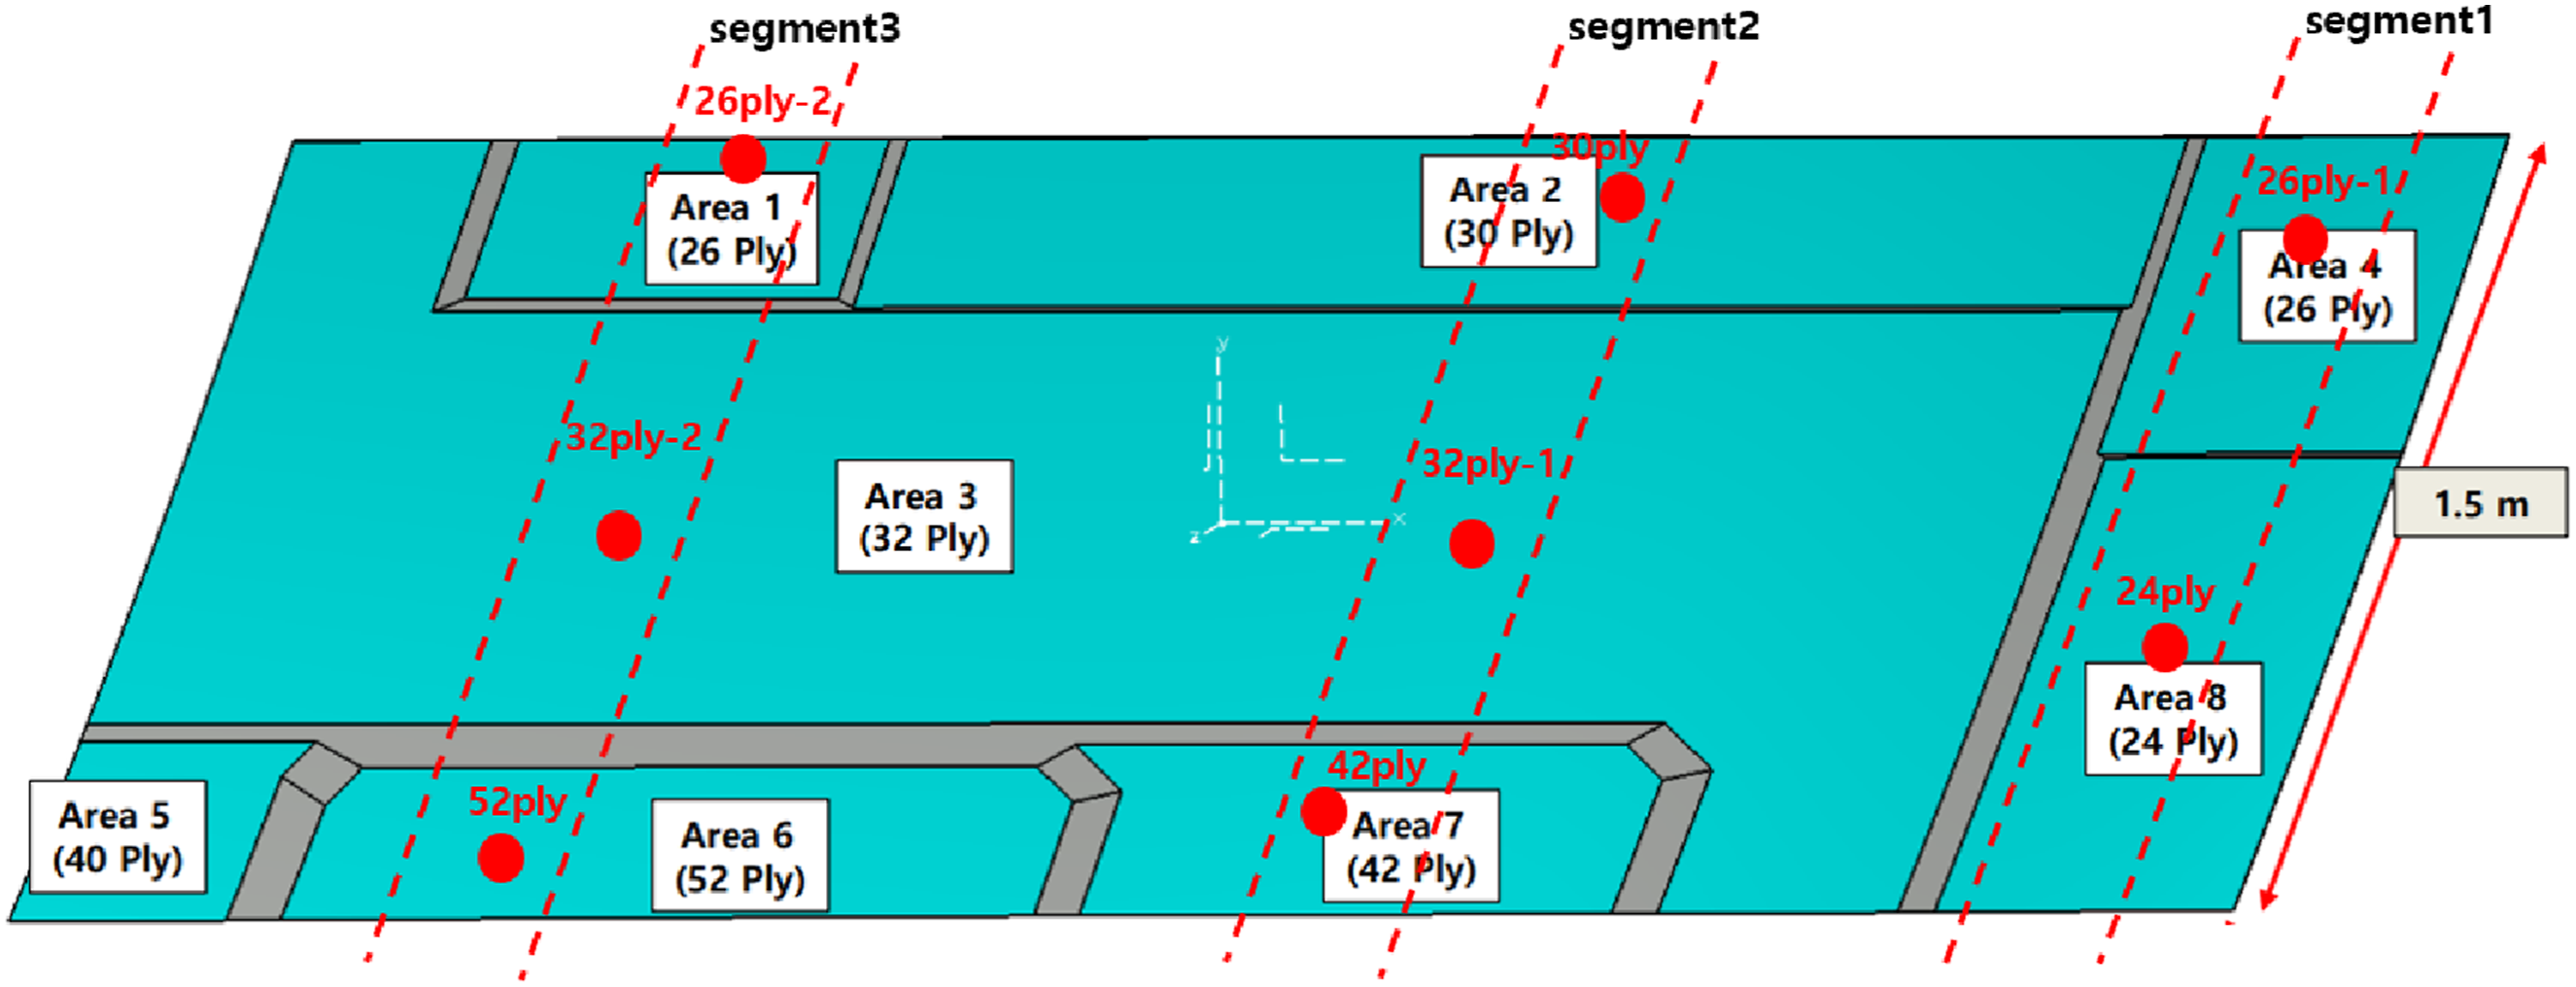
Figures 6–8 show the pressure variations for segments 1, 2, and 3, respectively, at the lowest point through the thickness. The pressure distribution was relatively uniform at all points in segment 1, while segment 3 displayed the greatest degree of non-uniformity among the three segments. Pressure variation of segment 1. Pressure variation of segment 2. Pressure variation of segment 3.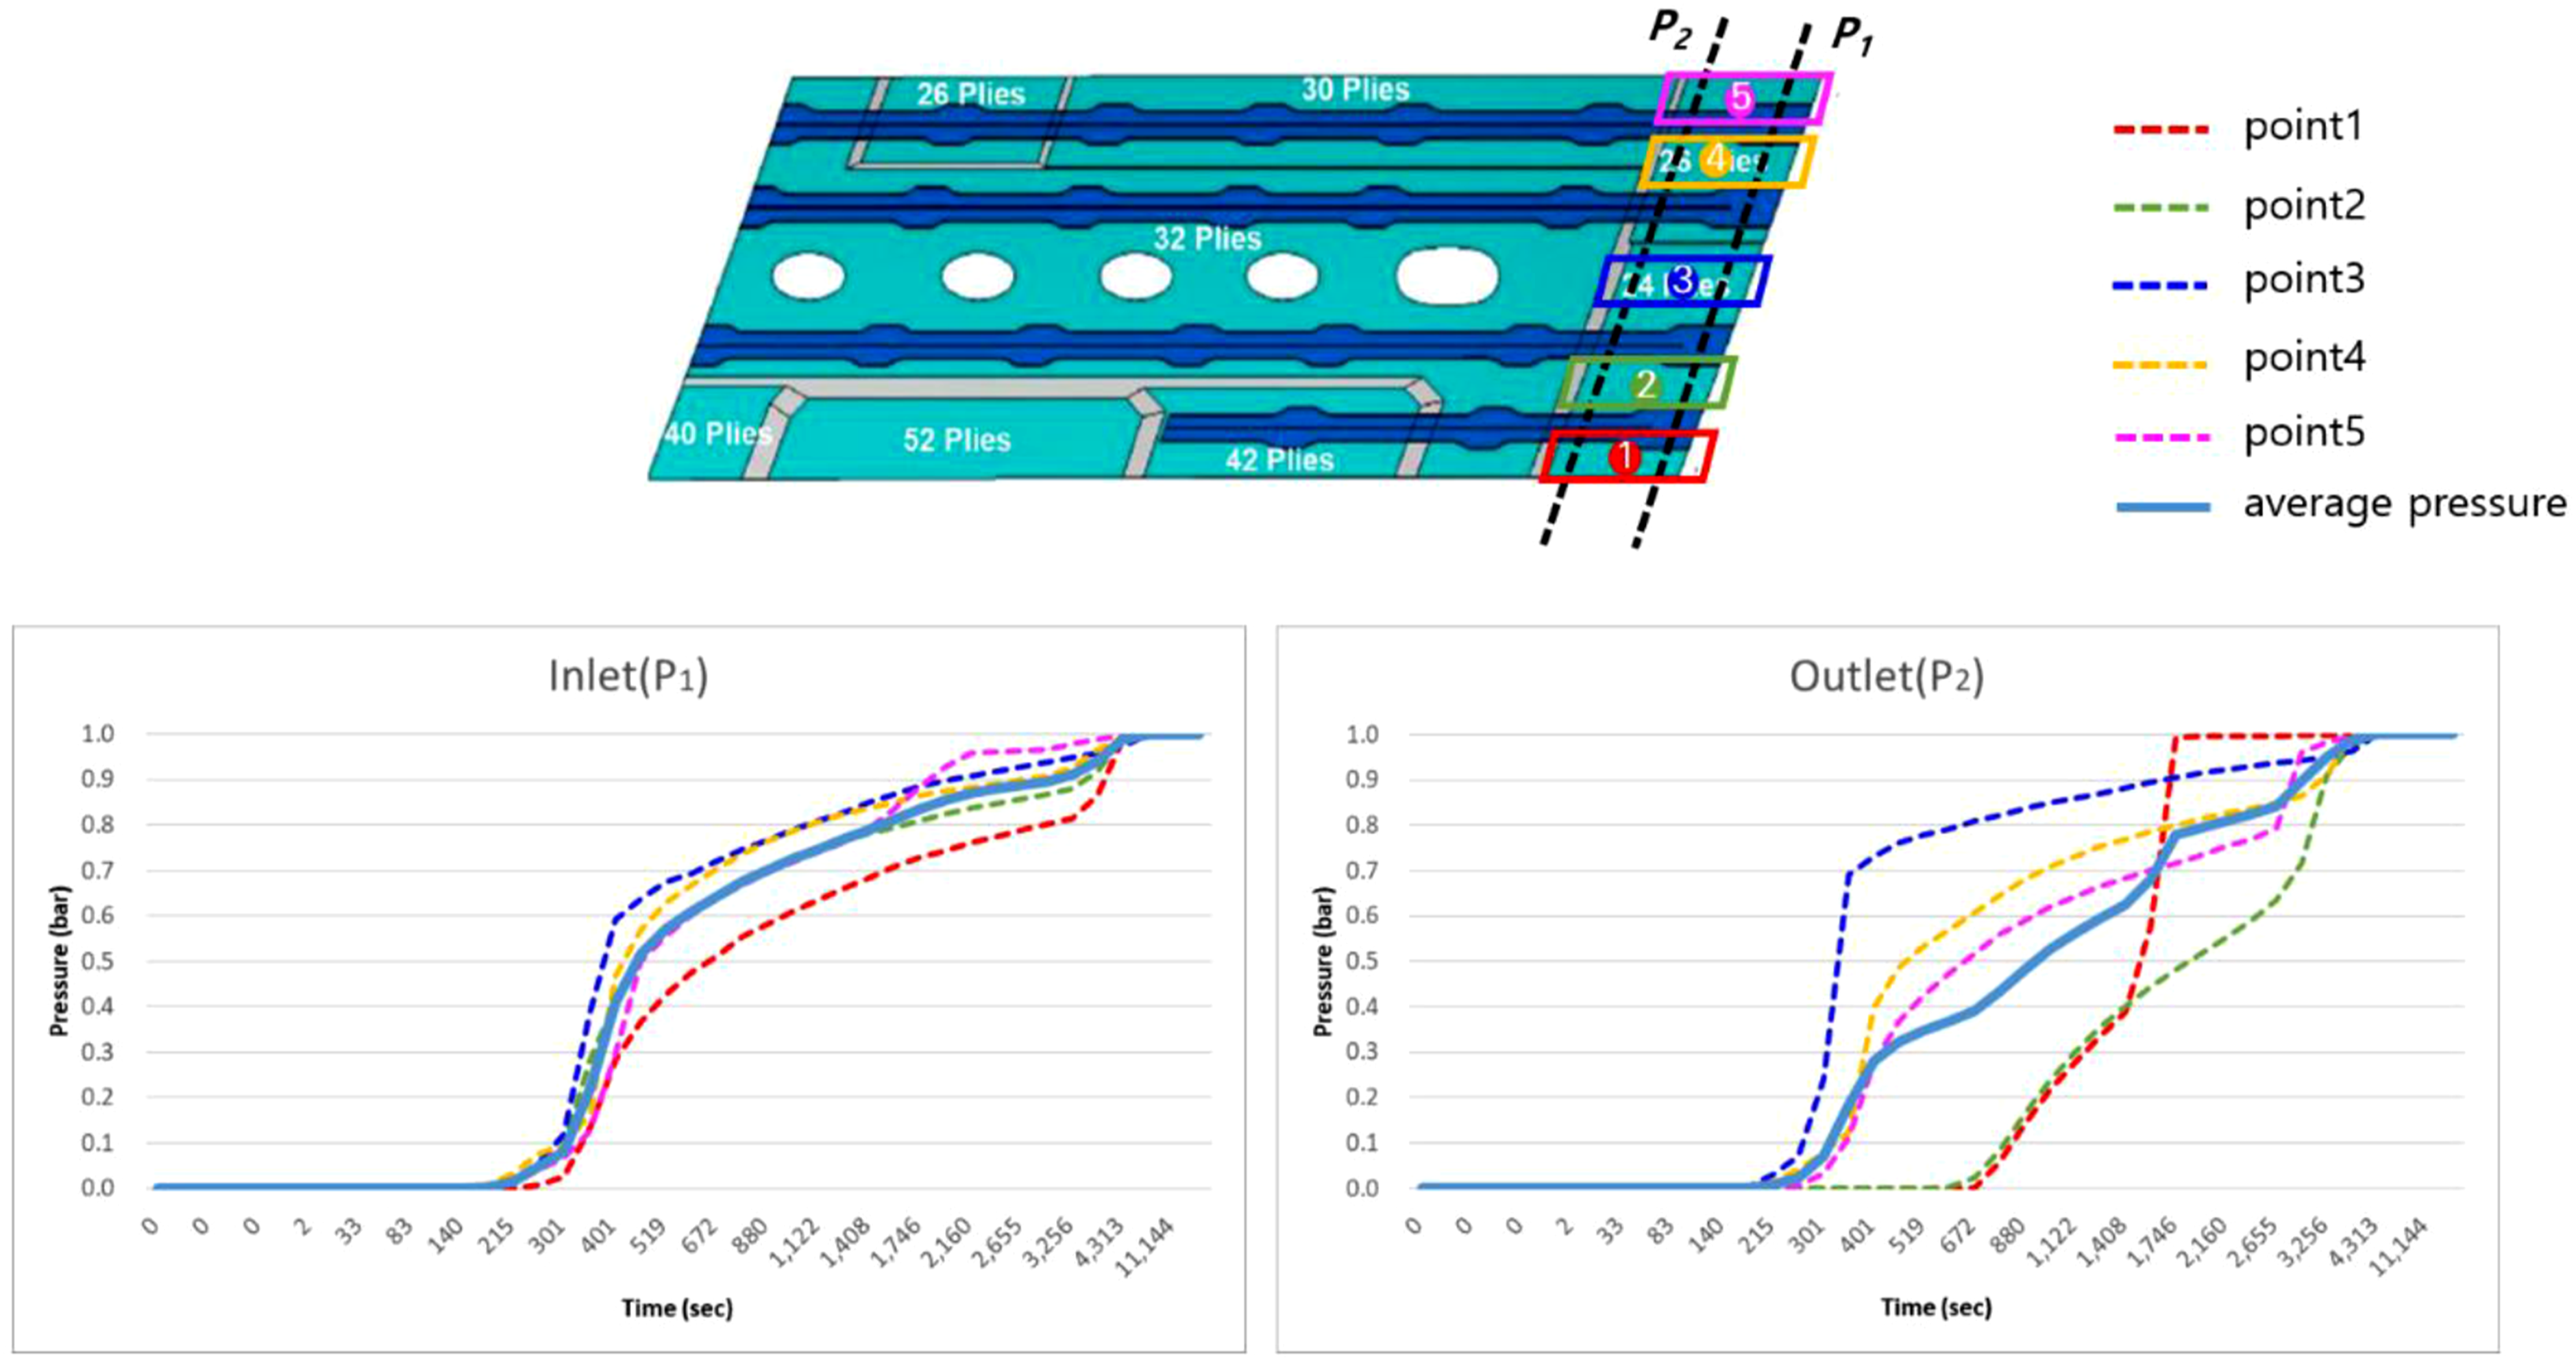
Manufacture of segment composite panel
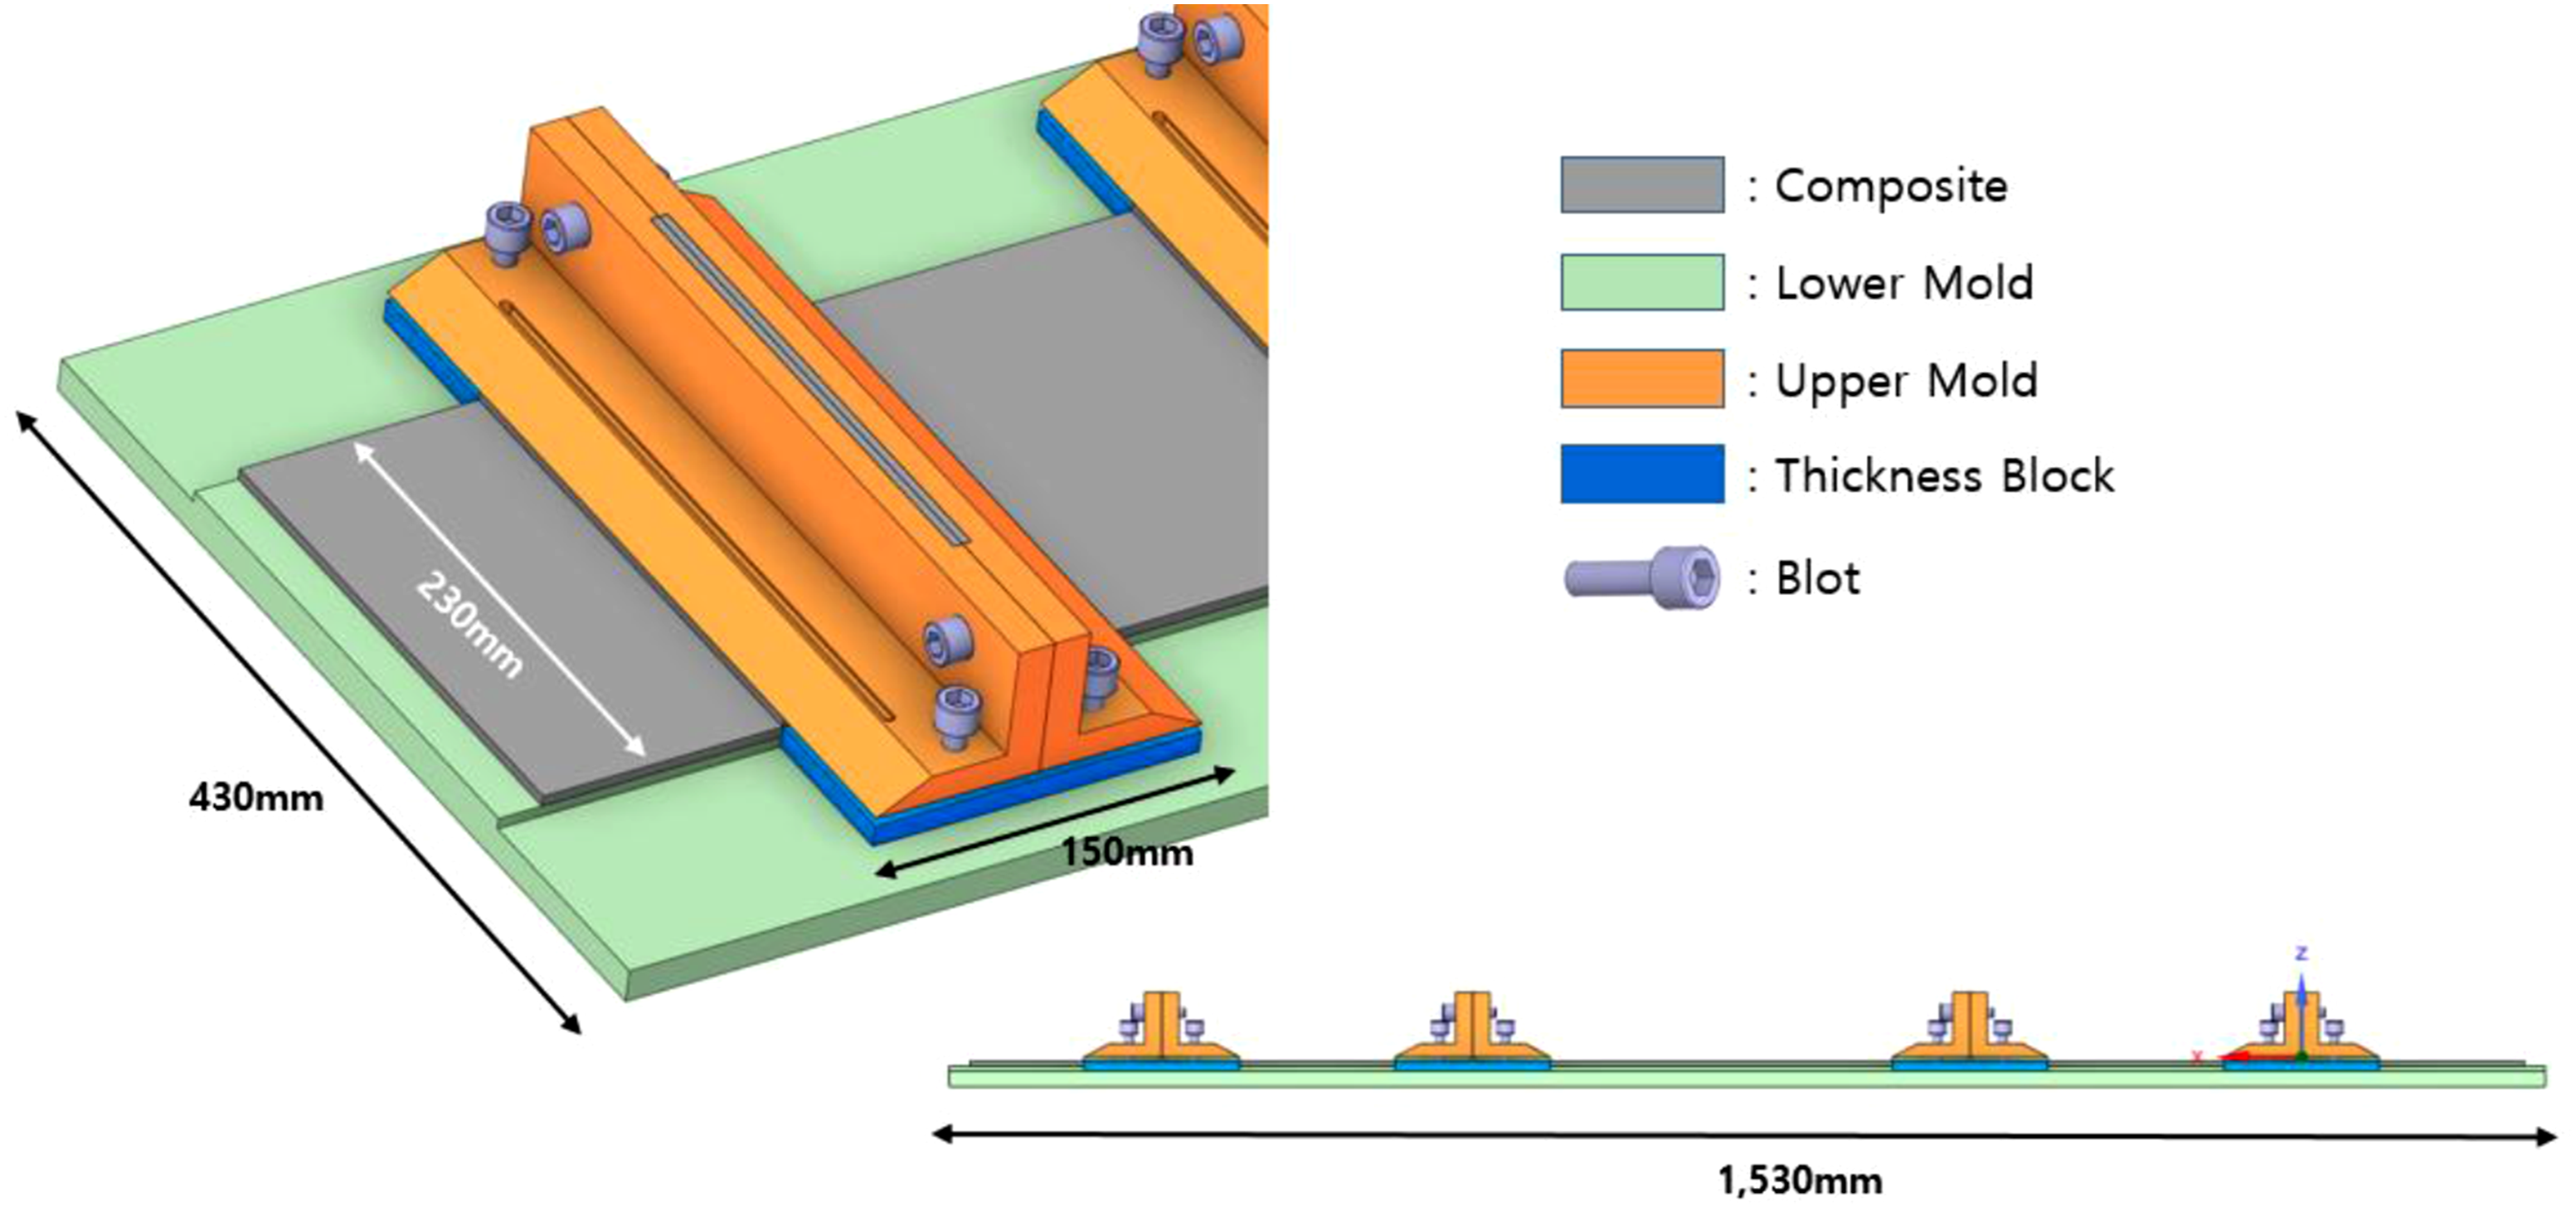
Figure 9 presents a schematic of the RTM equipment used to fabricate the segment composite panels under process conditions identical to those of the main wing composite structure. The system was designed to enable controlled filling and curing by regulating the inlet and outlet pressures. The inlet and outlet pressures of the segment panels were adjusted based on the average values of the time-dependent pressure distributions obtained from Figures 6–8. The same resin, fiber, and auxiliary materials used for the large-scale main wing composite structure were employed for the fabrication of the segment panels. Figure 10 illustrates the segment panel mold. The lower mold, measuring 1530 mm × 430 mm, was designed to allow bolted attachment of an upper mold with an integrated stringer geometry. A thickness block was inserted to ensure and control a uniform skin thickness. RTM equipment for segment panel manufacturing. Segment panel mold.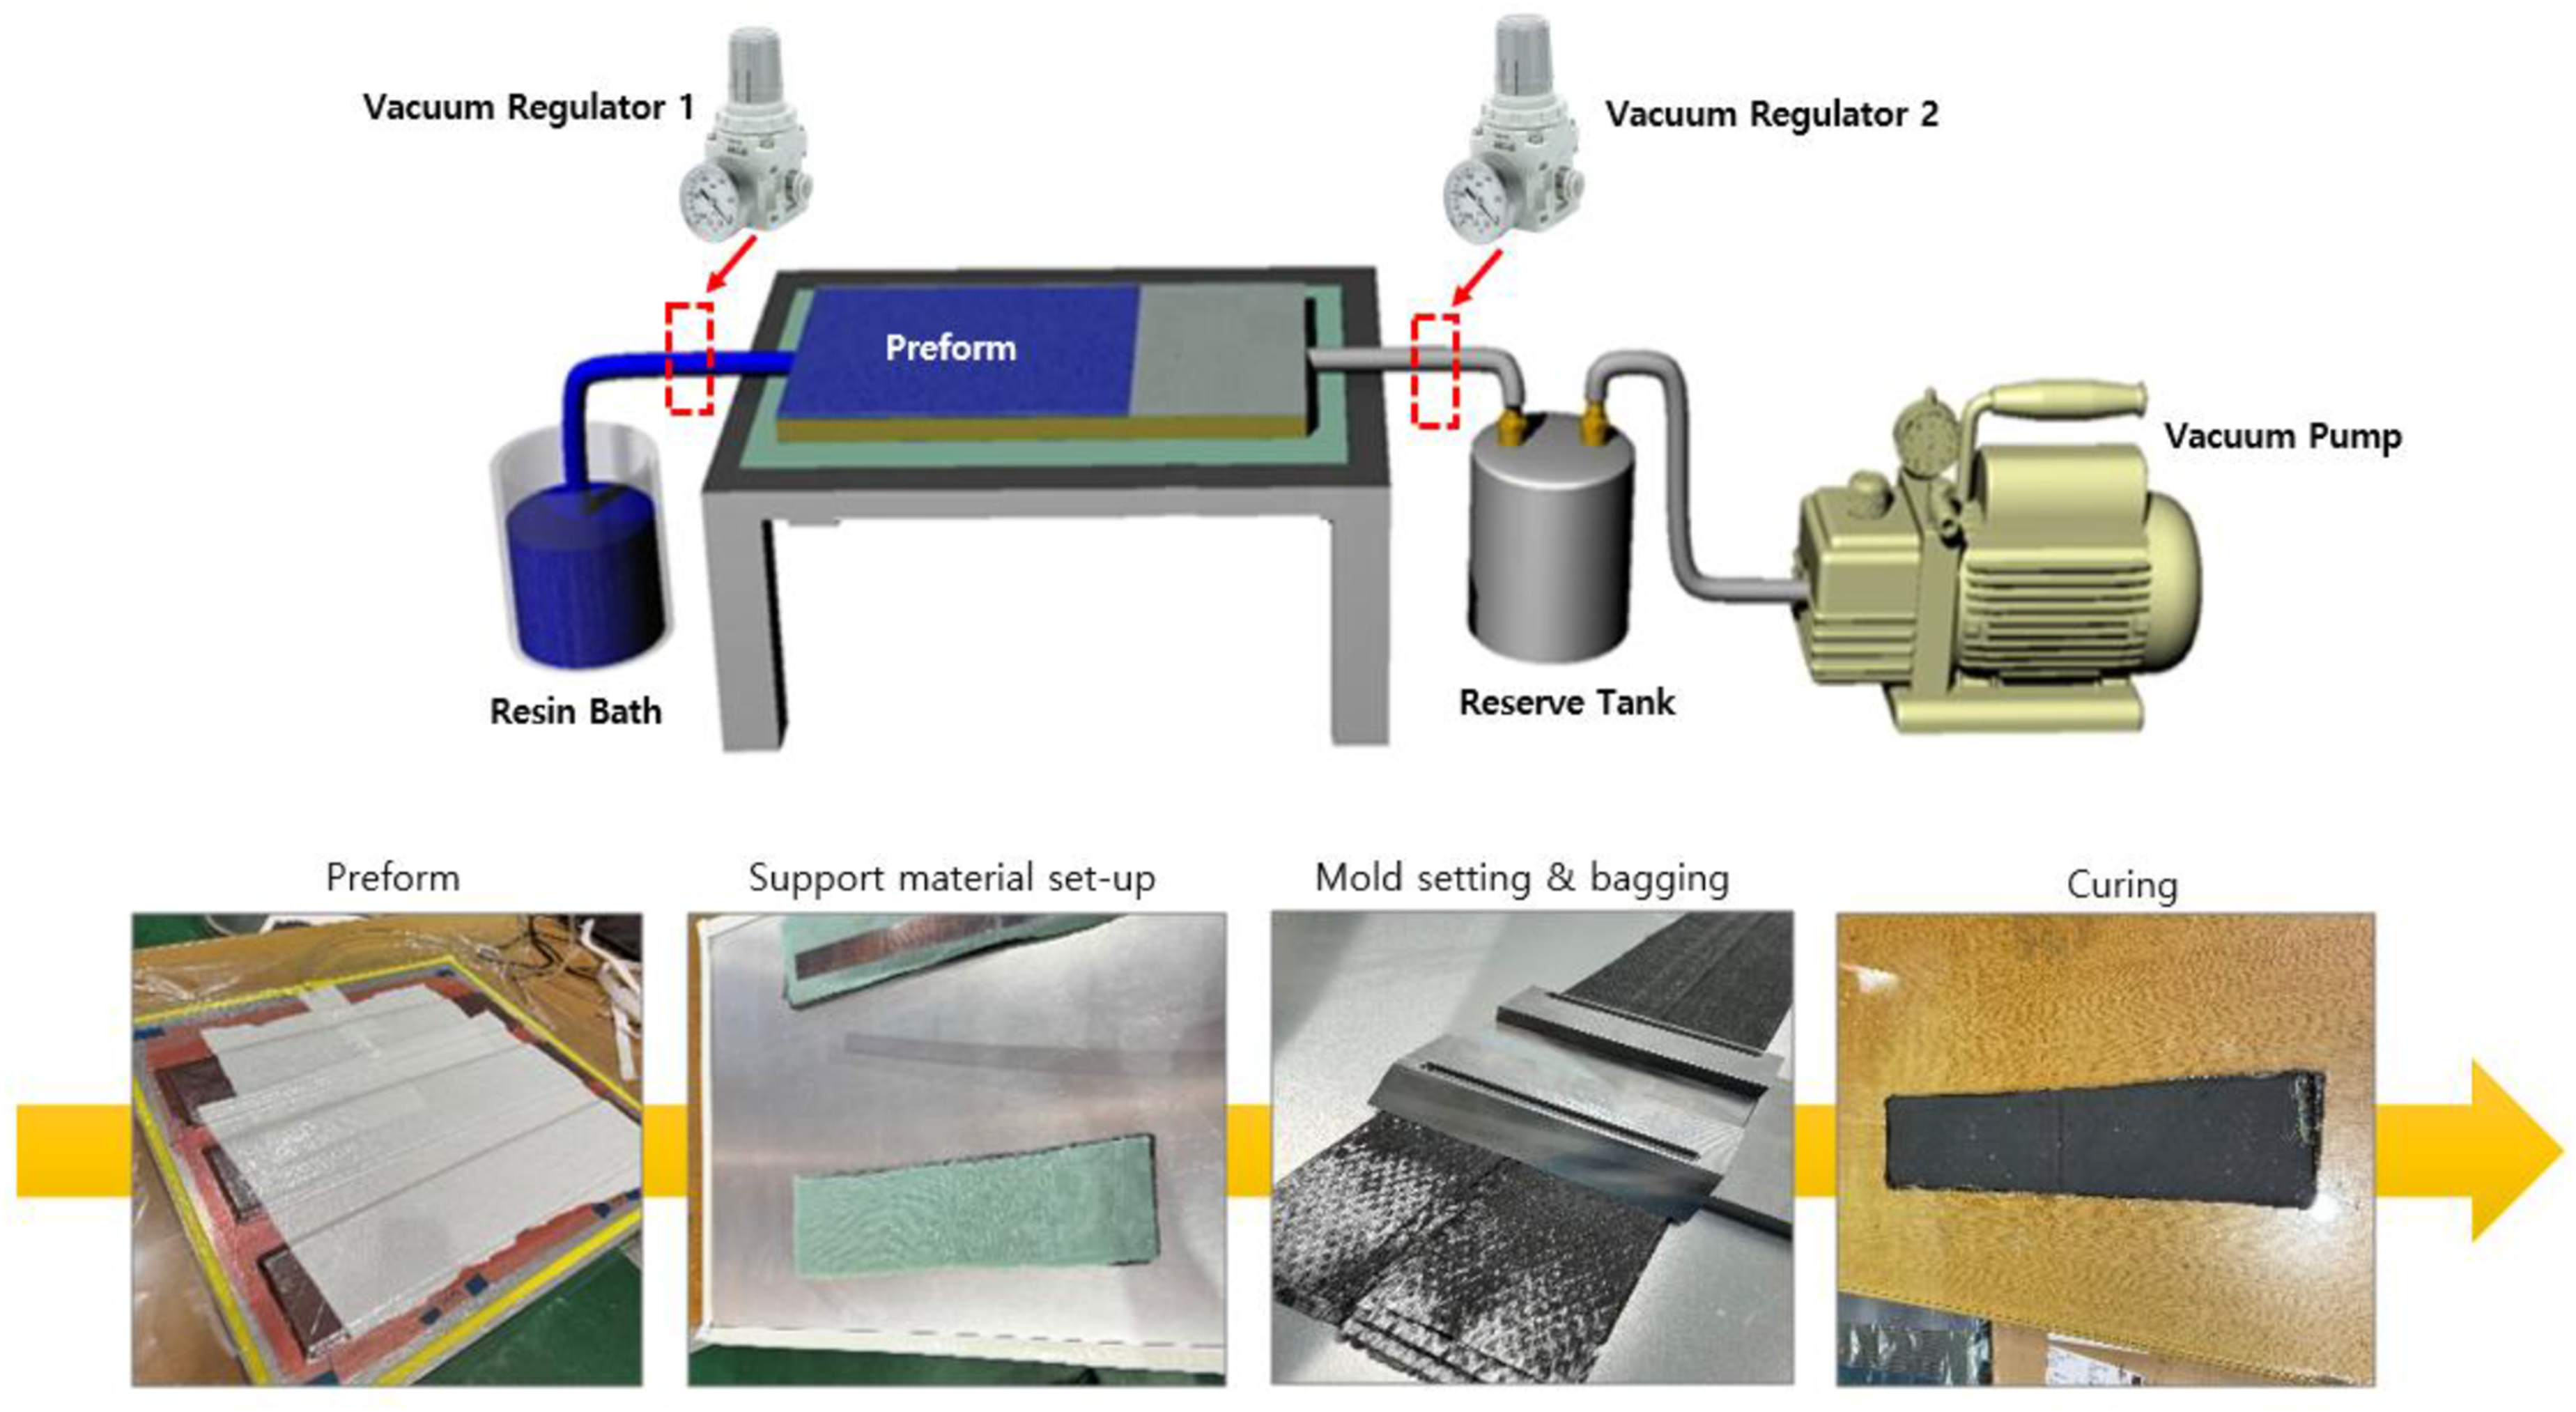
The resin system was a bi-component formulation, consisting of Part A (epoxy) and Part B (hardener) mixed at a ratio of 100:68.1 by weight. The mixture was stirred at 200 rpm, followed by vacuum degassing at 80°C for 60 min to ensure sufficient removal of entrapped air.
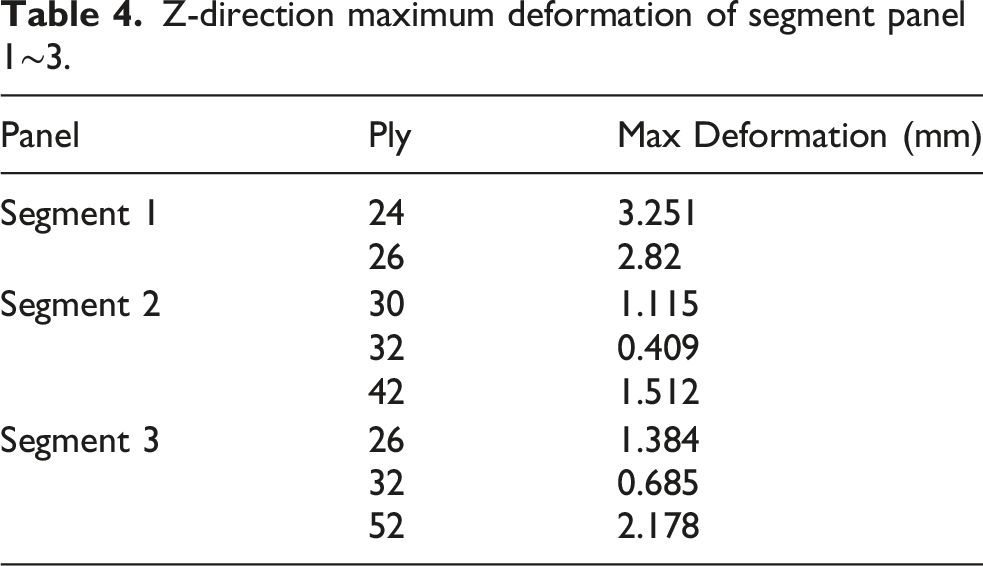
Figure 11 illustrates the measurement of z-direction residual deformation for a fabricated segment panel. One end of the panel was fixed, and the maximum displacement at the opposite end was measured. The results for each segment panel are summarized in Table 4. Measurement of maximum displacement in the z-direction. Z-direction maximum deformation of segment panel 1∼3.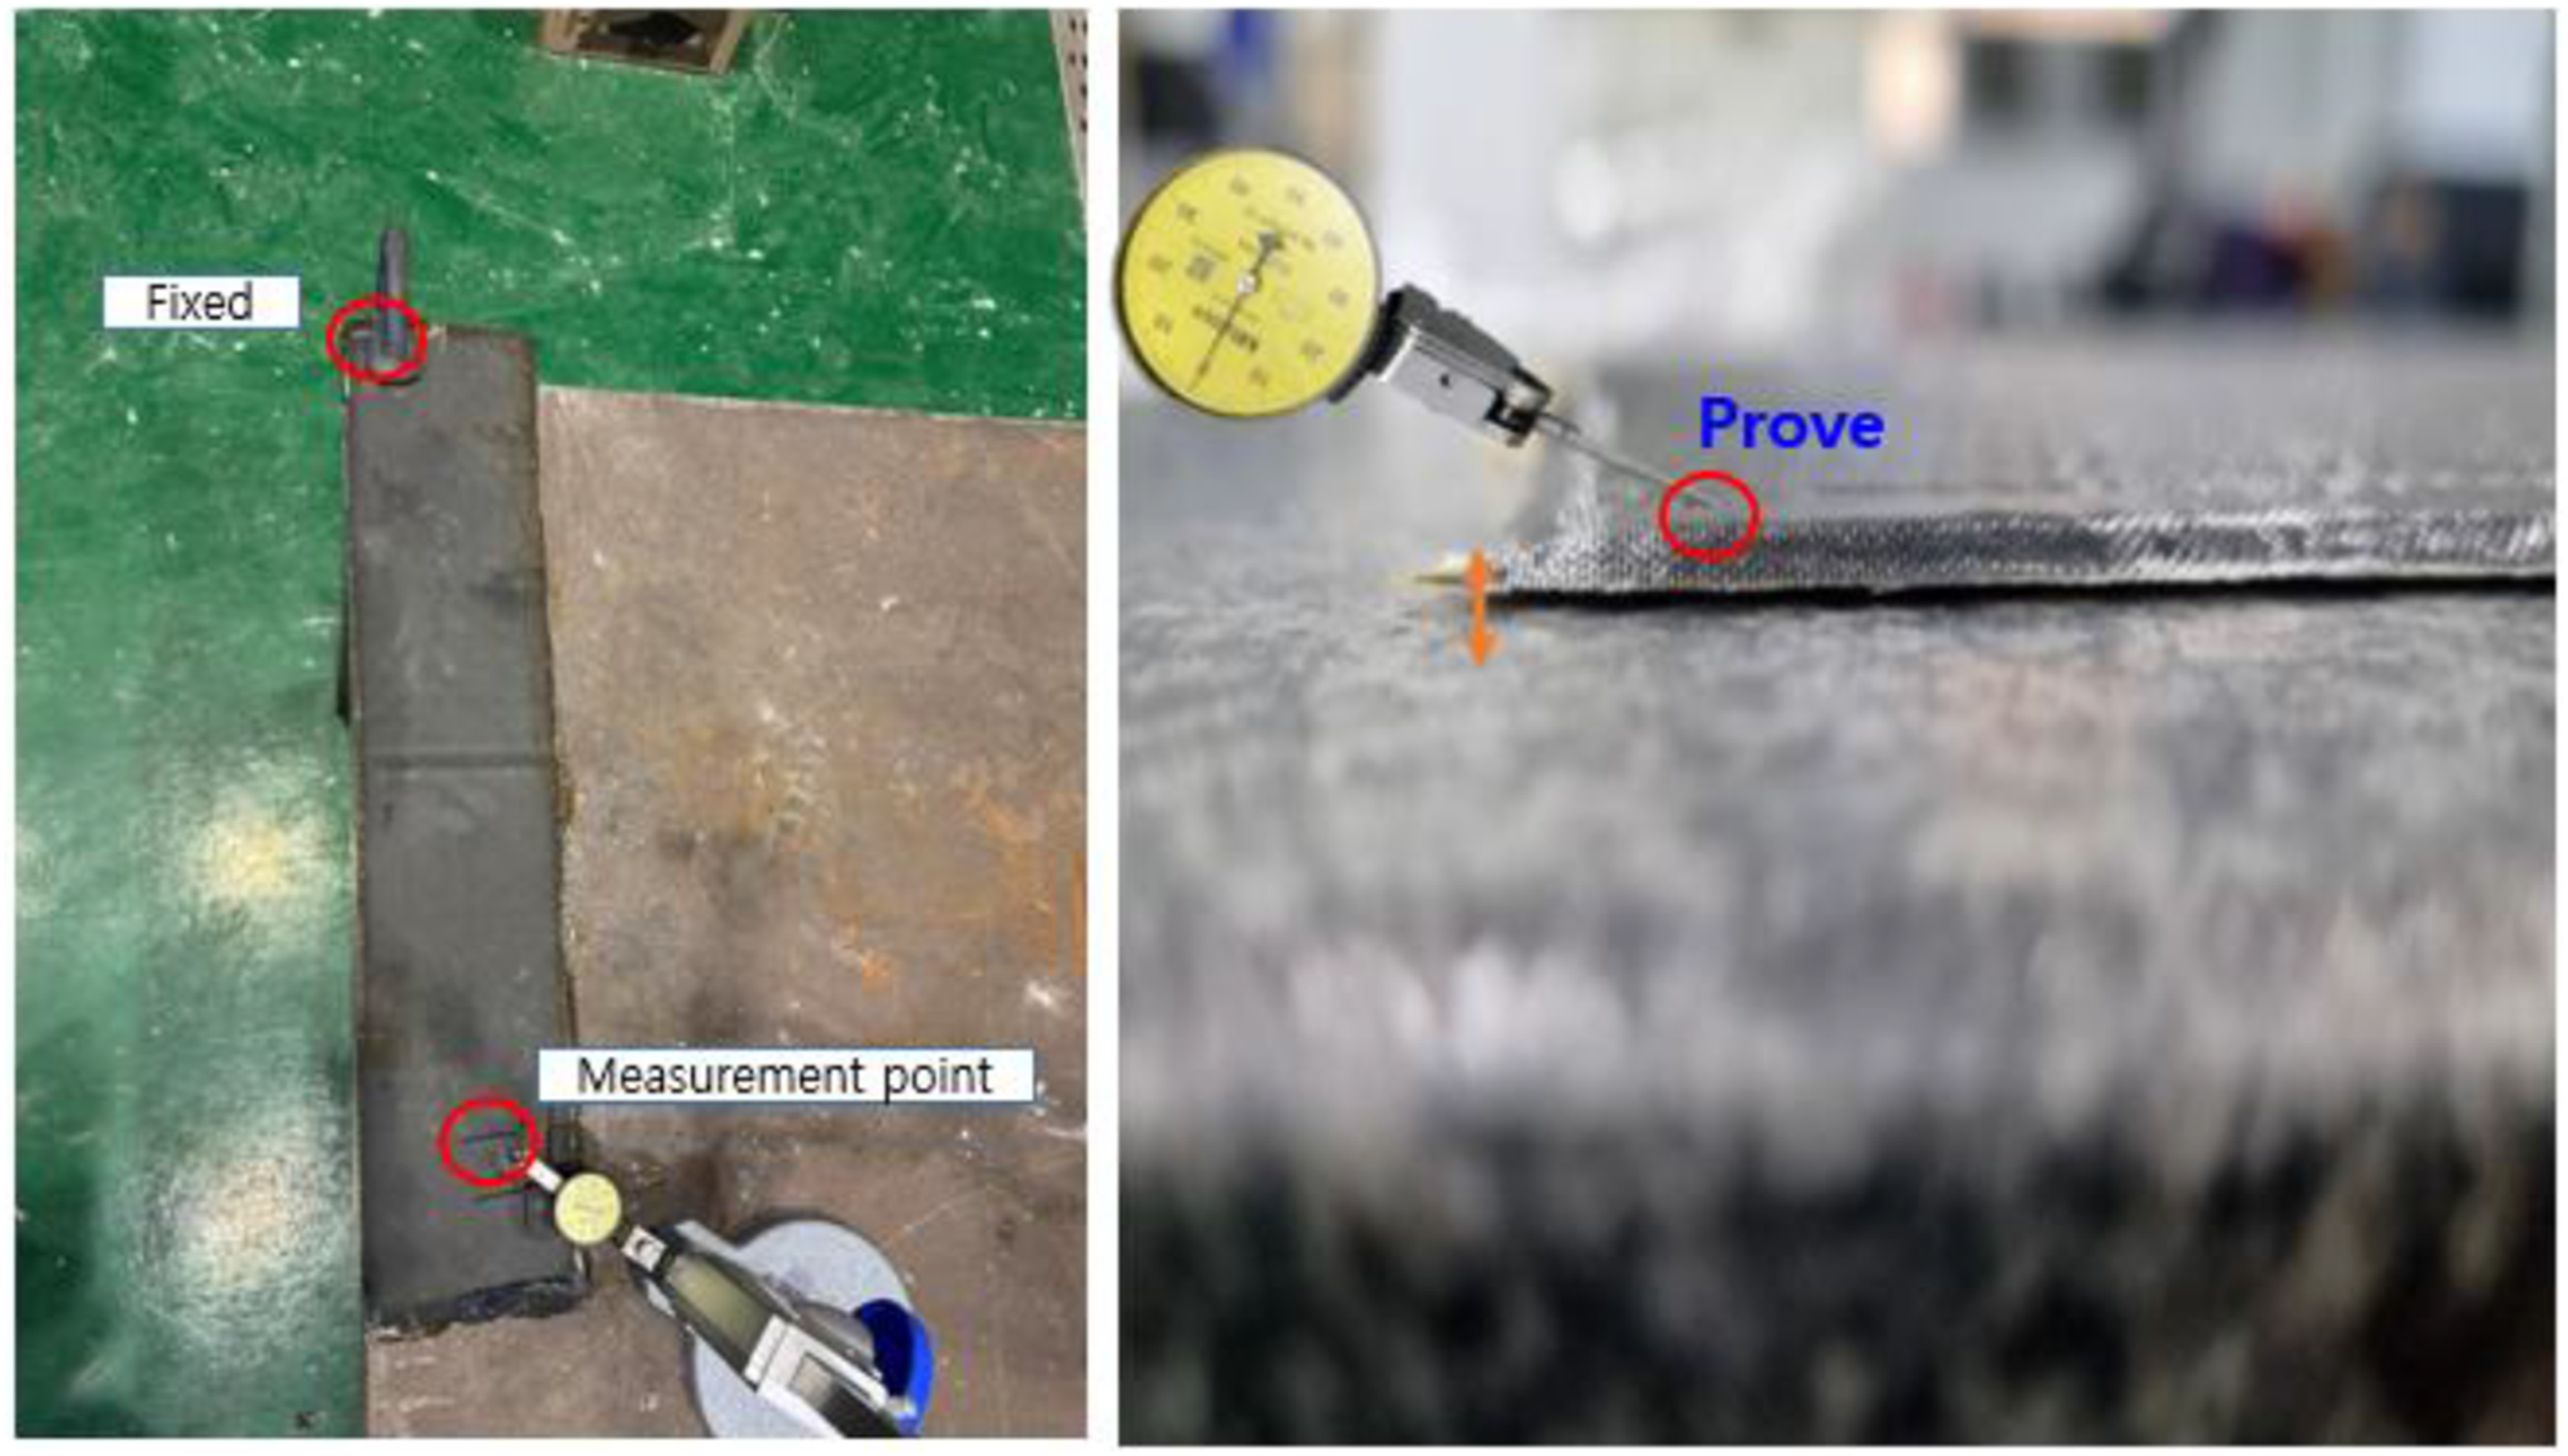
FVF measurement results of the segment panels.
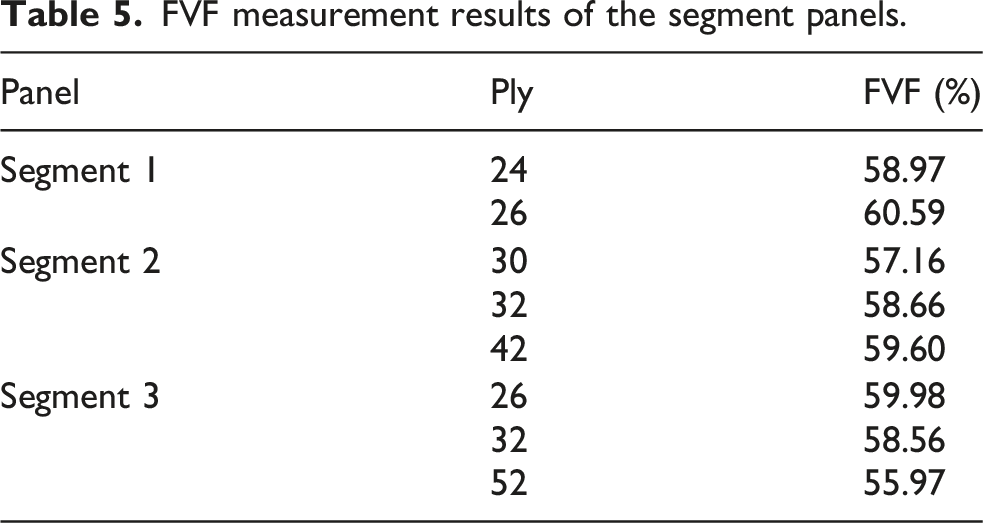
In addition, to complement the conventional acid digestion method and to enable more precise ply-wise fiber volume fraction (FVF) measurements, an optical microscopy–based image analysis technique was employed. Figure 12 illustrates the procedure in which cross-sectional images of the composite laminate were acquired using optical microscopy, and the laminate thickness and ply-wise FVF distributions were subsequently quantified.
15
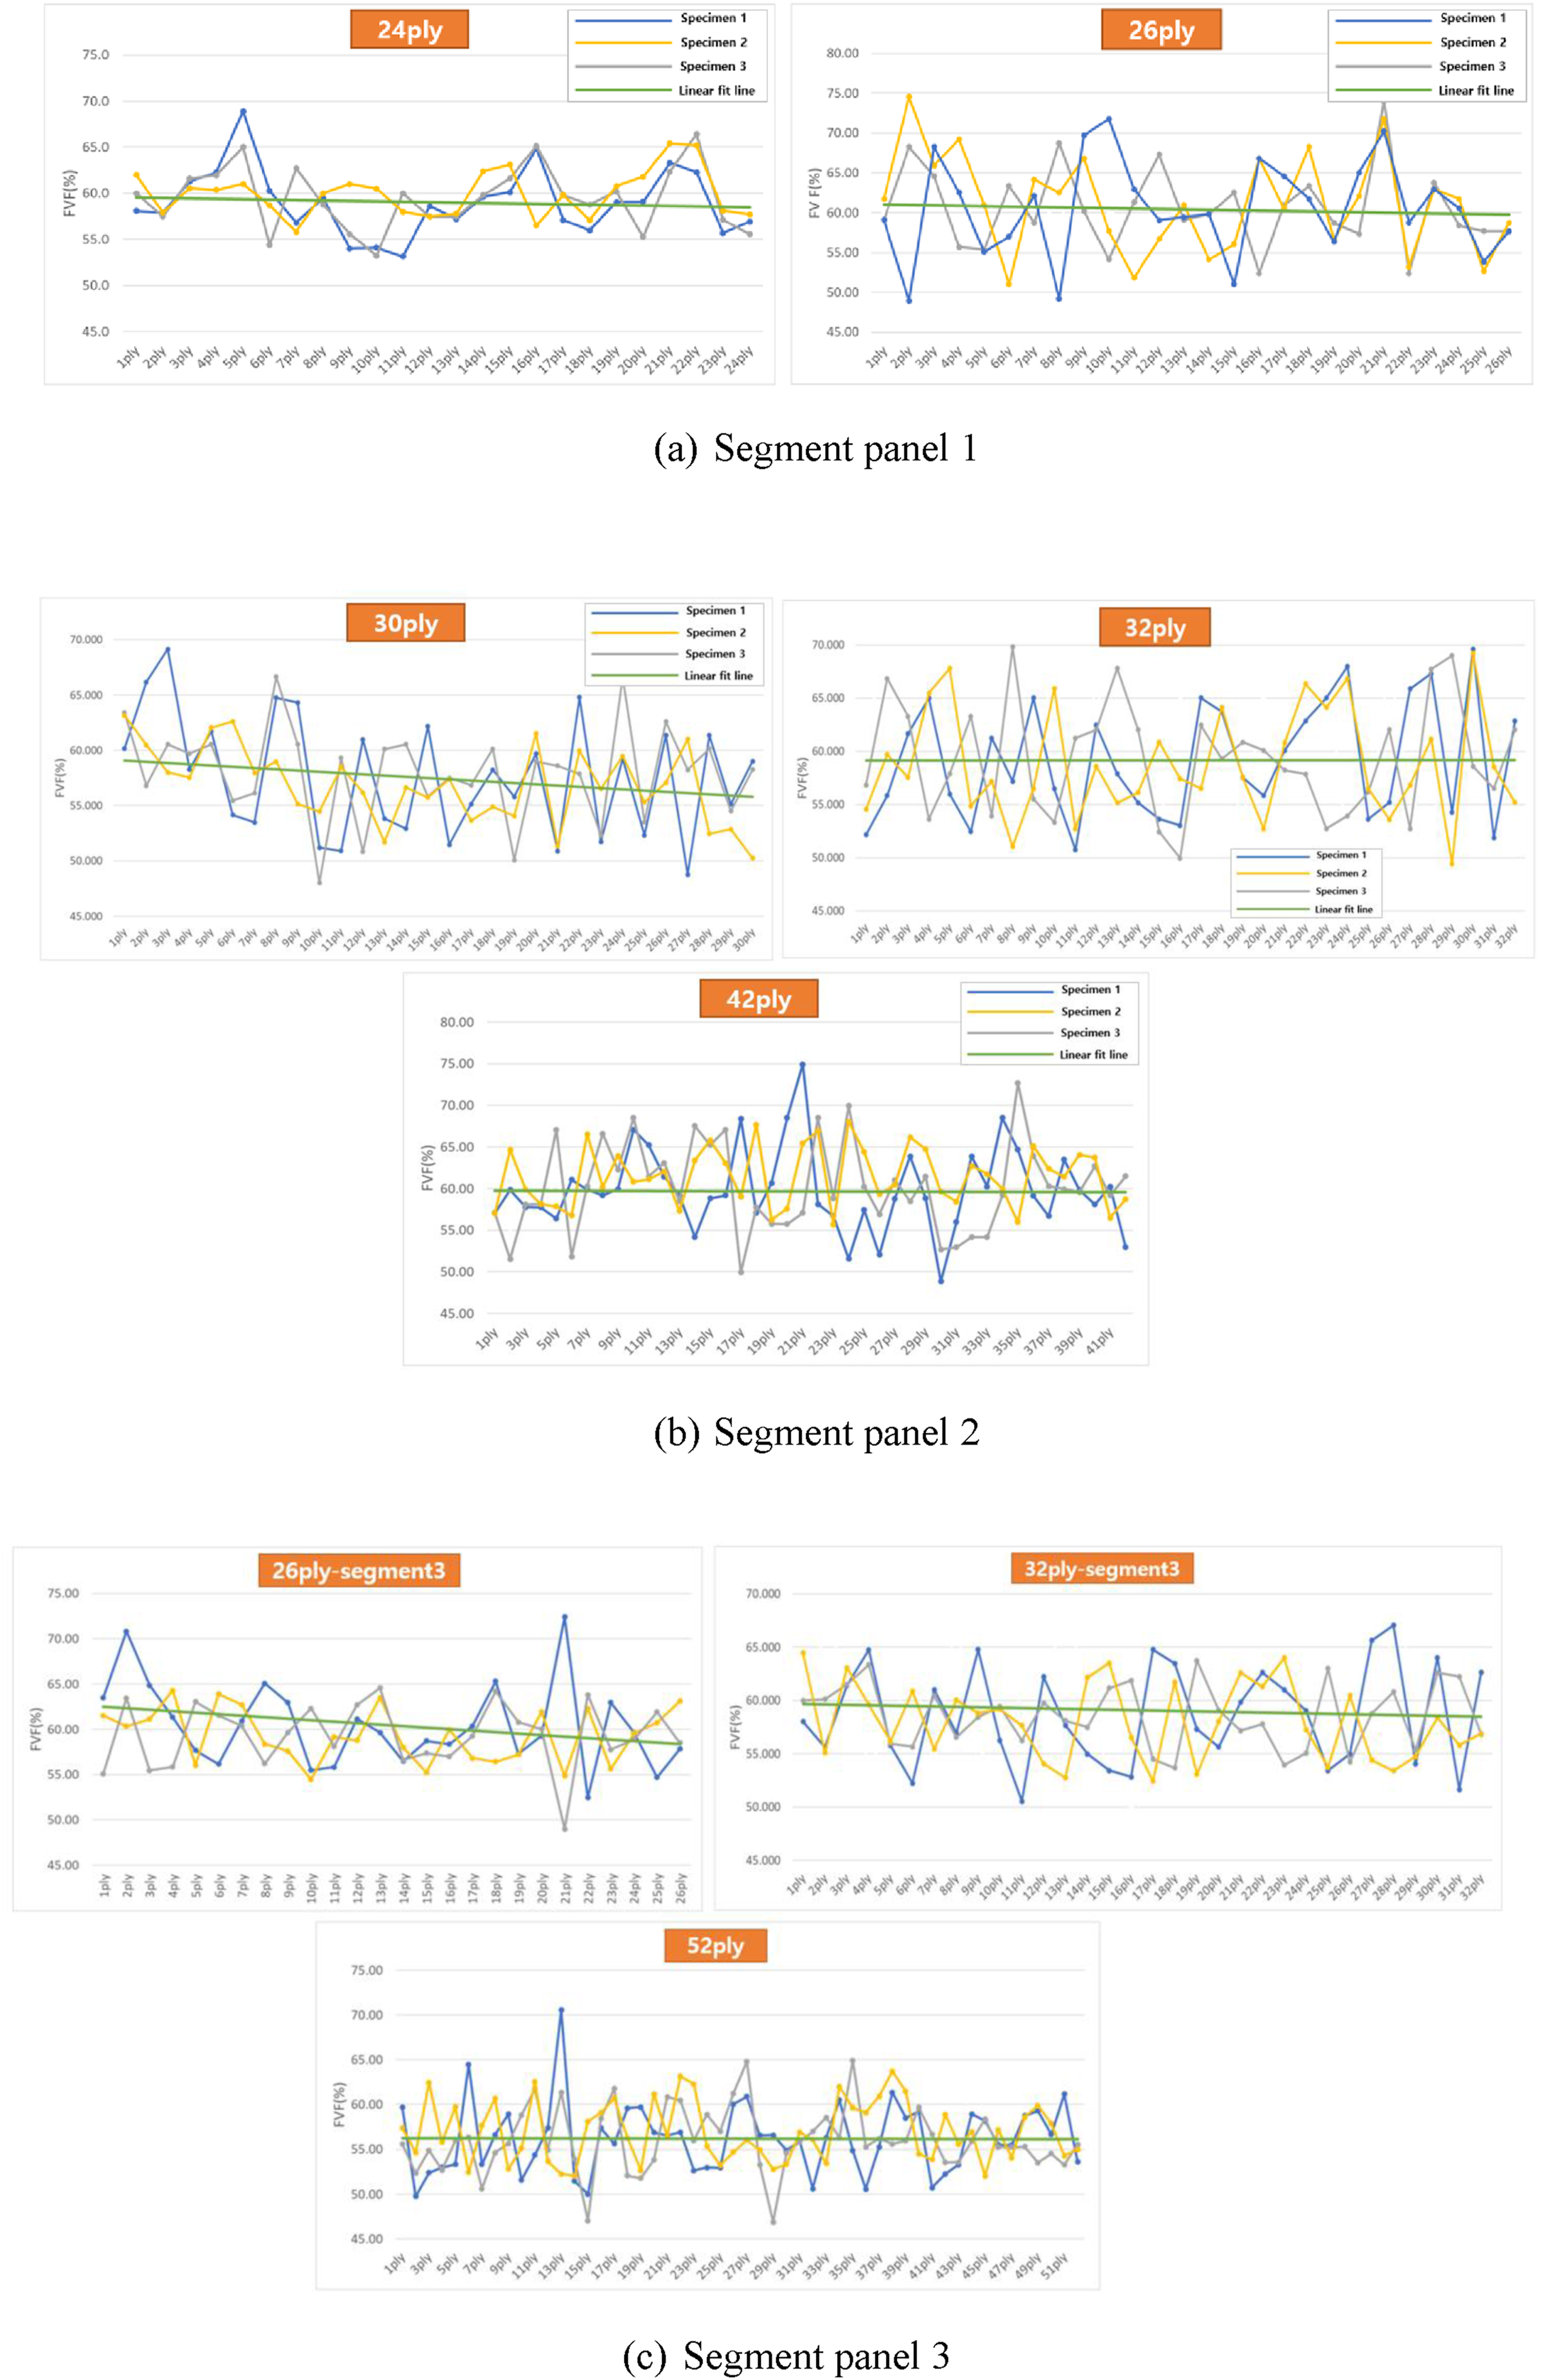
As shown in Figure 12, the ply thickness varies significantly with position, indicating pronounced non-uniformity through the laminate thickness. Figure 13 presents the average ply thicknesses and the corresponding FVF values, obtained by imaging three distinct zones over a width of 500 mm, for each segment panel. As evident from the figure, the FVF varies significantly between layers and within layers throughout the laminate. Since it is impractical to measure and model all local, ply-level fluctuations observed within individual layers across the entire cross-section, a first-order trend line was derived from the measured FVF data to capture the macroscopic distribution tendency. The resulting trend indicates that the FVF near the mold-contact surface of the composite panel is consistently higher than that in the upper layers. Ply-wise FVF and thickness measurement using image analysis
15
. FVF distribution measured by image analysis method.
Thermal residual deformation analysis of segment panel
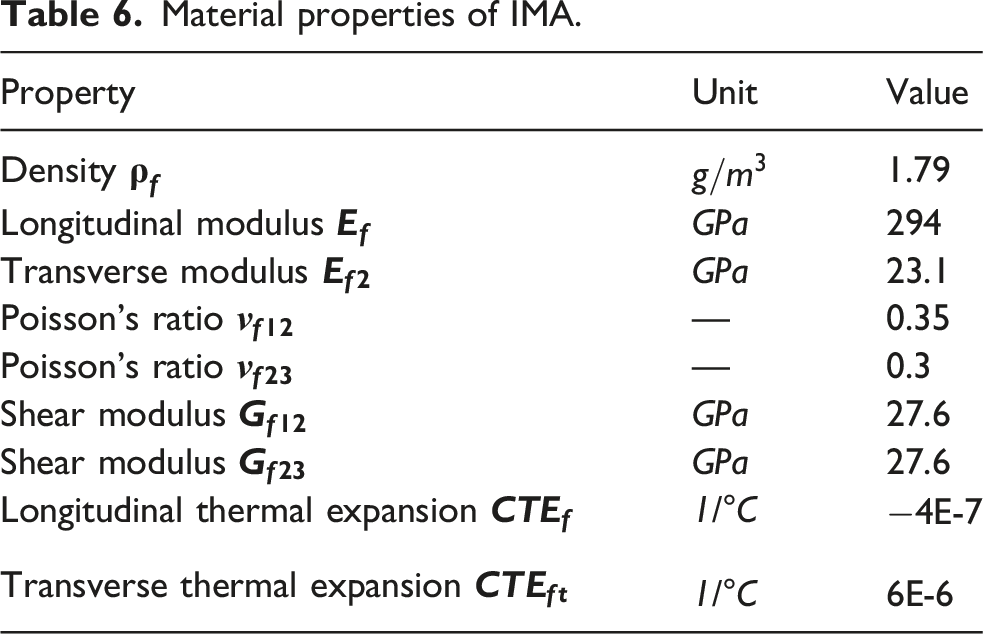
Material properties of IMA.
Material properties of RTM 6-2.
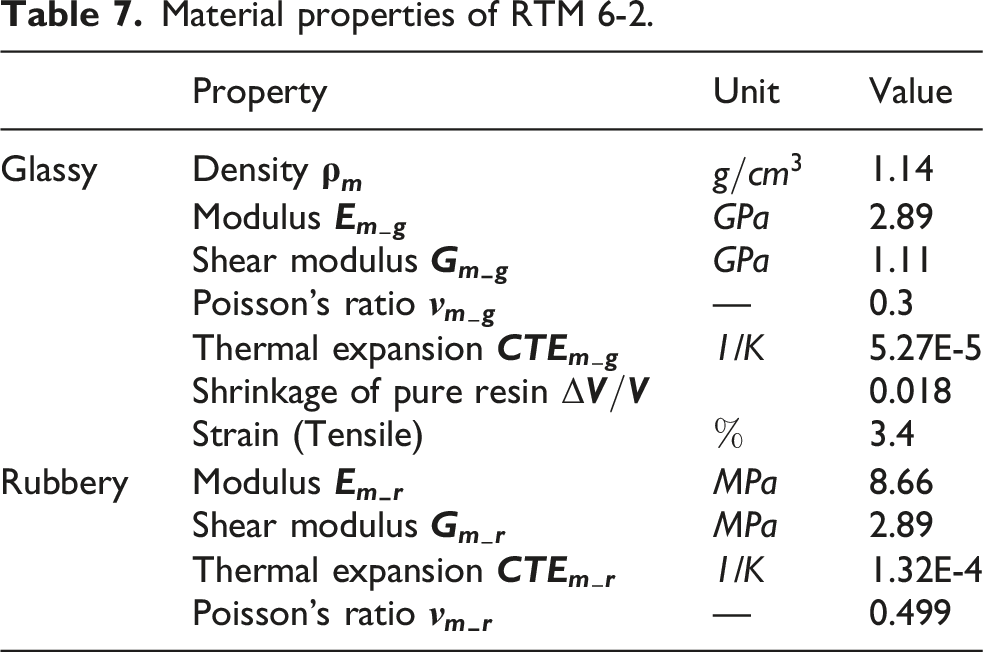
Residual thermal deformation in composite materials arises from both the intrinsic thermal expansion of the constituents and the chemical shrinkage of the resin during curing. The coefficients of thermal expansion (CTEs) of composites evolve with curing progress as a result of changes in the mechanical properties of the fiber and resin, as well as variations in the FVF.
The longitudinal CTE of a composite ply are typically calculated using the rule of mixtures, as expressed below16,21,22: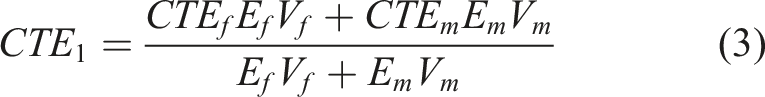
The transverse thermal expansion coefficient of the ply is given by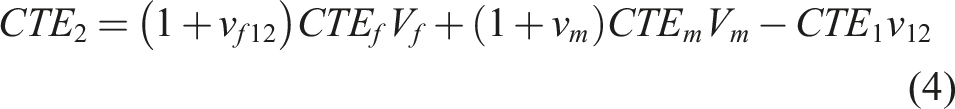
In addition to thermal expansion, chemical shrinkage strains are generated during resin curing. The longitudinal and transverse chemical shrinkage strains of the ply can be expressed as follows: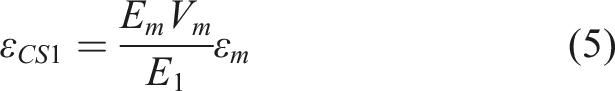
Accordingly, the total ply strains induced by thermal expansion and chemical shrinkage can be obtained as

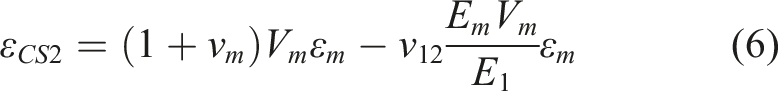
As shown in Figure 13, the FVF exhibits significant variation both between and within individual plies throughout the laminate. Because it is not feasible within the scope of this study to explicitly model all local ply-level fluctuations across the entire cross-section, a first-order trend line derived from the measured FVF data was implemented in the finite element analysis to evaluate the thermal residual deformation behavior. Figure 14 presents the finite element model and boundary conditions of the segment panel. Figure 15 shows the thermal residual deformation of segment panel 1. With one corner fixed, the maximum displacement in the z-direction at the opposite corner was calculated to be 2.015 mm. Boundary condition of segment panel. Thermal residual deformation of the segment panel 1.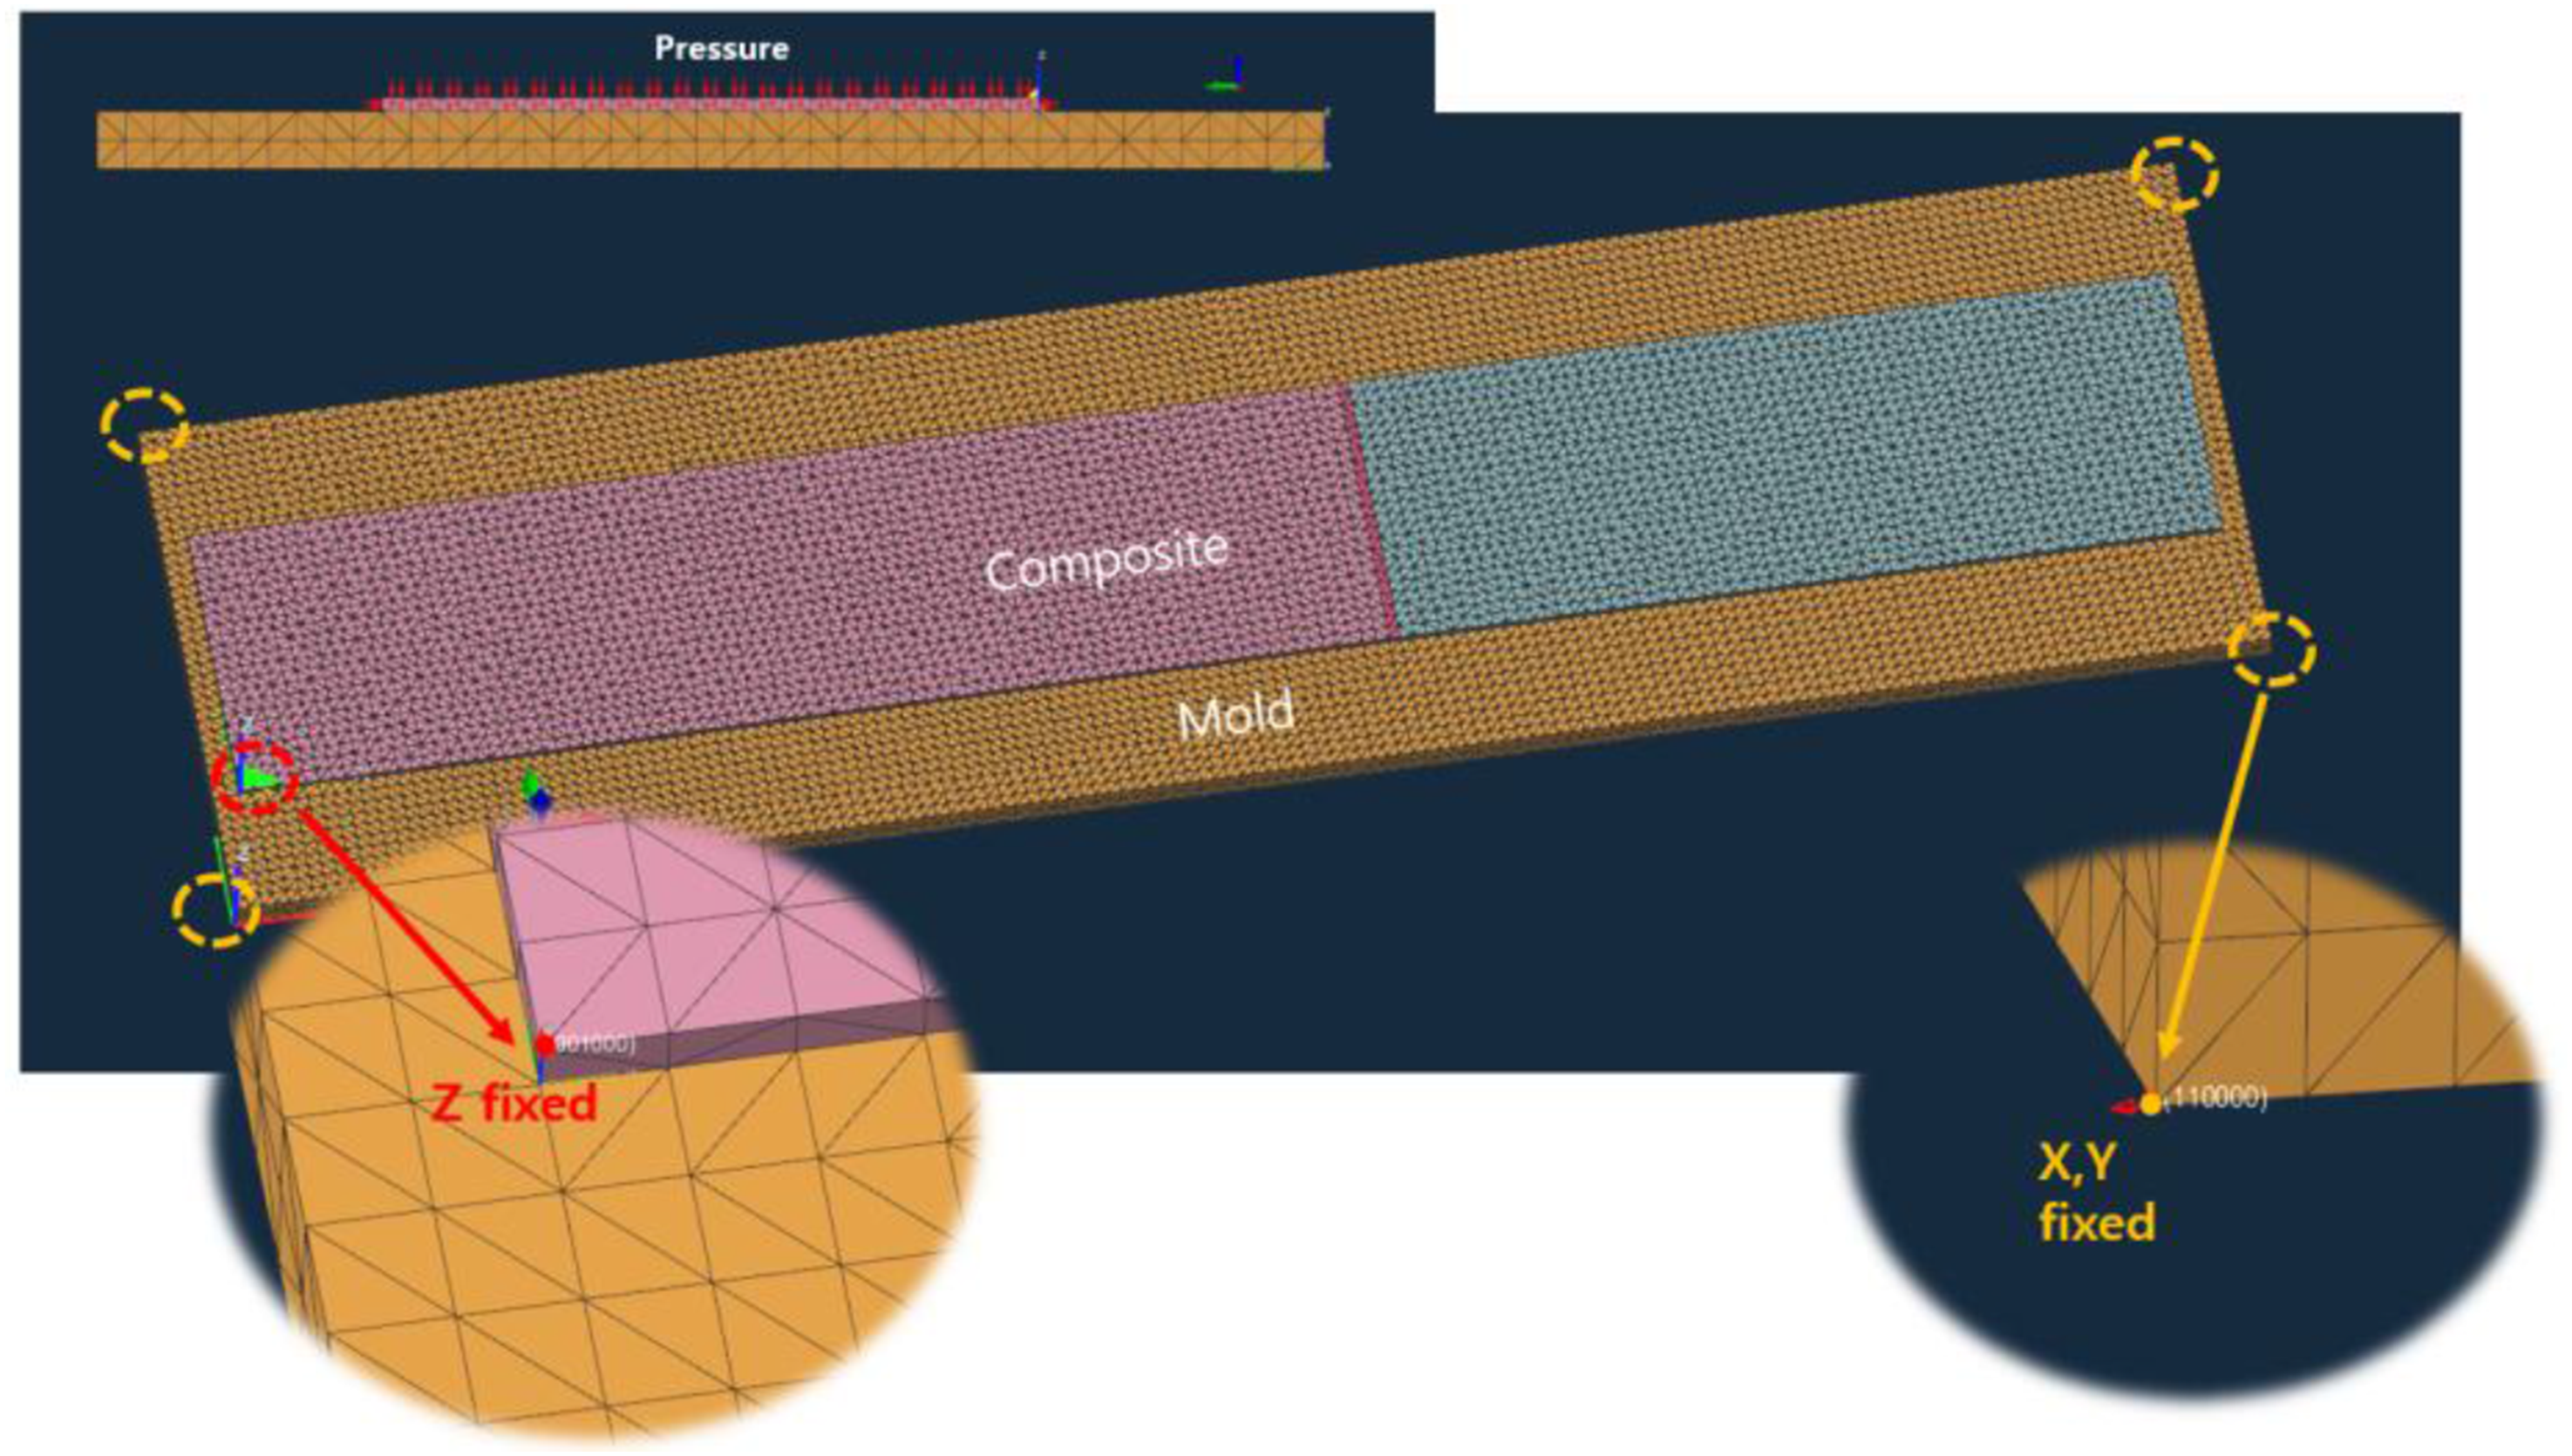
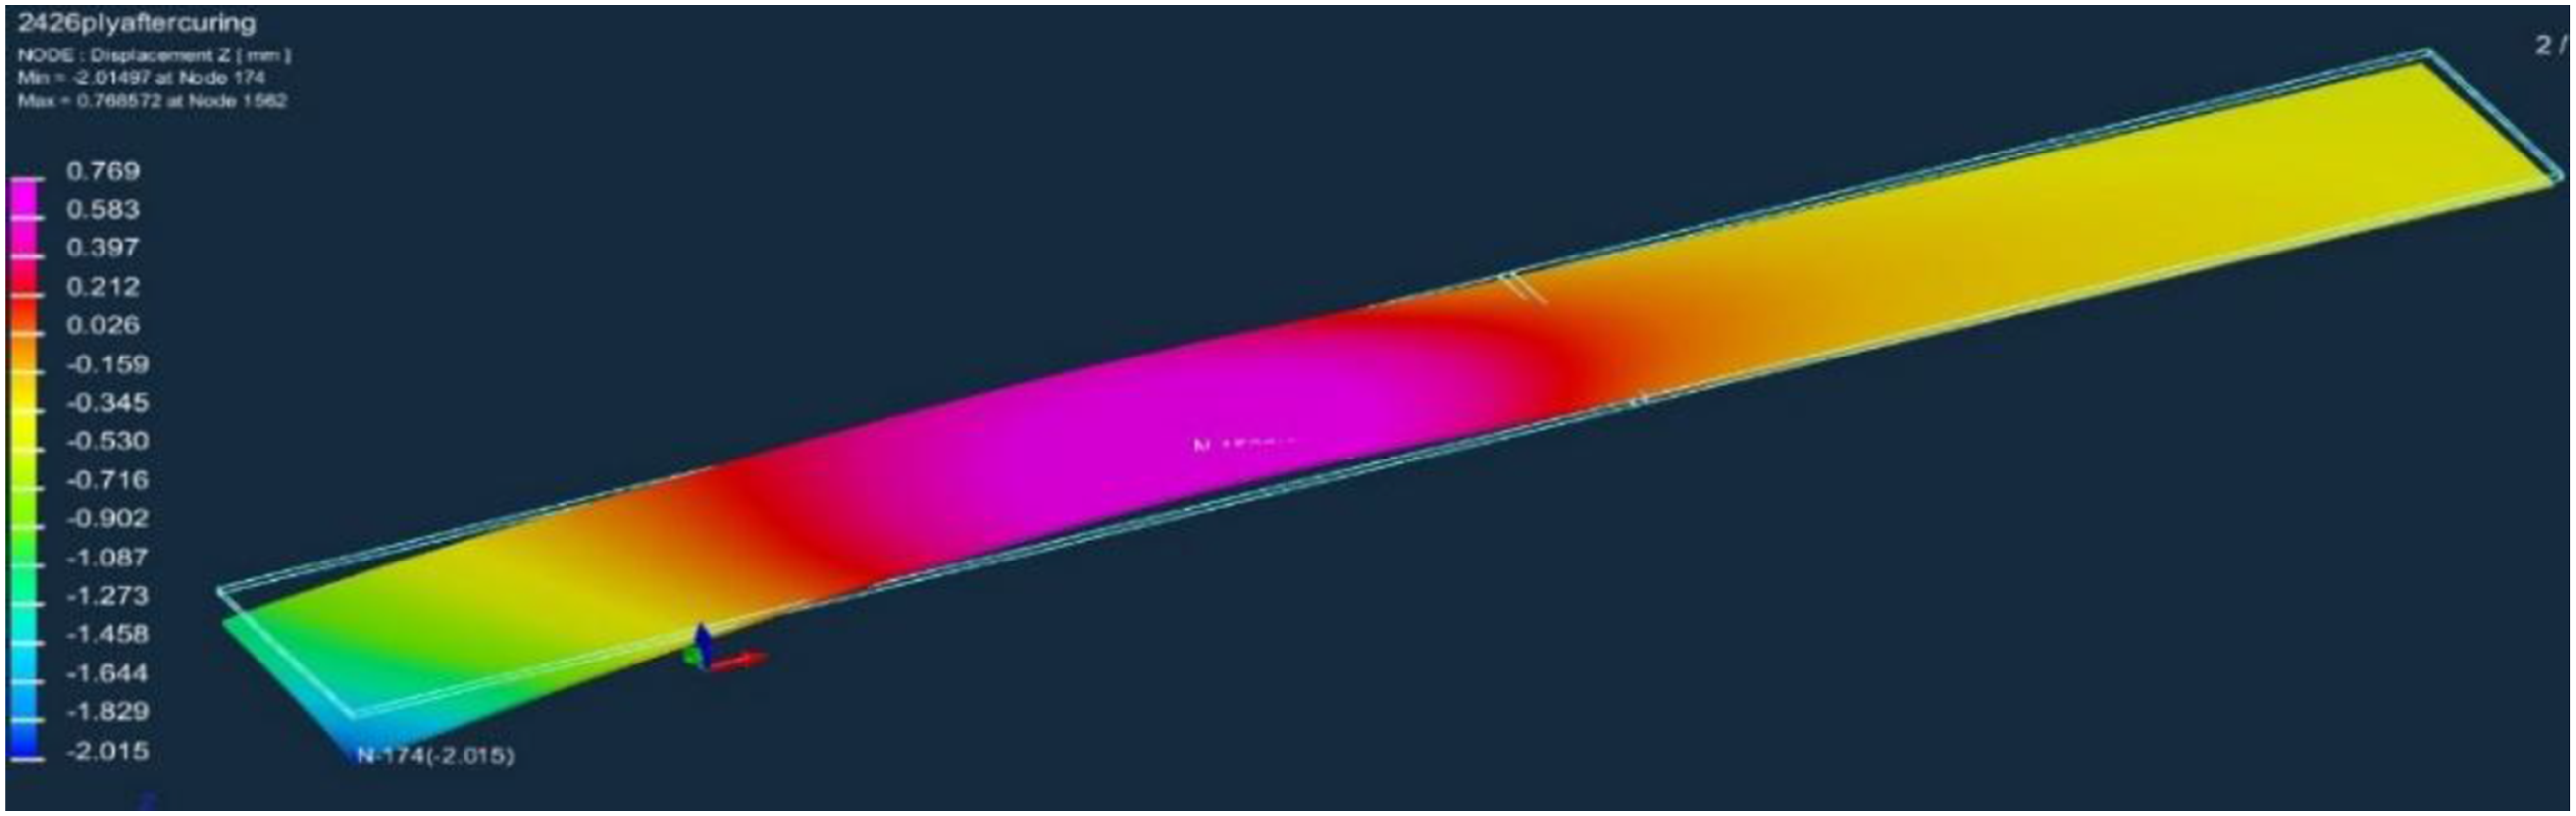
Figure 16 compares the FE predictions with the experimental results summarized in Table 4, revealing a maximum error of 56.3%. Such discrepancies between the analytical predictions and experimental results arise not only from inherent manufacturing-induced variability—such as non-uniform temperature distributions during curing, mold geometry, and curing accessories—but also from the simplification of the FVF distribution using a first-order trend, which cannot fully capture local ply-level fluctuations throughout the laminate. Comparison of maximum thermal deformation between FE analysis and experimental results.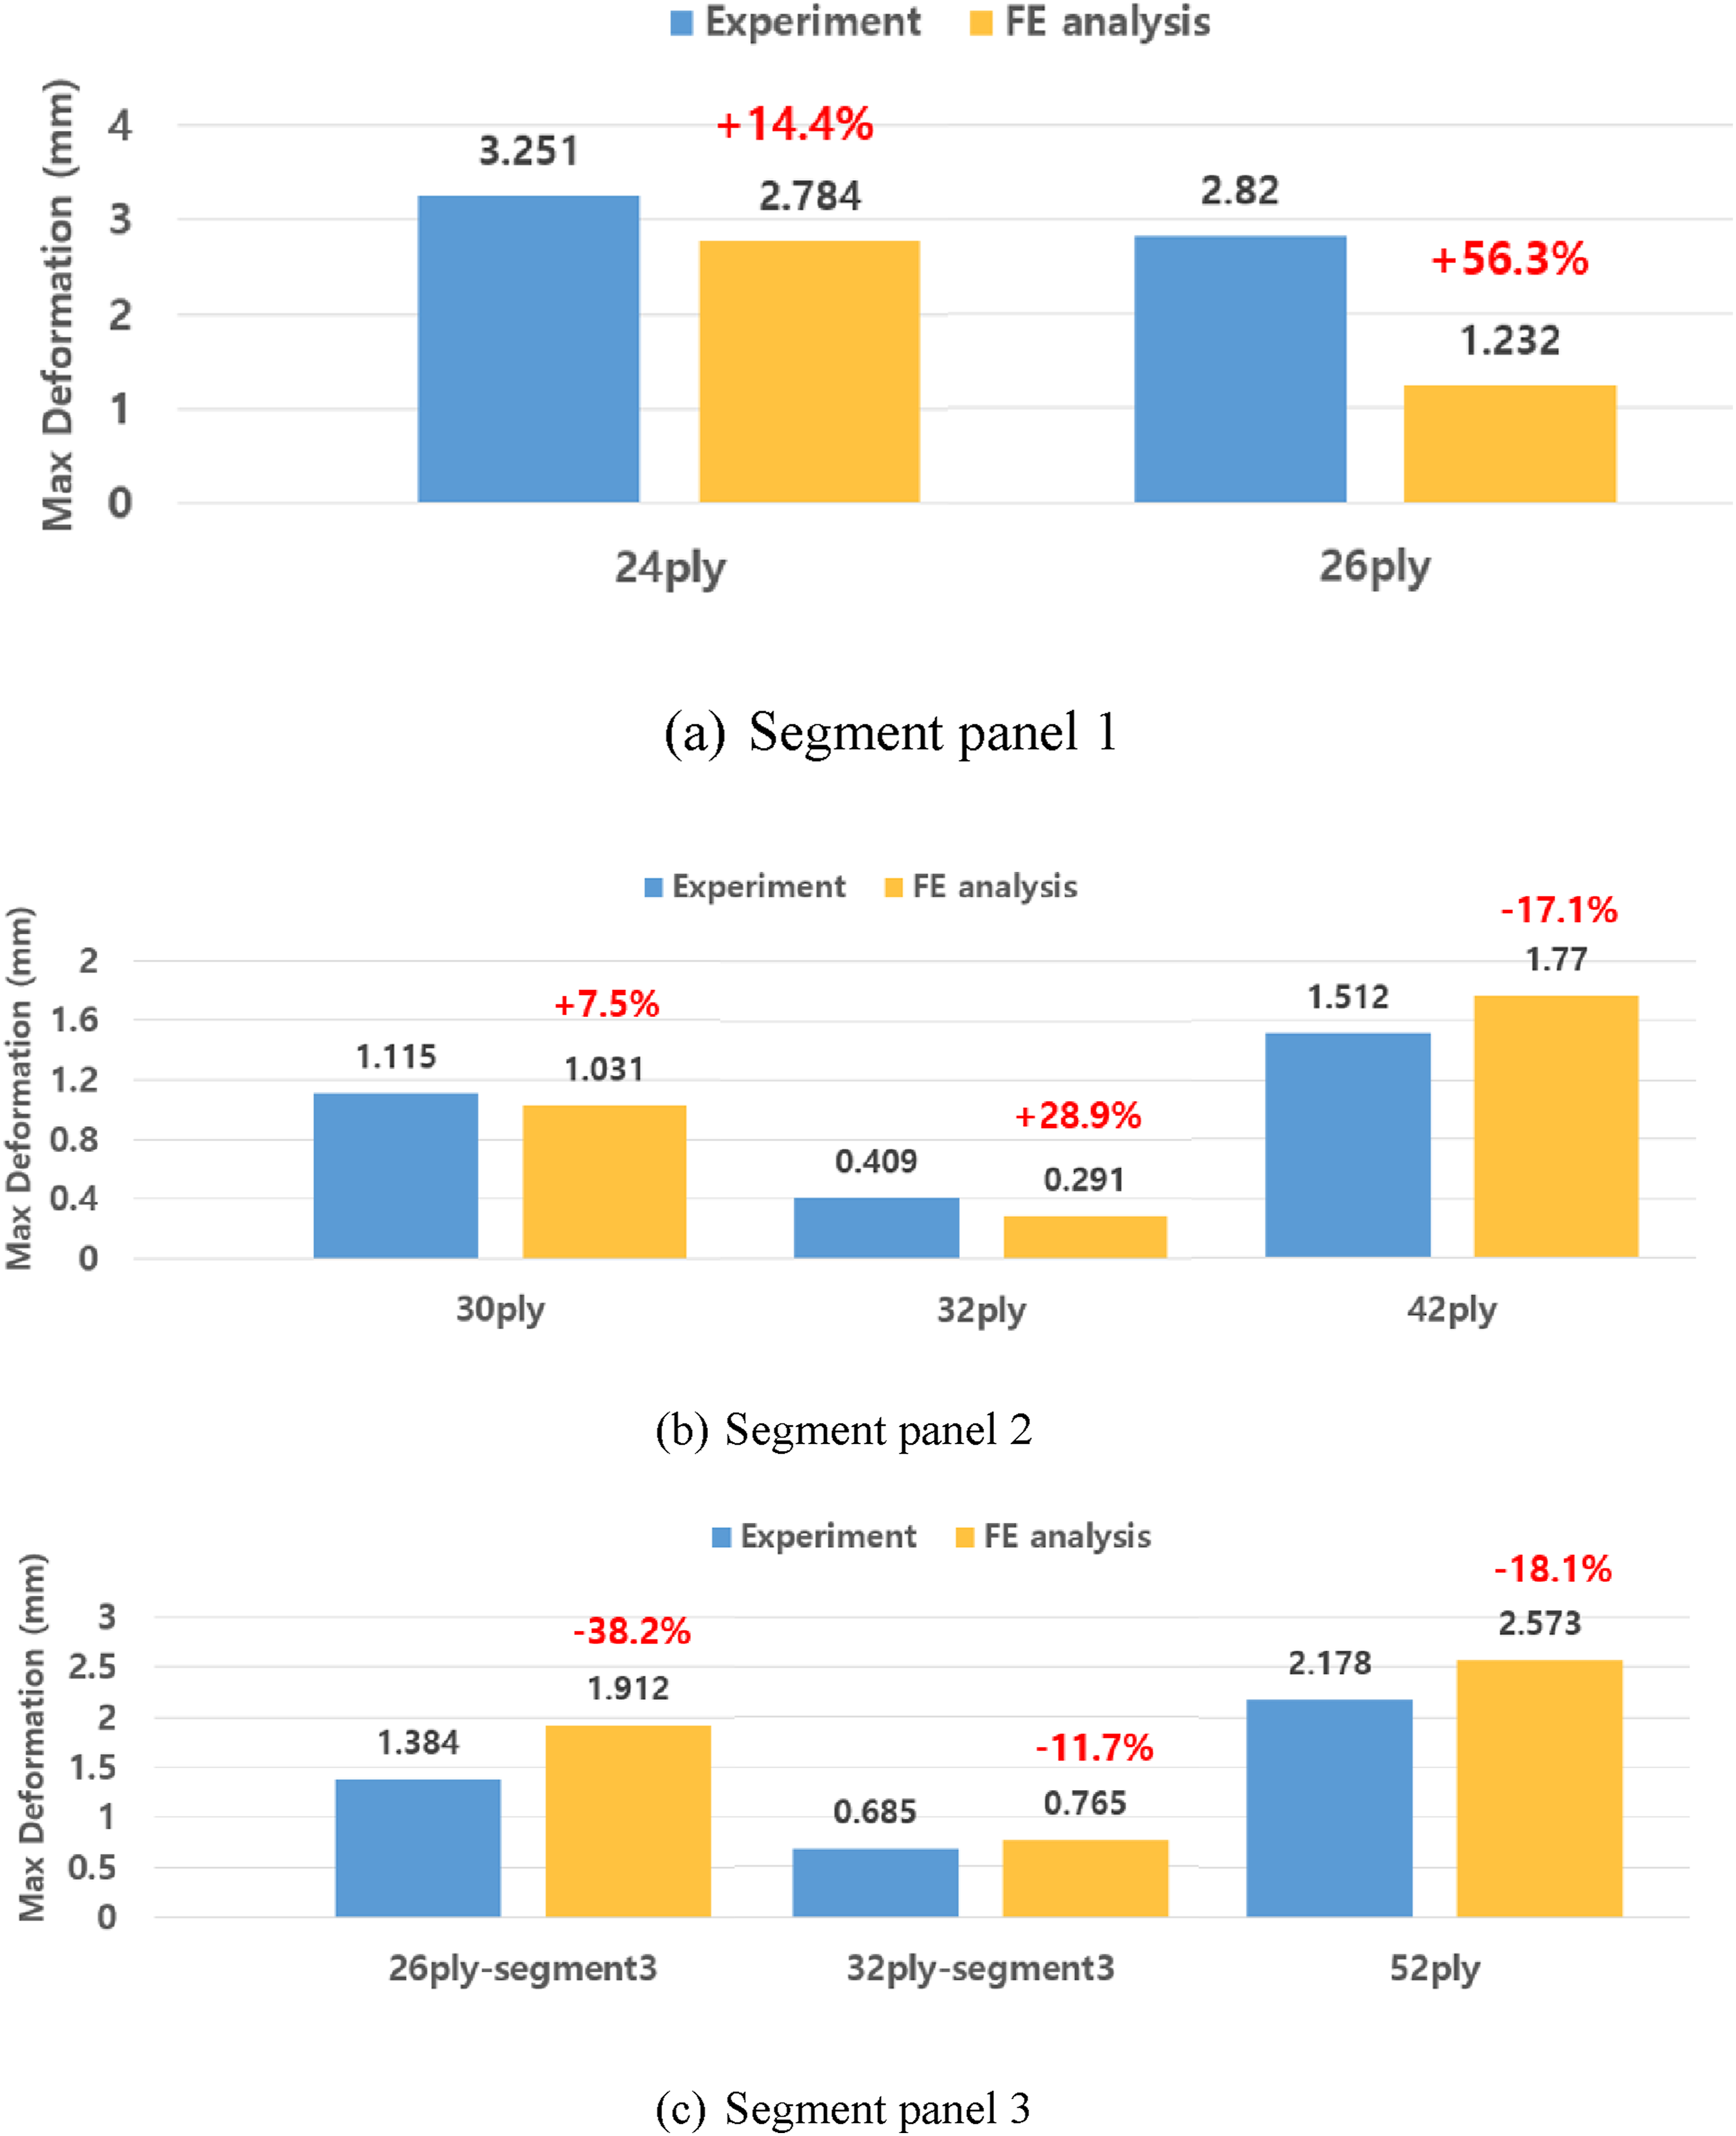
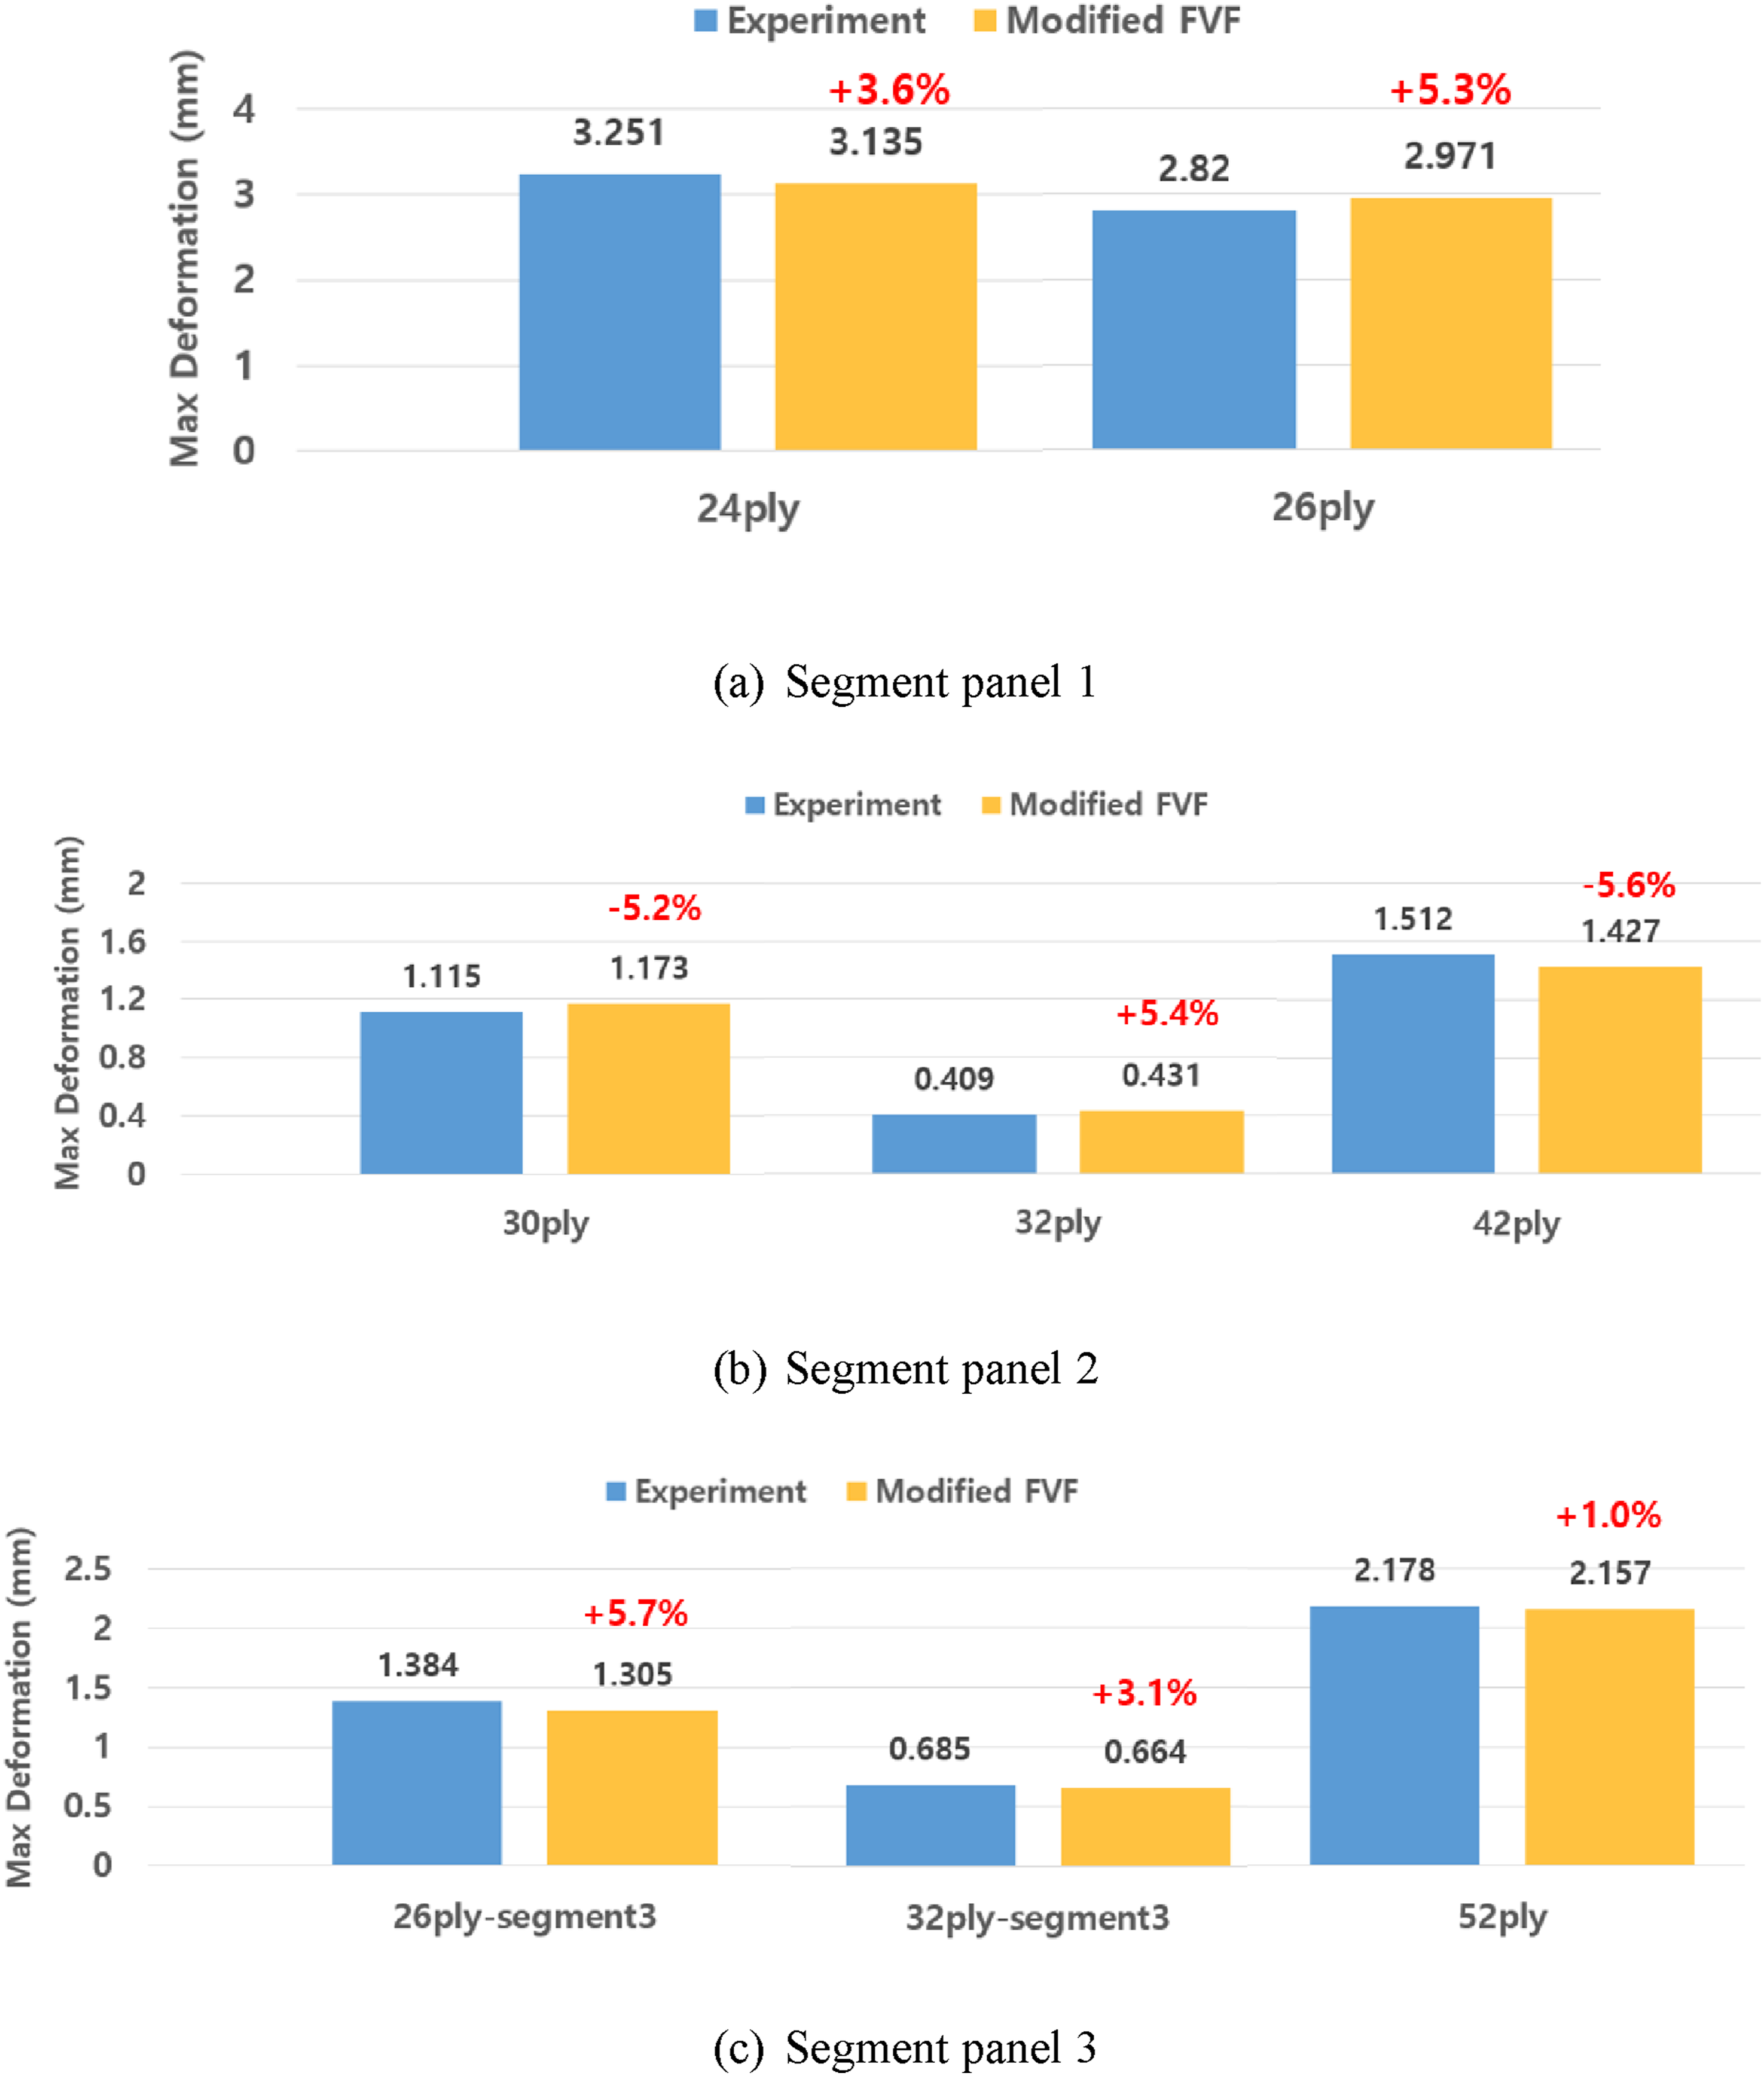
To address these limitations, a calibration procedure was implemented using the experimentally measured deformation of the segment panels. The purpose of this calibration was not to arbitrarily tune the model response, but to identify an effective ply-wise FVF distribution capable of representing unresolved manufacturing-induced variability. The segment-panel deformation data were therefore used to refine the effective FVF distribution within the segment-level model. Figure 17 presents the calibrated FVF distribution, where significant adjustments were made at ply 52 of Section 3, while smaller corrections were applied to plies 30, 32, and 42 of segment panel 2. The calibrated FVF distribution was subsequently fixed and incorporated into the full-scale thermal residual deformation analysis without further modification. Incorporation of the calibrated FVFs improved the agreement between the numerical predictions and experimental measurements, reducing the maximum error to within 5.7%, as shown in Figure 18. Modified FVF of each segment panel. Maximum error in thermal deformation analysis using modified FVF.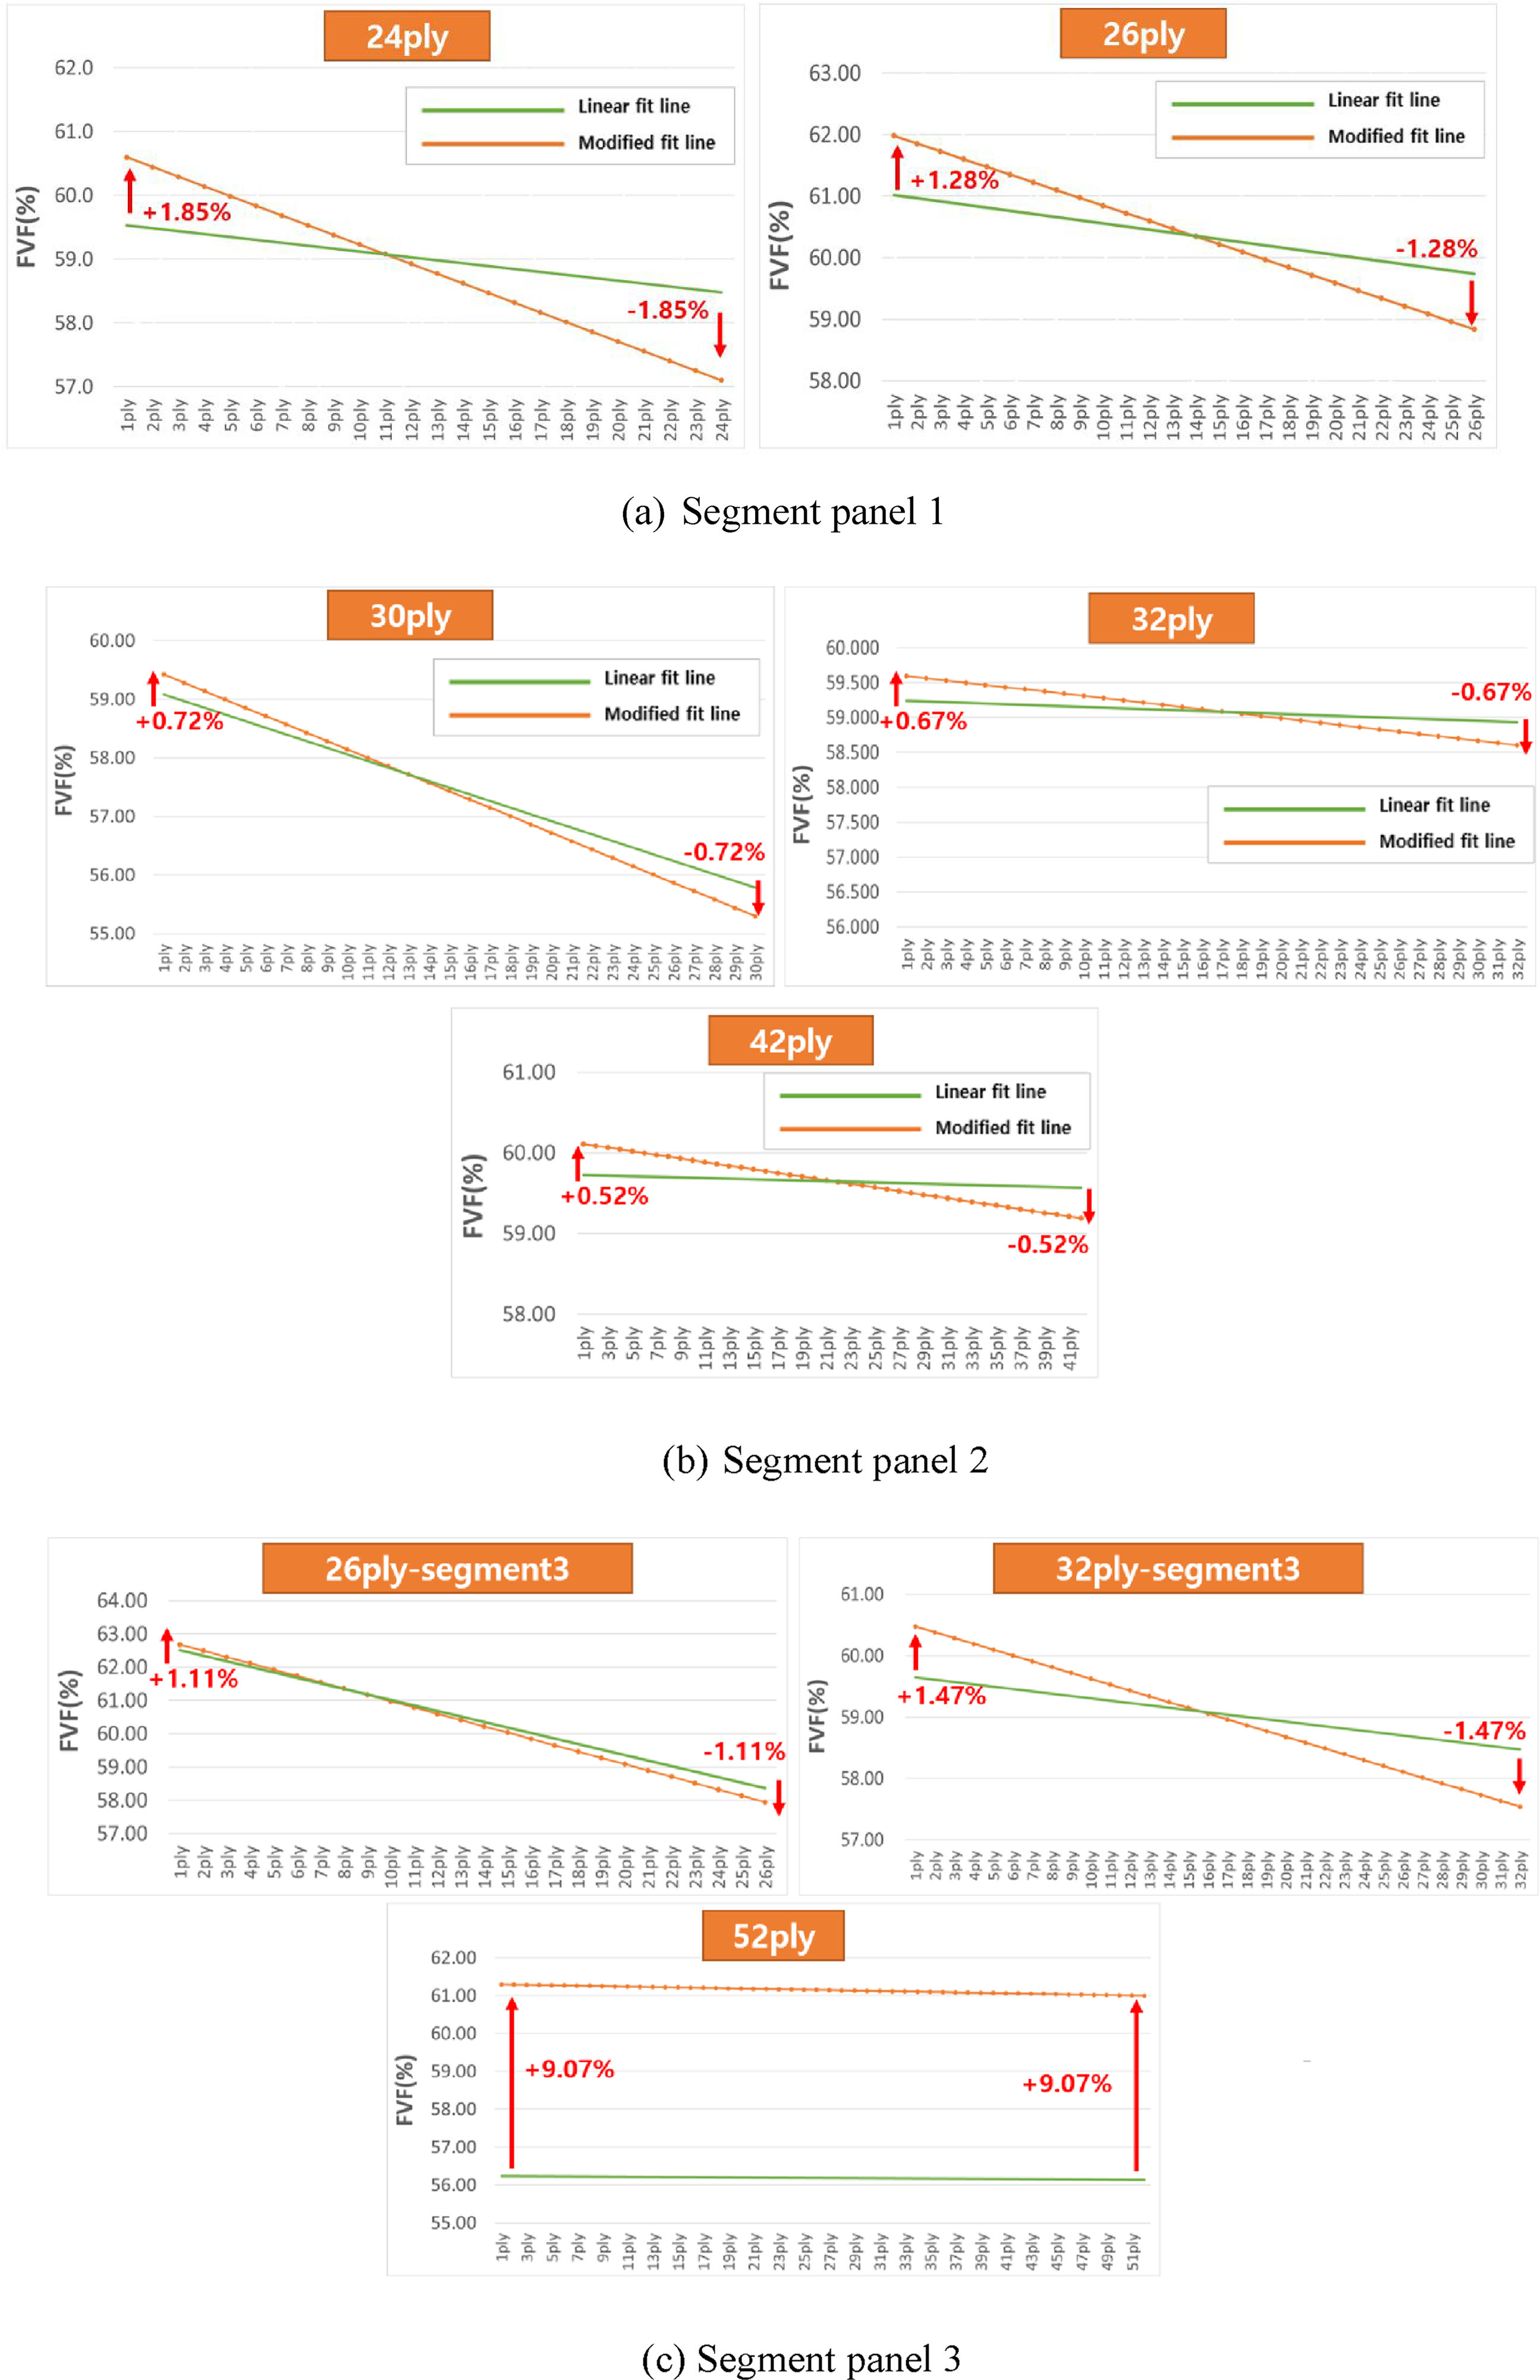
Analysis results and discussion
Thermal residual deformation analysis of the main wing composite structure main wing
The modified ply-wise fiber volume fraction (FVF) values obtained from the segment-panel models were applied to the finite element (FE) model of a 4-m class main wing composite structure to predict thermal residual deformation. Figure 19 illustrates the FE model and the applied boundary conditions of the 4-m class main wing composite structure. The boundary conditions were defined such that the upper edge of the lower left corner was fully constrained in the X, Y, and Z directions, while the remaining three lower corners were constrained only in the X and Y directions to prevent rigid body motion of the entire structure. Boundary conditions for thermal deformation analysis of main wing structure.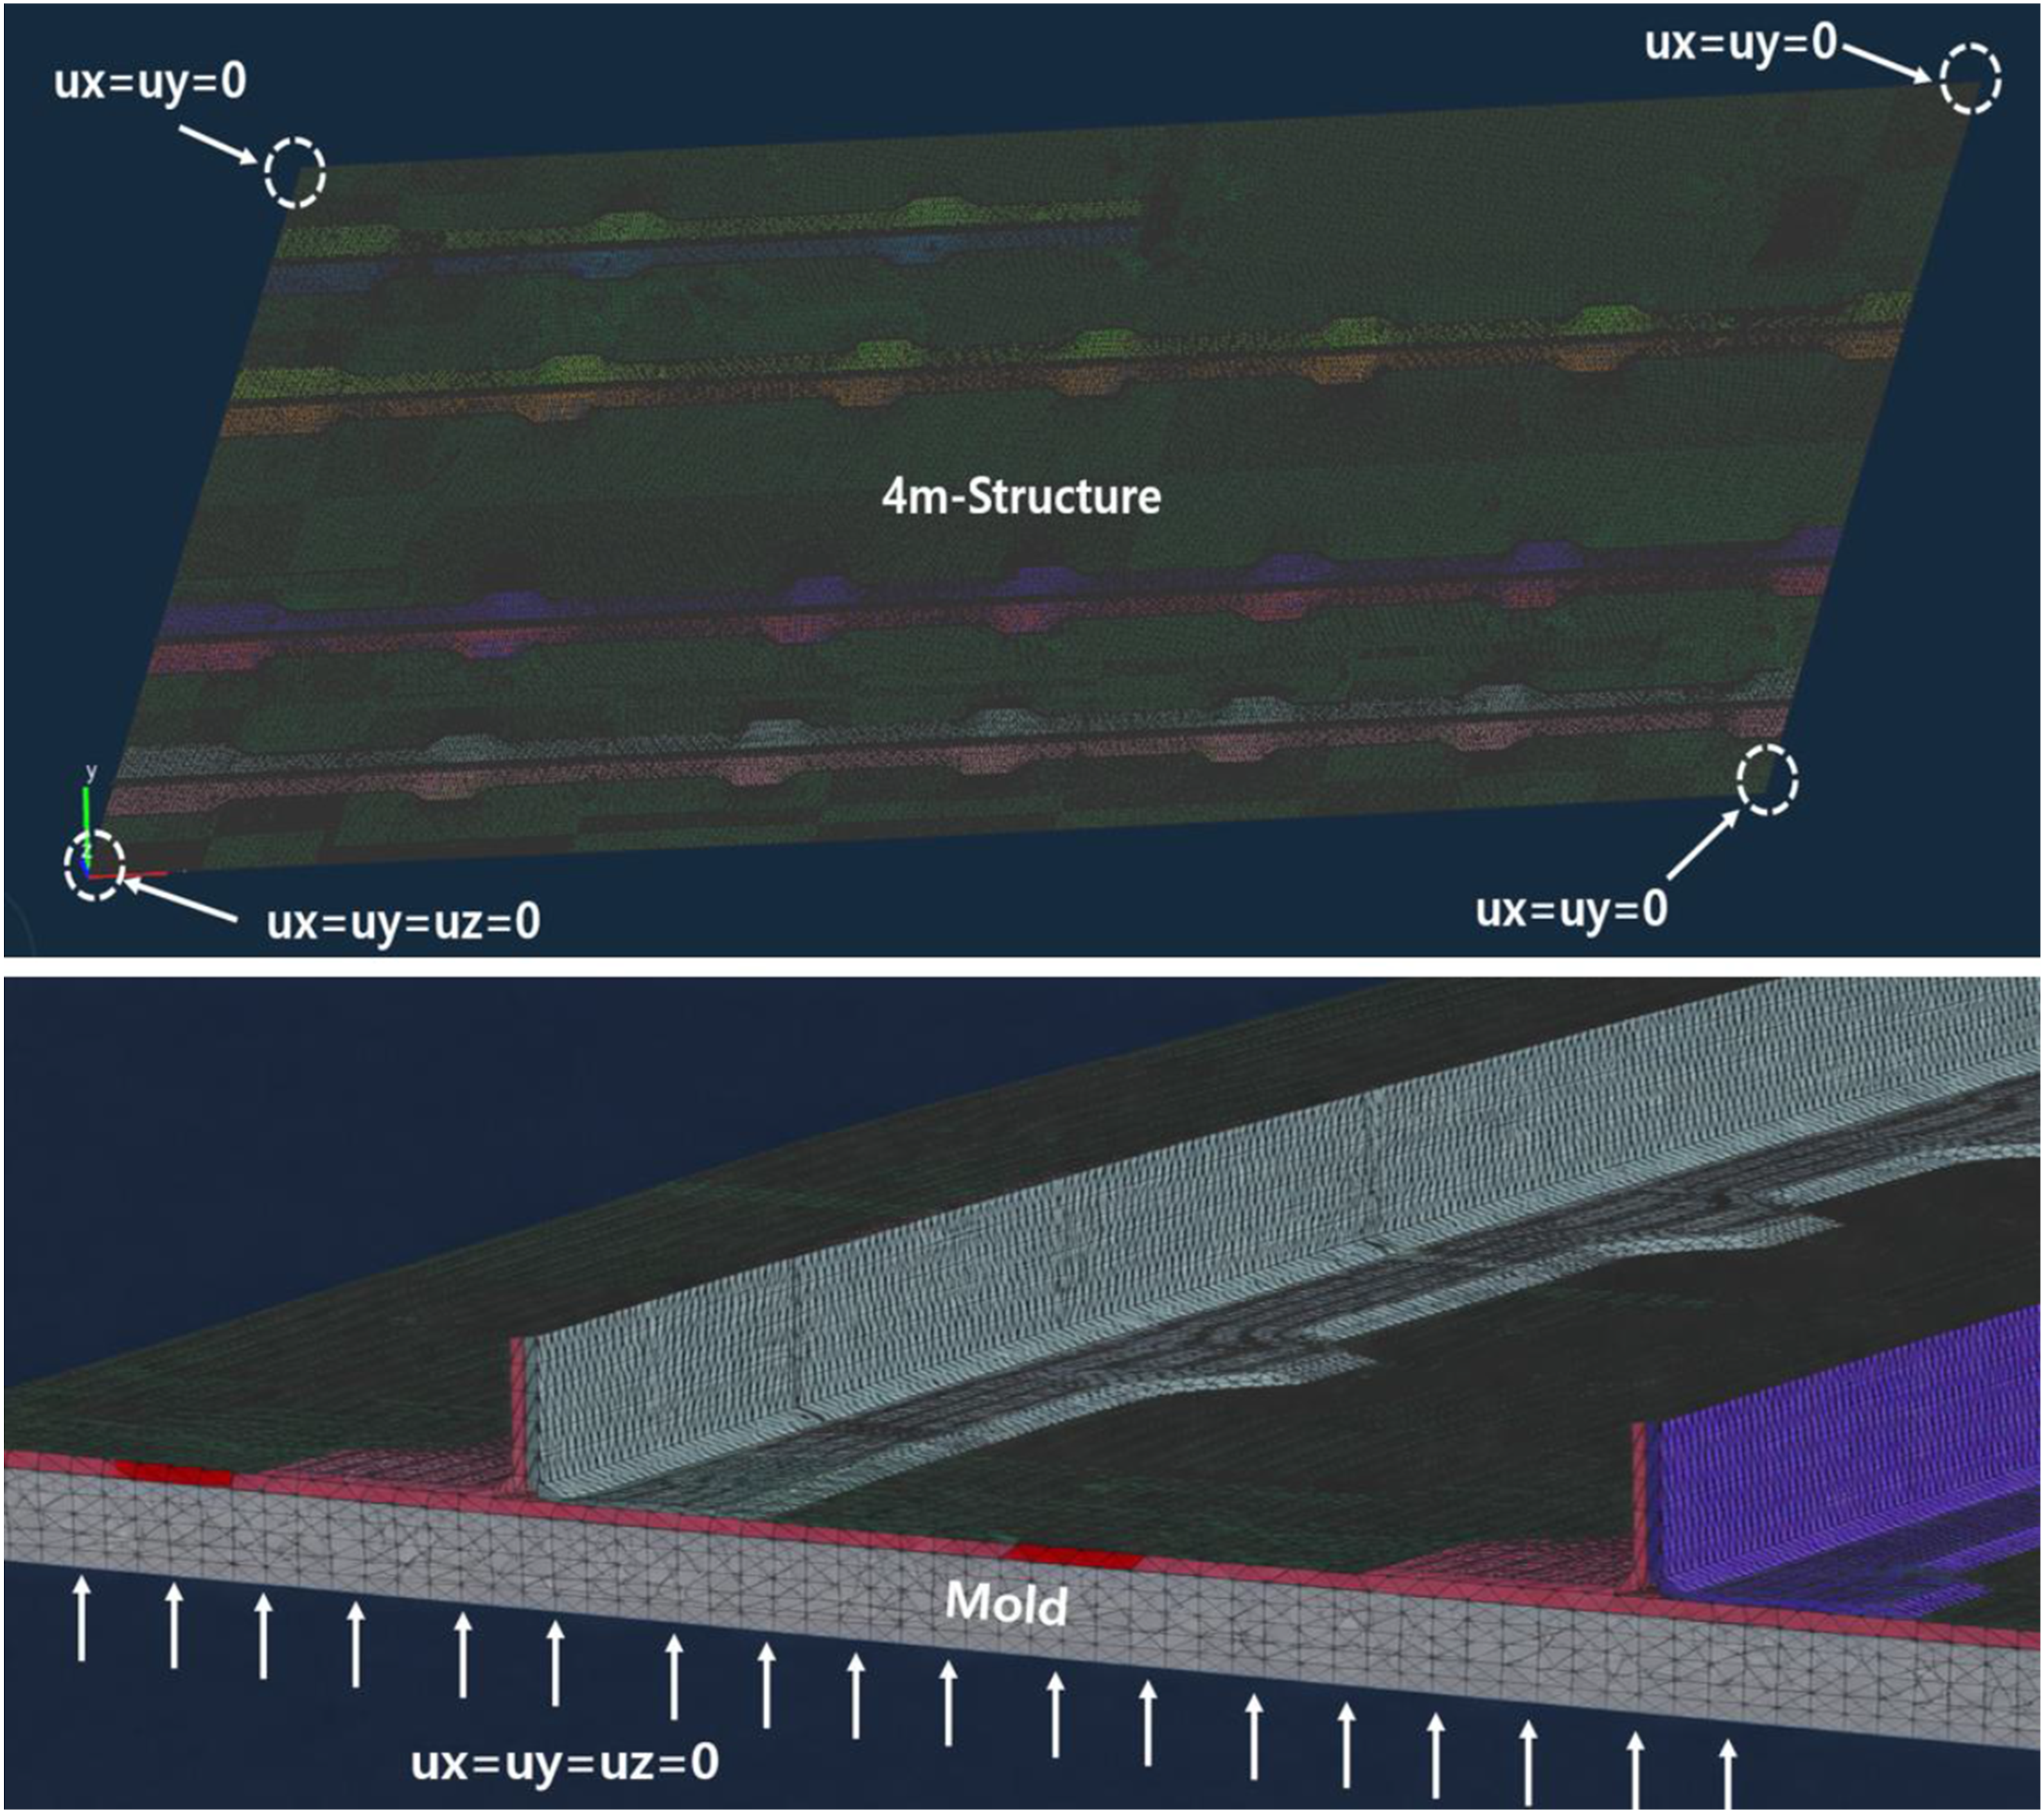
Figure 20 presents the predicted thermal residual deformation of the 4-m class composite structure. Thermal residual deformation was calculated for the structure in the free-standing state after curing through the demolding step implemented in PAM-COMPOSITES, and the initially applied boundary conditions do not directly influence the final thermal deformation profile. The results indicate that the maximum positive out-of-plane deformation is + 3.516 mm, while the maximum negative deformation is −1.525 mm through the thickness direction. In addition, when the maximum negative deformation is taken as the reference (zero) level, the recalculated maximum displacement is 5.041 mm. Thermal residual deformation of main wing composite structure.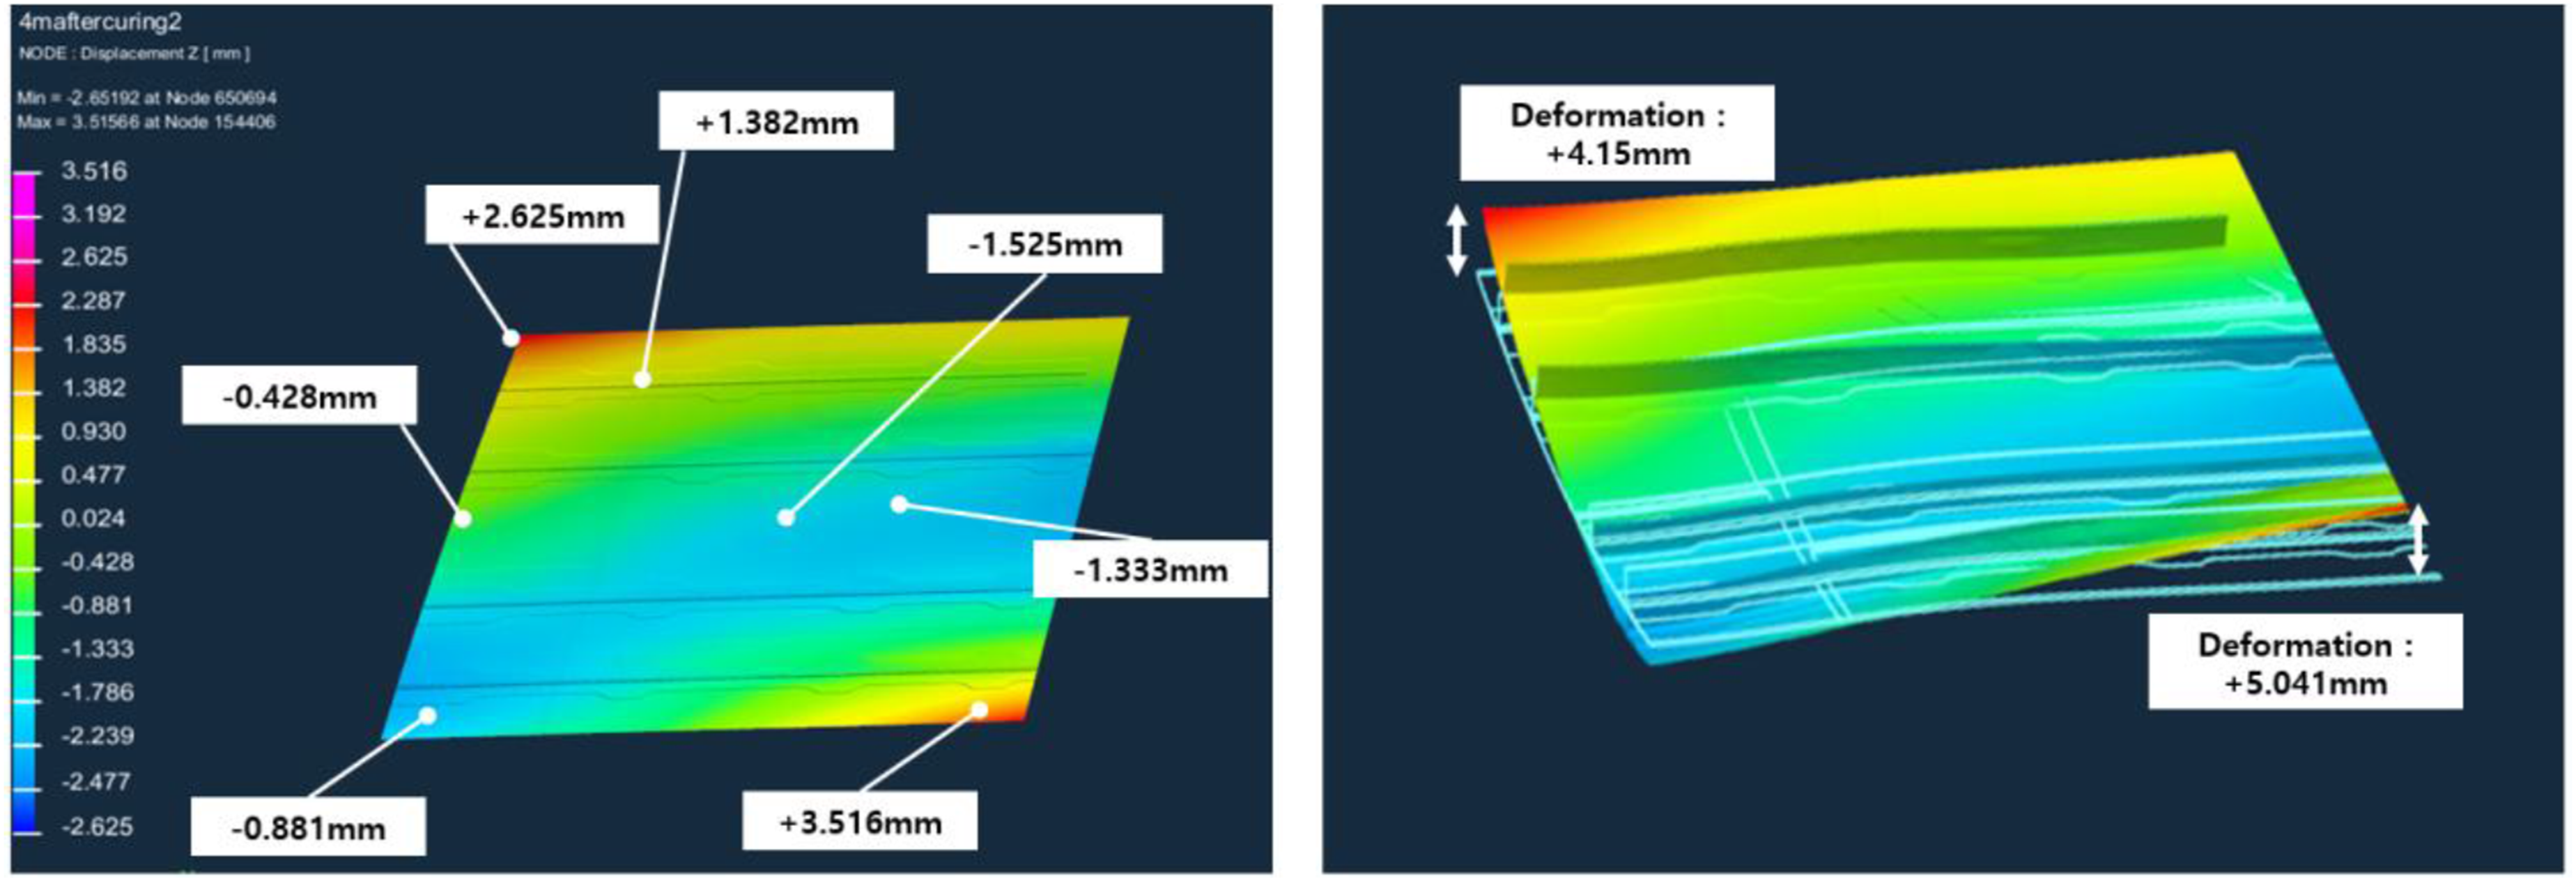
Main wing fabrication and comparison between analysis and experiment
A 4-m class main wing composite structure was fabricated, and its thermal residual deformation was experimentally measured and compared with the numerical predictions for validation. Figure 21 shows the fabrication process of the main wing preform. The skin laminates were manufactured using the automated fiber placement (AFP) process, while the stringer laminates were initially prepared in flat panels, followed by hot drape forming to achieve a 90° bend, after which the flange sections were trimmed to their final shape. Manufacturing process of main wing preform.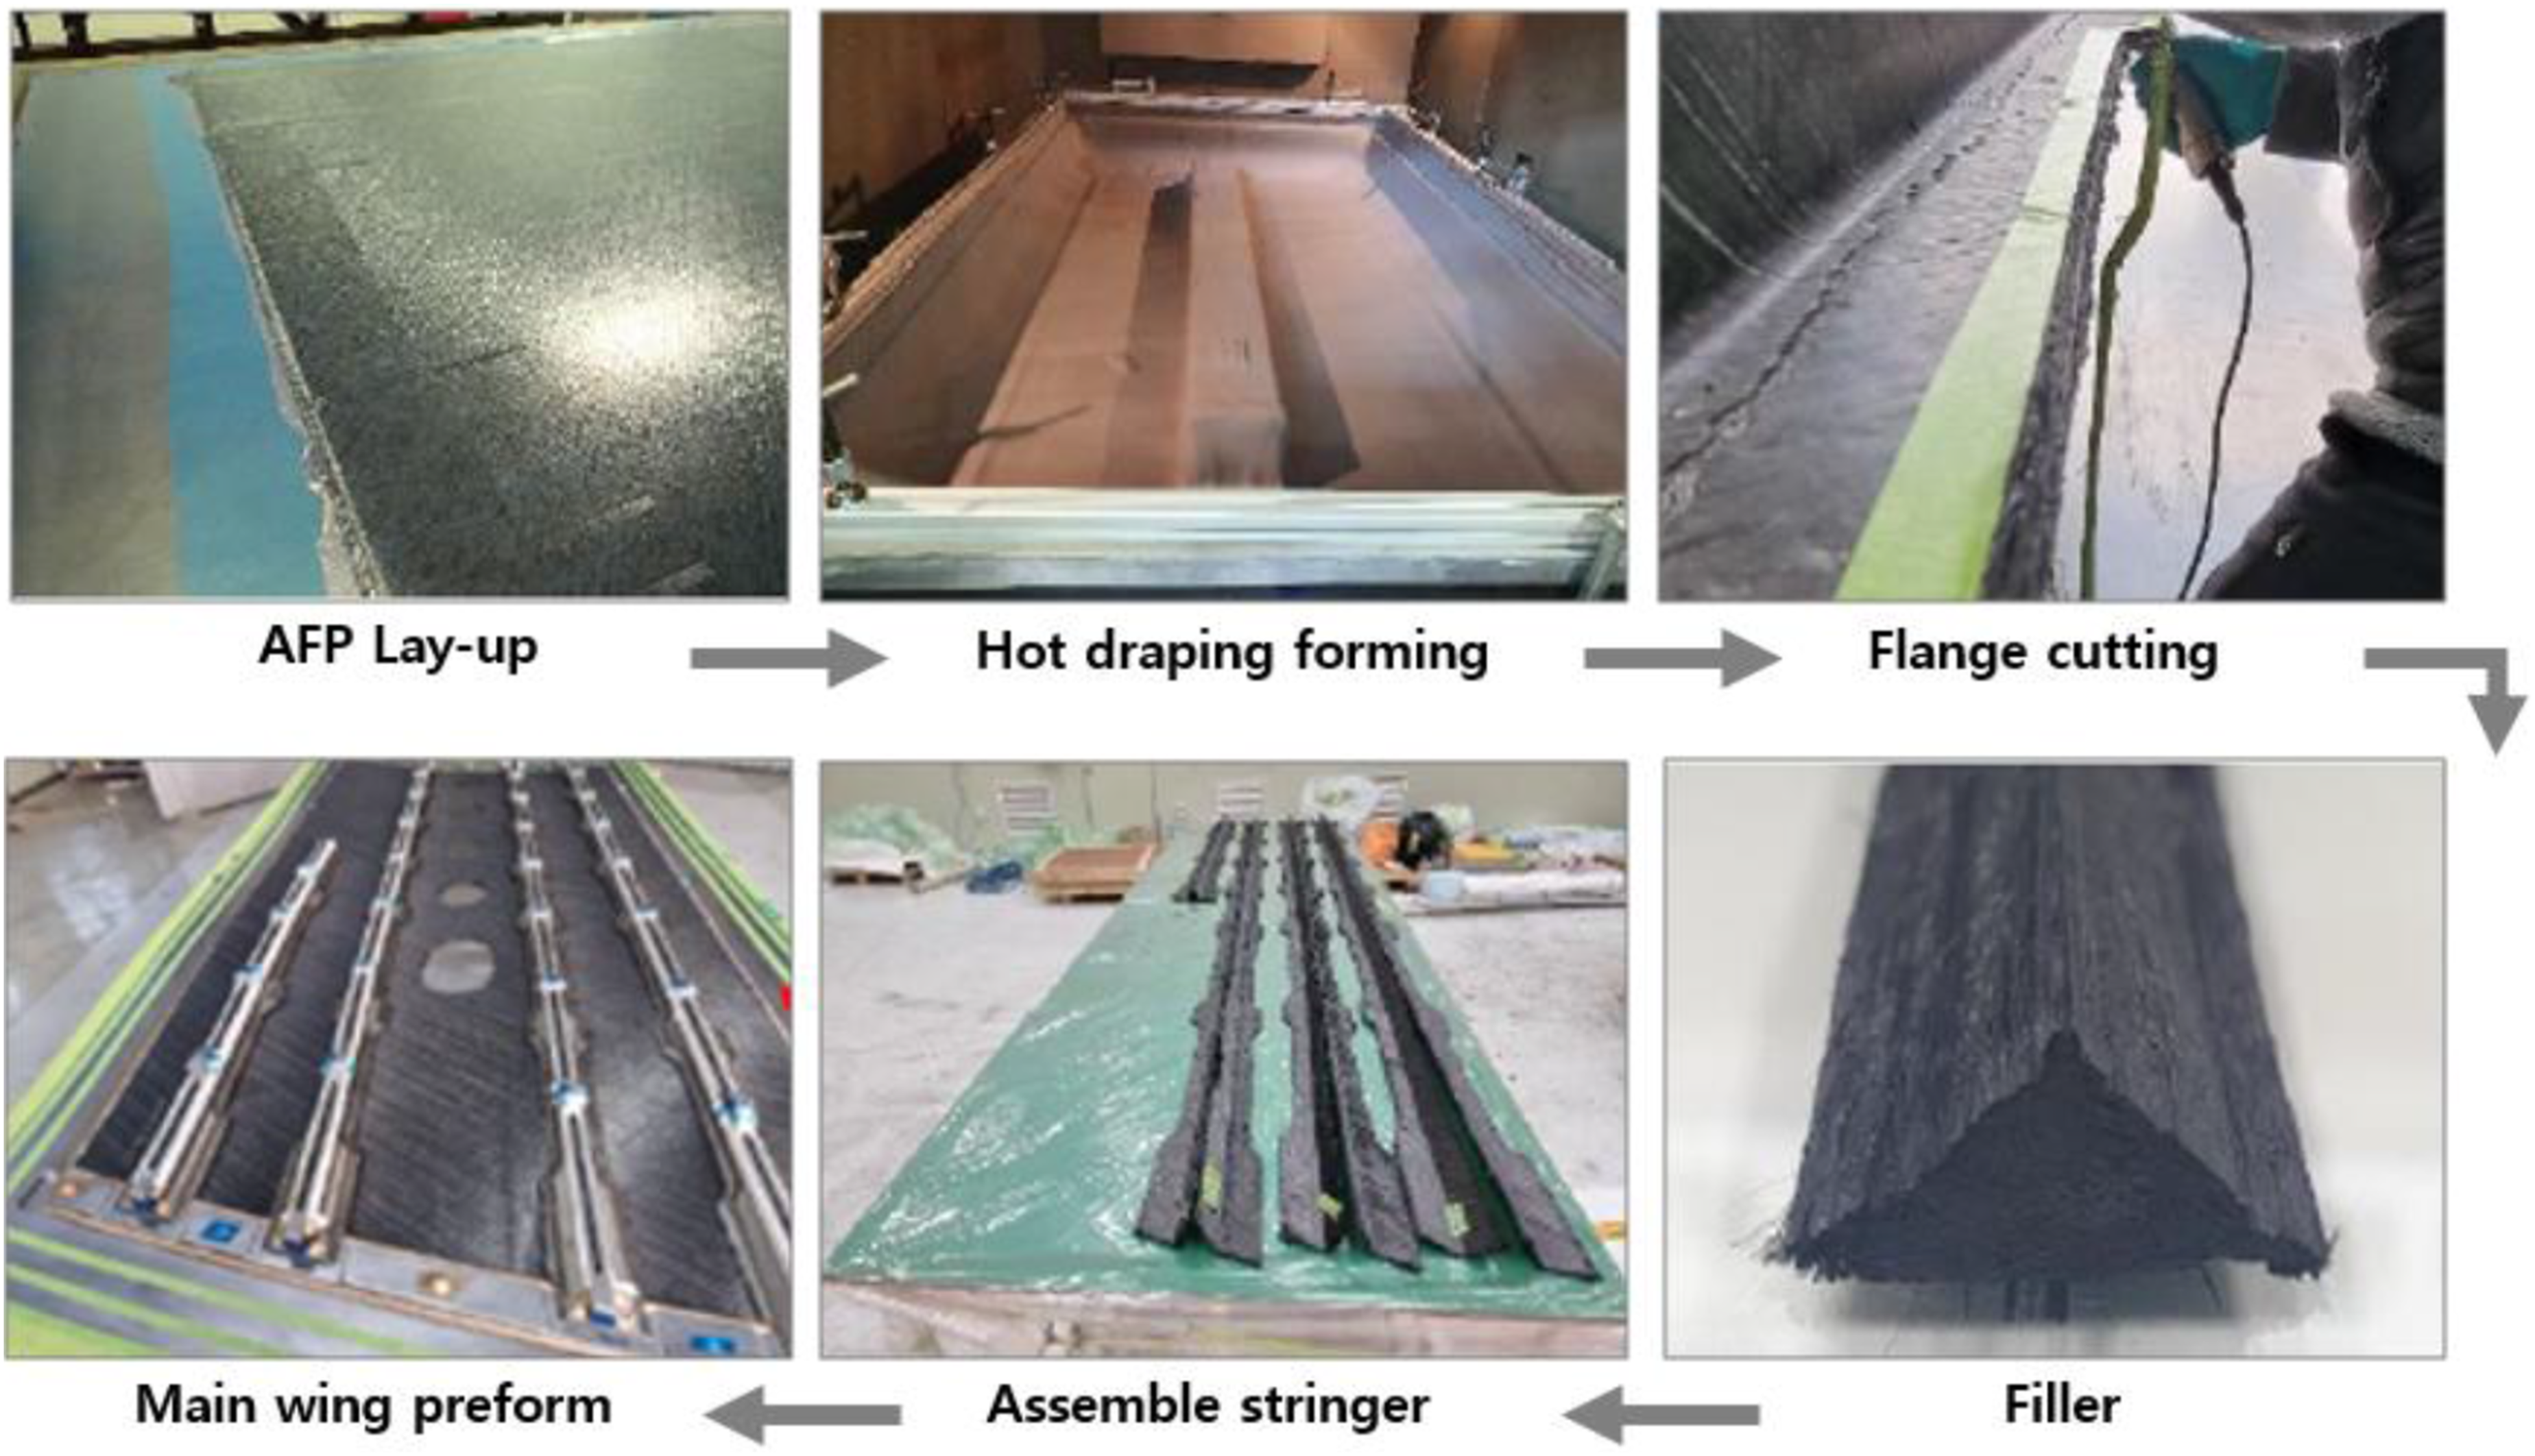
The assembled skin and stringer preform were subsequently heated with a heat gun, and fillers were inserted to ensure stable contact of the stringers onto the skin. To remove absorbed moisture from the fibers, the preform was dried at 100°C for 7°h prior to resin infusion.
The inlet ports were arranged at the starting region of the stringers with four inlets, consistent with the simulation conditions, while a total of ten outlets were placed along the designed resin flow path. To improve resin flow, flow meshes were applied; one sheet was placed over the entire skin region, and two sheets were applied in the 52-ply region. Prior to infusion, the mold was preheated to 100°C, and the resin was injected at 85–90°C. The infusion was completed within approximately 2°h 50°min, which corresponds to a deviation of about 8.8% compared with the predicted results in Figure 4. Subsequently, the structure was cured at 180°C for 2°h, cooled down to 60°C at a rate of 3°C/min, and then demolded.
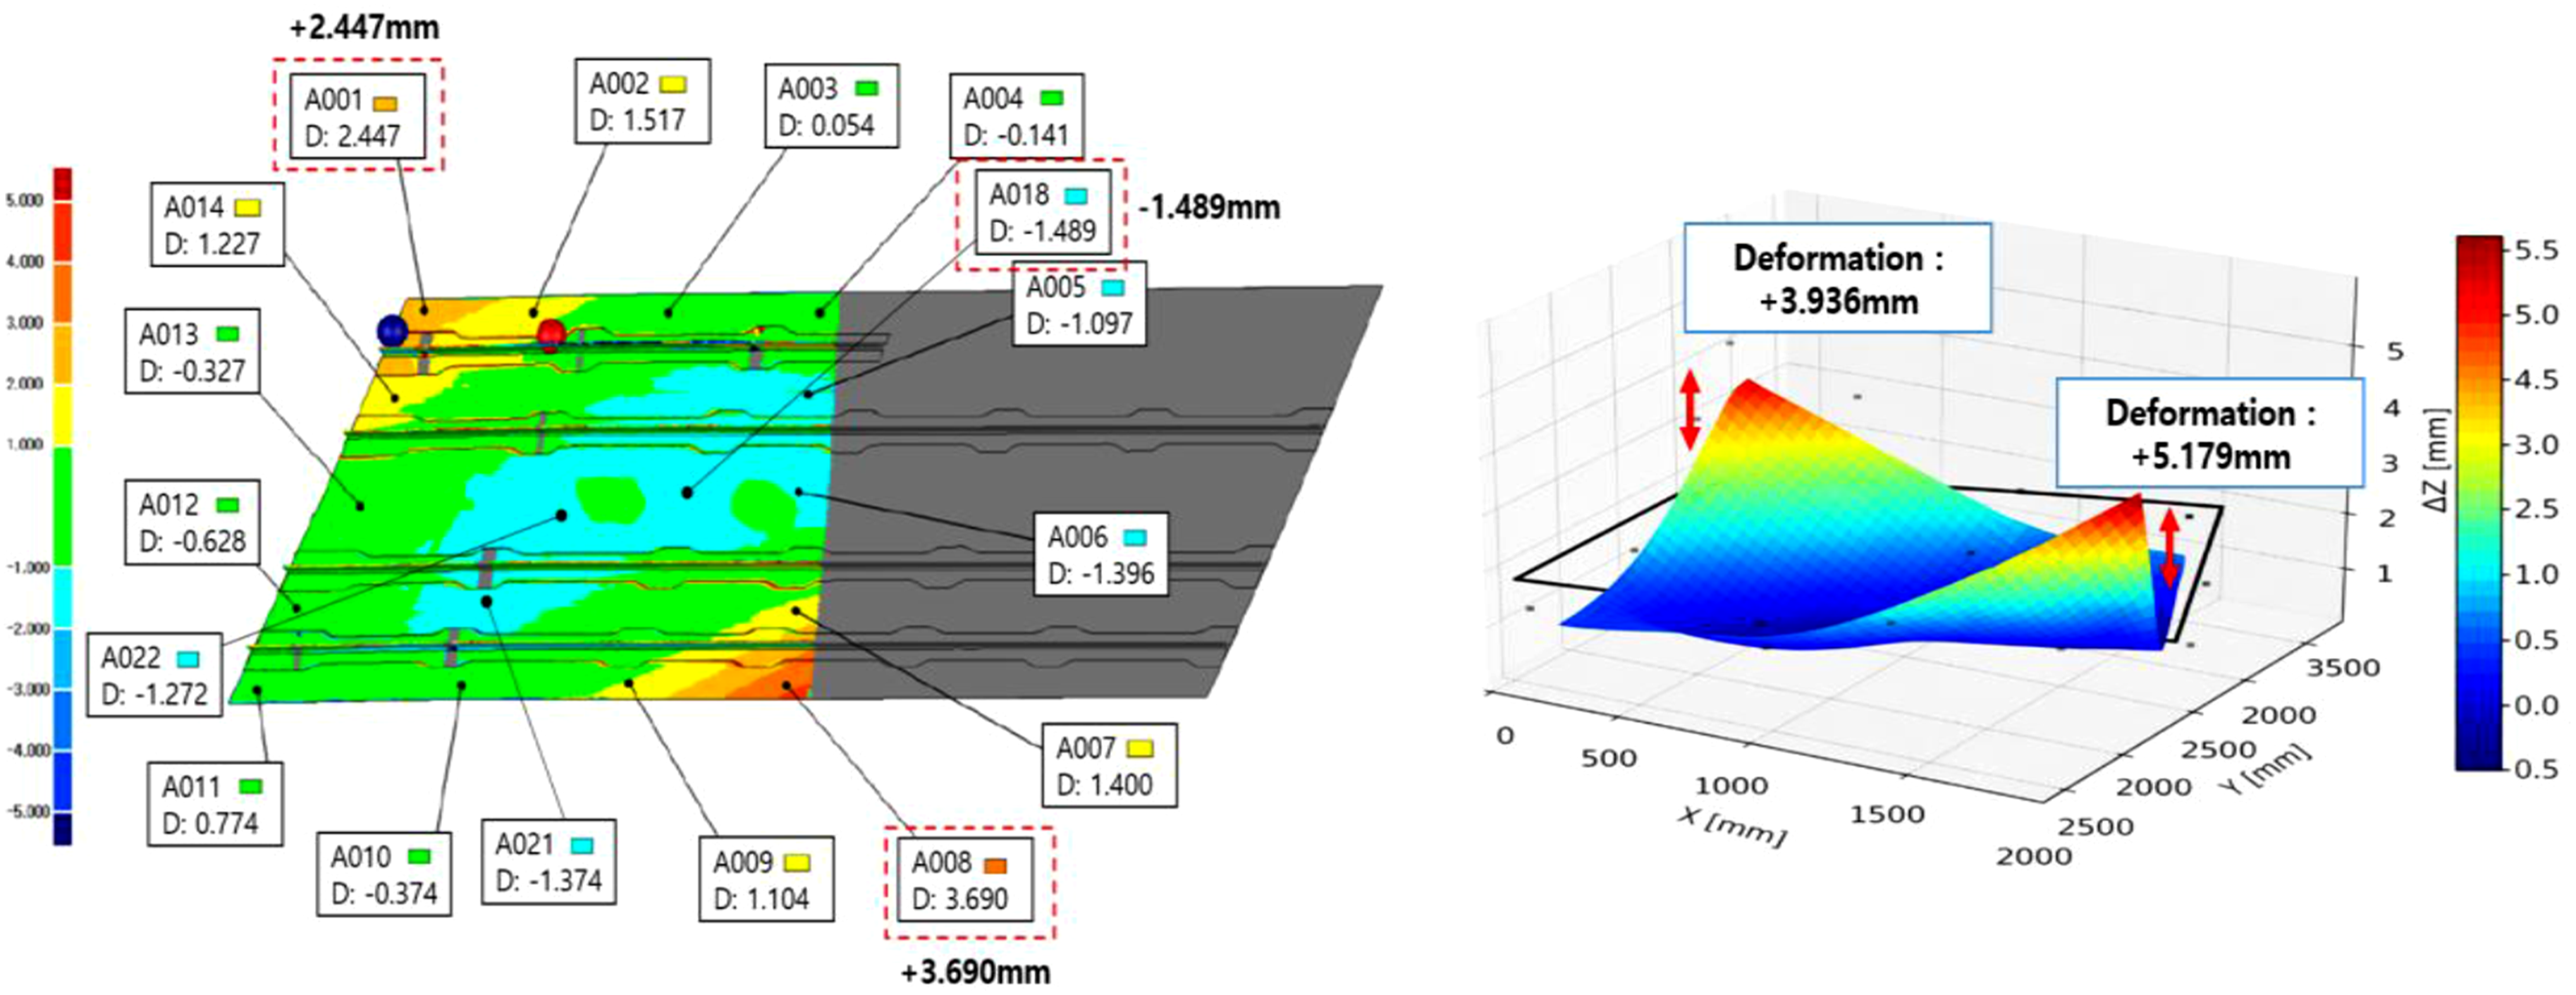
For the measurement of thermal residual deformation, a portable multi-joint 3D scanner (FARO, USA) was employed. Figure 22 shows the measurement setup used to evaluate thermal residual deformation with a portable multi-joint 3D scanner. As illustrated, the 4°m-scale main wing composite structure was positioned vertically to prevent deflection due to gravity, and the z-direction displacement was recorded. The measured z-direction displacements at each point were referenced to the location where the z-direction displacement in Figure 20 is defined as zero. Figure 23 presents the measured thermal deformation and displacement field, which shows good agreement with the predicted results in Figure 20. Figure 24 compares the measured and simulated z-direction displacements at various locations. Based on the maximum experimentally measured displacement, a shape deviation of approximately 0.214 mm was observed, corresponding to a prediction error of 5.4%. Measurement setup for thermal residual deformation of a 4-m main wing structure. Measurement of z-direction thermal residual deformation using a 3D scanner. Difference in thermal residual deformation between experiment and analysis.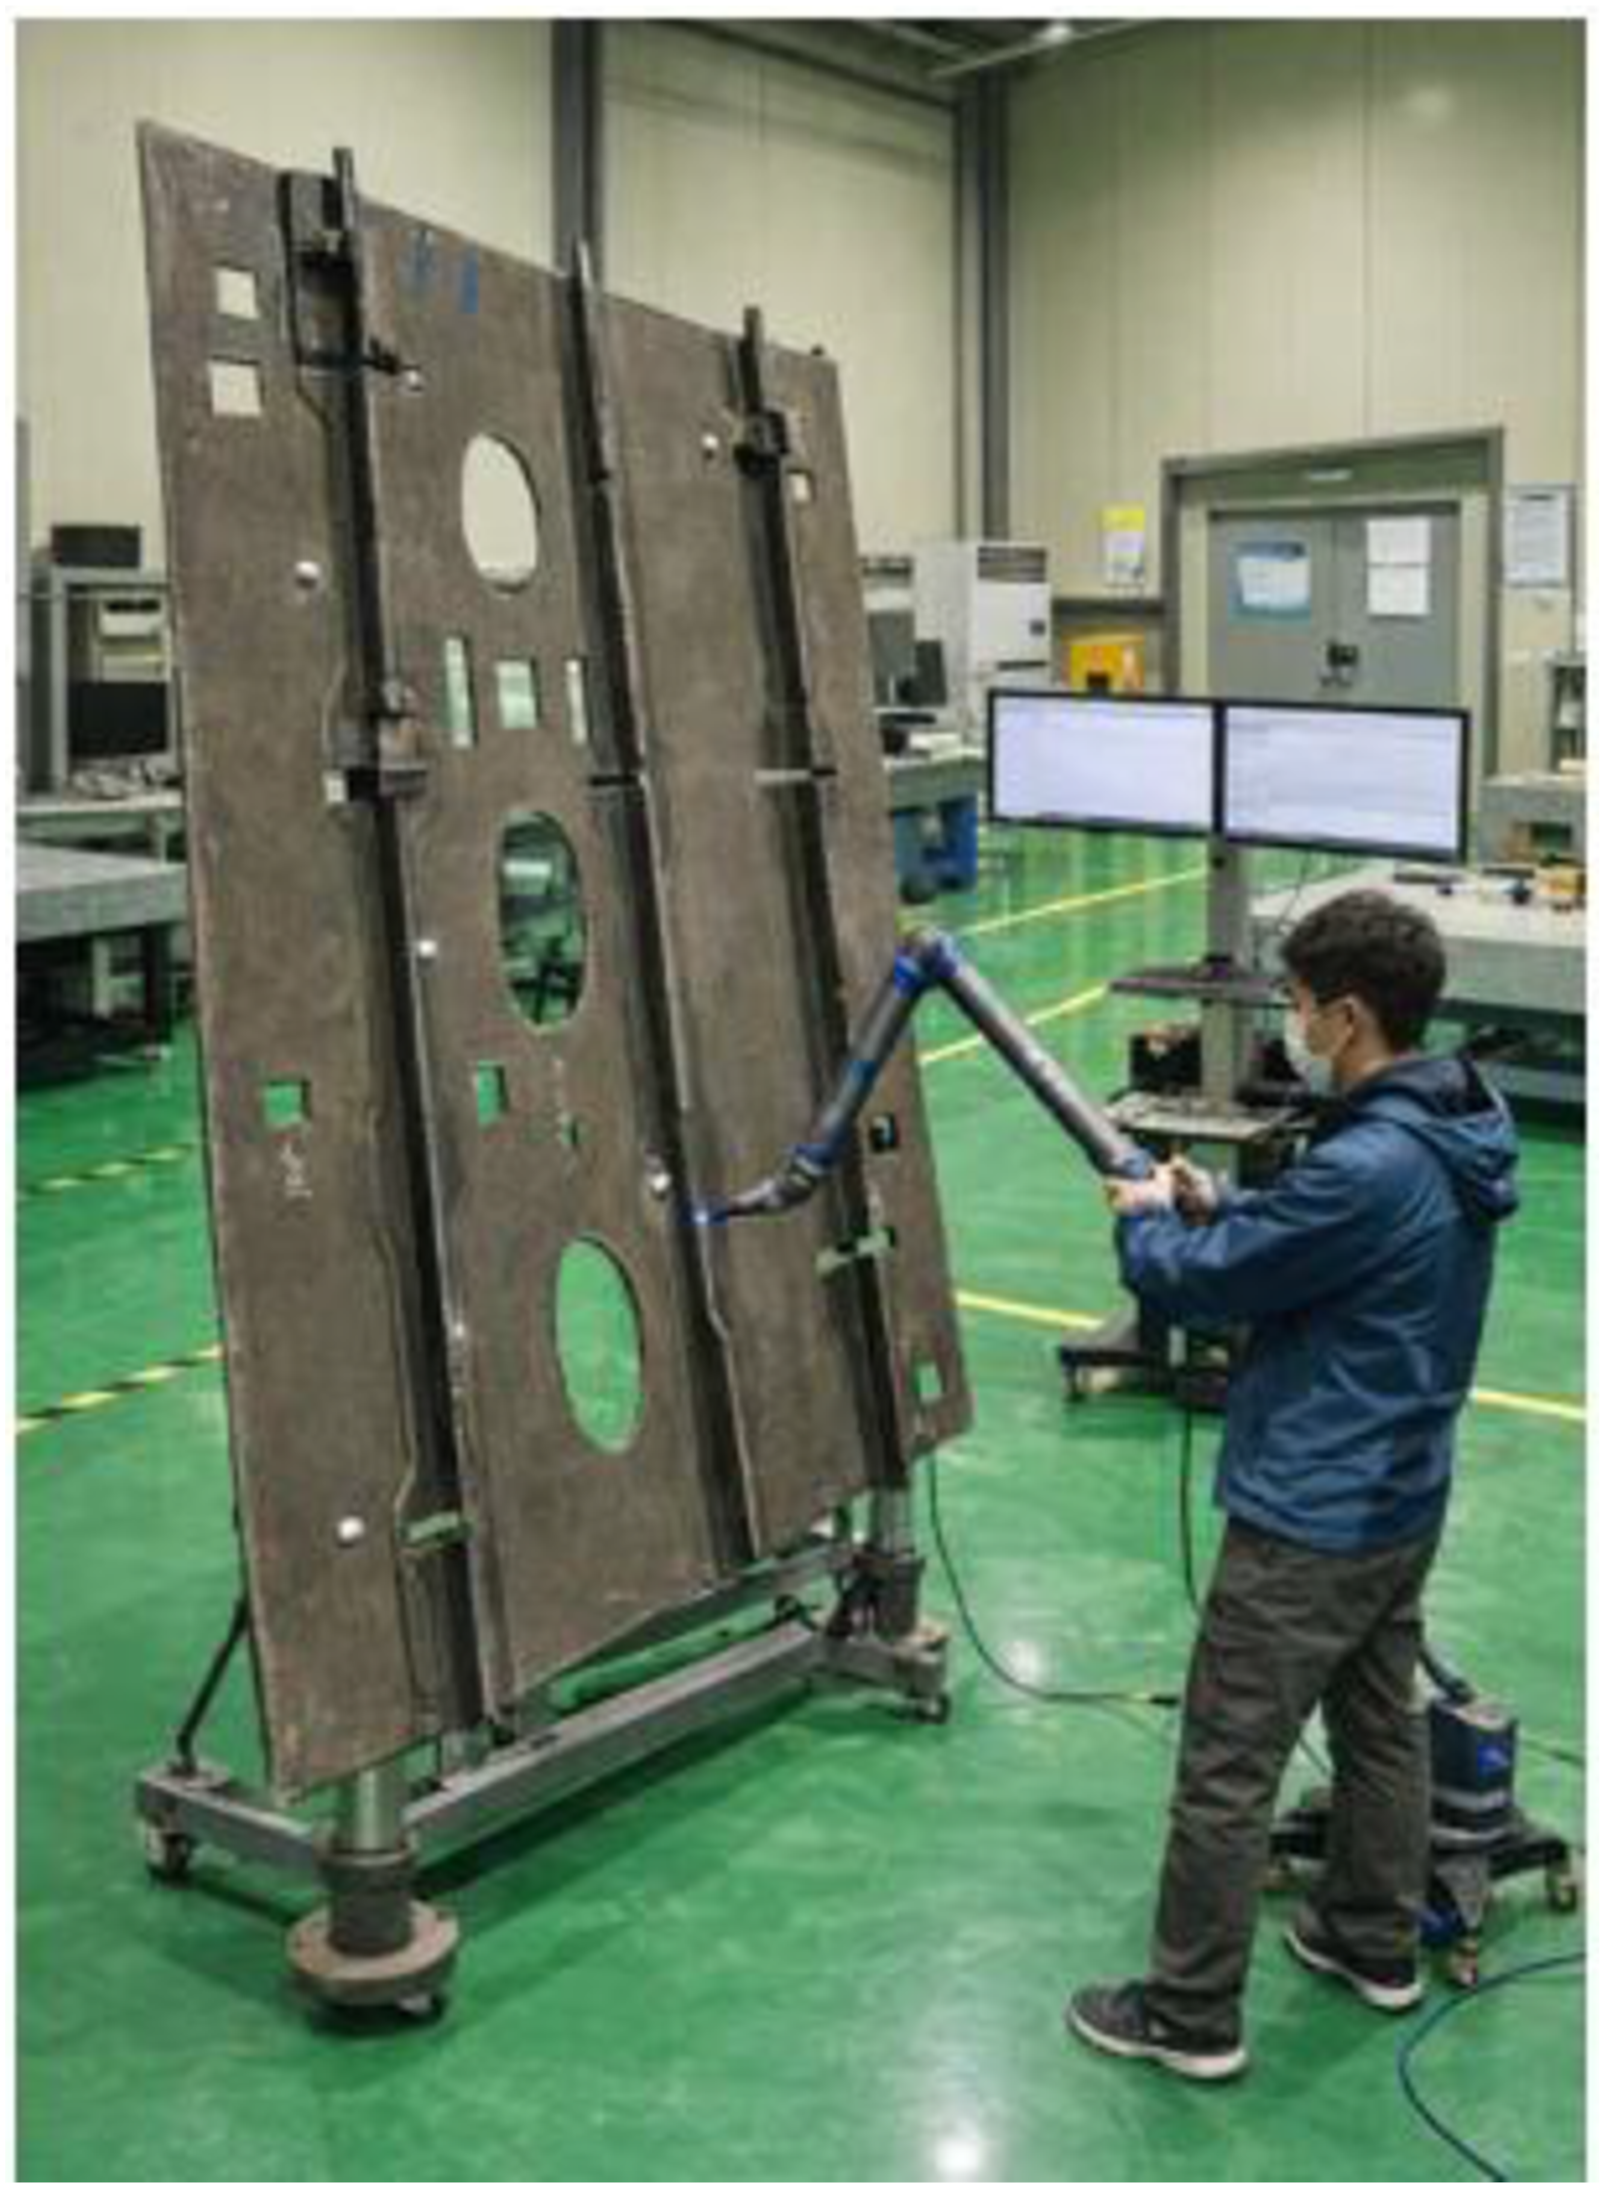
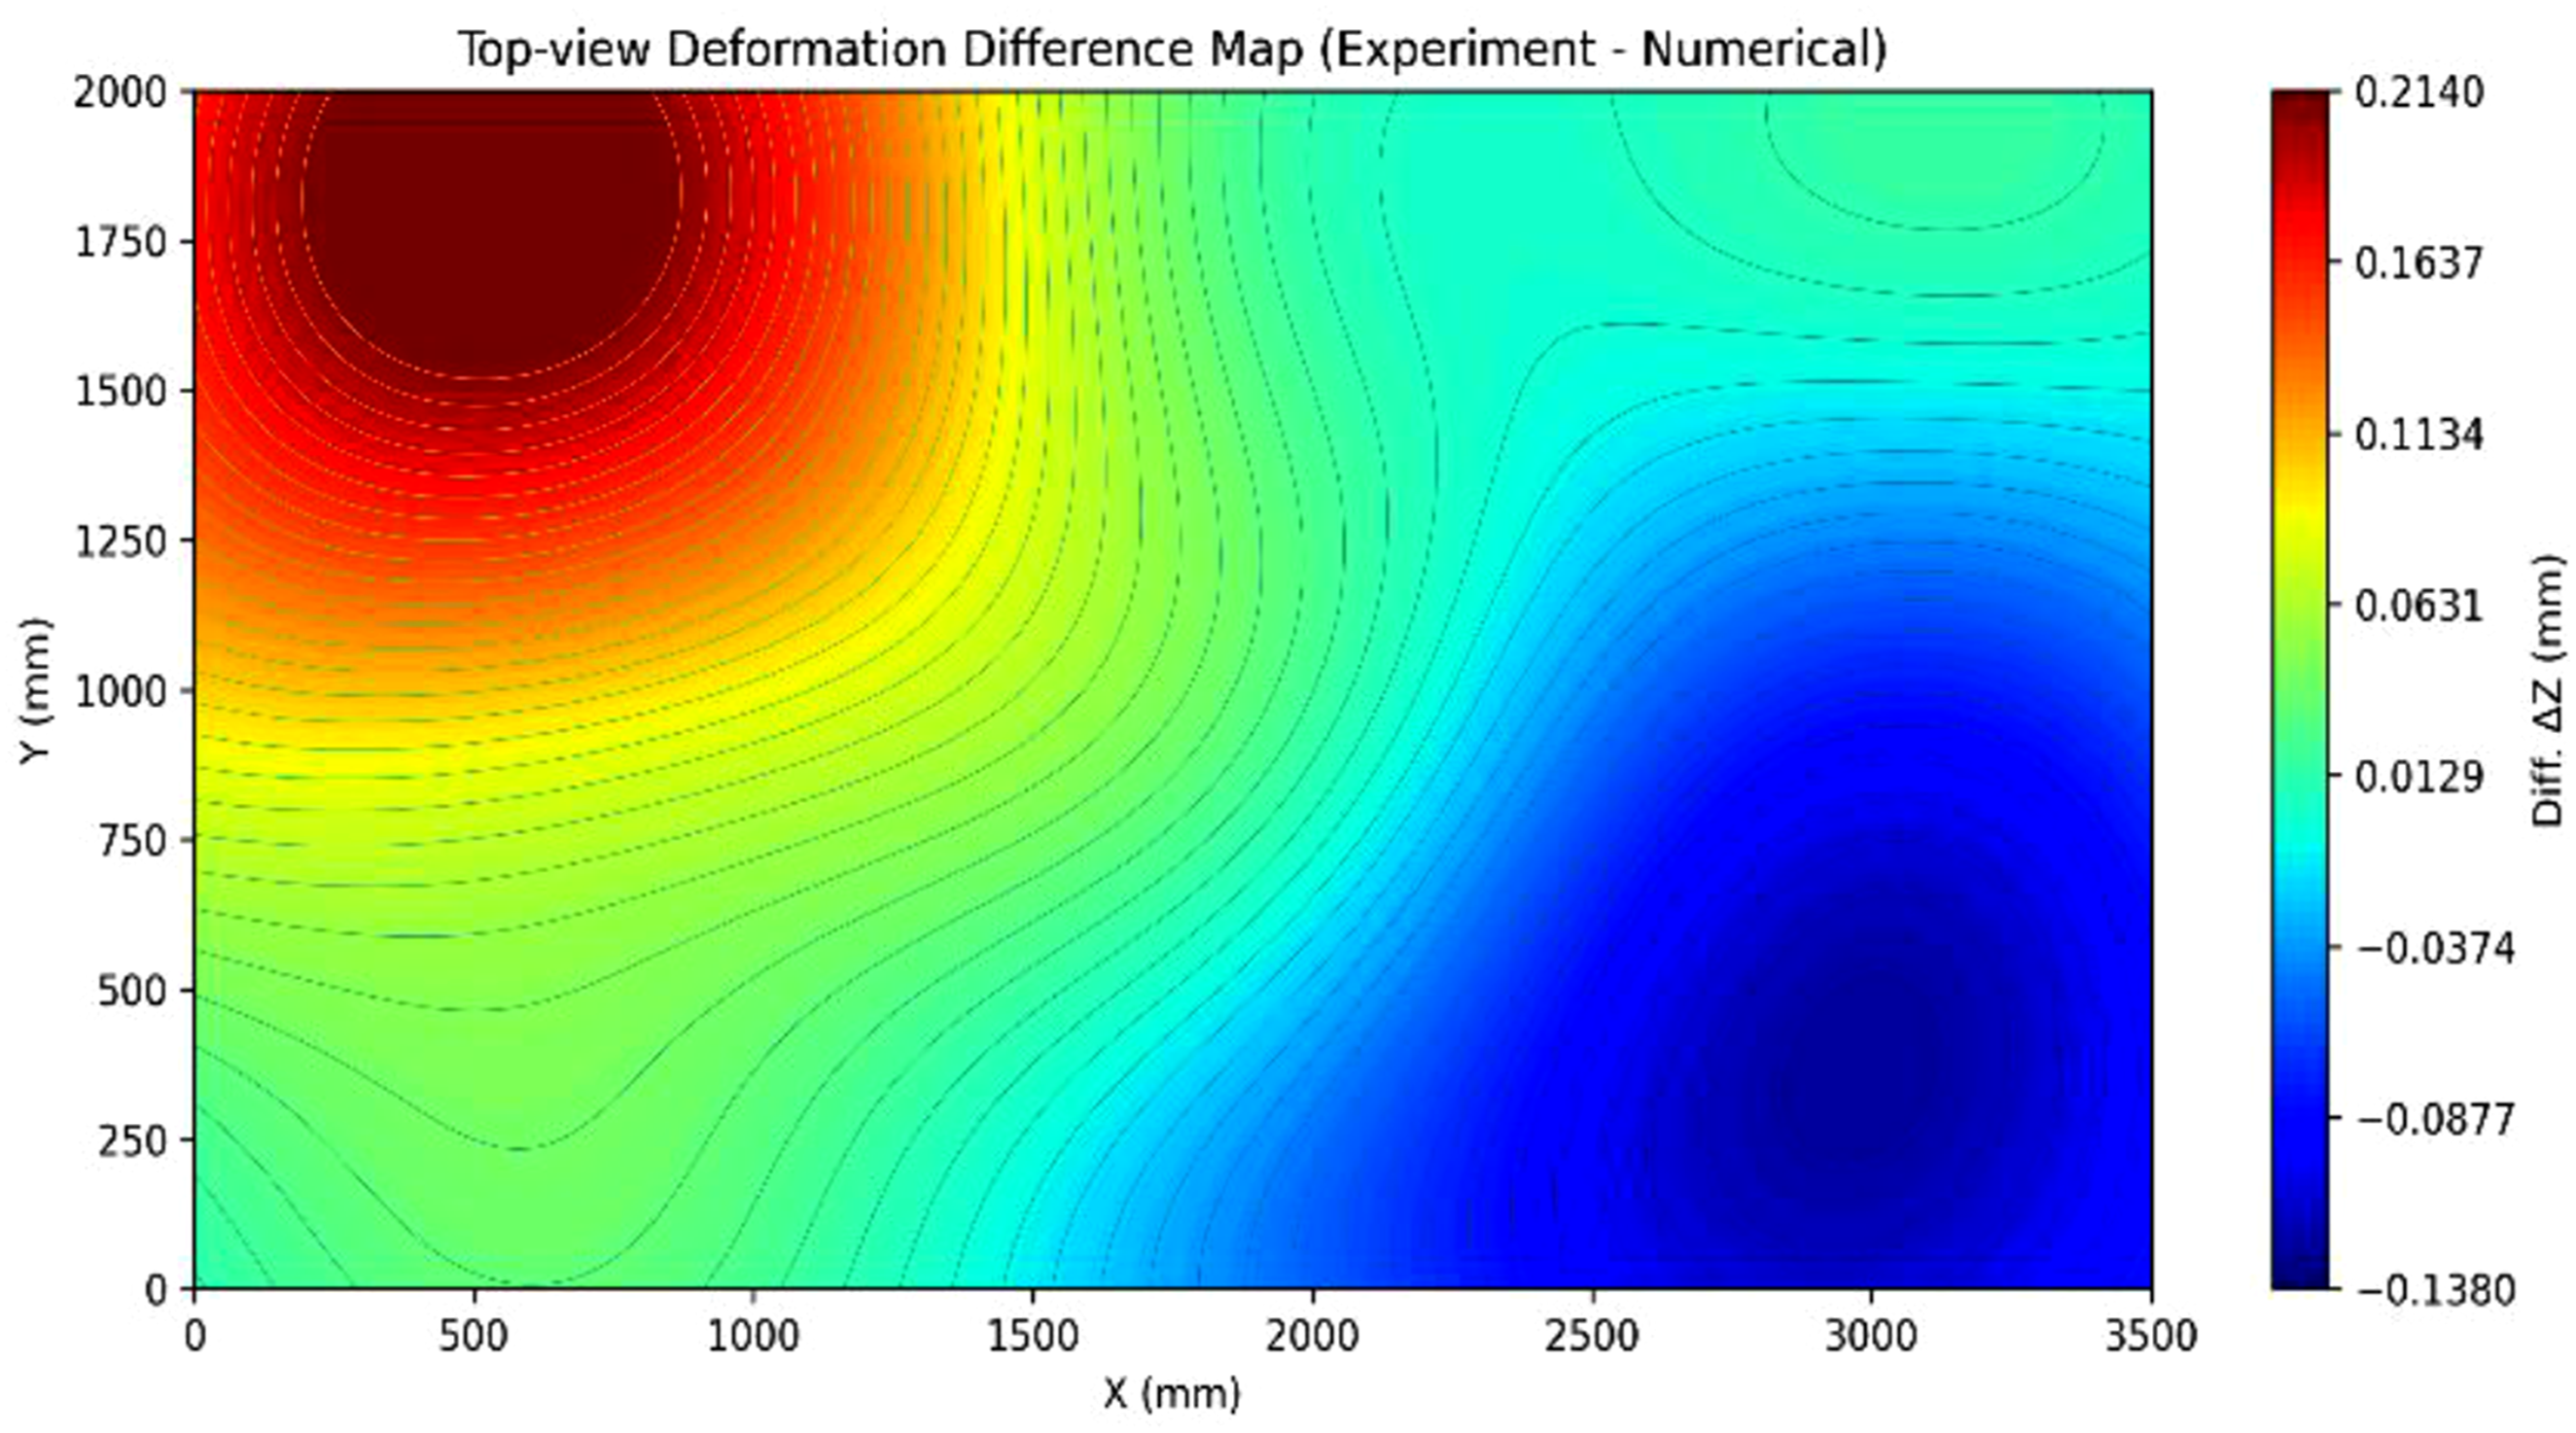
It should be emphasized that the full-scale deformation measurements were not included in the calibration procedure. Therefore, the agreement between the predicted and measured deformation of the 4°m-scale structure represents an independent validation of the segment-level calibration strategy. These results support the applicability of the proposed method as a predictive tool for large-scale RTM-manufactured composite structures, rather than as a post-calibrated reproduction of a measured deformation field.
Conclusions
This study proposes and validates a practical methodology for predicting the thermal residual deformation of large-scale composite structures manufactured via the RTM process. The key findings and methodological contributions are summarized as follows: (1) Practical Analysis Approach: A predictive methodology based on coupon-level segment panels fabricated under processing conditions identical to those of large-scale structures was developed. This approach bridges the gap between coupon-level characterization and full-scale manufacturing, providing a reliable basis for deformation prediction in complex RTM components. (2) Calibration Using Experimental Data: A segment-level calibration procedure based on experimentally measured deformation of the segment panels was implemented to identify effective ply-wise FVF distributions representing manufacturing-induced variability. (3) FVF-Based Calibration Strategy: The calibrated FVF distributions were fixed after the segment-panel analysis and transferred to the global full-scale model without additional fitting to the full-scale deformation measurements. This strategy allows manufacturing-induced FVF variability to be reflected in the full-scale analysis while preserving independent validation capability. (4) Validation on a 4°m-scale Structure: The proposed methodology was independently validated using a 4°m-scale composite main wing structure. The maximum prediction error in thermal deformation was within 5.4%, demonstrating the predictive capability and practical applicability of the segment-level calibration strategy for industrial-scale RTM composite structures.
Footnotes
Acknowledgments
This work was partly supported by the National Research Foundation of Korea (NRF) grant funded by the Ministry of Science and ICT (RS-2024-00397400)
Funding
The authors disclosed receipt of the following financial support for the research, authorship, and/or publication of this article: This work was supported by the National Research Foundation of Korea (NRF) grant funded by the Ministry of Science and ICT (RS-2024-00397400).
Declaration of conflicting interests
The authors declared no potential conflicts of interest with respect to the research, authorship, and/or publication of this article.
Data Availability Statement
Data sharing not applicable to this article as no datasets were generated or analyzed during the current study.