
Abstract
The aim of this study is to predict the shear strength of fiber-reinforced polymer (FRP)-reinforced concrete beams using artificial intelligence-based modeling approaches, with particular focus on carbon fiber-reinforced polymer (CFRP) and glass fiber-reinforced polymer (GFRP) strengthening systems. An experimental database was compiled from the scientific literature, comprising 535 beam specimens. Five supervised machine learning algorithms were developed and evaluated: Decision Tree (DT), Random Forest (RF), Support Vector Machine (SVM), Artificial Neural Network (ANN), and Extreme Gradient Boosting (XGBoost). Model performance was assessed using the coefficient of determination (R2), root mean square error (RMSE), and mean absolute error (MAE). The SVM and XGBoost models demonstrated the highest predictive accuracy and overall robustness. The results confirm the capability of machine learning methods to capture the nonlinear and complex behavior of shear-strengthened reinforced concrete beams and to identify the most influential geometric and mechanical parameters. This work contributes to the optimization of FRP strengthening design by integrating artificial intelligence tools into structural engineering practice.
Introduction
Fiber-Reinforced Polymer (FRP) composites have emerged as a transformative material in modern civil engineering due to their high strength-to-weight ratio, excellent durability, and immunity to corrosion. Traditional reinforced concrete (RC) systems rely primarily on steel reinforcement; however, steel is increasingly limited in aggressive environmental conditions due to corrosion susceptibility and long-term durability concerns, as well as its relatively high environmental impact.1,2 In contrast, FRP materials—including Carbon FRP (CFRP), Glass FRP (GFRP), and Basalt FRP (BFRP)—offer a sustainable alternative for both new construction and structural rehabilitation, enabling lightweight, corrosion-resistant, and long-lasting structural systems.3–5
Initially, FRP composites were widely adopted for external strengthening and retrofitting of existing structures. 6 More recently, their application has been extended to internal reinforcement systems, where FRP bars and stirrups are used as primary reinforcement in reinforced concrete members. This transition has significantly altered the design philosophy of concrete structures, particularly in environments where durability and reduced maintenance are critical, such as marine structures, bridges, and industrial facilities.2,7,8
Despite these advantages, the mechanical behavior of FRP-reinforced concrete beams differs significantly from conventional steel-reinforced members. Among the various failure modes, shear failure is particularly critical due to its brittle, sudden, and difficult-to-predict nature.9,10 In shear-critical regions, failure may occur through concrete crushing, FRP rupture, or bond-related mechanisms. 11 Moreover, shear resistance is governed by complex interactions among cracked concrete, aggregate interlock, dowel action, and reinforcement configuration, making accurate prediction of shear capacity highly challenging. 12
Traditional design approaches, including empirical equations and code-based models such as ACI 440.1 R and CSA S806, are primarily based on simplified truss analogies and limited experimental datasets. As a result, these methods often exhibit significant scatter and reduced reliability when applied across different geometries, material properties, and reinforcement configurations. Although finite element (FE) methods provide more detailed insight into nonlinear behavior and failure mechanisms, they require extensive calibration, involve high computational cost, and are not suitable for routine design applications.13,14
To overcome these limitations, machine learning (ML) techniques have gained significant attention as powerful data-driven tools for modeling complex nonlinear structural behavior. ML models can learn directly from experimental databases without explicit mechanical assumptions, making them particularly suitable for shear strength prediction in FRP-reinforced concrete beams.
Recent studies have demonstrated the strong potential of ML approaches in this field. Six supervised machine learning (ML) models, including ANN, Decision Tree, Random Forest, ERT, and XGBoost, were used to predict failure modes of RC beams under impact loading, highlighting key parameters such as shear-span ratio and stirrup ratio through SHAP-based interpretation. 15 XGBoost has been shown to outperform ANN and conventional design codes in predicting the shear capacity of FRP-strengthened RC beams and to improve prediction accuracy by up to 15% compared to CSA S806 for FRP-reinforced beams without stirrups. 16 Shear strength prediction of FRP-reinforced concrete beams remains complex and is not adequately represented by semi-empirical design models due to nonlinear shear mechanisms and parameter interactions. 17 Machine learning approaches such as ANN and GA-ANN, developed using experimental databases, effectively identify key influencing factors, including beam geometry, material properties, and reinforcement ratios, and show closer agreement with experimental results, highlighting the potential of data-driven methods to enhance shear capacity prediction of FRP-RC beams. 18
Despite these advances, existing studies remain limited in several key aspects, including a predominant reliance on single-model or restricted comparative analyses, a relatively stronger research focus on externally strengthened FRP systems compared to internally FRP-reinforced concrete beams, and insufficient integration of predictive modeling with explainable AI techniques and comprehensive statistical feature analysis within a unified framework.
In contrast, this study develops a comprehensive machine learning framework based on a large experimental database of 535 internally FRP-reinforced concrete beams. Five supervised learning models—Artificial Neural Network (ANN), Support Vector Machine (SVM), Decision Tree (DT), Random Forest (RF), and XGBoost—are systematically evaluated. Furthermore, correlation analysis and SHAP-based interpretability are integrated to quantify feature importance and capture interaction effects.
Accordingly, the main objective of this study is to develop a robust and interpretable machine learning framework for predicting the shear strength of internally FRP-reinforced concrete beams, while identifying the most influential parameters governing their behavior.
Problem formulation
This section provides a detailed description of the methodology, including the construction and preprocessing of the experimental database extracted from the literature, the implementation and hyperparameter optimization of the machine learning models, and the evaluation metrics and visual analyses used to quantify and compare the performance of each algorithm. By employing multiple models, the study aims to identify the most reliable and robust approach for accurately predicting shear strength across a wide range of beam configurations and material properties.
This study adopts a data-driven predictive framework based on supervised machine learning techniques to improve the prediction of shear strength in reinforced concrete beams strengthened with fiber-reinforced polymers (FRP), particularly carbon (CFRP) and glass (GFRP) composites. The approach involves training statistical models on a known dataset (training set) to predict a target variable—the ultimate shear strength (V)—for new, unseen data. Unlike traditional analytical methods based on deterministic mechanical equations, machine learning can implicitly capture complex, nonlinear interactions between multiple parameters without explicitly defining the underlying physical relationships. This makes it especially suitable for FRP-reinforced concrete structures, where the interdependencies among geometric parameters (height, span, and width), concrete properties (compressive strength and elastic modulus), reinforcement characteristics (longitudinal and transverse), and FRP features (fiber type, spacing, and stiffness) are intricate and highly nonlinear.
Database construction
The study is based on a comprehensive experimental database developed from 44 rigorously selected scientific publications sourced from peer-reviewed international journals specializing in FRP-reinforced concrete structures.4,17,19–60 The compilation of this database required meticulous manual extraction and verification of data to ensure accuracy and consistency. In total, 535 experimental results were collected, each corresponding to a reinforced concrete beam strengthened with either carbon fiber-reinforced polymer (CFRP) or glass fiber-reinforced polymer (GFRP). This extensive dataset captures a wide range of experimental conditions, material properties, and reinforcement configurations, providing a robust foundation for developing and validating predictive machine learning models. The careful selection and standardization of experimental studies also ensure that the data are representative of real-world structural applications and suitable for numerical modeling and statistical analysis.
Within the compiled dataset, some beams incorporate transverse reinforcement in the form of stirrups, while others lack such reinforcement, thereby covering different strengthening scenarios and enabling the exploration of their respective effects on shear behavior. Each record within the database includes detailed information on the beam’s geometric characteristics, the mechanical properties of the concrete, and the properties of both longitudinal and transverse FRP reinforcements. A comprehensive set of variables was defined to capture the geometric, material, and reinforcement characteristics of FRP-reinforced concrete beams. Geometric parameters include the beam cross-sectional area (AT), span length (L), effective depth (D), and shear span-to-depth ratio (a/D). Material properties comprise the concrete elastic modulus (Ec) as well as the fiber type for longitudinal (TF) and transverse (TFt) FRP reinforcement. Reinforcement characteristics consist of the longitudinal reinforcement ratio (ρf), transverse reinforcement ratio (ρft), and the elastic moduli of longitudinal (Ef) and transverse (Eft) FRP. The transverse reinforcement configuration is further specified by the stirrup spacing (S). The supervised learning target is the ultimate shear load (V), representing the beam’s maximum shear capacity at failure. Data were meticulously compiled from multiple experimental studies into a unified, standardized table, creating a reliable and consistent source for analysis. This comprehensive dataset ensures that all relevant factors influencing shear behavior are captured, allowing machine learning models to generate accurate and generalizable predictions.
It should be noted that the selection of input variables was constrained by the availability of consistent data across the compiled experimental database. Some FRP mechanical properties (e.g., tensile strength and ultimate strain) were not uniformly reported in the literature and therefore could not be reliably included. To maintain data completeness and consistency, FRP behavior was represented using reinforcement ratios and elastic moduli, which are widely reported and strongly correlated with shear performance. This approach ensures a robust and homogeneous dataset suitable for machine learning modeling.
Variable distribution analysis
Descriptive statistics of variables used in the study (N = 535).
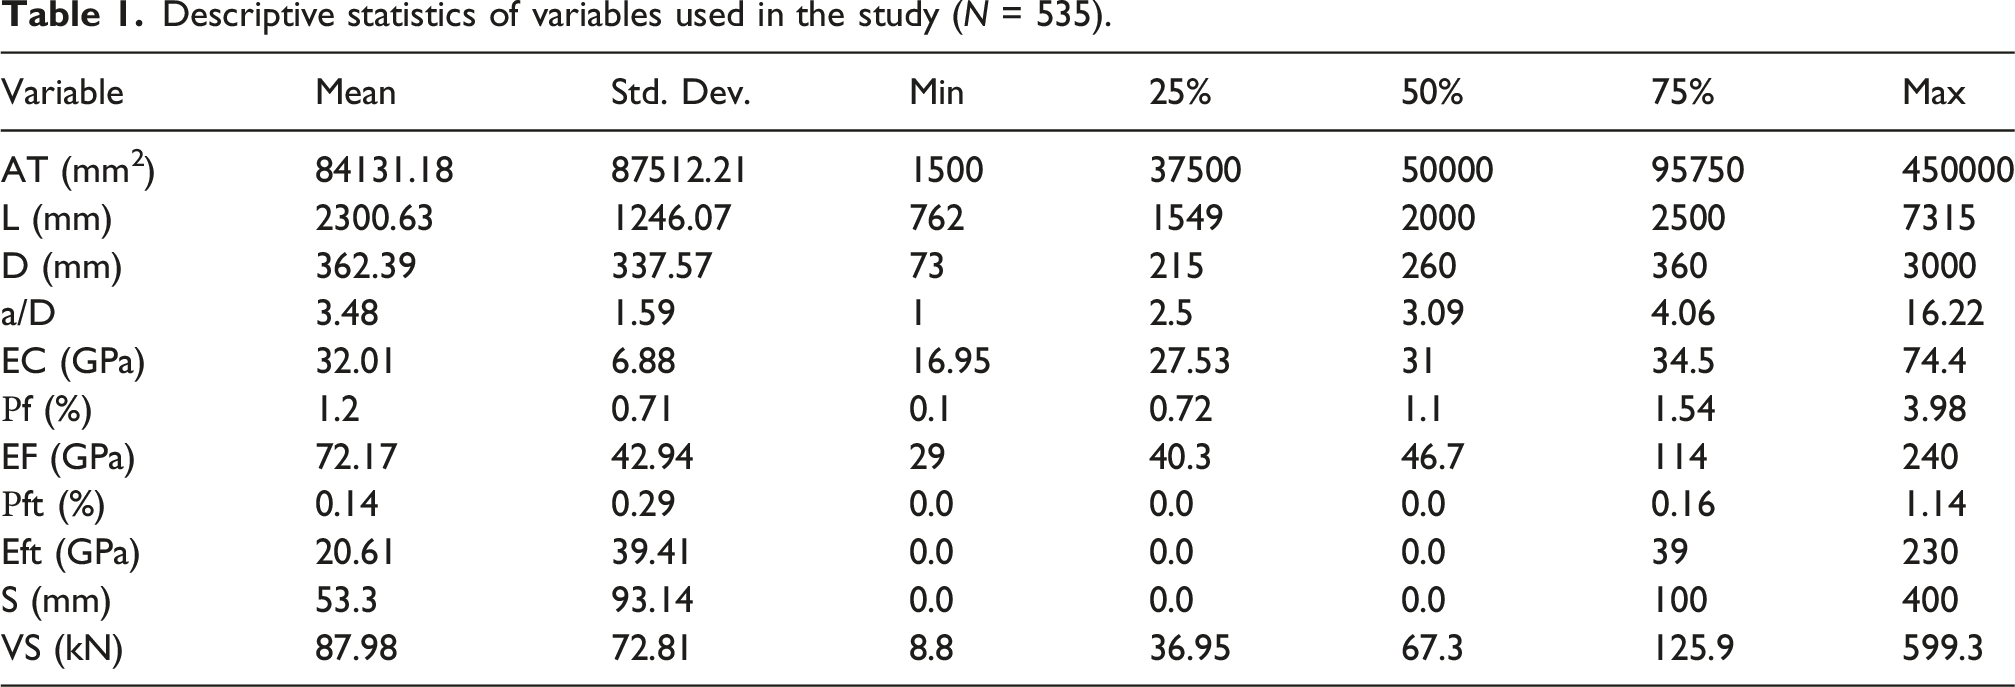
To further complement the descriptive statistics reported in Table 1, the distribution of each input variable was examined using graphical methods, including histograms and kernel density estimation (KDE) plots. These visualizations are presented in Figure 1. The results indicate that several variables exhibit wide dispersion and non-uniform distributions, which is expected given the heterogeneous nature of experimental datasets compiled from multiple literature sources. Distribution analysis of experimental dataset variables.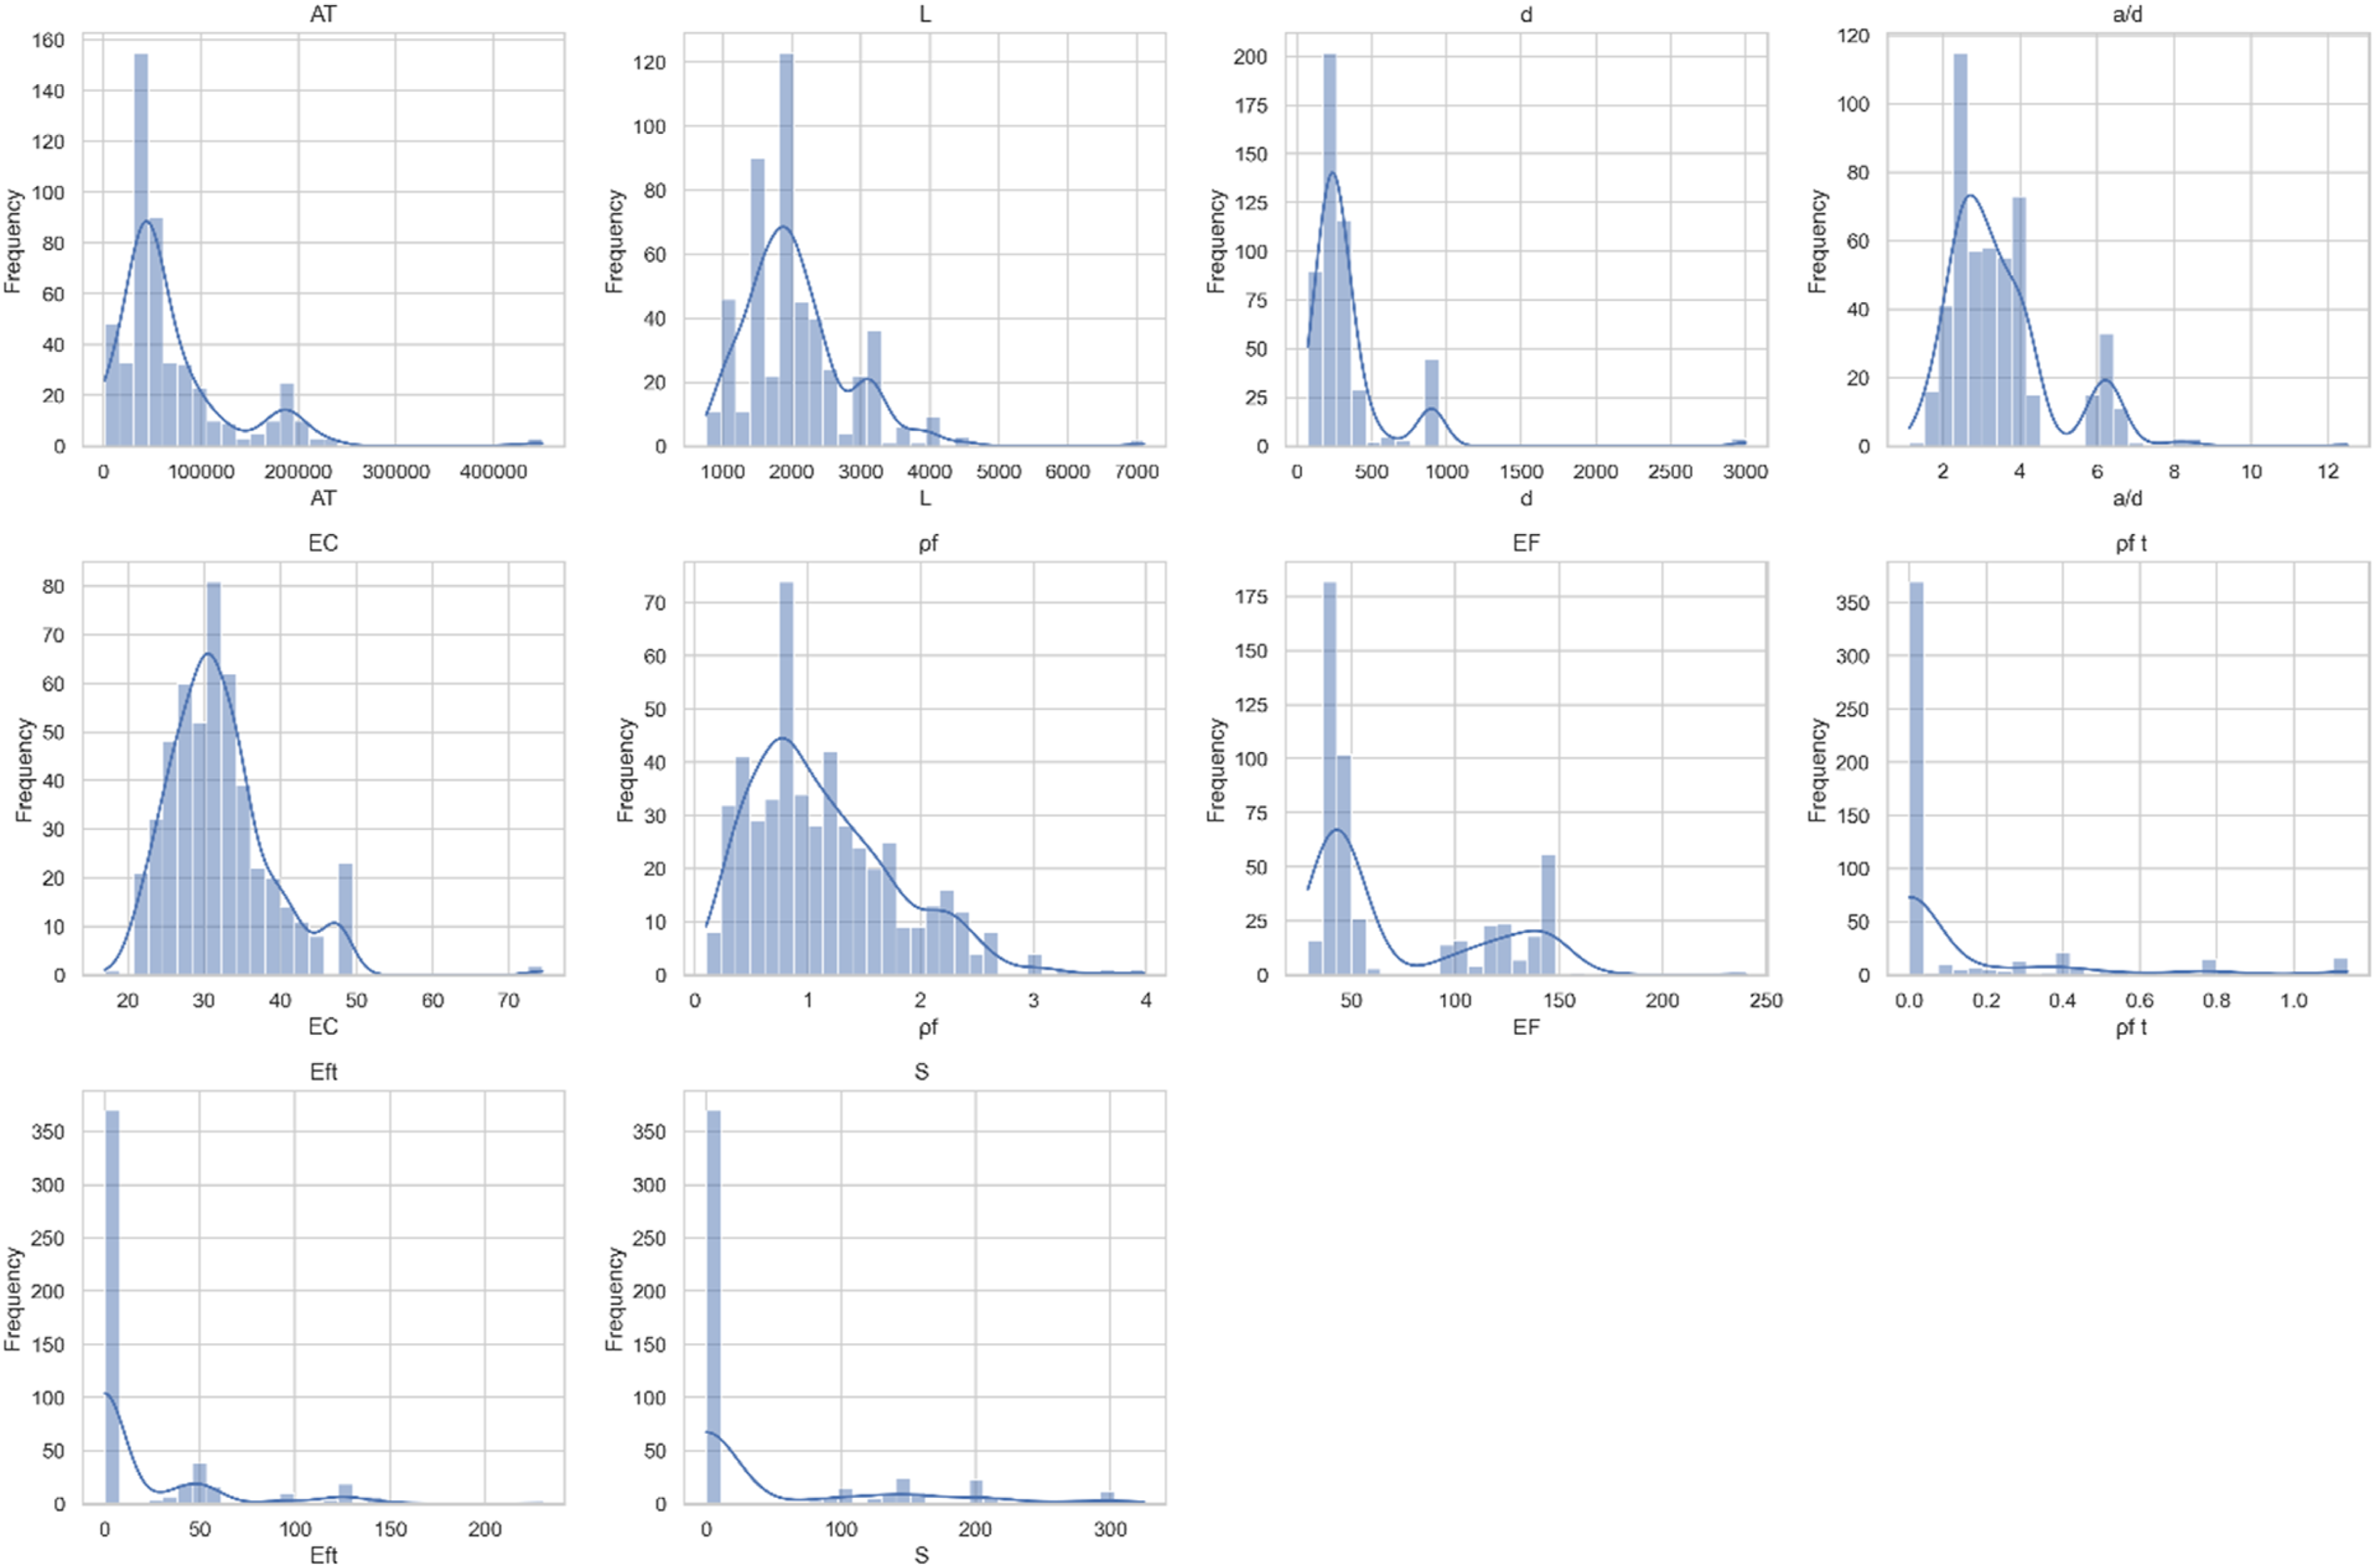
Although some variables present a standard deviation higher than their mean, this reflects the broad range of experimental conditions rather than data inconsistency or measurement error.
Machine learning models, including Support Vector Regression (SVR) and ensemble-based methods, are capable of capturing complex nonlinear relationships and are generally robust to non-normal and heterogeneous data distributions.
Consequently, despite the noticeable variability and uneven distributions, the dataset remains representative of real-world experimental conditions and supports the development of models with improved generalization capability across diverse structural configurations.
Feature correlation analysis
To enhance the transparency of the input feature design and assess potential redundancy among variables, a Pearson correlation analysis was conducted on the numerical input parameters. The resulting correlation matrix is presented in Figure 2, where the strength of the linear relationship between each pair of variables is quantified using the Pearson correlation coefficient. Pearson correlation matrix of input numerical features.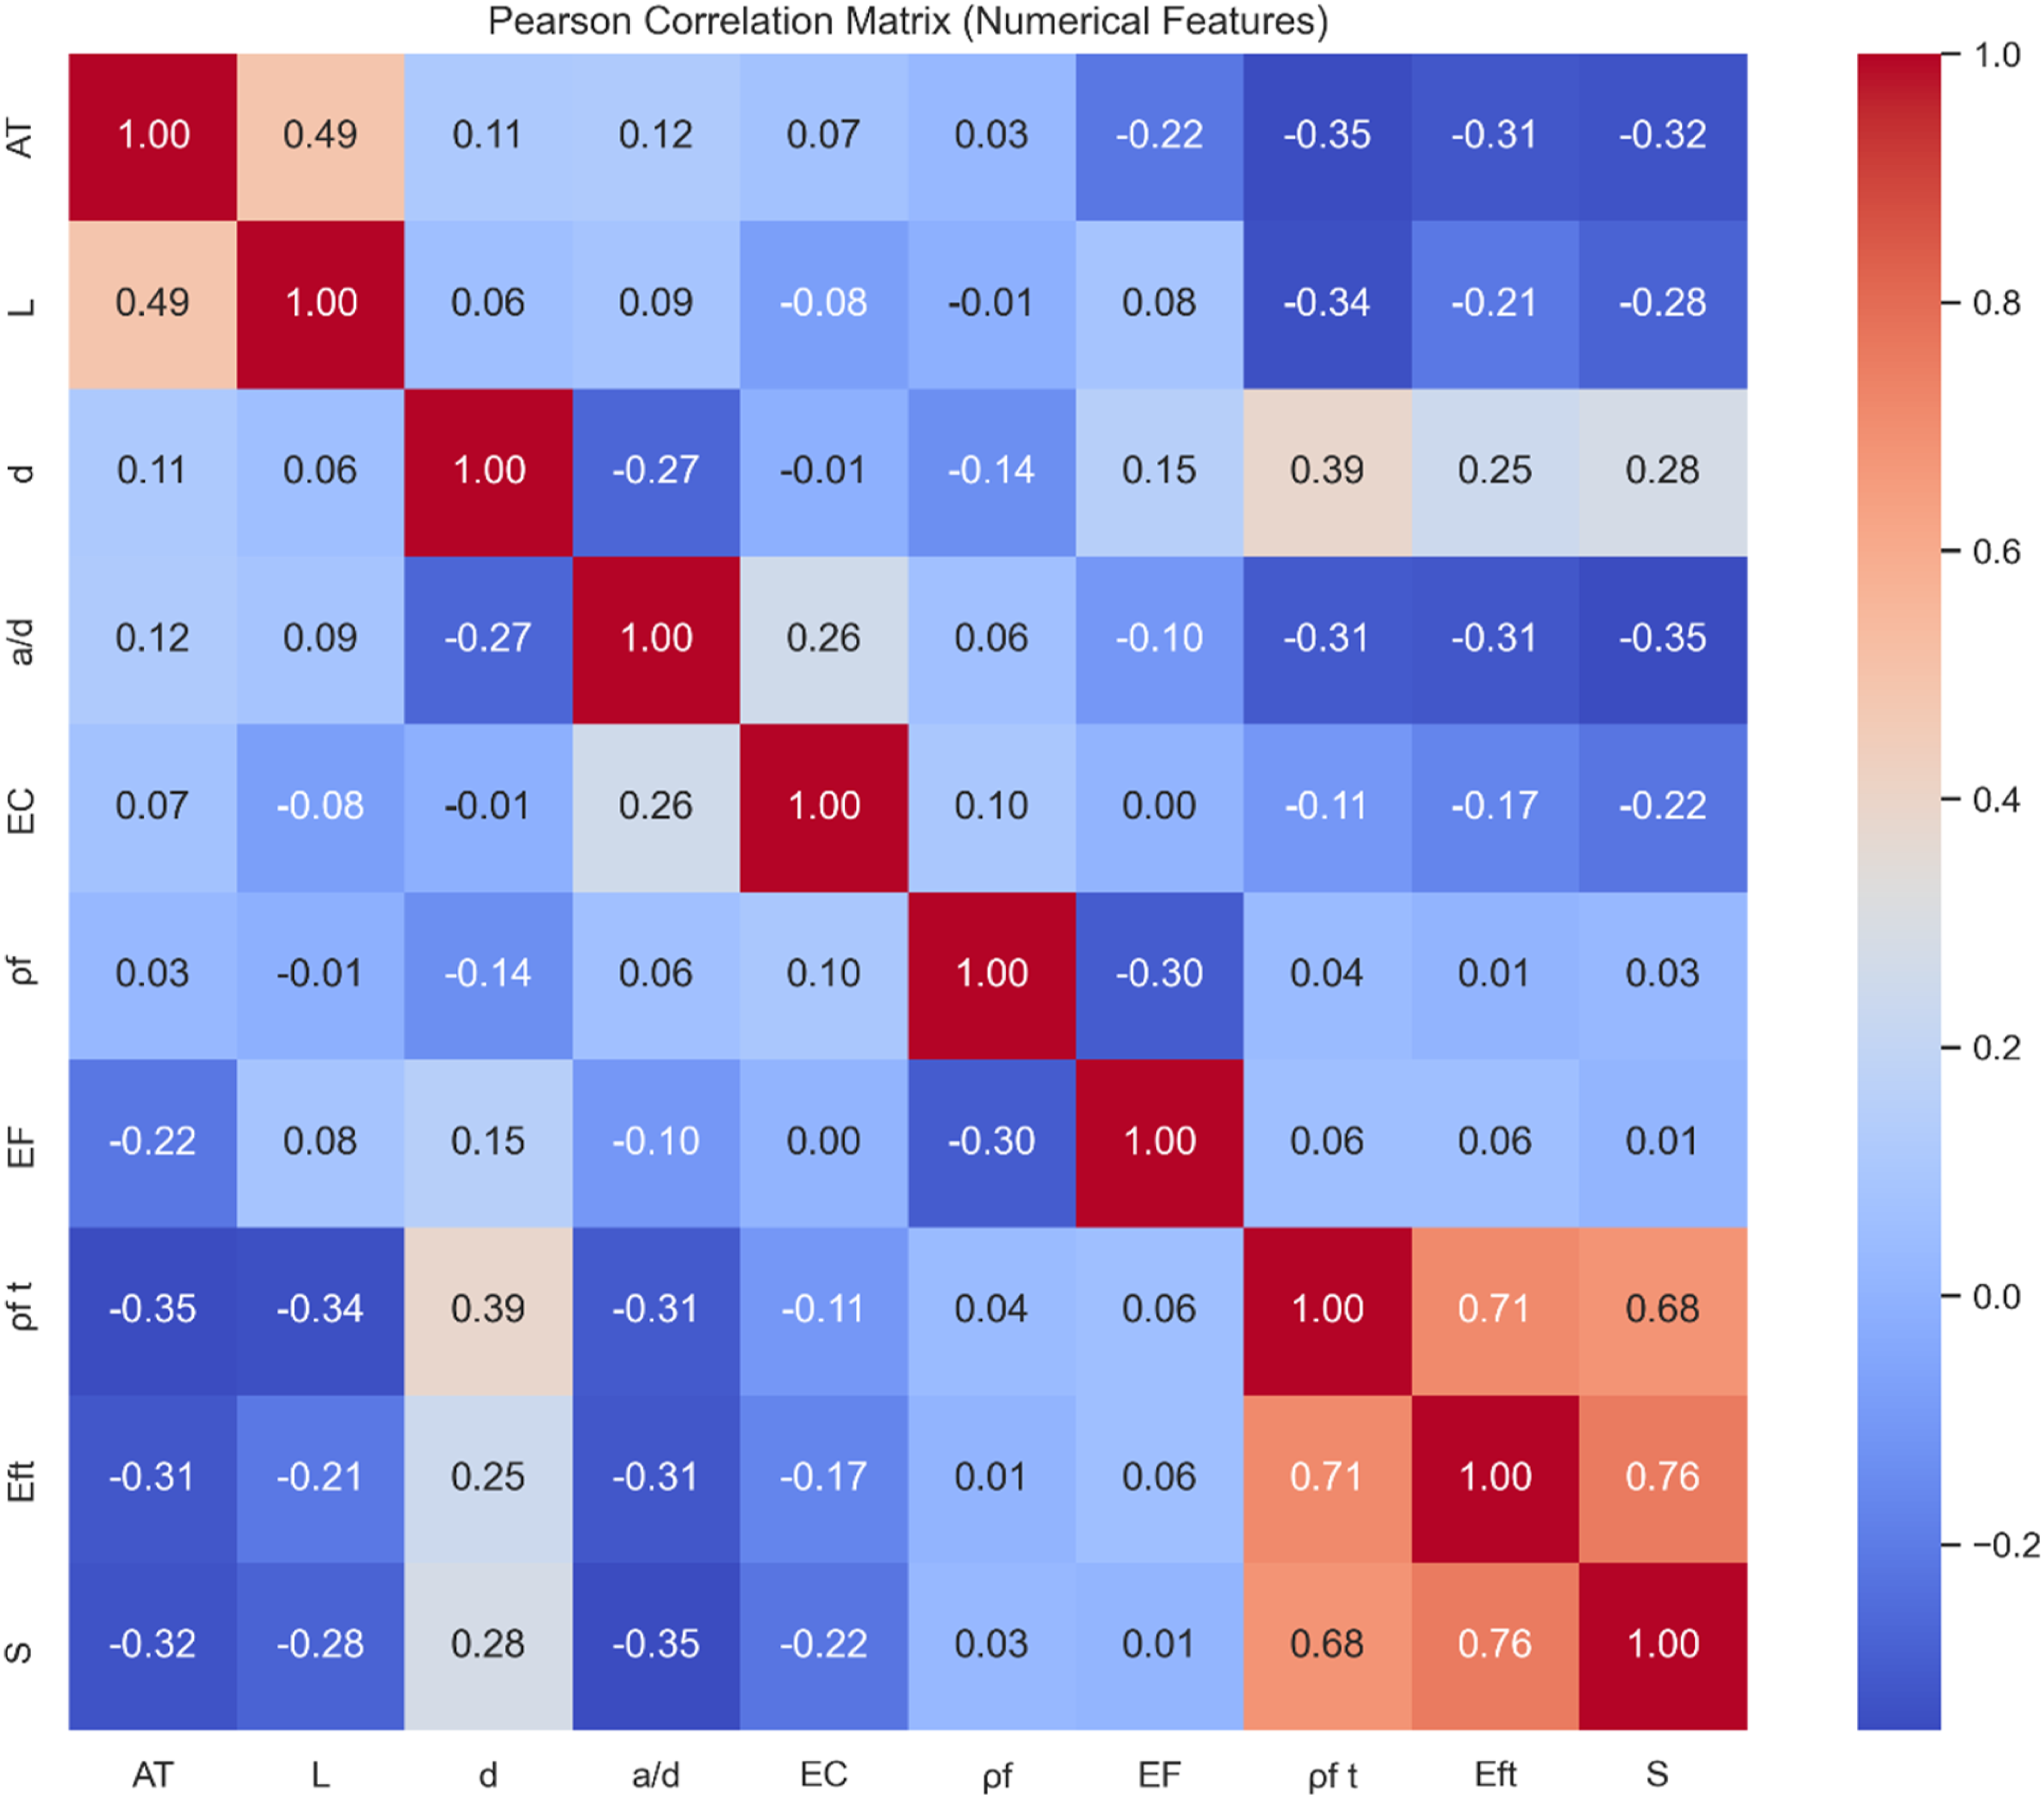
The analysis reveals that the majority of feature pairs exhibit weak to moderate correlations, indicating a low level of redundancy. The highest observed correlations are between Eft and S, ρft and Eft, and ρft and S. These values remain below the commonly accepted threshold of 0.8 for strong multicollinearity, suggesting that no severe linear dependency exists among the input variables.
Although moderate correlations are observed among certain input variables, these do not necessarily indicate direct physical relationships. Instead, they may reflect implicit dependencies introduced by the dataset structure and design procedures.
The absence of strong correlations confirms that the selected input variables are sufficiently independent, supporting the robustness of the machine learning models and enhancing the reliability of subsequent feature importance analyses.
Data preparation and processing
A preliminary data processing phase was conducted to ensure the reliability and consistency of the dataset before applying machine learning algorithms. This stage involved organizing and preparing the data, managing missing values (if any), and standardizing measurement units to create a coherent and homogeneous dataset.
It is important to emphasize that all experimentally obtained data points were retained in their entirety, with no data exclusion applied, in order to preserve the full range of experimental variability and ensure representativeness of real-world conditions. Therefore, no samples were removed from the dataset during preprocessing.
Additionally, feature preprocessing was implemented using scikit-learn’s Pipeline and ColumnTransformer utilities to ensure methodological rigor and prevent data leakage. Numerical variables were standardized using the StandardScaler, while categorical variables were encoded using the OneHotEncoder within a ColumnTransformer framework. These transformations were fitted exclusively on the training data and subsequently applied to the testing data without refitting. This procedure ensures that no information from the test set influenced the training process, thereby preserving the integrity of model evaluation and ensuring unbiased performance assessment.
These preprocessing steps are essential to minimize biases caused by differences in variable scales and to improve the convergence of optimization algorithms during model training. By establishing a clean and uniform dataset, the predictive models could learn more effectively from the experimental data and produce more accurate and stable predictions of shear strength in FRP-reinforced concrete beams. Therefore, the preprocessing stage focused solely on transformation and standardization without excluding any experimental observations.
Data splitting
The dataset was divided into two distinct subsets to ensure a robust and unbiased evaluation of model performance. Specifically, 80% of the data were allocated to the training set, which was used to train and optimize the machine learning models, while the remaining 20% formed the testing set, reserved exclusively for evaluating the models on previously unseen data. This separation allows for an accurate assessment of each model’s generalization capability, ensuring that the predictive performance is not merely a result of overfitting to the training data but rather reflects the model’s ability to make reliable predictions on new, independent cases.
All preprocessing steps were applied after the data splitting stage and were fully integrated within the model training pipeline. This ensures consistency across training and testing data and guarantees that no information from the test set is used during model fitting or feature transformation, thereby ensuring an unbiased evaluation of model performance and eliminating any risk of data leakage.
Computational environment and software implementation
All computations were performed in Python 3 using a Jupyter Notebook (ipykernel) environment. Machine learning implementation, preprocessing, hyperparameter optimization, and model evaluation were conducted using Scikit-learn (v1.6.1). Data manipulation and numerical computations were performed using Pandas (v2.2.3) and NumPy (v2.1.3), while graphical visualizations were generated using Matplotlib (v3.10.0) and Seaborn (v0.13.2). A fixed random seed (random_state = 42) was employed to ensure reproducibility of the train–test partitioning and modeling procedures.
Machine learning model development
This section presents the development and evaluation of machine learning models for predicting the shear strength of FRP-reinforced concrete beams. Following data preprocessing, the study focuses on capturing nonlinear relationships among geometric, mechanical, and material parameters.
Hyperparameter optimization of machine learning
Hyperparameter optimization is an essential step in building high-performance machine learning models, as it improves prediction accuracy and reduces overfitting by tuning algorithm-specific parameters. In this study, all models—Artificial Neural Network (ANN), Support Vector Regression (SVR), Decision Tree (DT), Random Forest (RF), and XGBoost—were systematically optimized.
GridSearchCV was employed to explore all combinations of predefined hyperparameters, combined with k-fold cross-validation (typically 5 or 10 folds) to evaluate model stability across different data partitions. This procedure ensures a balanced trade-off between bias and variance, leading to improved generalization performance on unseen data.
Performance criteria
The performance of the proposed machine learning models is evaluated using standard statistical metrics, including the coefficient of determination (R2), root mean square error (RMSE), and mean absolute error (MAE). The coefficient of determination (R2) measures the proportion of variance in the dependent variable that is explained by the model. Its values typically range from 0 to 1, with 1 indicating a perfect fit; however, negative values may occur when the model performs worse than a simple baseline. Higher R2 values indicate better model performance, whereas lower values suggest that the model fails to adequately capture the underlying patterns in the data.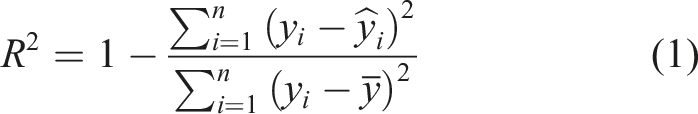
The Root Mean Squared Error (RMSE) measures the average magnitude of the prediction errors by taking the square root of the mean of the squared differences between predicted and observed values. Due to the squaring of errors, RMSE assigns greater weight to larger deviations, making it particularly sensitive to outliers and large prediction errors. It is calculated as follows: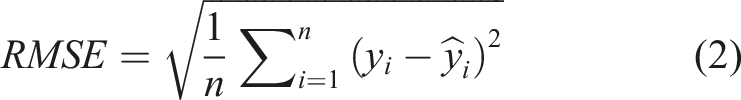
The Mean Absolute Error (MAE) quantifies the average magnitude of prediction errors by computing the mean of the absolute differences between predicted and observed values. It is expressed as: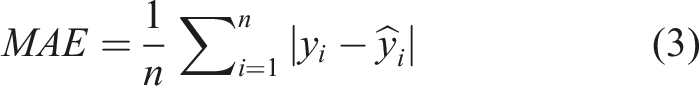
The Root Mean Square Error Ratio (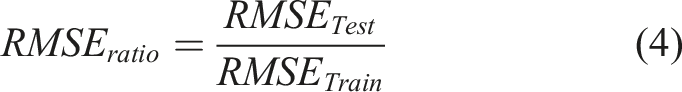
The Mean Absolute Error Ratio (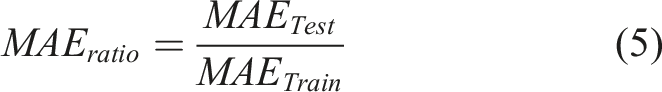
Results and comparison of machine learning models
This section presents the performance evaluation of five machine learning models developed to predict the shear strength of reinforced concrete beams strengthened with CFRP and GFRP composites. Model assessment is based on statistical indicators including the coefficient of determination (R2), root mean squared error (RMSE), residual analysis, and feature importance. These metrics are used to evaluate predictive accuracy, stability, and robustness, and to identify the most influential variables governing shear behavior.
Comparative visualization and predictive accuracy
Scatter plots of predicted versus actual values (Figure 3) show good agreement with experimental shear strength for both training and testing datasets. All models were optimized using a 5-fold GridSearchCV procedure to ensure consistent and reproducible hyperparameter tuning. Overall, all models achieve high predictive accuracy (R2 > 0.90), with only minor variations, indicating comparable capability in capturing the relationship between input variables and shear strength. Comparative scatter analysis. (a) SVM Model; (b) XGBoost Model; (c) ANN Model; (d) DT Model; (e) RF Model.
Among the evaluated models, the Support Vector Machine (SVM) demonstrates the most stable performance, achieving R2 = 0.946 (training) and 0.937 (testing) with optimized parameters (C = 150, kernel = RBF, epsilon = 0.01, gamma = scale), indicating strong generalization capability. Ensemble models also perform well: Random Forest (n_estimators = 200, max_depth = None, min_samples_split = 2) and XGBoost (n_estimators = 300, max_depth = 4, learning_rate = 0.05, subsample = 0.8) provide robust predictions with slightly lower accuracy. The Artificial Neural Network (ANN), with architecture (5, 20), ReLU activation, and Adam optimizer, shows comparable performance but slightly higher sensitivity to extreme values.
In contrast, the Decision Tree (DT) model (max_depth = 10, min_samples_split = 4) exhibits the lowest predictive performance due to limited generalization capability. Overall, all models capture the global trend effectively, while SVM and ensemble methods show slightly better stability.
Residual analysis and error distribution
Residual analysis (Figure 4) shows that prediction errors are centered around zero for all models, indicating no significant systematic bias. Error dispersion remains limited for both training and testing datasets, confirming stable model behavior. Training and testing error evolution. (a) SVM Model; (b) XGBoost Model; (c) ANN Model; (d) DT Model; (e) RF Model.
SVM and Random Forest show the most consistent error distributions, characterized by narrow residual bands. ANN and XGBoost exhibit similar behavior, although a few isolated extreme errors (≈ ±40 kN) appear, likely due to underrepresented cases in the dataset. The Decision Tree model shows higher dispersion, consistent with its lower predictive accuracy.
Performance comparison of machine learning models for predicting shear strength.
Interpretability and physical consistency of the SVR model
SHAP-based global and interaction effects on shear capacity
SHAP (SHapley Additive exPlanations) provides a detailed and physically consistent interpretation of the SVR model, offering detailed insight into how individual parameters influence shear capacity. As illustrated in the SHAP summary plot (Figure 5), AT (total area of reinforcement) and D (effective depth) emerge as the dominant structural variables. The broad horizontal dispersion of high-value observations (shown in red) indicates that increases in reinforcement area and member depth are associated with higher predicted shear strength. This behavior aligns with fundamental structural mechanics, particularly the size effect and the role of reinforcement volume, suggesting that the model captures the governing geometric trends. SHAP-based feature contribution analysis for shear strength prediction.
A key finding from the SHAP analysis is the directional influence of the a/D ratio (shear span-to-depth ratio), which shows a clear inverse relationship where higher values correspond to negative SHAP contributions, reducing predicted shear capacity. This trend reflects the transition from arch action in deep beams to beam action in slender members. In addition, the dispersion observed for variables such as pf (reinforcement ratio) suggests interaction effects, indicating that reinforcement influence depends on combined geometric conditions.
For variables such as pft and EF, SHAP reveals a non-uniform contribution characterized by values concentrated near zero with extended positive tails, indicating threshold-dependent behavior where these parameters become significant only beyond certain ranges. This nonlinear response is consistent with trends observed in Partial Dependence Plots (PDPs), showing that the SVR model captures varying parameter sensitivity across the domain.
Finally, categorical variables such as TF (fiber type) and TFt (treatment type) show relatively narrow SHAP distributions compared to geometric variables, indicating a secondary contribution to shear capacity. This suggests that while material properties act as modifying factors, the dominant influence arises from geometric configuration and reinforcement characteristics, consistent with established structural mechanics principles.
PDP-based functional response and nonlinear shear mechanisms
The Partial Dependence Plots (Figure 6) indicate that the SVR model effectively captures the nonlinear behavior governing structural shear strength. For geometric parameters, the Area of Section (AT) and Effective Depth (D) exhibit strong influence. The AT curve shows a rapid increase in shear strength with section size, followed by a clear saturation trend beyond approximately 300,000 mm2, indicating diminishing returns at larger dimensions. Partial dependence plots of key predictors for shear strength prediction.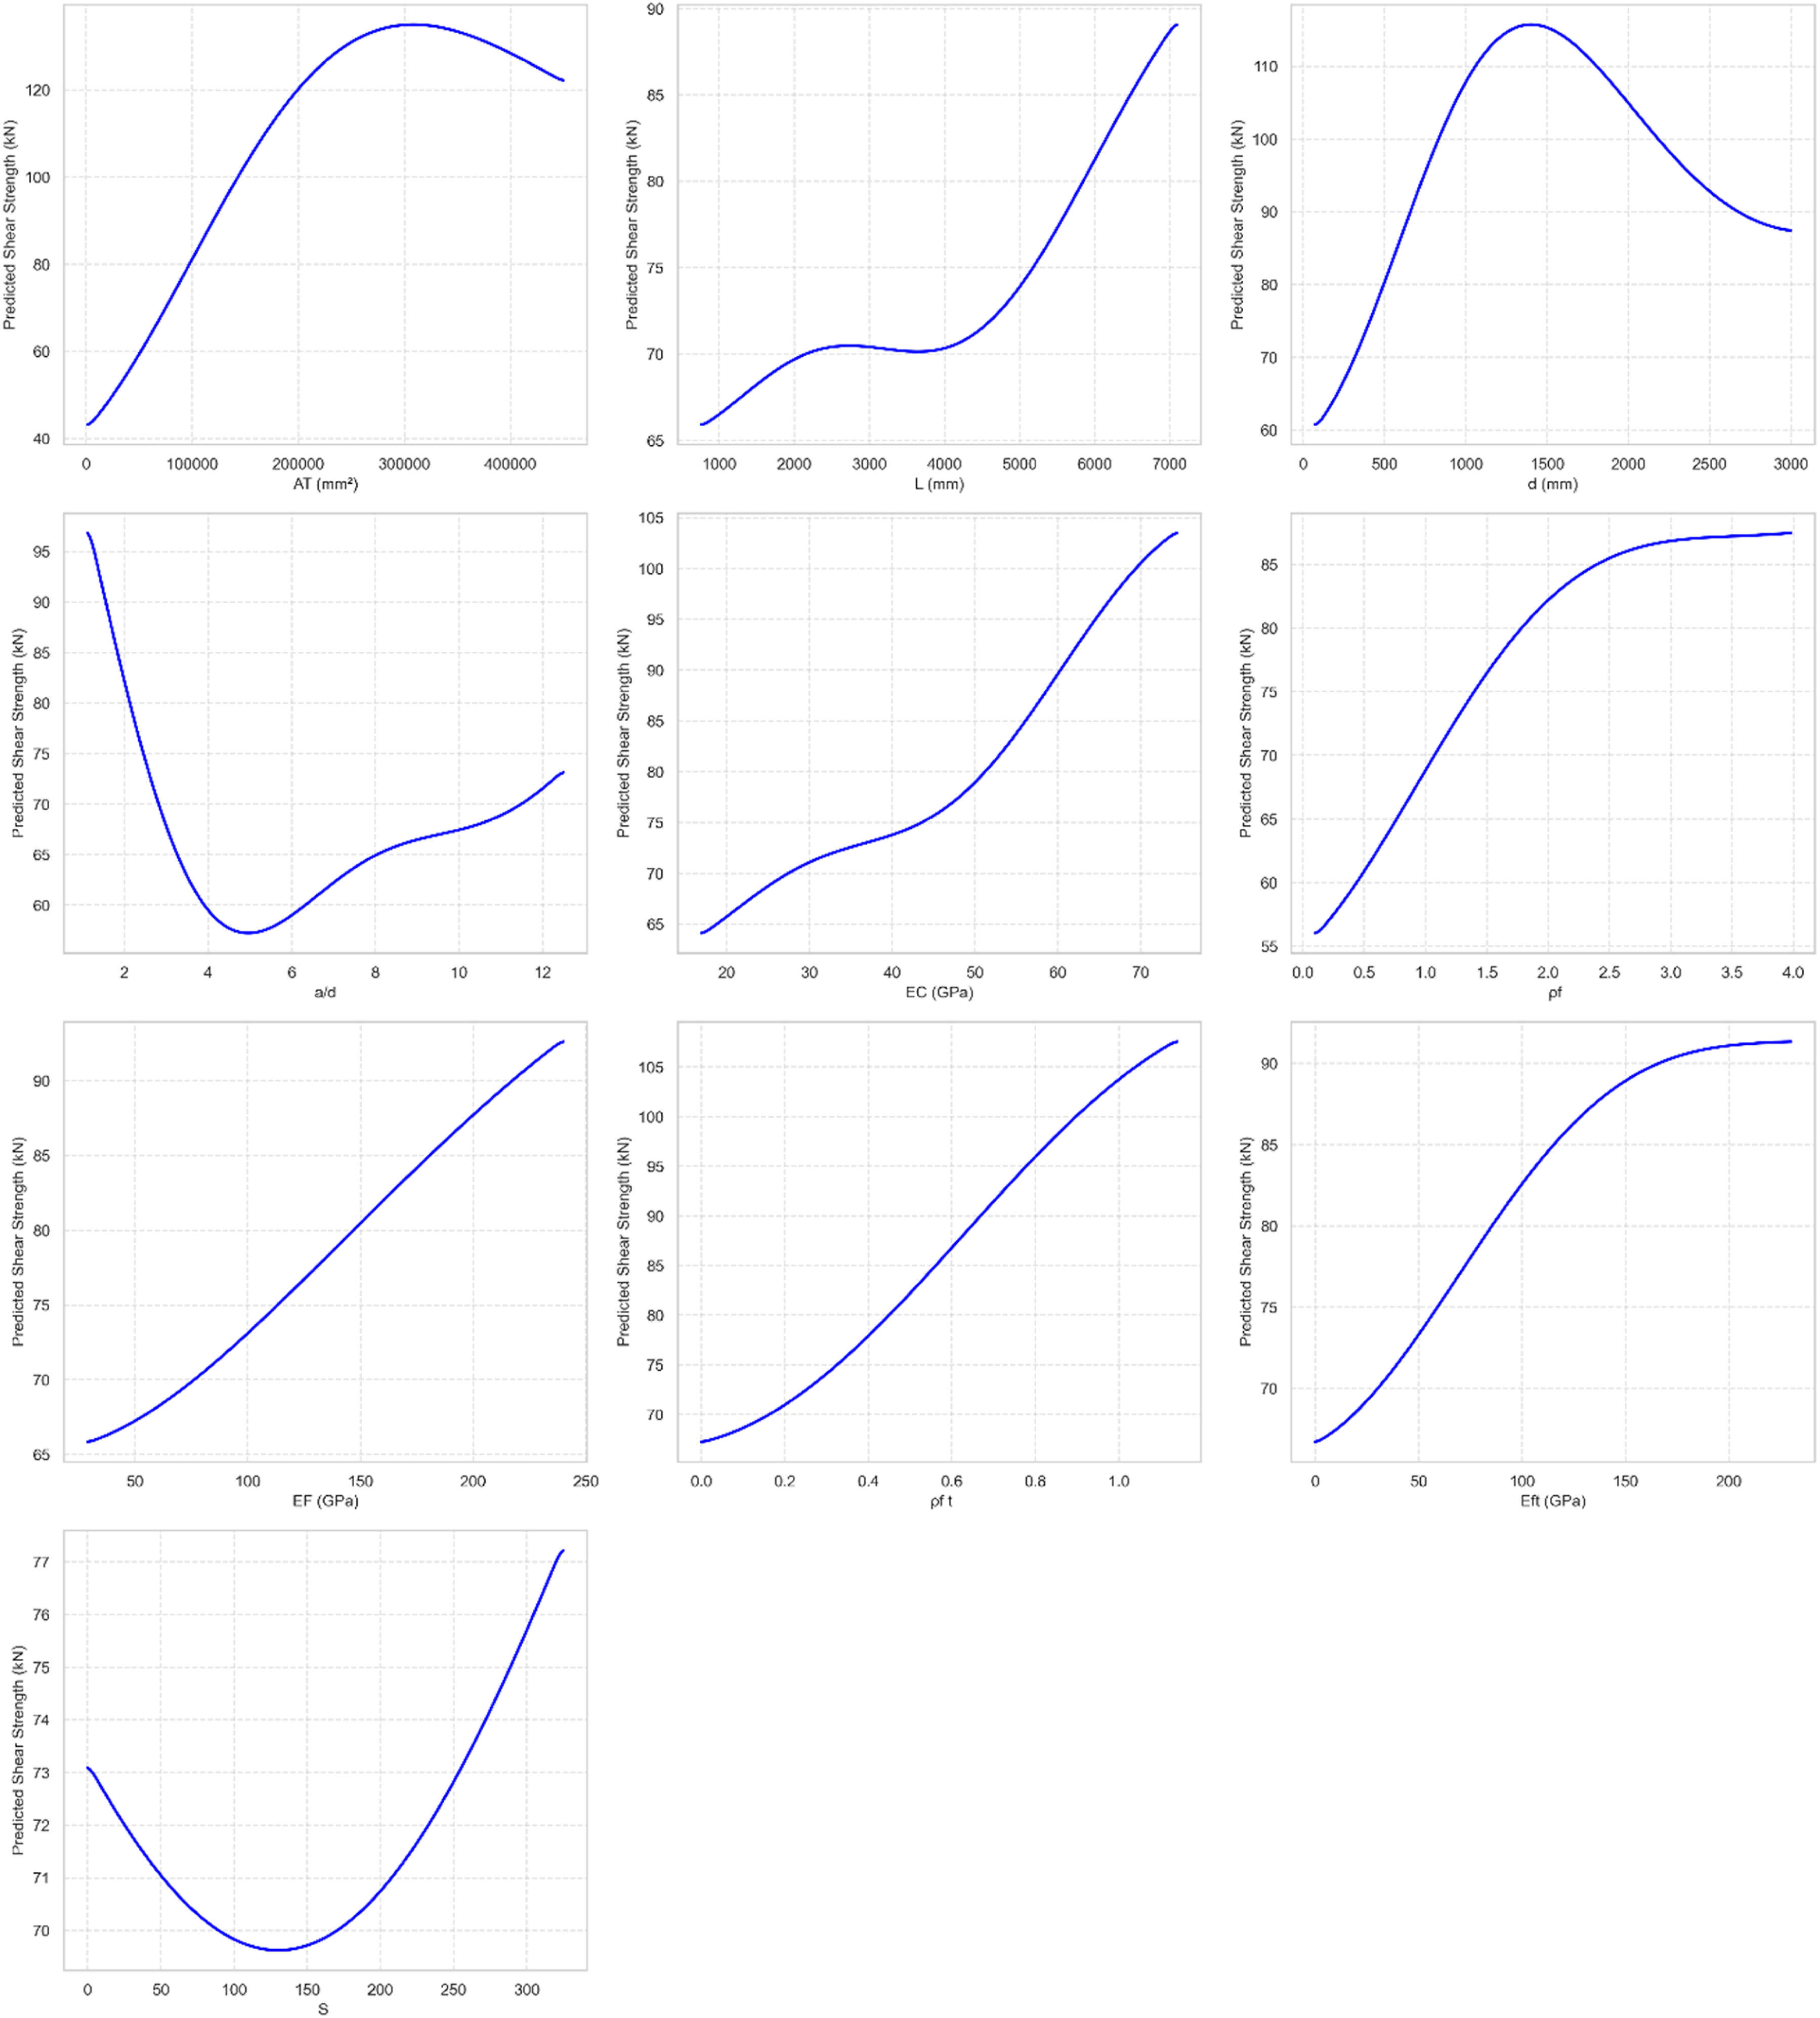
In addition, the effective depth (D) exhibits a non-monotonic response, with a peak around 1,500 mm, after which the predicted shear strength decreases. This behavior reflects the classical size effect in structural mechanics, where increasing member depth may reduce shear capacity due to crack localization and reduced stress redistribution efficiency.
Material stiffness and reinforcement parameters follow expected physical trends while also exhibiting saturation effects. The longitudinal reinforcement ratio (ρf) shows a sigmoidal response, with the most significant gains in shear strength occurring between 0.5% and 2.5%, beyond which the response stabilizes, indicating a range where additional reinforcement provides marginal benefit. Similarly, increases in concrete modulus (EC) and reinforcement moduli (EF, EFt) are associated with higher shear strength due to improved aggregate interlock and increased axial stiffness of the reinforcement system.
The analysis of key structural ratios such as the shear span-to-depth ratio (a/D) and spacing (S) provides further insight into the failure mechanisms captured by the model. The a/D ratio shows a pronounced reduction in shear strength as it increases from 1 to 5, consistent with the transition from arching action in deep beams to diagonal cracking in slender members. The spacing (S) exhibits a nonlinear trend, reflecting a balance between improved confinement at low spacing and reduced effectiveness or increased variability at higher values.
Conclusion
This study demonstrates the effectiveness of artificial intelligence-based models for predicting the shear strength of FRP-reinforced concrete beams, including both CFRP and GFRP strengthening systems. Among the five supervised learning models evaluated—SVM, XGBoost, ANN, Random Forest, and Decision Tree—all exhibited strong predictive capability, with coefficients of determination (R2) exceeding 0.90 for both training and testing datasets, indicating reliable agreement between predicted and observed values.
The Support Vector Machine (SVM) model achieved the highest accuracy and stability, with R2 values of 0.946 (training) and 0.937 (testing), and the lowest RMSE of 10.16 kN, reflecting excellent generalization with limited overfitting. ANN and Random Forest also demonstrated high predictive performance, while XGBoost showed slightly higher RMSE and greater discrepancies between training and testing results. The Decision Tree model, although useful, exhibited greater sensitivity to overfitting.
Residual analysis confirmed that prediction errors were centered around zero with no evident systematic bias, although a few isolated extreme residuals were observed for ANN, RF, and XGBoost, indicating the presence of atypical cases in the dataset. Feature importance analysis from the SVM model identified beam cross-sectional area (AT), effective depth (D), and FRP reinforcement ratios (pf, pft) as the most influential parameters, suggesting potential for model simplification without loss of predictive accuracy.
From a practical engineering perspective, the results highlight the dominant role of member geometry and reinforcement configuration in governing shear capacity. The proposed machine learning models can support performance-based design by enabling more accurate prediction of shear strength, optimization of reinforcement strategies, and improved material selection for FRP-strengthened concrete beams.
Footnotes
Acknowledgments
The authors extend their appreciation to Prince Sattam bin Abdulaziz University for funding this research work through the project number (PSAU/2025/01/37404).
Funding
The author disclosed receipt of the following financial support for the research, authorship, and/or publication of this article: The authors extend their appreciation to Prince Sattam bin Abdulaziz University for funding this research work through the project number (PSAU/2025/01/37404)
Declaration of conflicting interests
The author declared no potential conflicts of interest with respect to the research, authorship, and/or publication of this article.