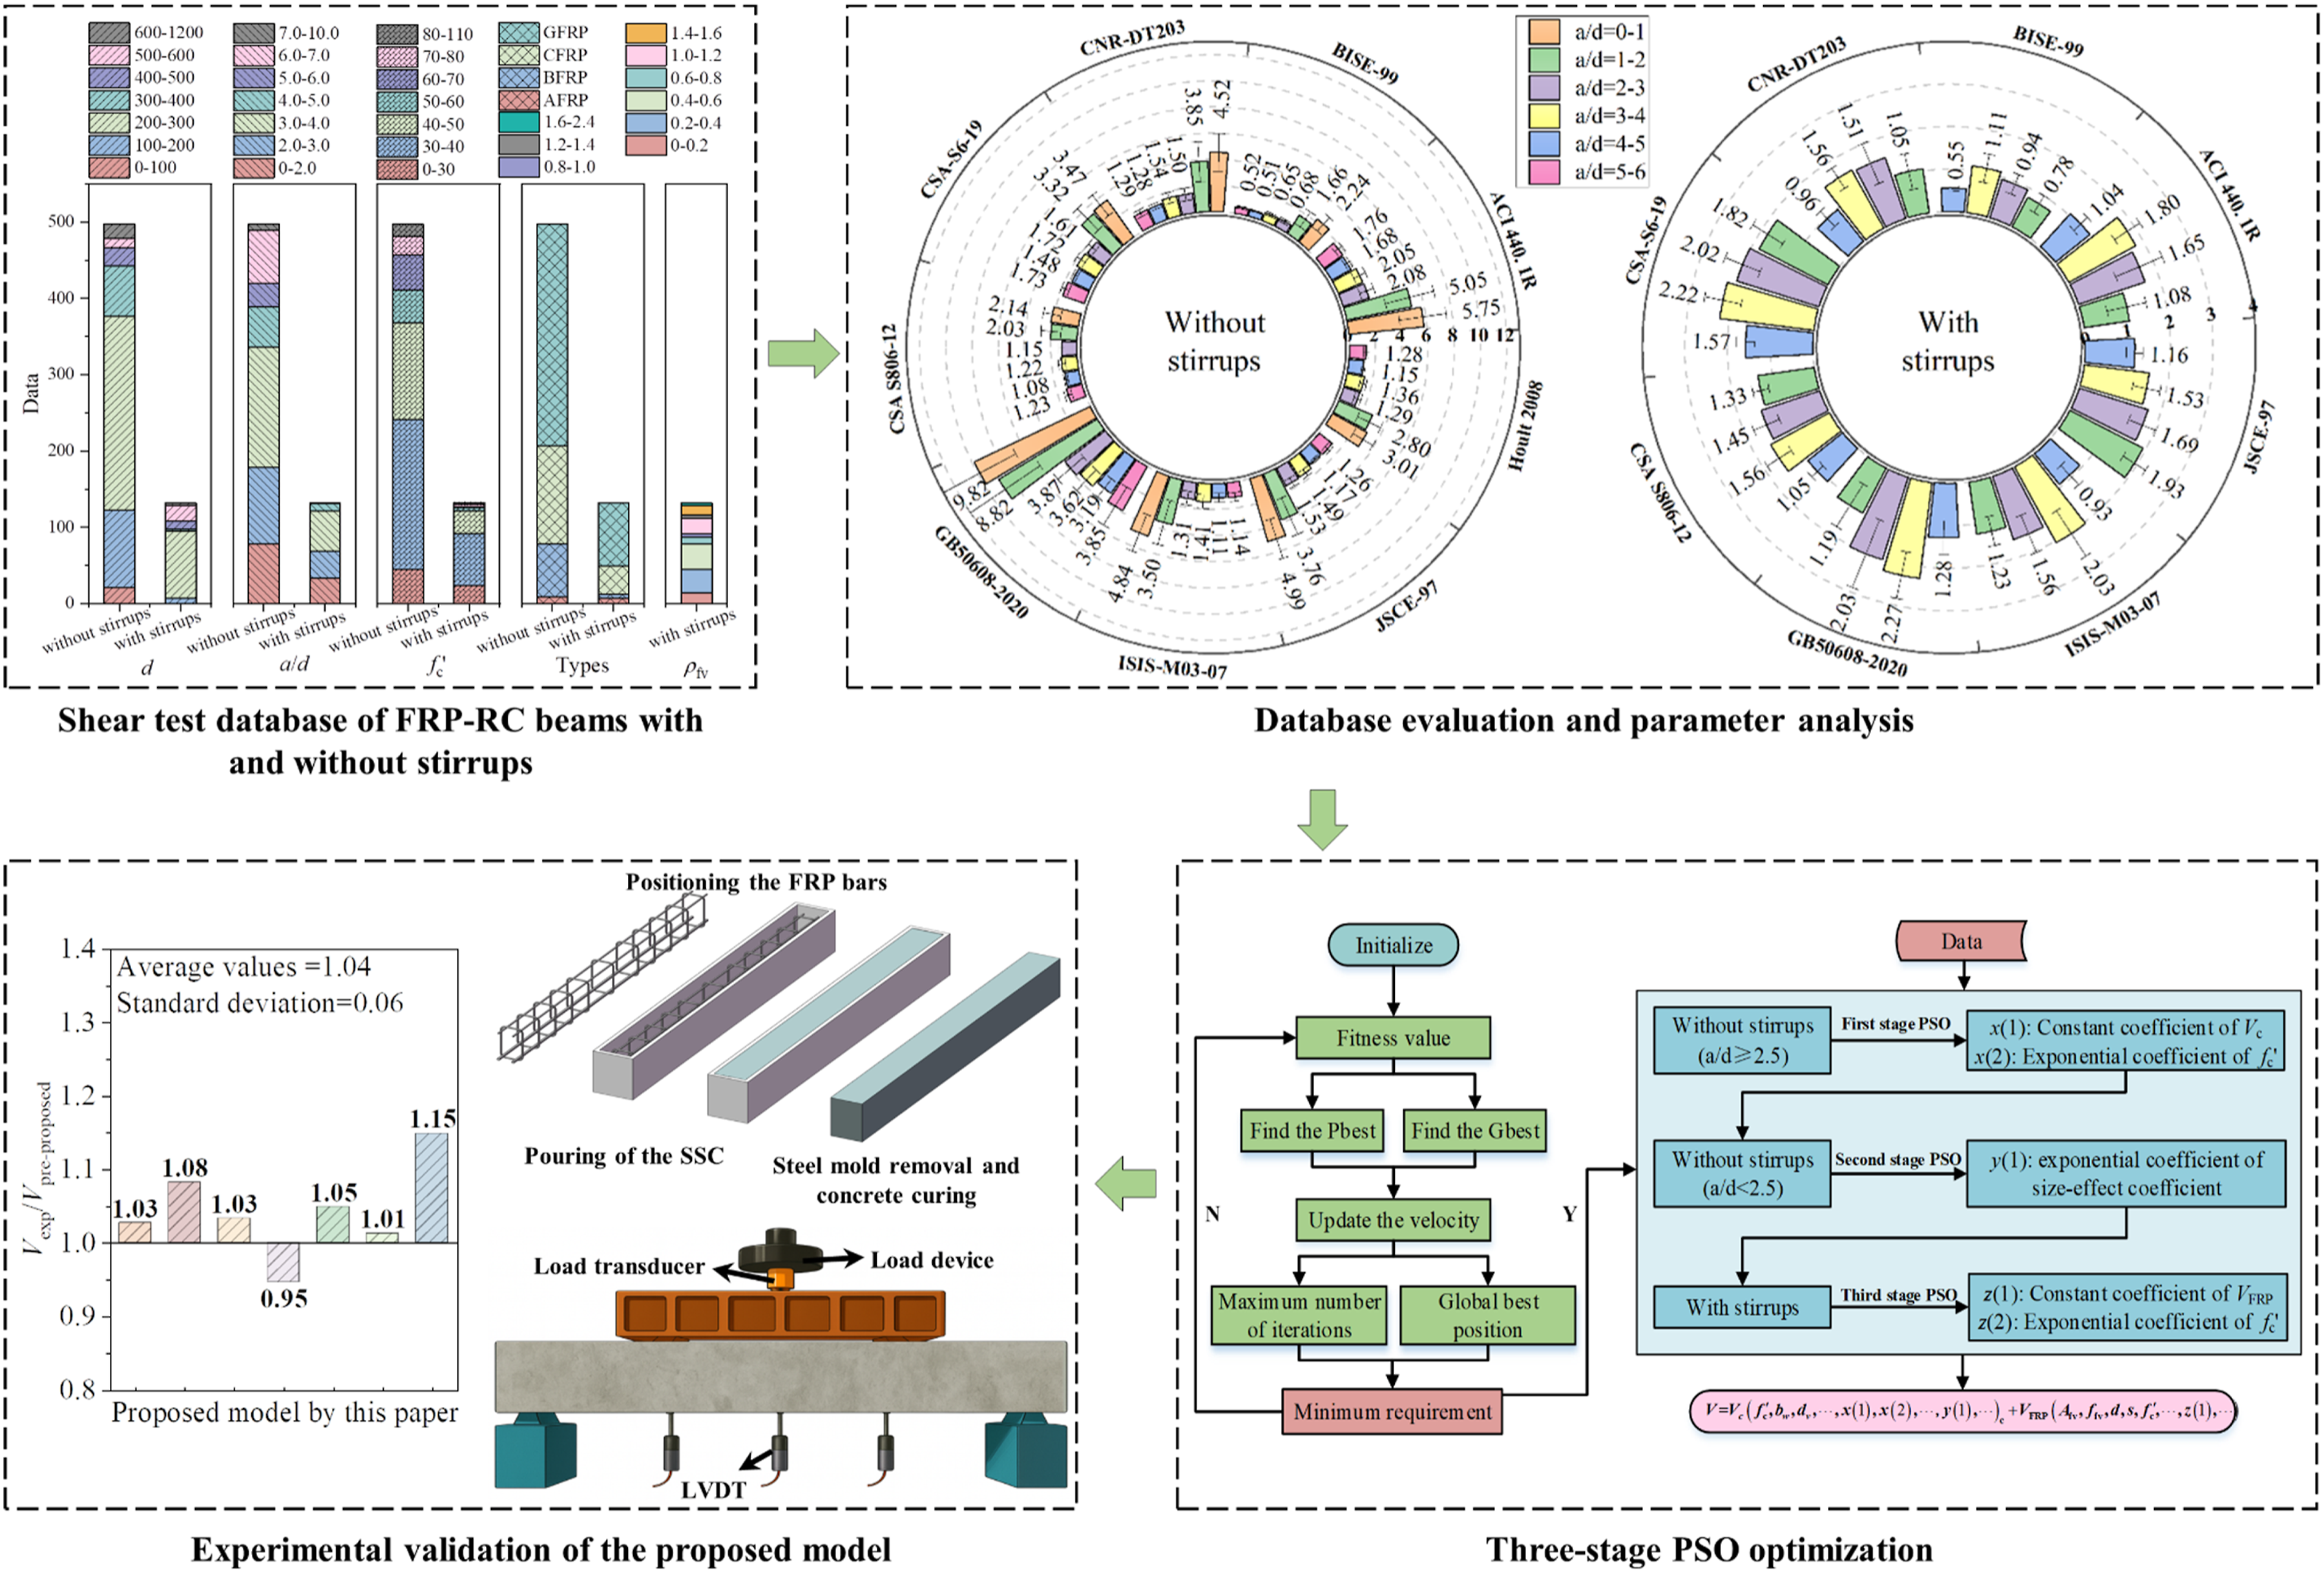
Accurate prediction of the shear capacity of concrete beams reinforced with fiber-reinforced polymer (FRP) bars is hindered by large scatter and parameter-dependent bias in design models. This study compiles a database of 631 shear tests on FRP-reinforced concrete beams (499 without and 132 with FRP stirrups) and assesses nine design methods. The effects of effective depth, shear span-to-depth ratio, concrete compressive strength, and FRP stirrup ratio are quantified. Results reveal deficiencies in capturing size effects and modeling the coupling between concrete and FRP contributions, particularly for beams with small shear span-to-depth ratios and high-strength concrete. To improve predictive accuracy while retaining physical transparency, a three-stage particle swarm optimization (PSO) framework is developed to recalibrate coefficients and selected exponents of code-based shear equations. The optimized formulations substantially reduce prediction bias, coefficient of variation, and average absolute error, with the CSA S806-12-based model exhibiting the best overall performance among the formulations considered. A unified shear design equation for beams with and without FRP stirrups within the parameter ranges covered by the calibration database is proposed and examined against an independent seven-beam BFRP experimental program, providing preliminary external verification within the tested ranges and showing improved prediction consistency compared with existing design models.
Steel reinforcement in reinforced concrete (RC) structures is vulnerable to corrosion in aggressive environments such as marine and coastal regions, de-icing salt–exposed infrastructure, and wastewater facilities. Corrosion-induced loss of bar cross-section, cracking and spalling of the cover concrete, and bond deterioration reduce the load-bearing capacity and service life of RC members and lead to substantial life-cycle maintenance and repair costs.1–3 Fiber-reinforced polymer (FRP) bars, characterized by high tensile strength, excellent corrosion resistance, and low self-weight, have therefore been widely recognized as a promising alternative to conventional steel reinforcement in such environments, with potential durability-driven life-cycle cost benefits.4 In the La Chancelière car park project in Quebec, Canada, replacing steel bars with GFRP bars increased reinforcement cost by about 70% yet reduced the overall project cost by roughly 5% owing to improved corrosion resistance and lower maintenance.5
In general, FRP bars can be used effectively as tensile reinforcement in flexural members. However, their elastic modulus is significantly lower than that of steel; for instance, the modulus of typical carbon FRP (CFRP) bars is on the order of 100 GPa and that of basalt FRP (BFRP) bars is about 60 GPa, both far below that of steel reinforcement.6 As a result, FRP-reinforced concrete beams tend to exhibit larger deflections, wider cracks and greater crack depths under service loads.7,8 Accordingly, several design codes allow larger crack-width limits at the serviceability limit state (SLS) for FRP-reinforced concrete members than for conventional steel-reinforced concrete beams. For example, ACI 440.1 R permits maximum crack widths of 0.7 mm for members exposed to outdoor environments and 0.5 mm for indoor environments,9,10 both of which are substantially greater than the commonly adopted limit of 0.25 mm for steel-reinforced concrete members. Moreover, experimental results on the flexural capacity of FRP-reinforced members generally agree well with closed-form analytical predictions derived under the plane-section assumption.11 However, compared with flexural behavior, the shear performance of FRP-reinforced concrete flexural members remains less well resolved. In general, the shear resistance of a concrete beam reinforced with FRP bars consists of the following components: (1) the contribution of the uncracked concrete compression zone; (2) aggregate interlock along cracks; (3) residual tensile stresses in the cracked concrete; (4) dowel action of the longitudinal reinforcement; (5) the contribution of shear reinforcement, if present; and (6) arch action.12 The increased deflection and crack width associated with the low modulus of FRP bars adversely affect components (1), (3) and (4), while the relatively low shear stiffness of FRP stirrups reduces the effectiveness of component (5). Consequently, FRP-reinforced concrete beams often exhibit a lower and more deformation-sensitive shear capacity than comparable steel-RC beams; brittle shear failure therefore becomes a major concern that can limit the wider application of concrete structures reinforced with FRP bars.
To ensure safe and economical design, various shear design equations have been proposed by different standards and researchers for predicting the shear capacity of concrete beams reinforced with FRP bars. Many design guidelines and codes, such as ACI 440.1R-1510, CSA S806,9 CSA S6-19,13, JSCE-97,14 and GB 50608-2020,15 generally adopt truss-model-based or modified compression field theory (MCFT)-based formulations, in which the shear resistance is decomposed into the contributions of concrete and shear reinforcement.12 In parallel, numerous researchers have developed semi-empirical or mechanism-based models by modifying the concrete contribution, introducing refined size-effect factors, proposing alternative expressions for the shear contribution of FRP stirrups, or adjusting the functions of shear span-to-depth ratio ().16–20 Although these models can improve predictive accuracy for specific datasets, they are typically calibrated on limited experimental databases and may not fully capture the effects of the effective depth, shear span, concrete strength and FRP reinforcement ratio over a broad range of practical conditions. Significant discrepancies still exist among different standards and methods regarding (i) the treatment of size effect and shear-span effect and (ii) the transition between slender-beam and deep-beam shear mechanisms (e.g., around ). These discrepancies lead to large scatter and, in some cases, either overly conservative or potentially unsafe predictions of the shear capacity of FRP-reinforced concrete beams.
In recent years, with the continuous accumulation of test data, data-driven and intelligent approaches have attracted increasing attention for predicting the shear strength of RC and FRP-reinforced concrete members. Machine-learning techniques and other intelligent algorithms have been employed to mine large experimental databases and to capture the complex, nonlinear relationships between shear capacity and multiple influencing parameters, such as member geometry, material properties and reinforcement details.21–26 These studies have shown that data-driven models can often provide higher predictive accuracy than traditional code provisions; however, most existing models are purely black-box models that do not yield simple, transparent expressions compatible with current design standards, which limits their direct use in engineering practice.22,26 Moreover, many available studies are based on relatively small databases or focus mainly on slender beams without FRP stirrups, and very few works have combined large experimental datasets with intelligent optimization algorithms to systematically evaluate existing code equations, quantify their sensitivity to key parameters and optimize their coefficients or functional forms while preserving the underlying physical meaning of the original equations.21,25 Most existing data-driven approaches for predicting the shear capacity of FRP-reinforced concrete beams decompose the total shear resistance into nominal “concrete” and “FRP reinforcement” contributions and then fit a machine-learning model to the overall dataset. However, this treatment is not fully consistent with beam shear theory, because the concrete and FRP contributions are strongly coupled rather than independent. Frameworks that model only the concrete contribution or only the FRP contribution may not provide a complete mechanistic description of shear transfer; regardless of its apparent statistical accuracy, the learned model is still a purely data-driven, non-physical mapping between the input parameters and the shear capacity and its predictive reliability is difficult to guarantee once the database is expanded or new regions of the parameter space are explored. Conversely, if both the concrete and FRP reinforcement contributions are considered simultaneously but the machine-learning model is calibrated solely on shear test data for beams with FRP stirrups, predictions for members without transverse FRP reinforcement (i.e., beams with only longitudinal FRP bars) are also likely to be biased, because the coupling between the concrete and FRP contributions cannot be cleanly separated from either term. Thus, a key open challenge is to develop a unified computational framework for shear design that is consistently applicable to both beams without FRP stirrups and beams with FRP stirrups.
Therefore, this study aims to address the limited accuracy and inconsistent trends of existing shear strength prediction methods for FRP-reinforced concrete beams within the parameter ranges covered by the available database. An experimental database comprising 631 shear tests, including 499 beams without FRP stirrups and 132 beams with FRP stirrups, is established and the predictions of nine representative design equations for FRP-reinforced concrete beams are systematically benchmarked against this dataset. On this basis, a three-stage particle swarm optimization (PSO) framework is proposed to recalibrate code-type shear equations while preserving their physical transparency: in the first stage, the concrete shear contribution is identified and optimized using test results for beams with shear span-to-depth ratios ; in the second stage, the concrete contribution for beams with is further adjusted to explicitly capture size effect; and in the third stage, the FRP reinforcement contribution and its coupling with the concrete contribution are calibrated, leading to a unified shear strength model applicable to both beams without and with FRP stirrups within the calibration envelope. The predictive performance of the proposed model is assessed using the assembled database and preliminarily examined through independent shear tests on BFRP-reinforced beams with varying shear span-to-depth ratios, concrete strength classes and stirrup ratios.
Existing models: Formulations, database, predictive accuracy and parameter sensitivity
Analysis of shear design formulations in existing models
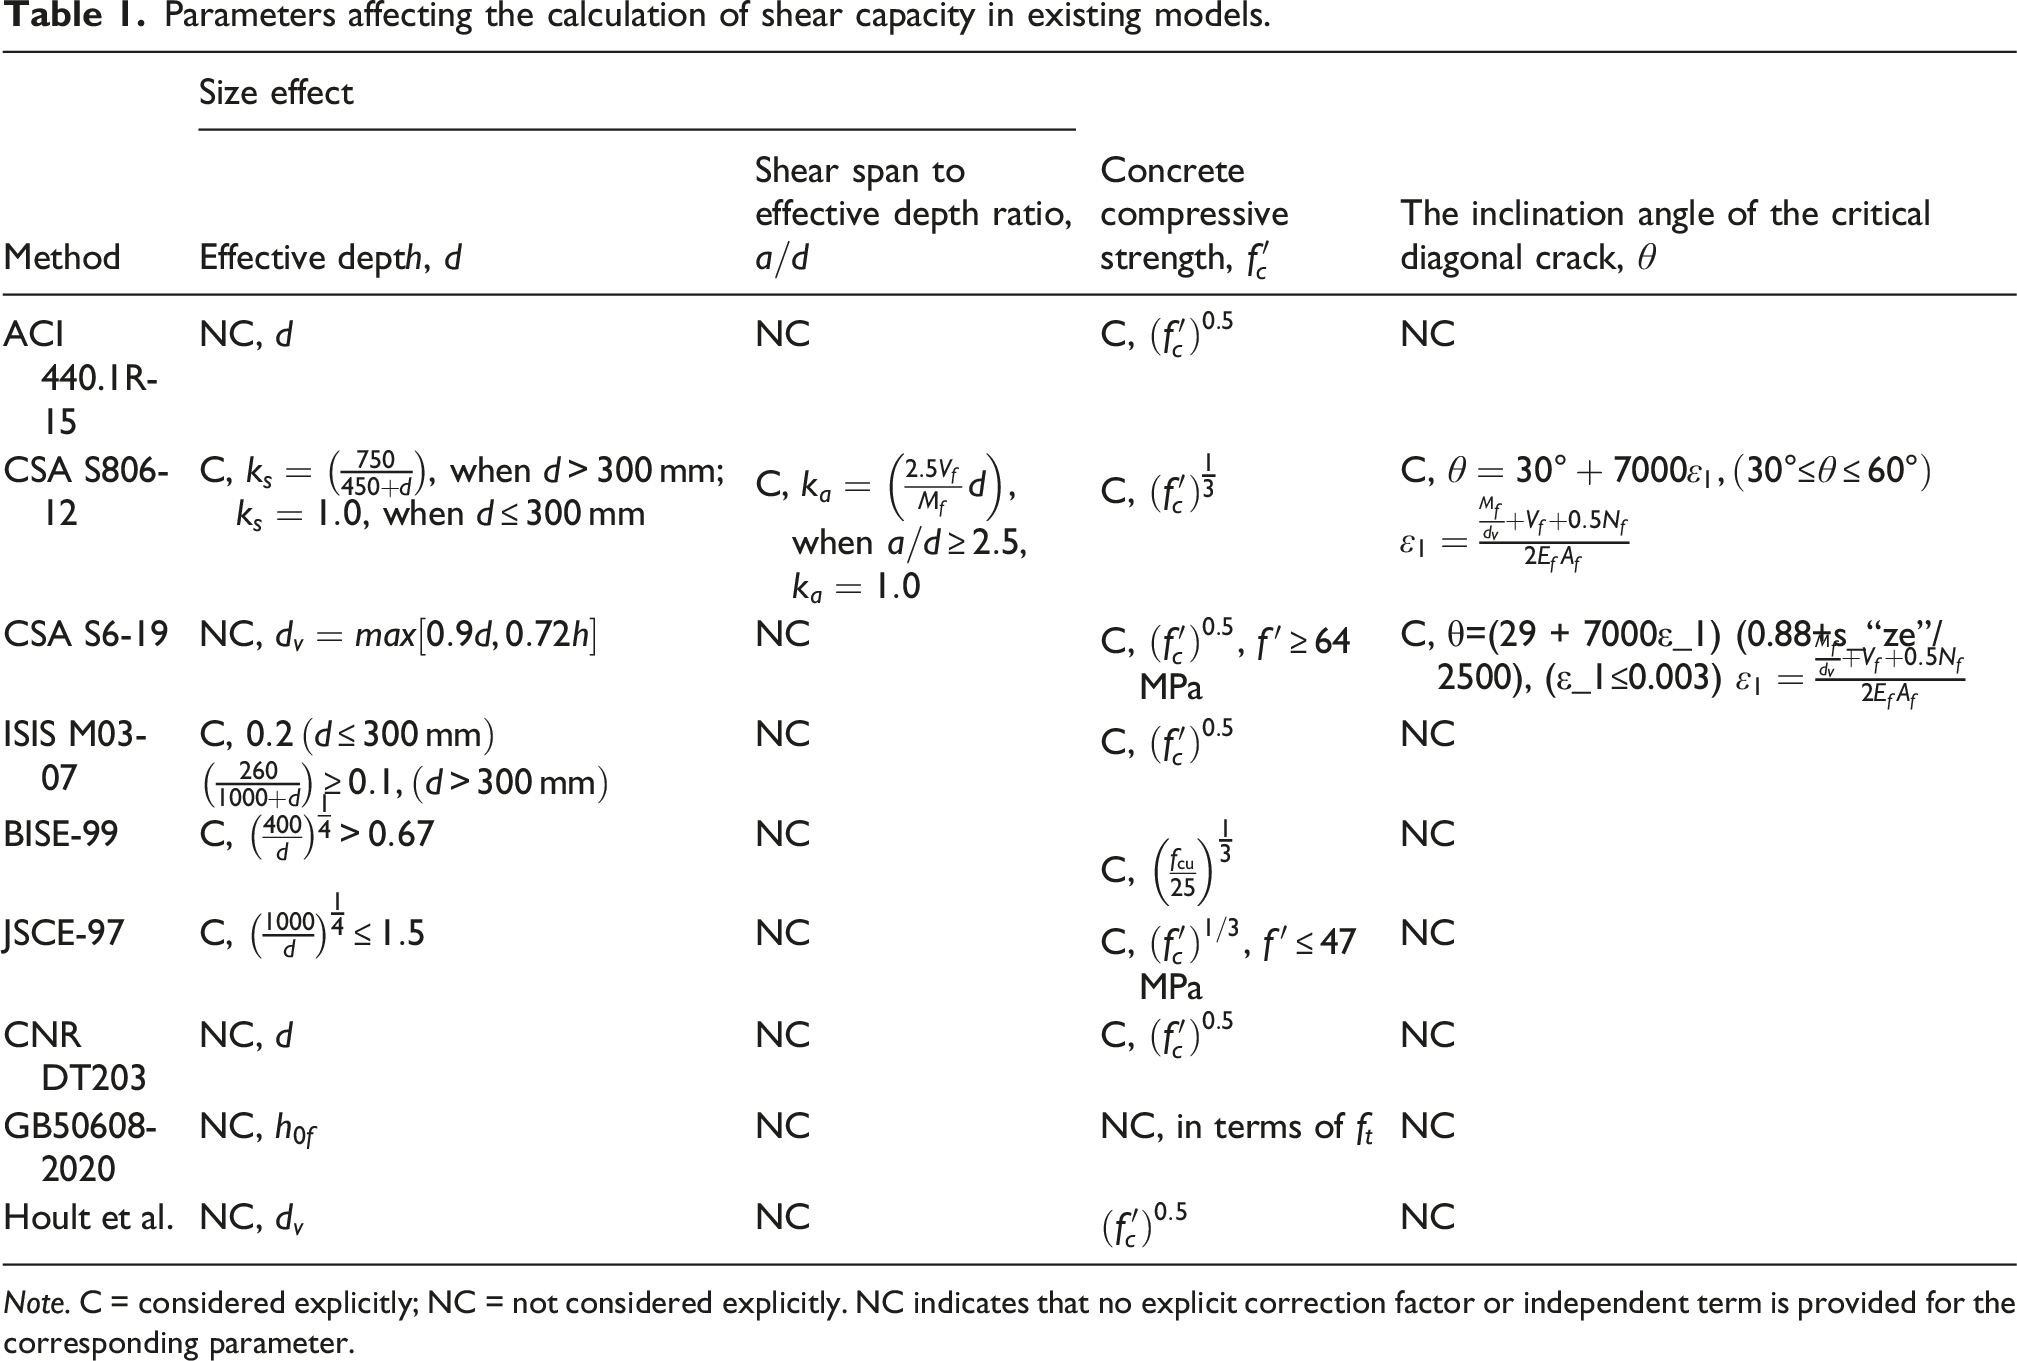
In this section, the shear design provisions and analytical models for FRP-reinforced concrete beams adopted in current codes and guidelines are examined. Nine representative shear design methods are considered, namely ACI 440.1R-15, CSA S806-12, CSA S6-19, JSCE-97, BISE-99, ISIS M03-07, CNR-DT-203, GB 50608-2020 and the model proposed by Hoult et al. The key parameters involved in these formulations and the way they are treated are summarized in Table 1. In particular, the effective depth , shear span-to-depth ratio , cylinder compressive strength , FRP stirrup ratio and the inclination of the diagonal compressive strut are identified as the main variables influencing the calculated shear capacity.
Parameters affecting the calculation of shear capacity in existing models.
Method
Size effect
Concrete compressive strength,
The inclination angle of the critical diagonal crack,
Note. C = considered explicitly; NC = not considered explicitly. NC indicates that no explicit correction factor or independent term is provided for the corresponding parameter.
The d and govern the size effect and the transition between beam and arch action. Most of the examined standards do not contain an explicit size-effect term in the concrete shear contribution. CSA S806-12 and ISIS M03-07 distinguish between members with small and large effective depths by providing different expressions for these ranges, whereas BISE-99 and JSCE-97 account for size effect implicitly through an exponent of in the concrete shear term. With regard to concrete strength, most codes adopt the cylinder compressive strength in the shear equations, whereas BISE-99 and GB 50608-2020 use the cube compressive strength and the tensile strength, respectively. For the FRP stirrup contribution, the examined standards and models typically follow a truss-model-type expression, but differ in their assumptions regarding the effective strain of FRP stirrups, the upper limits on stirrup strength utilization and the coupling between the concrete and FRP contributions. These differences in mechanical assumptions and parameter treatment are the main source of the discrepancies observed among the shear capacity predictions of the various standards and models.
Significant discrepancies therefore exist among the shear capacity calculation methods for slender FRP-reinforced concrete beams in different standards and codes, owing to the distinct mechanical models adopted and the different treatments of the above parameters. To develop a more rational shear strength calculation method, the validity and parameter sensitivity of these standards and models are evaluated in Section 2.3.
Characteristics of the database
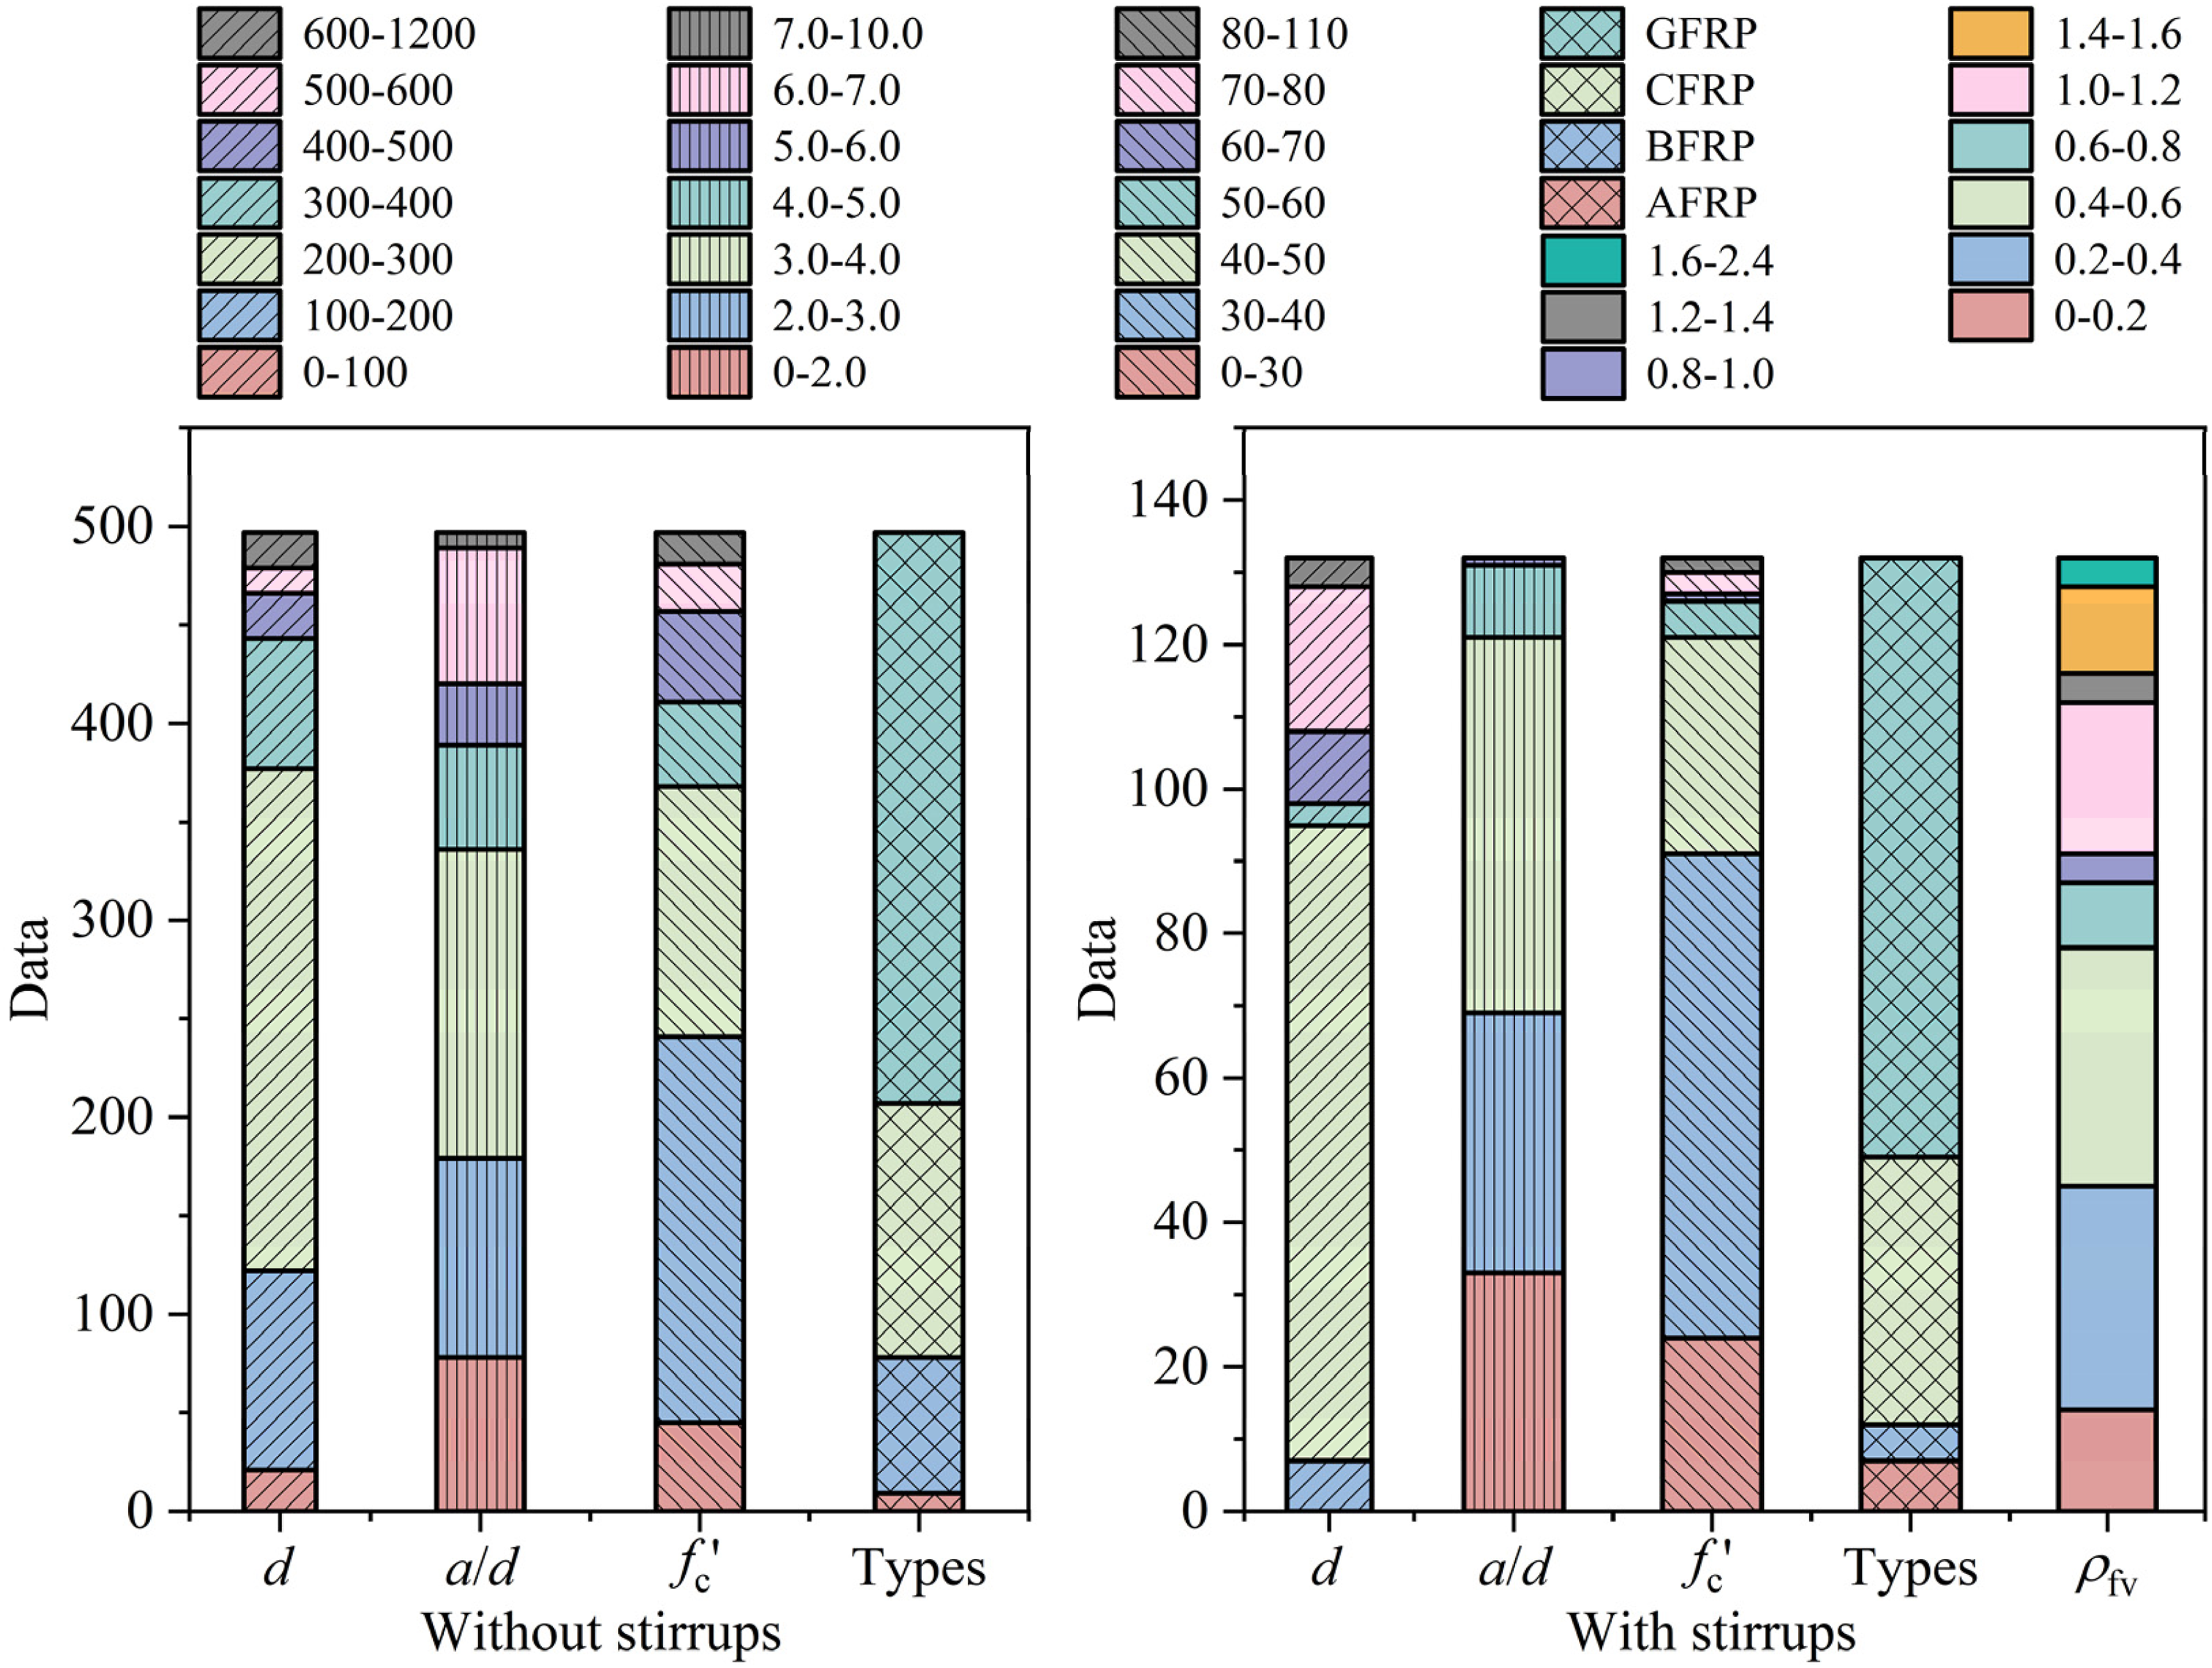
A comprehensive database of shear resistance test results for concrete beams reinforced with FRP bars is compiled from the literature. In total, 631 tests are collected, comprising 499 beams without stirrups and 132 beams with FRP stirrups. Several key beam parameters are included to characterize the database, namely the effective depth , shear span-to-depth ratio , cylinder compressive strength , FRP bar type and, for beams with stirrups, the FRP stirrup ratio . The distributions of these parameters for beams with and without stirrups are illustrated in Figure 1.
Data statistics of beams with and without FRP stirrups.
For beams without stirrups, the is mainly distributed within the 0–1200 mm interval, with most specimens falling within 100–400 mm (84.91%) and, in particular, 200–300 mm (51.31%), while for beams with stirrups, is distributed within the 0–1000 mm interval and the interval 200–300 mm contains 66.67% of the specimens. In both groups, is distributed within the 0–10.0 interval; for beams without stirrups, most values lie between 0 and 4.0, with 3.0–4.0 being the most frequent interval (31.59%), whereas for beams with stirrups most values lie between 0 and 8.0, with 3.0–4.0 again the most frequent interval (39.39%). Similarly, the is distributed within the 0–110 MPa interval in both groups; for beams without stirrups, 30–50 MPa accounts for 31.59% of the database, whereas for beams with stirrups the same range accounts for 64.99% of all beams. Four primary types of FRP bars are used in beams without stirrups, namely AFRP, BFRP, CFRP and GFRP, with CFRP bars predominating (58.35%). For beams with stirrups, five types are present, namely AFRP, BFRP, CFRP, GFRP and hybrid GFRP/CFRP bars, and CFRP bars again predominate (58.33%). In addition, for beams with stirrups the ranges from 0 to 2.4%, with most values between 0 and 0.6%, representing 59.09% of the database.
Assessment of shear capacity results from various standards and methods
The database described in Section 2.2 is used to evaluate the accuracy and dispersion of the shear strength predictions obtained from the nine standards and models summarized in Section 2.1. For each beam, the design expressions are used to compute the nominal shear capacity , which is then compared with the measured capacity . The results are presented in Figure S1 of Appendix A. In each case, the subfigure on the left plots versus with on the horizontal axis and on the vertical axis, together with a best-fit regression line and the reference line of slope 1.0. The subfigure on the right shows the test-to-prediction ratio as a function of specimen index, together with the mean value and the reference line , providing a basis for quantifying the bias and dispersion of each method.
For ACI 440.1R-15, the mean test-to-prediction ratio is 2.53 and the slope of the fitted line is 2.30, which is greater than that of the reference line. This indicates that the method generally underestimates the measured shear capacities and is therefore conservative. The data also exhibit a high degree of scatter, which may be attributed, at least in part, to the absence of an explicit size-effect term in ACI 440.1R-15 (see Table 1). The range of is relatively large, extending approximately from 1.0 to 9.0, as shown in Figure S1. A comparable trend is observed for the BISE-99 code, for which the is 0.81 and the slope of the fitted line is 0.77, which is lower than that of the reference line. This indicates that the calculated values are generally non-conservative compared with the measured values, although the range of (about 0 to 4.0) is narrower than that for ACI 440.1R-15. The results obtained using the CNR DT 203 code are similar to those of ACI 440.1R-15, but with somewhat improved accuracy.
The predictions from CSA S6-19 and CSA S806-12, both based on the modified compression field theory (MCFT), exhibit relatively low scatter. In particular, CSA S806-12 provides the most accurate results among all standards and methods considered for the present database. The data points in the plots cluster around the reference line and the corresponding values are concentrated near 1.0. The ISIS M03-07 and JSCE-97 provisions show similar behavior to each other. In contrast, GB 50608-2020 is the most conservative among all codes, with a of 4.42 and a fitted-line slope of 3.96. Since the MCFT model is also adopted by Hoult et al., their calculated results are comparable to those of CSA S806-12.
Parameter analysis
A parametric analysis is carried out to examine how the varies with four key parameters, namely the effective depth , the shear-span ratio , the cylinder compressive strength and the stirrup reinforcement ratio , over different parameter ranges.
Effective depth d
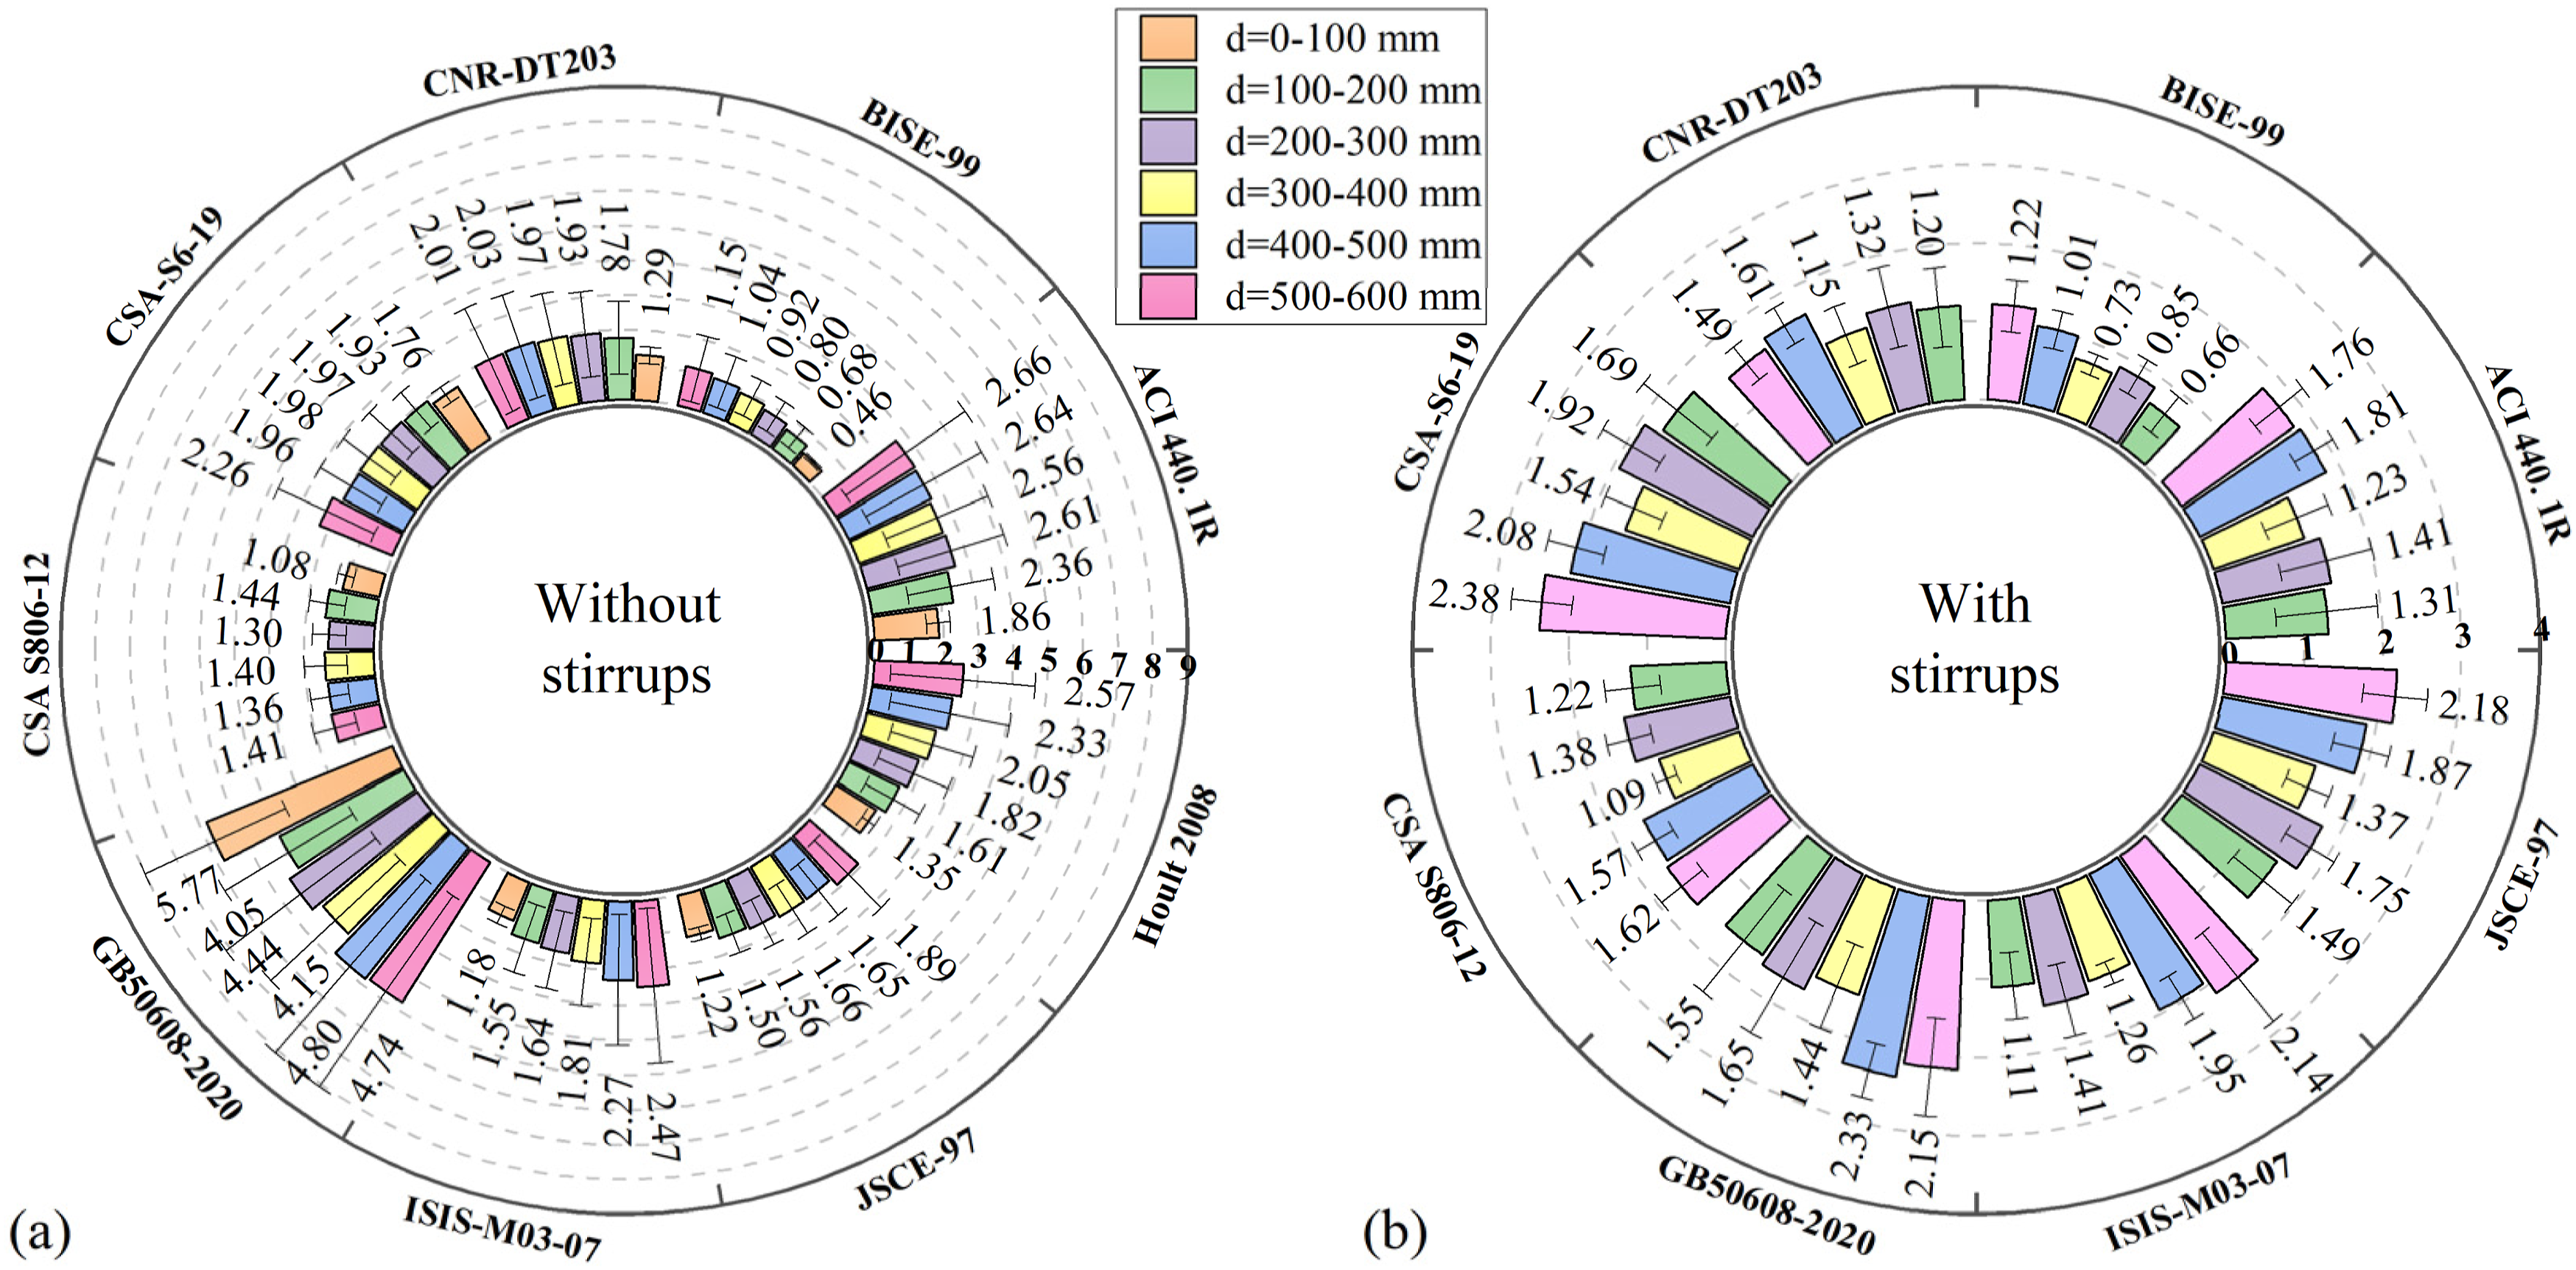
The results of the parametric analysis on the influence of on the predicted shear capacity for different standards and methods are shown in Figure 2. For beams without stirrups, ACI 440.1R-15, BISE-99, CNR DT 203, Hoult et al., ISIS M03-07 and JSCE-97 exhibit a pronounced dependence of the calculated shear capacity on the effective depth. As discussed in Section 2.1, no explicit size-effect factor related to the effective depth is included in ACI 440.1R-15, CNR DT 203, GB 50608-2020 and the model proposed by Hoult et al. (2008), which partly explains the strong sensitivity observed for several of these formulations. In contrast, the use of the MCFT model and explicit consideration of crack inclination in CSA S806-12 and CSA S6-19 substantially weaken the size effect, so that the influence of the effective depth on the results is relatively minor. Although BISE-99, ISIS M03-07 and JSCE-97 include the effective depth in their formulations, a strong size effect is still observed, indicating that further improvement of these calculation methods is required. For GB 50608-2020, the dependence of the results on the effective depth is small; however, the corresponding values generally exceed 4.0, indicating large deviations between calculated and experimental shear capacities. In this case, the effect of the effective depth becomes negligible compared with the overall bias and refinement of the GB 50608-2020 formulation is therefore also necessary. For beams with stirrups, the transverse reinforcement provides an additional shear-resisting mechanism, so that the sensitivity of the predicted capacity to the effective depth is less pronounced than that for beams without stirrups. Overall, the calculation methods specified in CSA S806-12 and CSA S6-19 effectively mitigate the influence of the effective depth on the size effect and their predictions are relatively close to the experimental values. The formulations adopted in these standards therefore provide a suitable basis for subsequent optimization of shear resistance calculations for FRP-reinforced concrete beams.
The effects of the effective depth () on the calculation results of the various standards and methods: (a) without stirrups; (b) with stirrups.
Shear span ratio ()
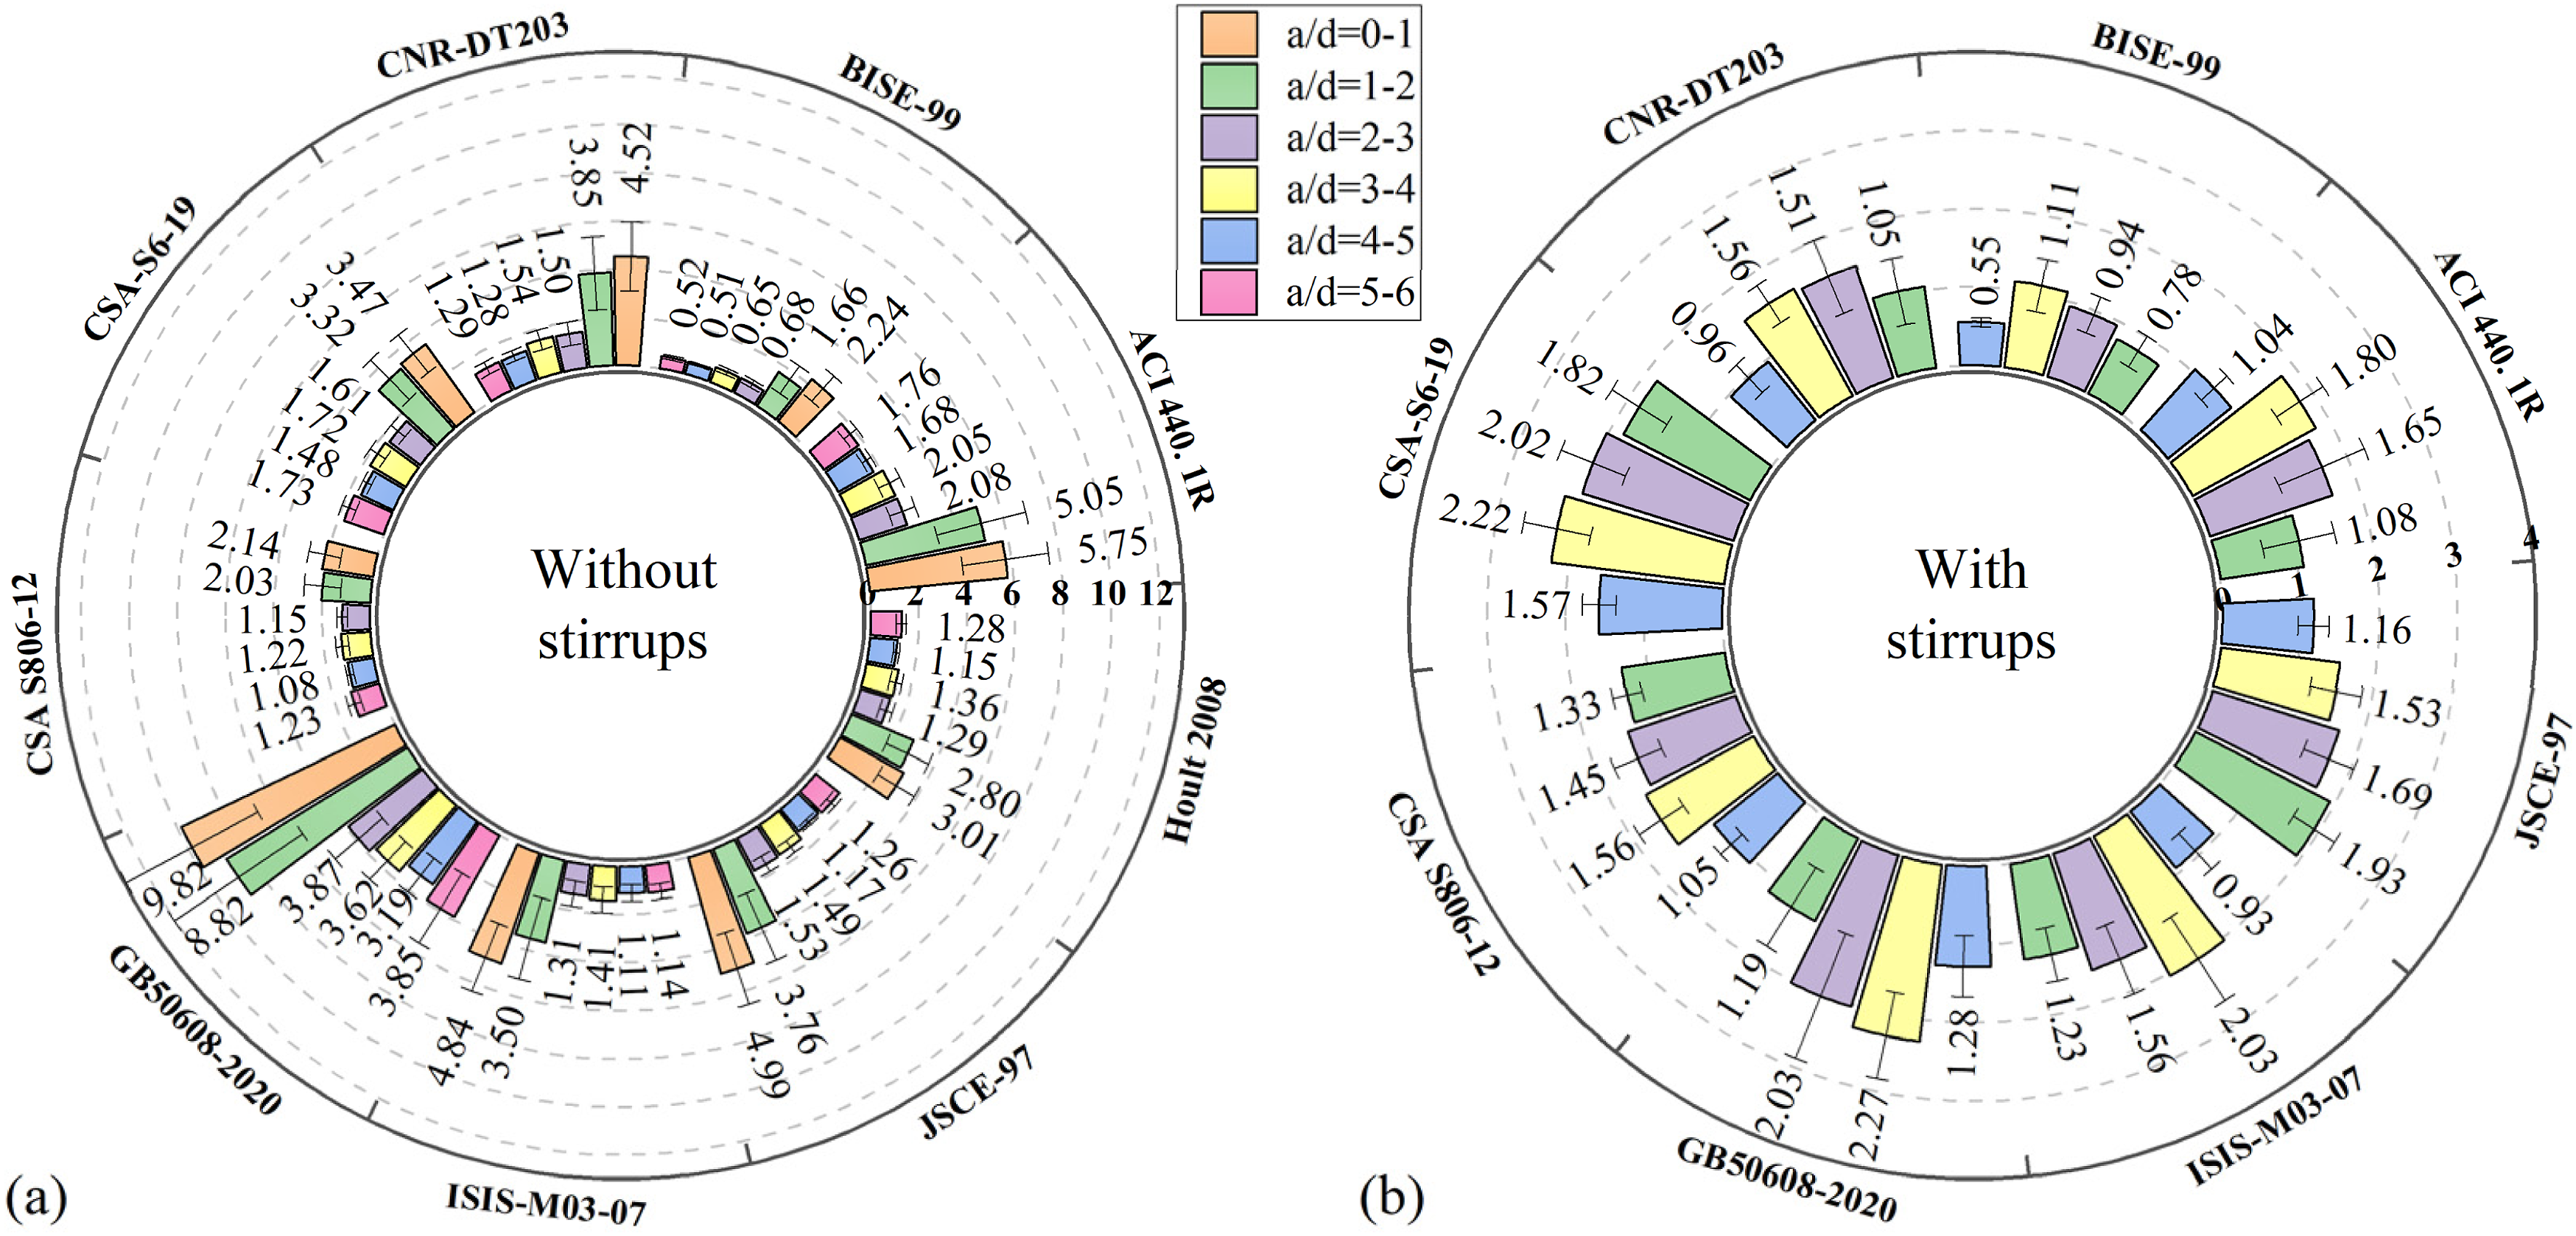
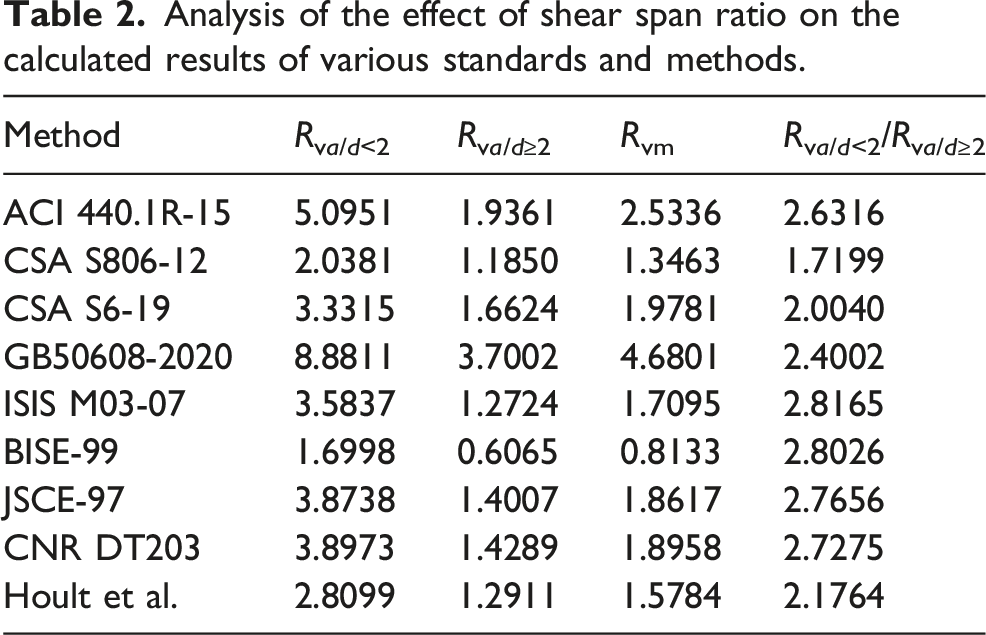
Because of the pronounced size effect at small shear-span ratios, there is a significant deviation between the calculated and experimental shear capacities of beams without stirrups when the shear-span ratio is below about 2.0. By contrast, when exceeds 2, the calculated results remain relatively stable and show no obvious systematic variation (Figure 3). To quantify how different calculation methods capture the influence of a/d and the associated size effect, the ratio between the for and for is used, as summarized in Table 2. For beams without stirrups, when the shear-span ratio is greater than 2, the obtained from most methods lie between 1 and 2 and are significantly smaller than those for , except for GB 50608-2020, which is overly conservative, and BISE-99, which is markedly non-conservative. CSA S806-12 provides the closest estimates to the experimental values. The comparatively small values obtained from CSA S806-12, CSA S6-19 and the model of Hoult et al. suggest that these MCFT-based approaches are less sensitive to the size effect, which can be attributed mainly to their basis in the MCFT model. For beams with stirrups, only a weak dependence on the shear-span ratio is observed, suggesting that the presence of stirrups reduces the dependence of the test-to-prediction ratios on the shear-span ratio and thereby improves the apparent stability of the predictions from different standards and methods.
The effects of shear span ratio () on the calculation results of the various standards and methods: (a) without stirrups; (b) with stirrups.
Analysis of the effect of shear span ratio on the calculated results of various standards and methods.
Method
Rva/d<2
Rva/d≥2
Rvm
Rva/d<2/Rva/d≥2
ACI 440.1R-15
5.0951
1.9361
2.5336
2.6316
CSA S806-12
2.0381
1.1850
1.3463
1.7199
CSA S6-19
3.3315
1.6624
1.9781
2.0040
GB50608-2020
8.8811
3.7002
4.6801
2.4002
ISIS M03-07
3.5837
1.2724
1.7095
2.8165
BISE-99
1.6998
0.6065
0.8133
2.8026
JSCE-97
3.8738
1.4007
1.8617
2.7656
CNR DT203
3.8973
1.4289
1.8958
2.7275
Hoult et al.
2.8099
1.2911
1.5784
2.1764
Cylinder compressive strength fc'
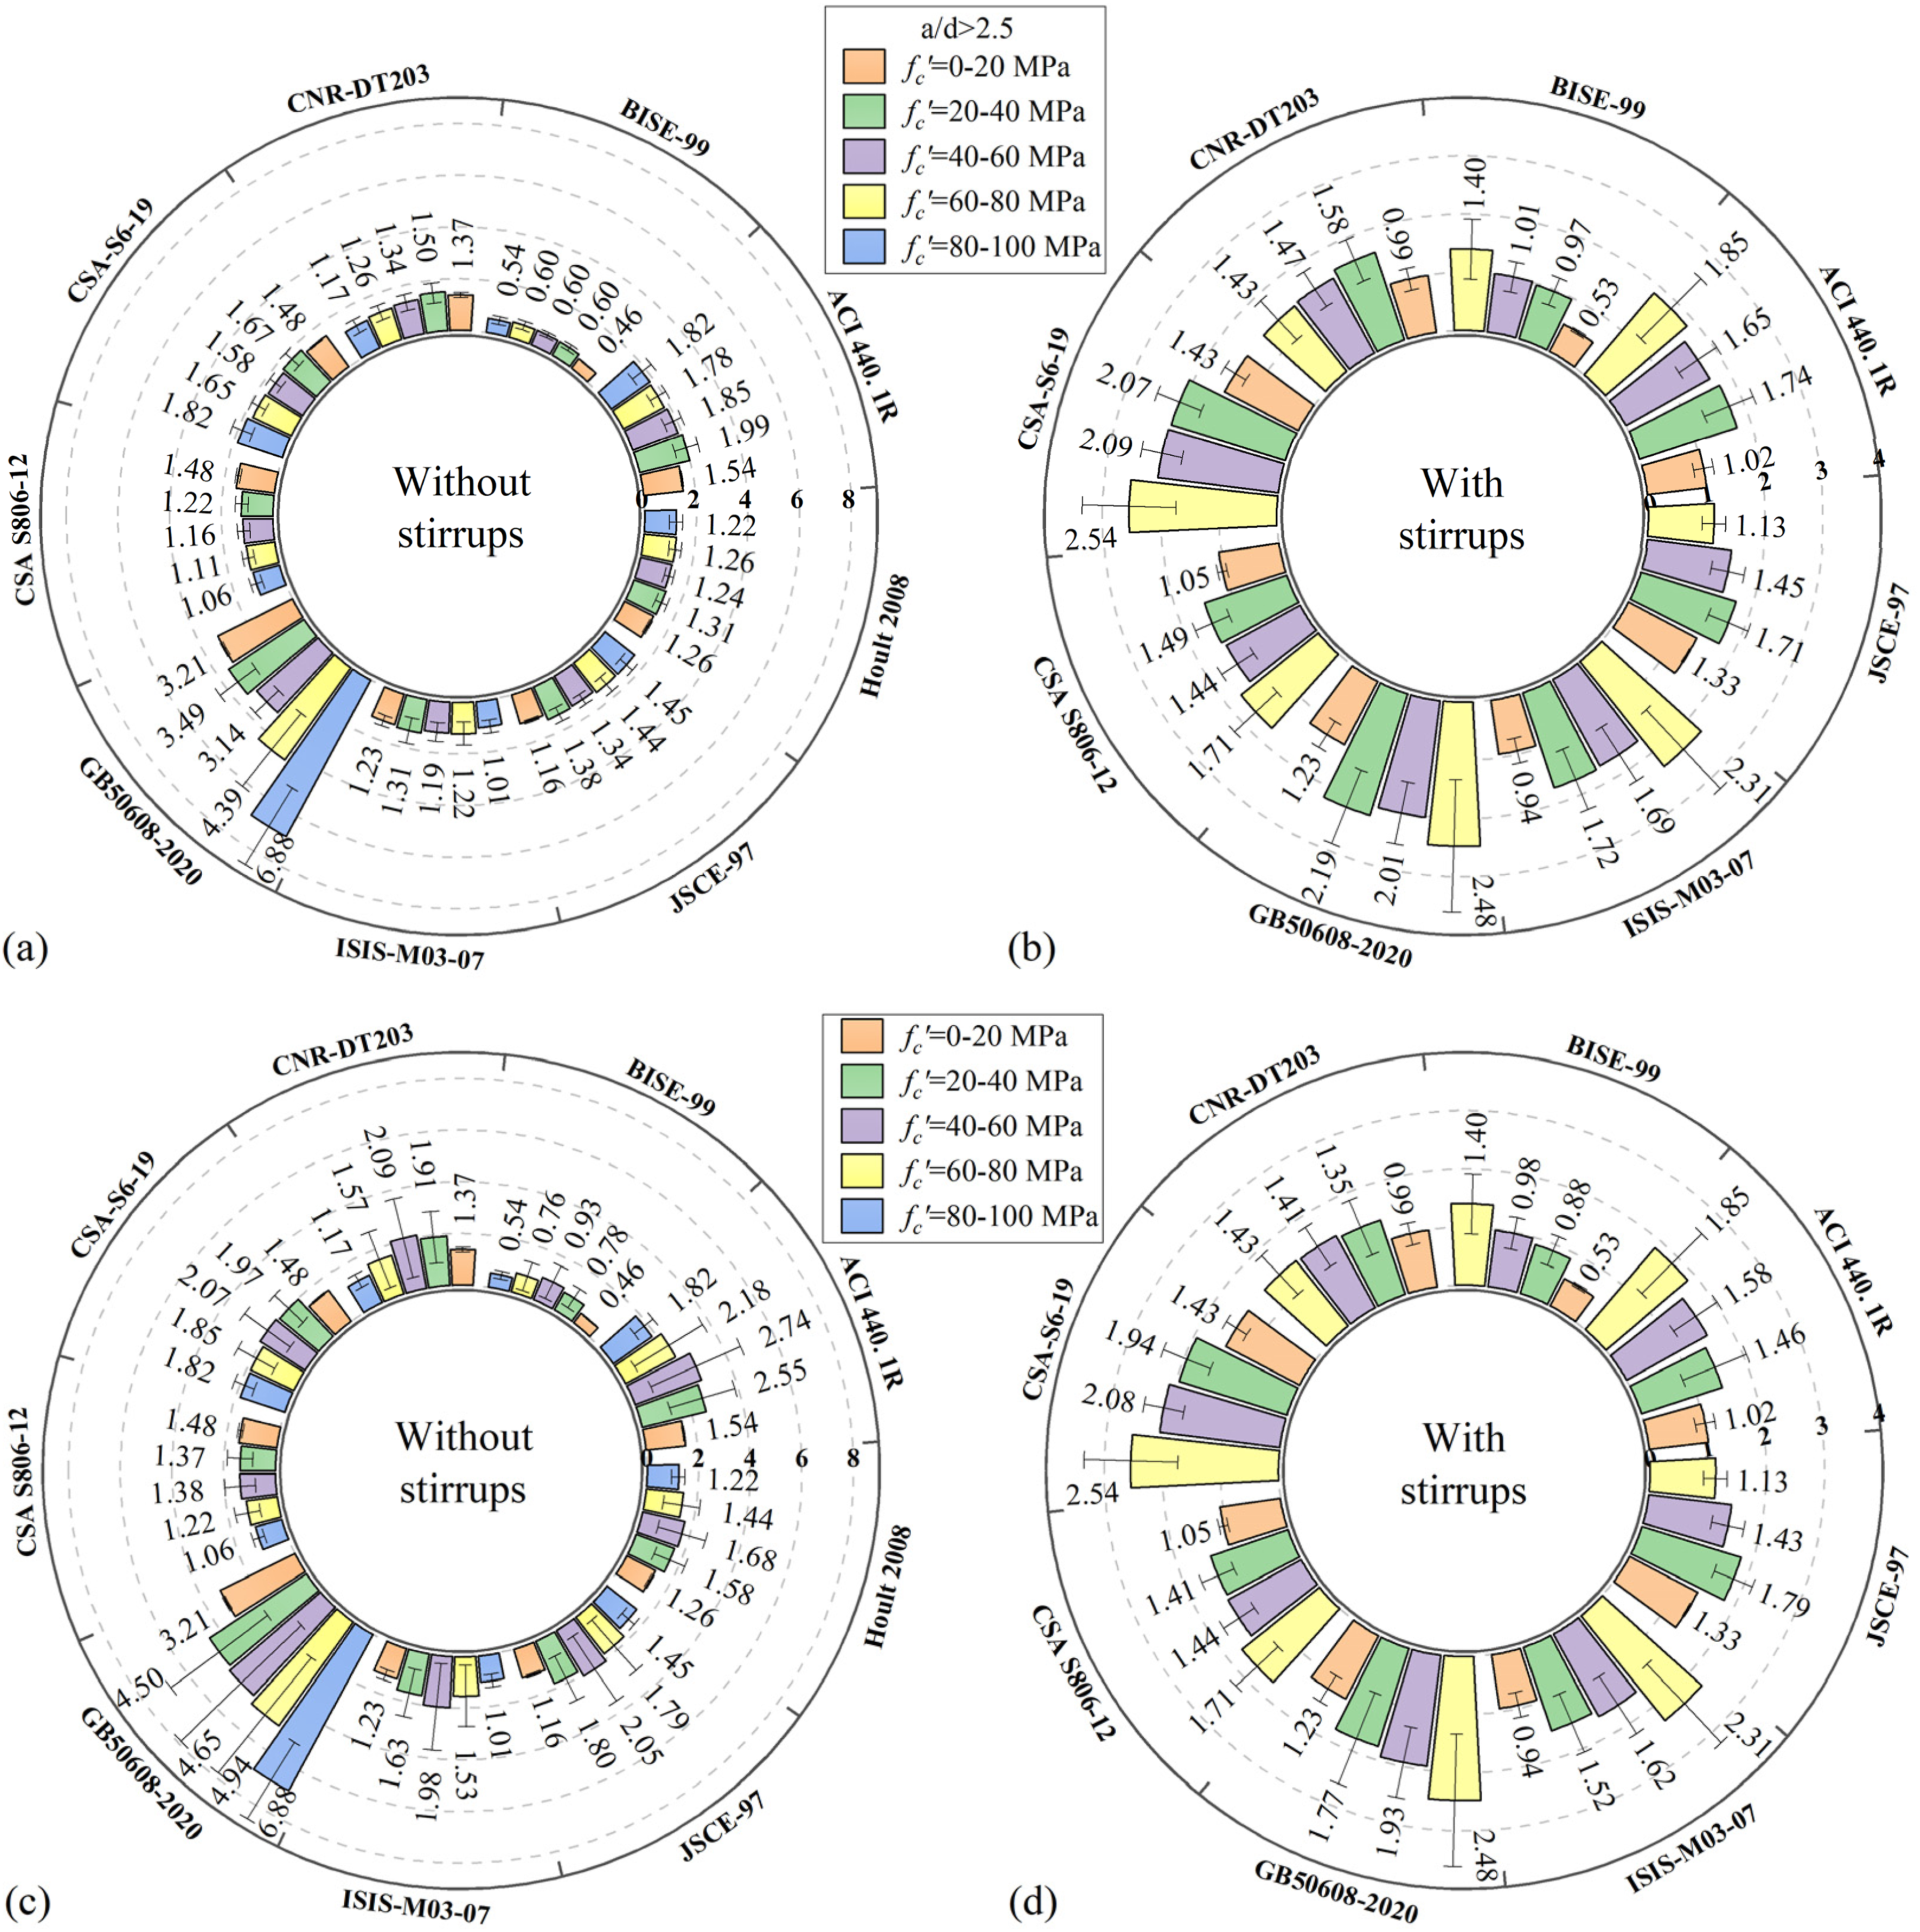
To minimize the influence of the shear-span ratio , two cases were considered: unrestricted and . The variation of with the cylinder compressive strength is illustrated in Figure 4. When all a/d values are included, most standards predict that, for beams without stirrups, Rvm first increases and then decreases with increasing , with the maximum values concentrated in the range 30–50 MPa. In contrast, the CSA S806-12 standard shows a slight decreasing trend. For the subset with , similar trends are observed: for beams without stirrups, the increasing trend becomes less pronounced, indicating a weaker influence of on ; for beams with stirrups, the trend remains unchanged or even becomes more marked, which is consistent with the mitigating effect of stirrups on the size effect. Most standards exhibit a clear increase in the calculated shear capacity of beams with stirrups as increases. The JSCE-97 provision is an exception, showing an increase followed by a decrease in the calculated shear capacity with increasing , with the maximum values occurring for of approximately 20–40 MPa. In summary, when , the effect of on the calculated results for beams without stirrups is relatively small. The influence of has been reasonably incorporated in most standards and methods and improving accuracy mainly requires adjusting certain coefficients, such as the exponent of . However, for beams with stirrups, the distribution range of has a significant impact on the calculated results. As increases, the rising indicates an increasing tendency towards conservatism. This may be because the calculated shear capacity is reduced in the codes to account for brittle failure at higher concrete strengths, while the confinement provided by stirrups simultaneously enhances the shear capacity of high-strength concrete. Therefore, the treatment of in the shear design of beams with stirrups needs to be re-evaluated.
The effects of cylinder compressive strength () on the calculation results of the various standards and methods: (a) without stirrups (); (b) with stirrups (); (c) without stirrups (all considered ); (d) with stirrups (all considered ).
Stirrup reinforcement ratio ρfv
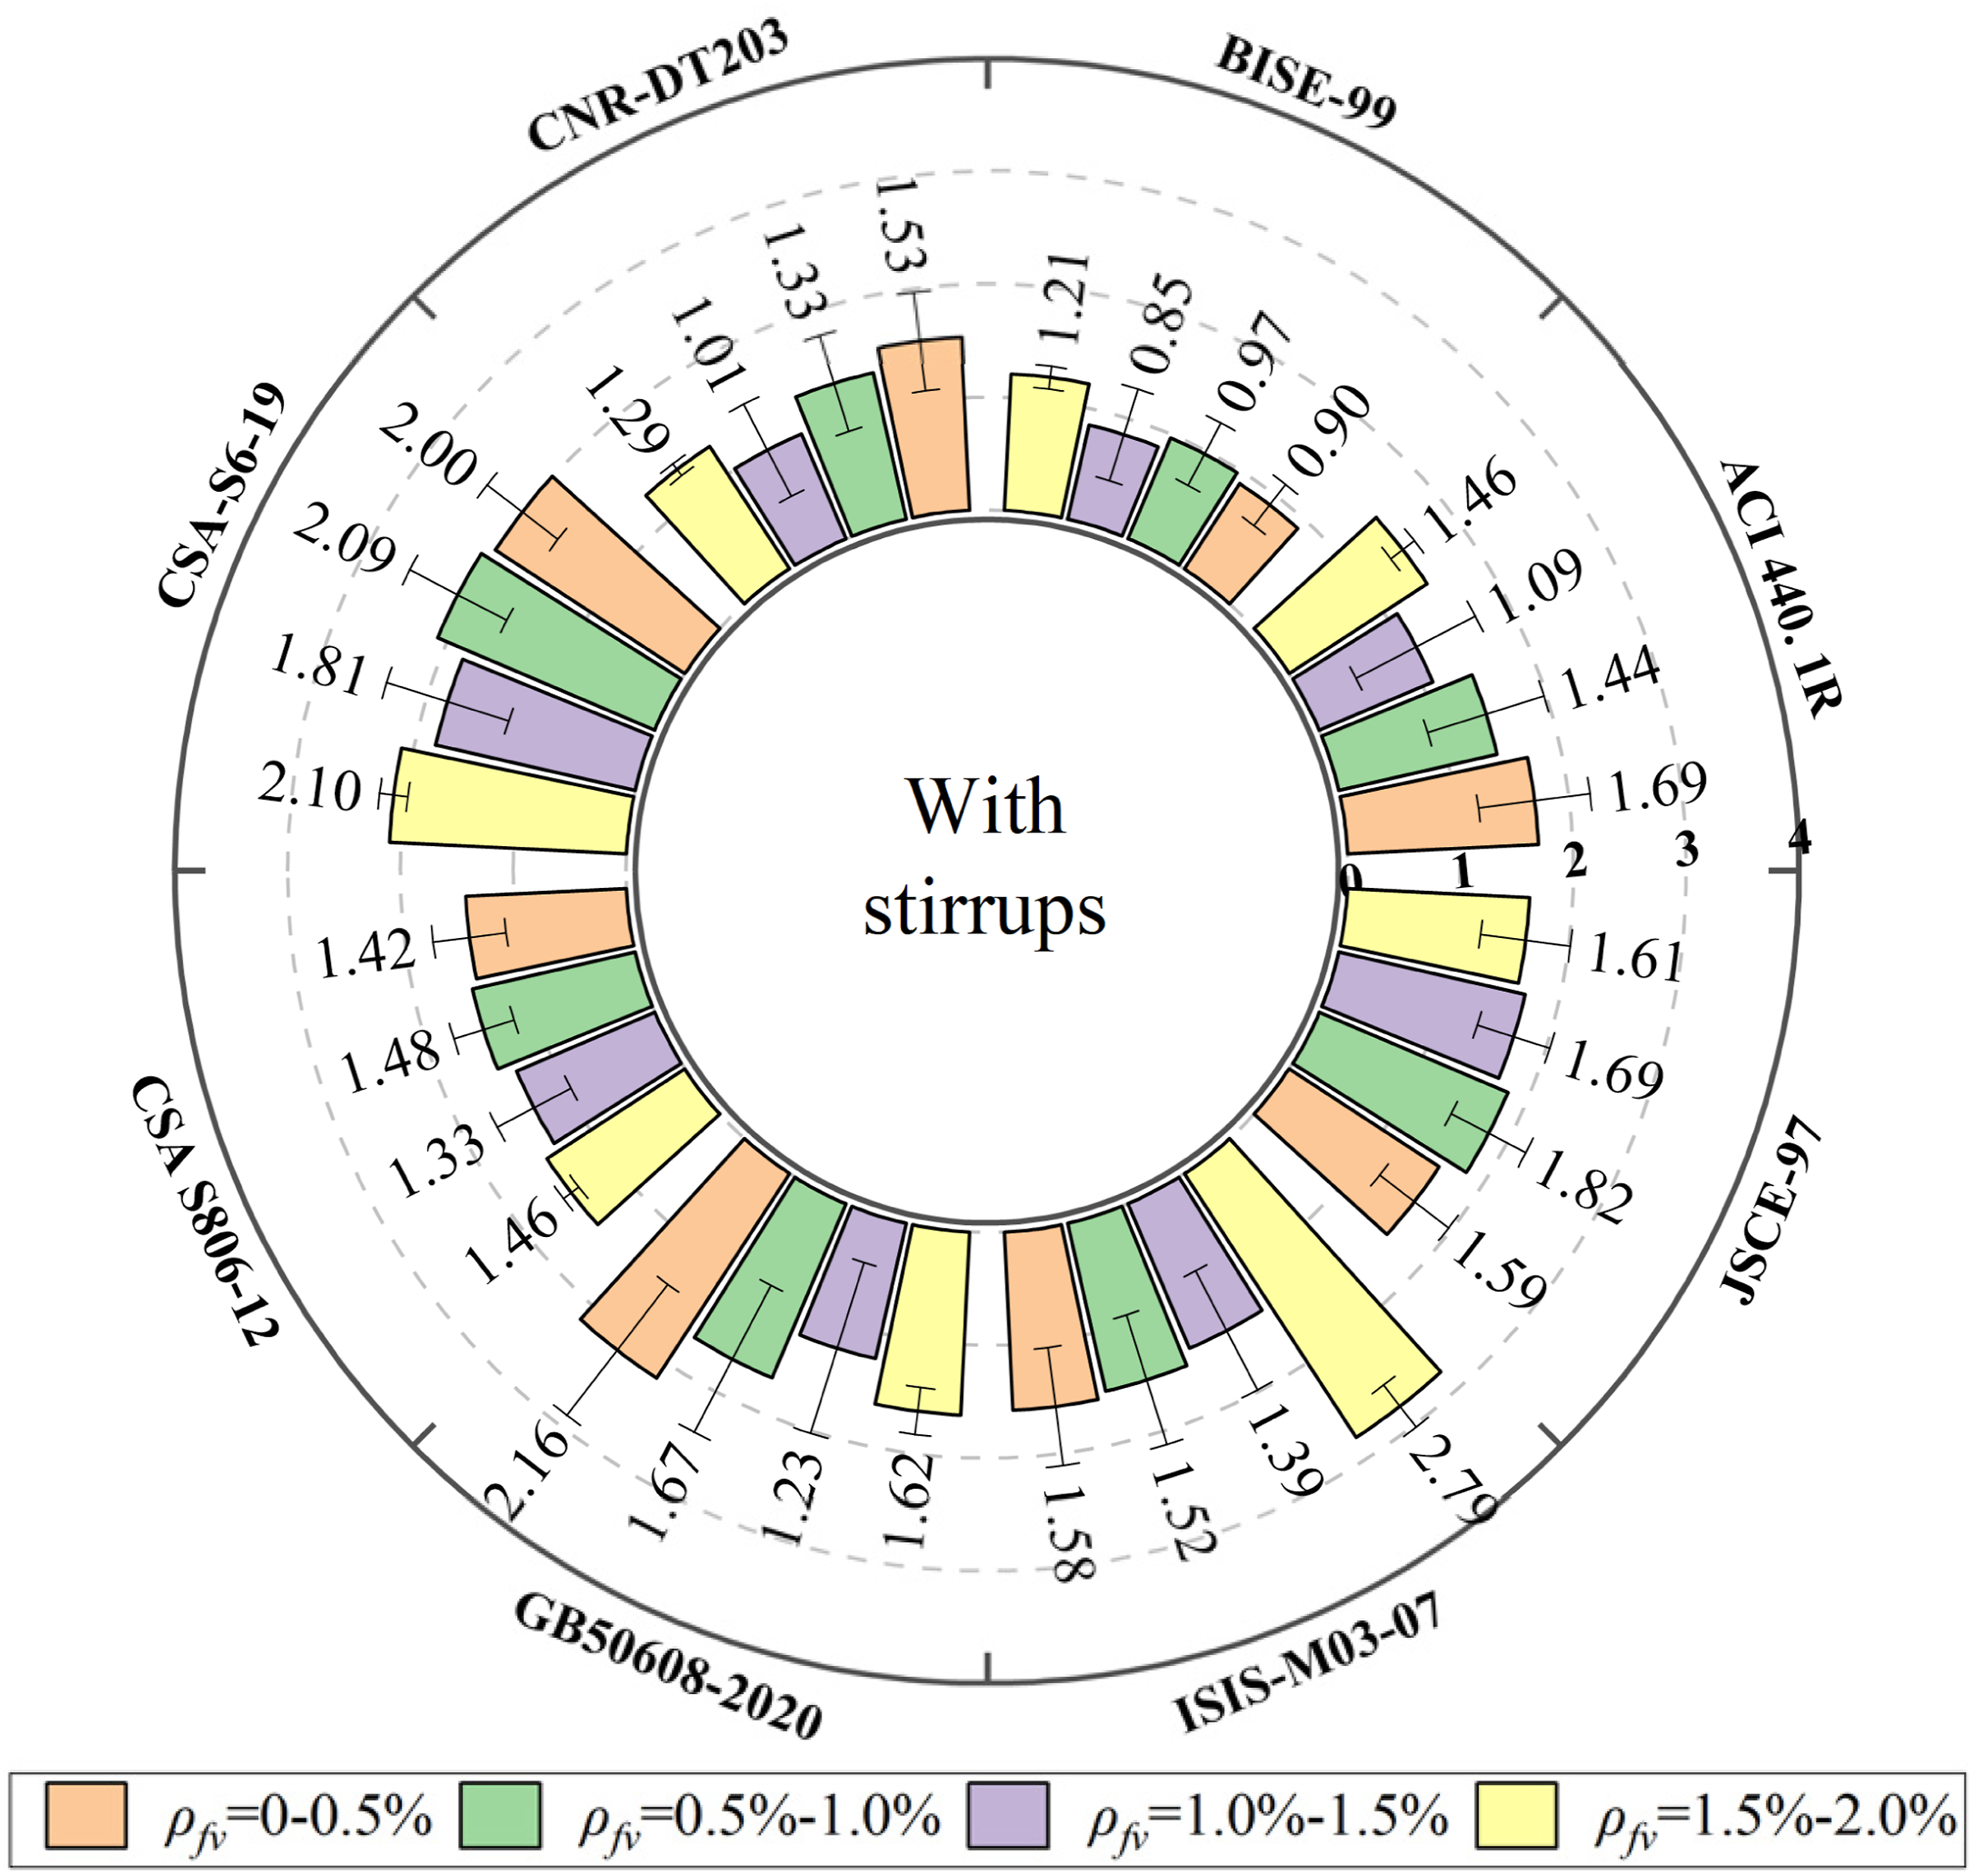
The predicted shear capacity for beams with different stirrup reinforcement ratios varies considerably among the considered standards and methods (Figure 5). For ACI 440.1R-15, first decreases and then increases as increases; the minimum of 1.09 occurs for between 1.0% and 1.5%. Similar trends are observed for BISE-99, CNR DT 203, GB 50608-2020 and ISIS M03-07, with the last of these exhibiting pronounced conservatism and large deviations from the experimental results when is between 1.5% and 2.0%. In contrast, the shear capacity predictions of CSA S6-19, CSA S806-12, the model of Hoult et al. and JSCE-97 show relatively weak sensitivity to , because the actual stirrup strain is explicitly taken into account. Among all methods, CSA S806-12 yields the lowest coefficient of variation for beams with FRP stirrups, equal to 0.05, indicating that this standard provides the most stable predictions for the present database.
The effects of stirrup reinforcement ratio () on the calculation results of the various standards and methods.
Optimization of shear calculation methods
Selection of optimization parameters
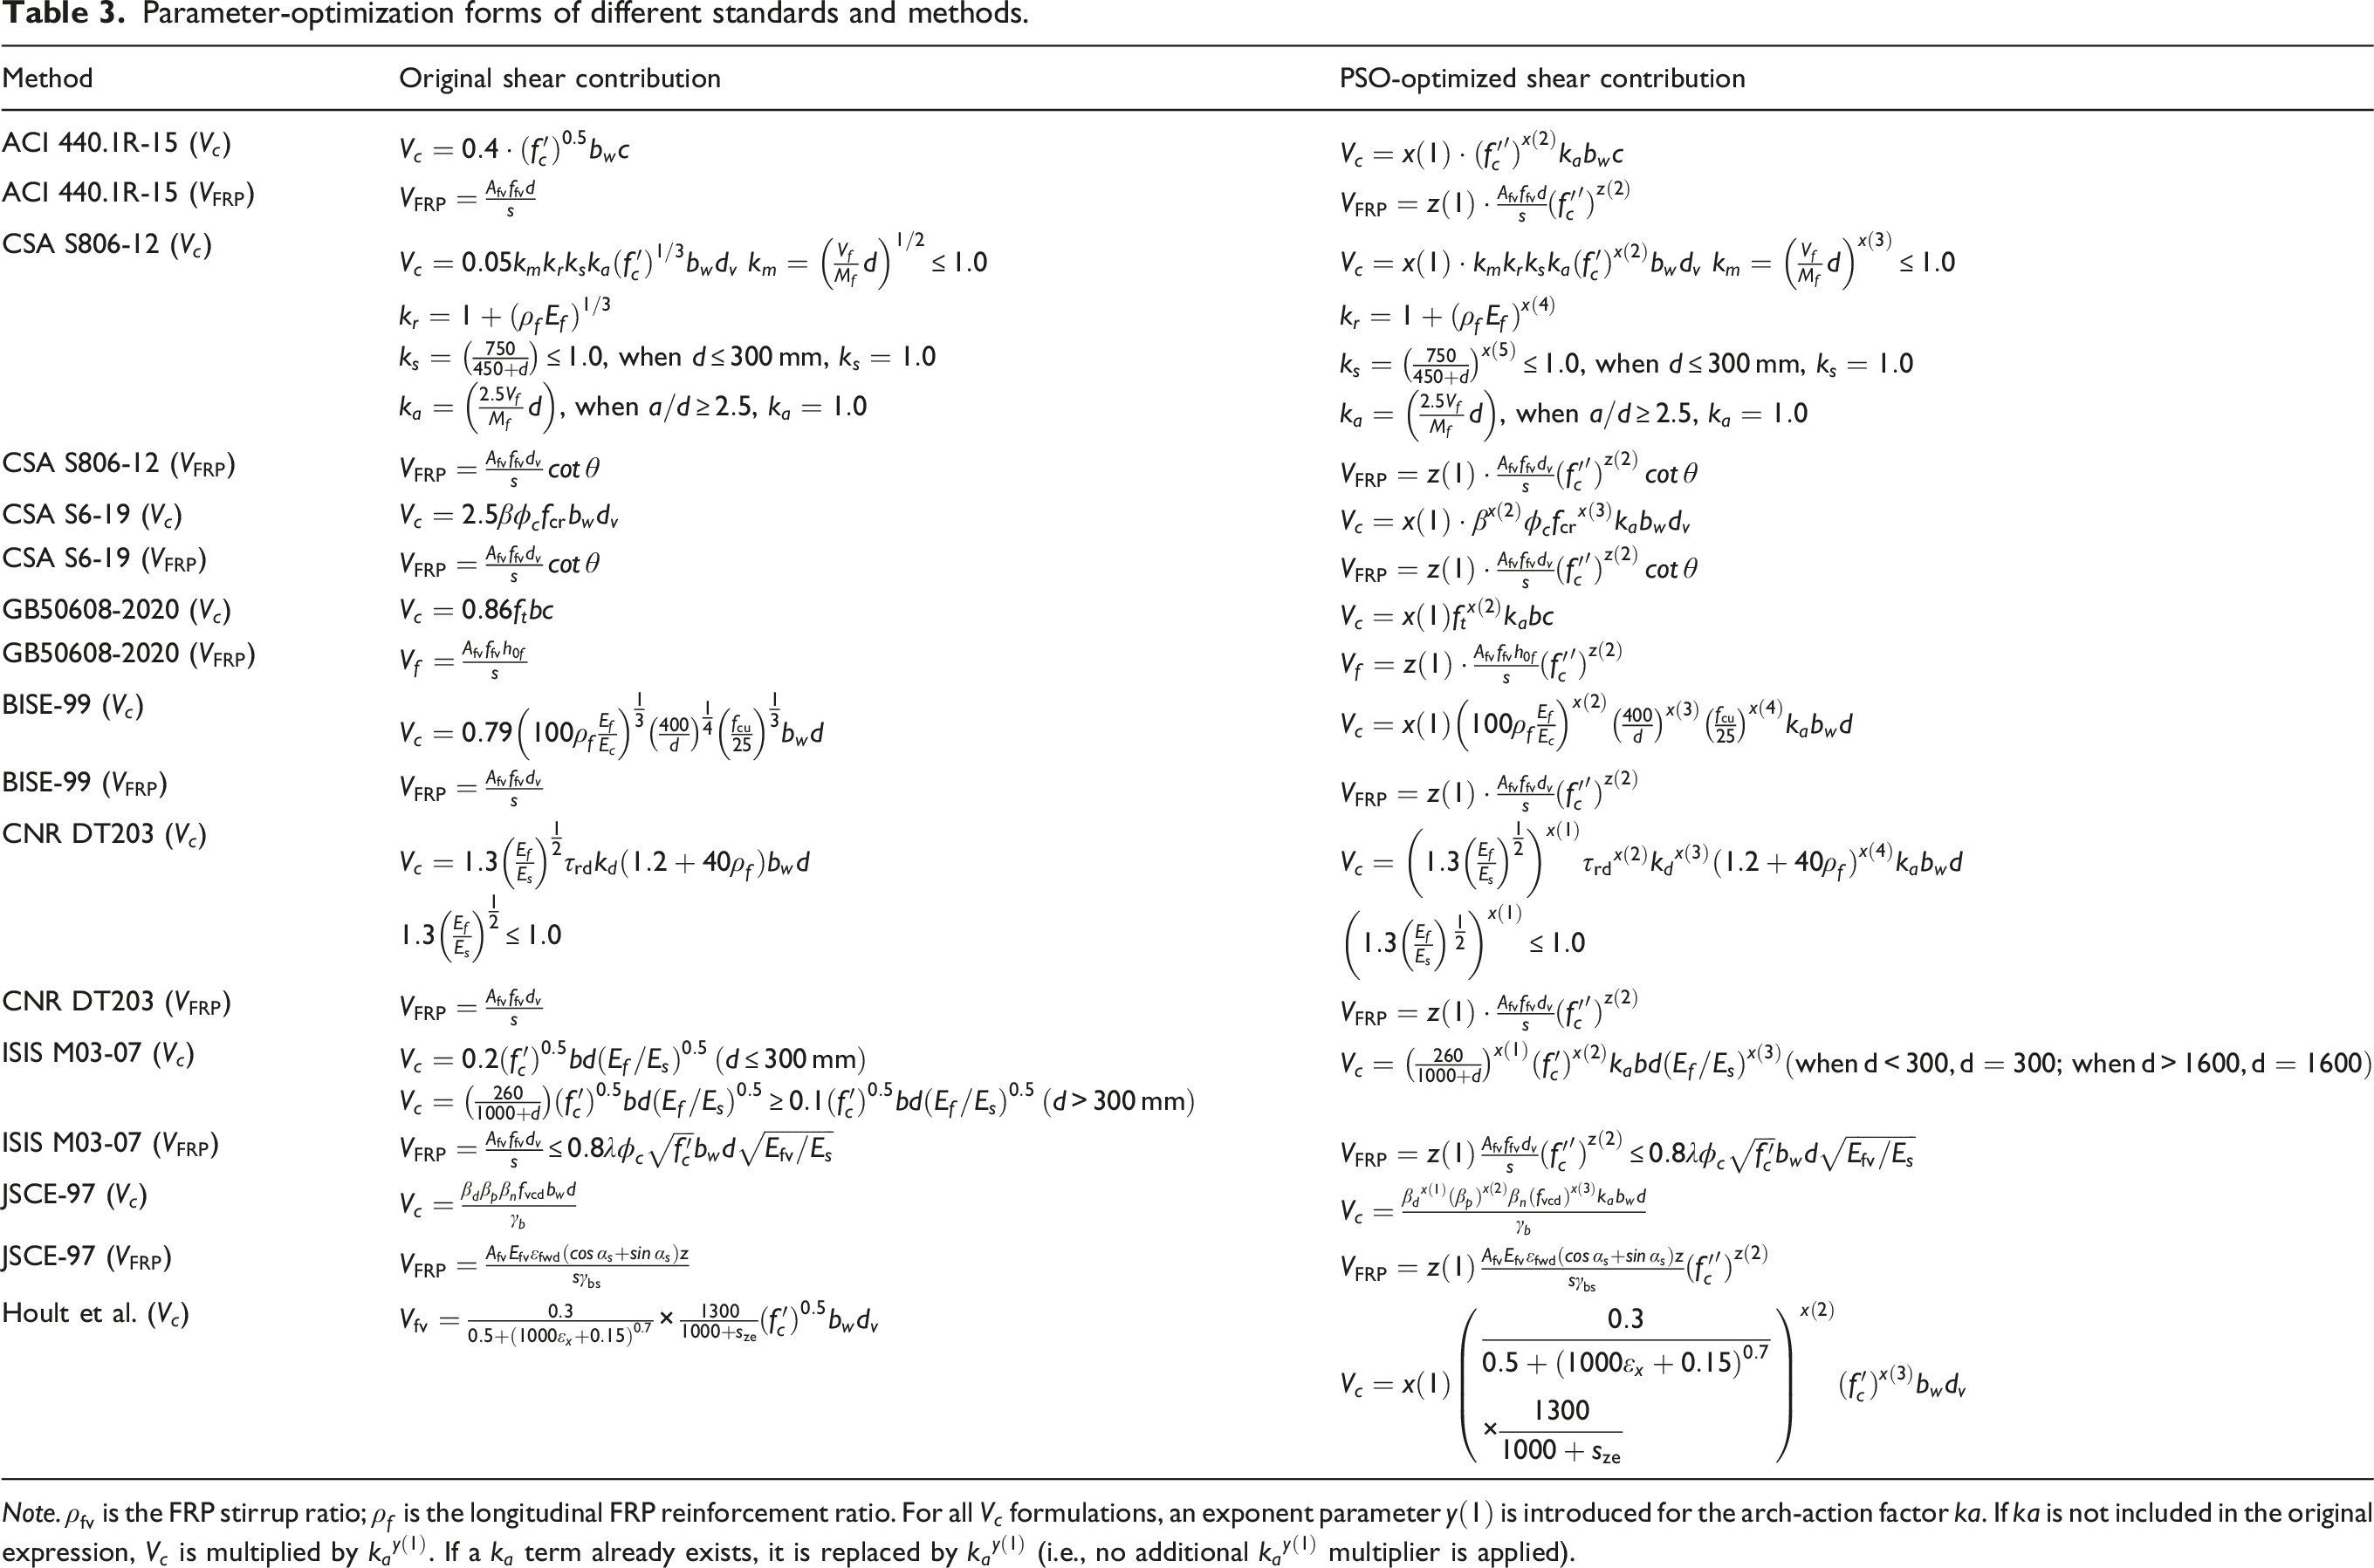
The shear capacity calculation methods for FRP-reinforced concrete beams adopted in the different standards and models are summarized in Table 3. To preserve the physical meaning of these formulations, no optimization was performed on the exponents of the geometric and reinforcement parameters , , and . However, because the exponents assigned to the concrete cylinder compressive strength differ among standards, the exponent of in each expression was treated as an optimization variable. For example, in the ACI 440.1R-15 guideline, the constant coefficient 0.4 and the exponent 0.5 on were denoted as and , respectively, and their optimal values were determined using the assembled database. The objective function y, defined in equation (1), is constructed from the mean value , the coefficient of variation () and the average absolute error (). The values of and that minimize are then obtained through the optimization procedure. Because different standards employ different parameters to represent the size effect in the shear capacity equations for beams without stirrups, the data were processed in two ways: one considering only beams with a shear-span ratio greater than 2.5 and the other including all beams without restriction on the shear-span ratio. is known to govern the gradual transition from beam action to arching action. Our database-level parameter study also shows that, for beams without stirrups, the prediction bias and scatter become much more pronounced at small , whereas the calculated response is comparatively stable when exceeds approximately 2.0 (Figure 3). Therefore, is adopted in the present calibration as a conservative boundary for identifying a beam-action-dominant subset for baseline coefficient identification. Although shear-transfer mechanisms evolve continuously with a/d, the present split at is introduced as a calibration/identification strategy to decouple beam-action–dominant behavior from the short-span (arching) enhancement, rather than implying an abrupt physical mechanism switch at . The final recommended equation retains a continuous transition around this threshold through the explicit -dependent factor (see Section 3.4 and Appendix). In both cases, the optimization problem reduces to identifying the set of coefficient values that minimizes the objective function y defined in equation (1).
where , , are the weighting coefficients of , , and , respectively, and ; , , , .
Parameter-optimization forms of different standards and methods.
Method
Original shear contribution
PSO-optimized shear contribution
ACI 440.1R-15 ()
ACI 440.1R-15 ()
CSA S806-12 ()
, when , , when ,
, when , , when ,
CSA S806-12 ()
CSA S6-19 ()
CSA S6-19 ()
GB50608-2020 ()
GB50608-2020 ()
BISE-99 ()
BISE-99 ()
CNR DT203 ()
CNR DT203 ()
ISIS M03-07 ()
ISIS M03-07 ()
JSCE-97 ()
JSCE-97 ()
Hoult et al. ()
Note. is the FRP stirrup ratio; is the longitudinal FRP reinforcement ratio. For all formulations, an exponent parameter is introduced for the arch-action factor ka. If ka is not included in the original expression, is multiplied by . If a term already exists, it is replaced by (i.e., no additional multiplier is applied).
The PSO calibration minimizes a weighted sum of three dimensionless performance indices derived from (magnitude of mean bias, targeting ), (dispersion), and (average absolute error). In this study, we use equal weights as a neutral baseline to avoid introducing subjective preferences and to obtain a balanced compromise solution. For applications emphasizing one aspect (e.g., reduced dispersion or reduced bias), the same framework can be readily adapted by increasing the corresponding weight. A brief weight-sensitivity check for the CSA S806-12–based model using alternative weight sets () is provided in the Appendix (Tables S3 and S4), showing that the calibrated solution is robust to reasonable variations in , , and . To verify that the calibration is not an artifact of the selected threshold, we performed a sensitivity study by repeating the staged PSO calibration using alternative thresholds = 2.0 and 3.0. The resulting optimized coefficients and performance indices show only modest variations, and the main conclusions remain unchanged (see the Appendix, Tables S5 and S6).
Optimization algorithm
As described in the previous subsection, the optimization problem consists of determining the set of coefficients in the shear capacity calculation methods (e.g., the constant factors and selected exponents) that minimizes the objective function defined in equation (1), which combines , , and . To efficiently solve this multi-parameter optimization problem, a particle swarm optimization (PSO) algorithm is adopted, whereby a population of candidate solutions (particles) explores the search space cooperatively by sharing information about promising regions.27,28
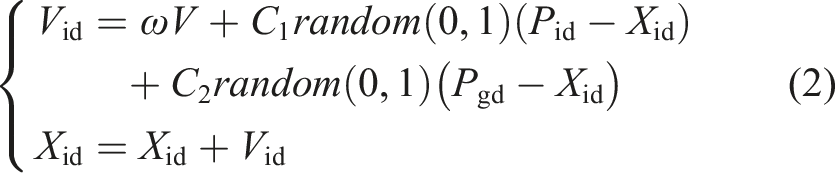
The PSO algorithm is implemented by defining the optimization problem in an n-dimensional search space, where each particle is regarded as a point in this space and a swarm of particles is considered. Each particle has a position vector and a velocity vector , which represent a candidate solution and its motion in the search space, respectively, and each position is associated with a fitness value obtained from the objective function . During the optimization process, the velocity and position of each particle are updated according to equation (2), where is the non-negative inertia weight controlling the balance between global and local search: a larger favors global exploration, whereas a smaller strengthens local exploitation. The acceleration coefficients and , corresponding to the cognitive (individual learning) and social (swarm learning) factors of each particle, are also used in the velocity update and are typically chosen such that . The symbols and denote the component of the personal best position of particle and the global best position of the swarm, respectively, while and denote the component of the velocity and position of particle .
In the present work, the dimension of the search space is equal to the number of coefficients to be optimized in each shear capacity calculation method. Each particle therefore represents a candidate set of these coefficients. The exponents of the geometric parameters , , and are kept fixed and only selected constants and the exponent of are treated as decision variables, so as to preserve the mechanical interpretation of the model components. The initial positions and velocities of all particles are generated randomly within prescribed bounds for each coefficient, which are selected to be mechanically reasonable (e.g., non-negative shear contributions and exponents constrained to physically meaningful ranges). At each iteration, the fitness of every particle is computed from the objective function y and the personal best position of each particle together with the global best position of the swarm are updated accordingly. The swarm size, inertia weight and acceleration coefficients are chosen to balance global exploration and local exploitation of the search space. In this study, the swarm size is set to 500 and the maximum number of iterations is set to 100; the inertia weight is taken as 0.8 and the acceleration coefficients and are both taken as 0.5. The algorithm is terminated when either the maximum number of iterations is reached or when the relative improvement in the global best objective value y satisfies () for K (K = 20) consecutive iterations. To address the stochastic nature of PSO, each calibration case is repeated in three independent runs (Nrun = 3) with different random seeds/initial swarms while keeping all hyperparameters unchanged, and the coefficient set achieving the minimum final objective value y is reported. All decision variables (e.g., , , , , , etc.) are constrained to be non-negative and bounded within prescribed box constraints.
Separate PSO runs are carried out for the relevant data subsets considered in Section 3.1 and for each standard or model, so that the influence of the size effect is treated consistently across the database. The coefficient set corresponding to the final global best position is taken as the optimized shear capacity calculation method for FRP-reinforced concrete beams. In this way, the proposed PSO-based calibration preserves the mechanistic structure of code-like shear formulas while systematically optimizing their coefficients on a large experimental database.
Optimization process and analysis of the optimization results
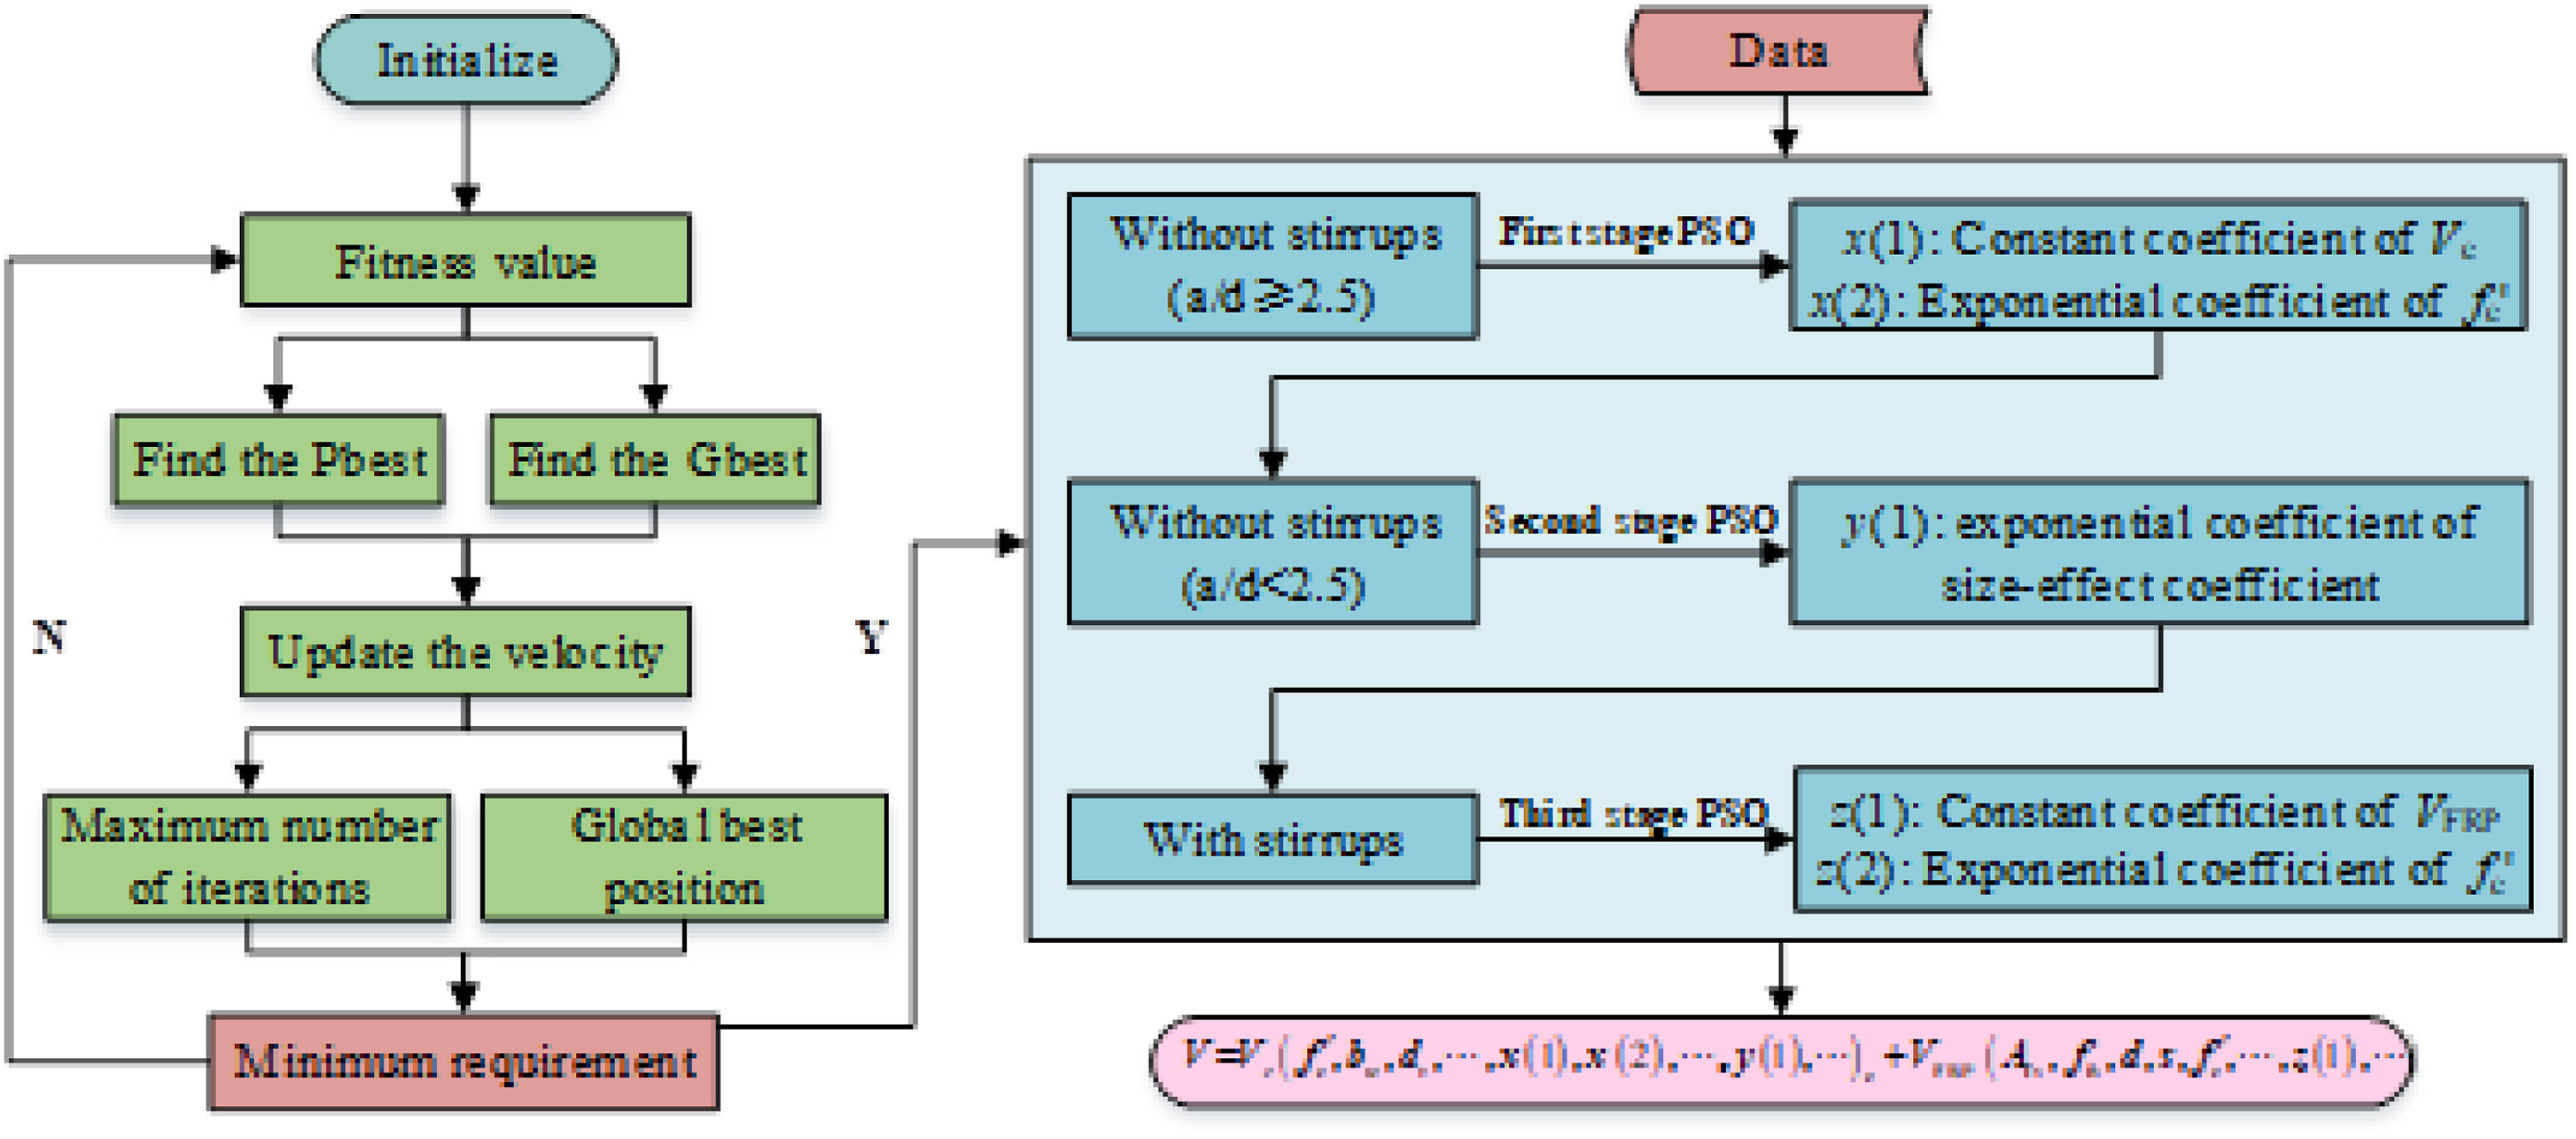
The coefficient optimization process for the shear capacity calculation methods is illustrated in Figure 6. In the first stage, the constant and exponent terms in the concrete shear contribution for beams without stirrups are optimized. Since governs the gradual transition from beam action to arch action and is closely linked to the short-span (arching) enhancement observed in the database, a regime-based calibration strategy is adopted for beams without stirrups. It is emphasized that this regime split is introduced as a calibration/identification strategy rather than implying an abrupt physical mechanism switch. Stage 1 calibrates the baseline concrete contribution using only specimens with , for which the short-span/arching amplification is inactive (i.e., ). This prevents the baseline coefficients from being biased by short-span behavior. Stage 2 then introduces the explicit shear-span factor () (arching/short-span effect) into the concrete contribution and calibrates its associated exponent/scale using only specimens with , so that the a/d-dependent enhancement is captured in a targeted manner. Although the calibration is performed in two regimes for identification purposes, the resulting unified formulation remains continuous at because is defined such that (2.5) = 1.0 (see the Appendix for a short continuity check). In the third stage, the shear contribution of FRP stirrups is optimized and the specific optimization forms are listed in Table 3. The optimization mainly targets the constant coefficient term in the FRP shear contribution and the exponent associated with the concrete strength term . It should be noted that the calculated shear capacities of beams with stirrups are strongly influenced by . Therefore, the shear contribution of FRP stirrups is reformulated to explicitly incorporate a coupling term in and the corresponding coefficients are calibrated using the PSO algorithm. A comparison between the original and optimized shear capacity calculation methods is presented in Figure 7.
Coefficient optimization process for shear capacity calculation methods.
Experimental versus predicted shear capacities for PSO-optimized models.
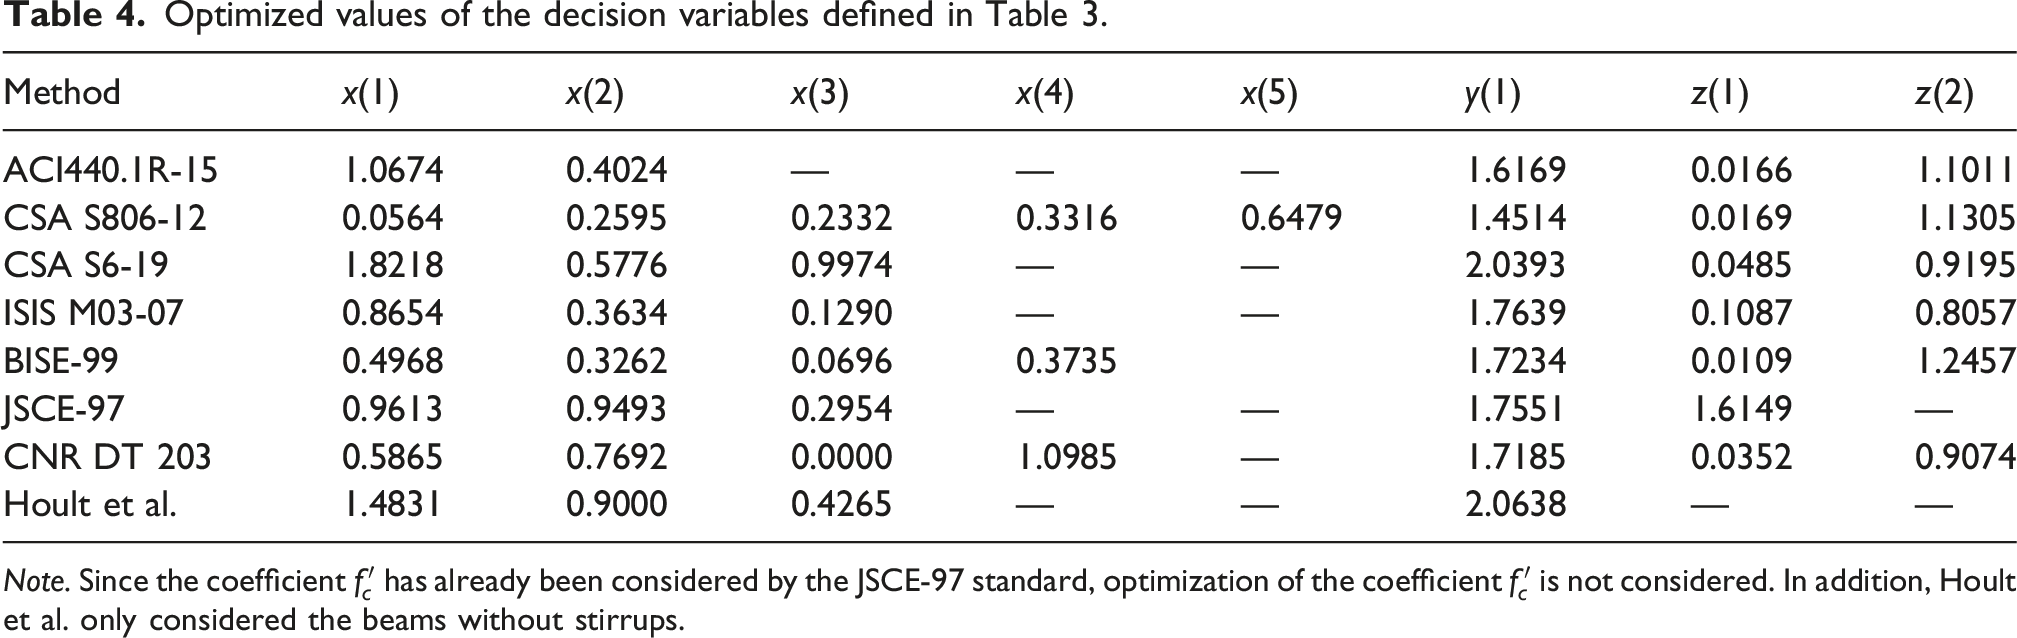
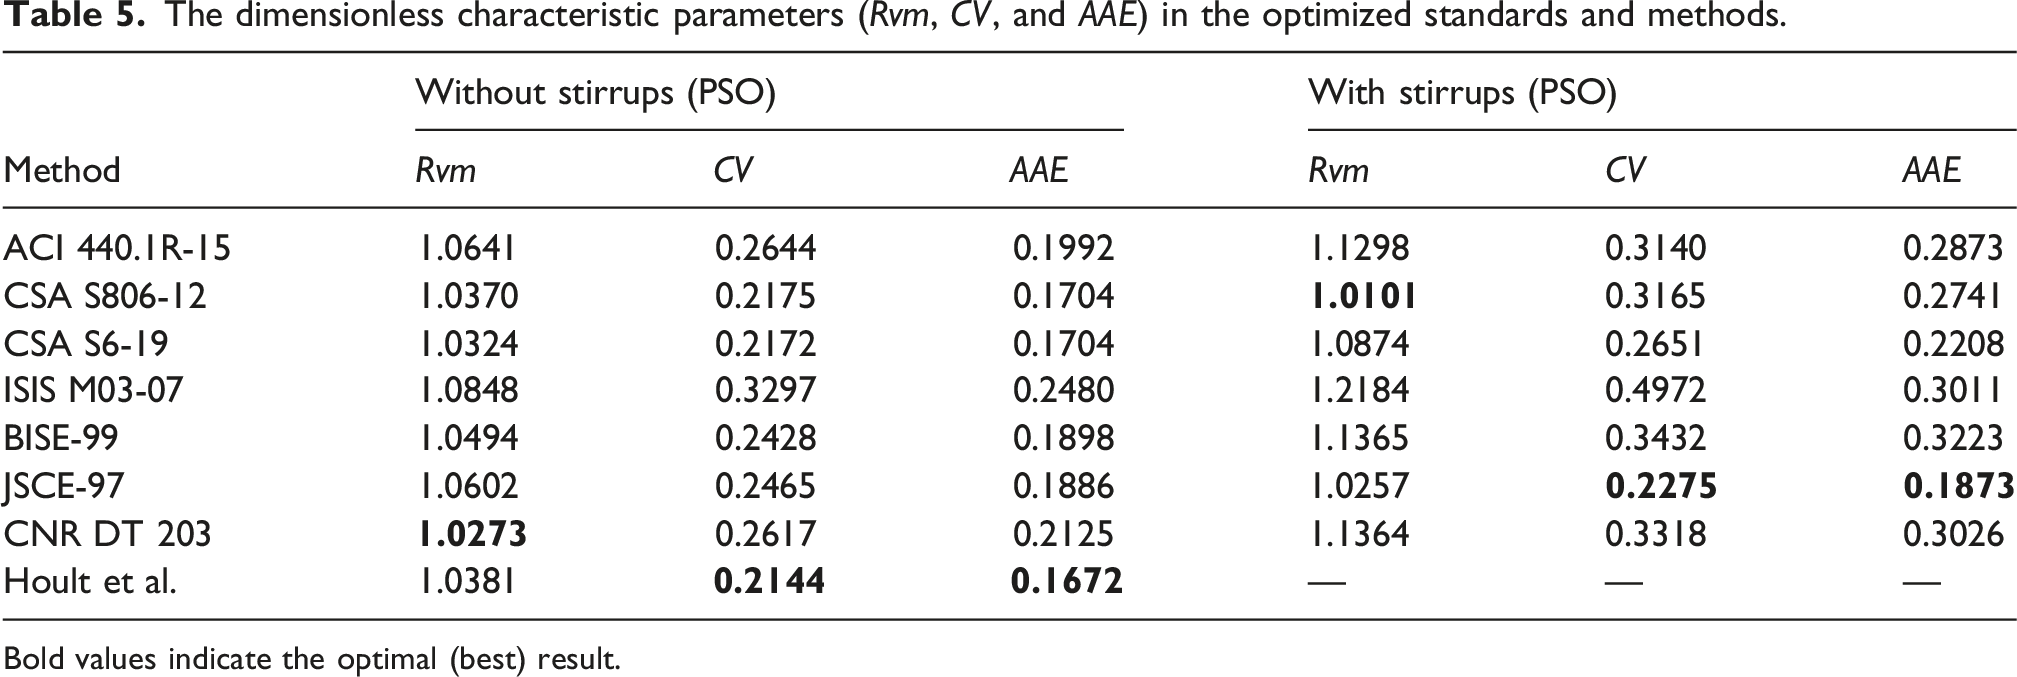
All optimized coefficients are listed in Table 4 and the corresponding dimensionless performance indices (, , and ) for the optimized formulations are summarized in Table 5. For beams without stirrups and with smaller shear-span ratios (e.g. ), the optimized BISE-99 formulation provides a favorable balance between accuracy and dispersion within this subset. For beams with stirrups, the calculated shear capacities from the various standards exhibit less scatter; in this case, formulations whose values are closer to 1 and whose and values are relatively small, such as CSA S806-12 and JSCE-97, show better predictive performance for this subset.
Optimized values of the decision variables defined in Table 3.
Method
x(1)
x(2)
x(3)
x(4)
x(5)
y(1)
z(1)
z(2)
ACI440.1R-15
1.0674
0.4024
—
—
—
1.6169
0.0166
1.1011
CSA S806-12
0.0564
0.2595
0.2332
0.3316
0.6479
1.4514
0.0169
1.1305
CSA S6-19
1.8218
0.5776
0.9974
—
—
2.0393
0.0485
0.9195
ISIS M03-07
0.8654
0.3634
0.1290
—
—
1.7639
0.1087
0.8057
BISE-99
0.4968
0.3262
0.0696
0.3735
1.7234
0.0109
1.2457
JSCE-97
0.9613
0.9493
0.2954
—
—
1.7551
1.6149
—
CNR DT 203
0.5865
0.7692
0.0000
1.0985
—
1.7185
0.0352
0.9074
Hoult et al.
1.4831
0.9000
0.4265
—
—
2.0638
—
—
Note. Since the coefficient has already been considered by the JSCE-97 standard, optimization of the coefficient is not considered. In addition, Hoult et al. only considered the beams without stirrups.
The dimensionless characteristic parameters (, , and ) in the optimized standards and methods.
Method
Without stirrups (PSO)
With stirrups (PSO)
Rvm
CV
AAE
Rvm
CV
AAE
ACI 440.1R-15
1.0641
0.2644
0.1992
1.1298
0.3140
0.2873
CSA S806-12
1.0370
0.2175
0.1704
1.0101
0.3165
0.2741
CSA S6-19
1.0324
0.2172
0.1704
1.0874
0.2651
0.2208
ISIS M03-07
1.0848
0.3297
0.2480
1.2184
0.4972
0.3011
BISE-99
1.0494
0.2428
0.1898
1.1365
0.3432
0.3223
JSCE-97
1.0602
0.2465
0.1886
1.0257
0.2275
0.1873
CNR DT 203
1.0273
0.2617
0.2125
1.1364
0.3318
0.3026
Hoult et al.
1.0381
0.2144
0.1672
—
—
—
Bold values indicate the optimal (best) result.
The 631-test database is used exclusively for coefficient calibration. The seven BFRP-reinforced concrete beams are not included in the database and were not used for calibration, model selection, or parameter tuning, thus providing an independent external verification. To address potential overfitting, a repeated stratified 90/10 hold-out validation (three splits with different seeds) was conducted: coefficients were calibrated on the 90% training subset only and performance was evaluated on the independent 10% held-out subset using (or ), , and . The variability of coefficients and held-out performance are summarized in Tables S1–S2. The final coefficients reported in Table 4 are calibrated using the full 631-test database.
By comparing Table 5 with Table 2, it can be seen that, for beams without stirrups, the values of the optimized standards lie between 1.0273 and 1.0848. Compared with the original standards, the calculated shear capacities are much closer to the experimental values, whereas the original values ranged from 0.8133 to 4.6801. The range of values decreases from 0.3866 to 0.7363 for the original standards to 0.2144–0.3297 after PSO optimization and the range of values decreases from 0.6240 to 0.8482 to 0.1672–0.2480. For beams with stirrups, the values of the optimized standards lie between 1.0101 and 1.2184, which represents a substantial improvement compared with the original range of 0.9174–1.9906. The range of values does not change appreciably before and after optimization (original standards: 0.2255–0.4485; after PSO optimization: 0.2275–0.4972). However, the range of values is markedly reduced, from 0.2818 to 1.5102 for the original standards to 0.1873–0.3223 after optimization. These results indicate that the application of the PSO algorithm to calibrate the shear capacity models not only brings the calculated values closer to the experimental values but also reduces the dispersion of the predictions, thereby increasing the reliability of the calculated shear capacities. In addition, the optimized standards exhibit reduced sensitivity to the shear-span ratio owing to the modification of the calculation forms and the explicit consideration of the size effect at low shear-span ratios.
Recommended method for calculating shear capacity
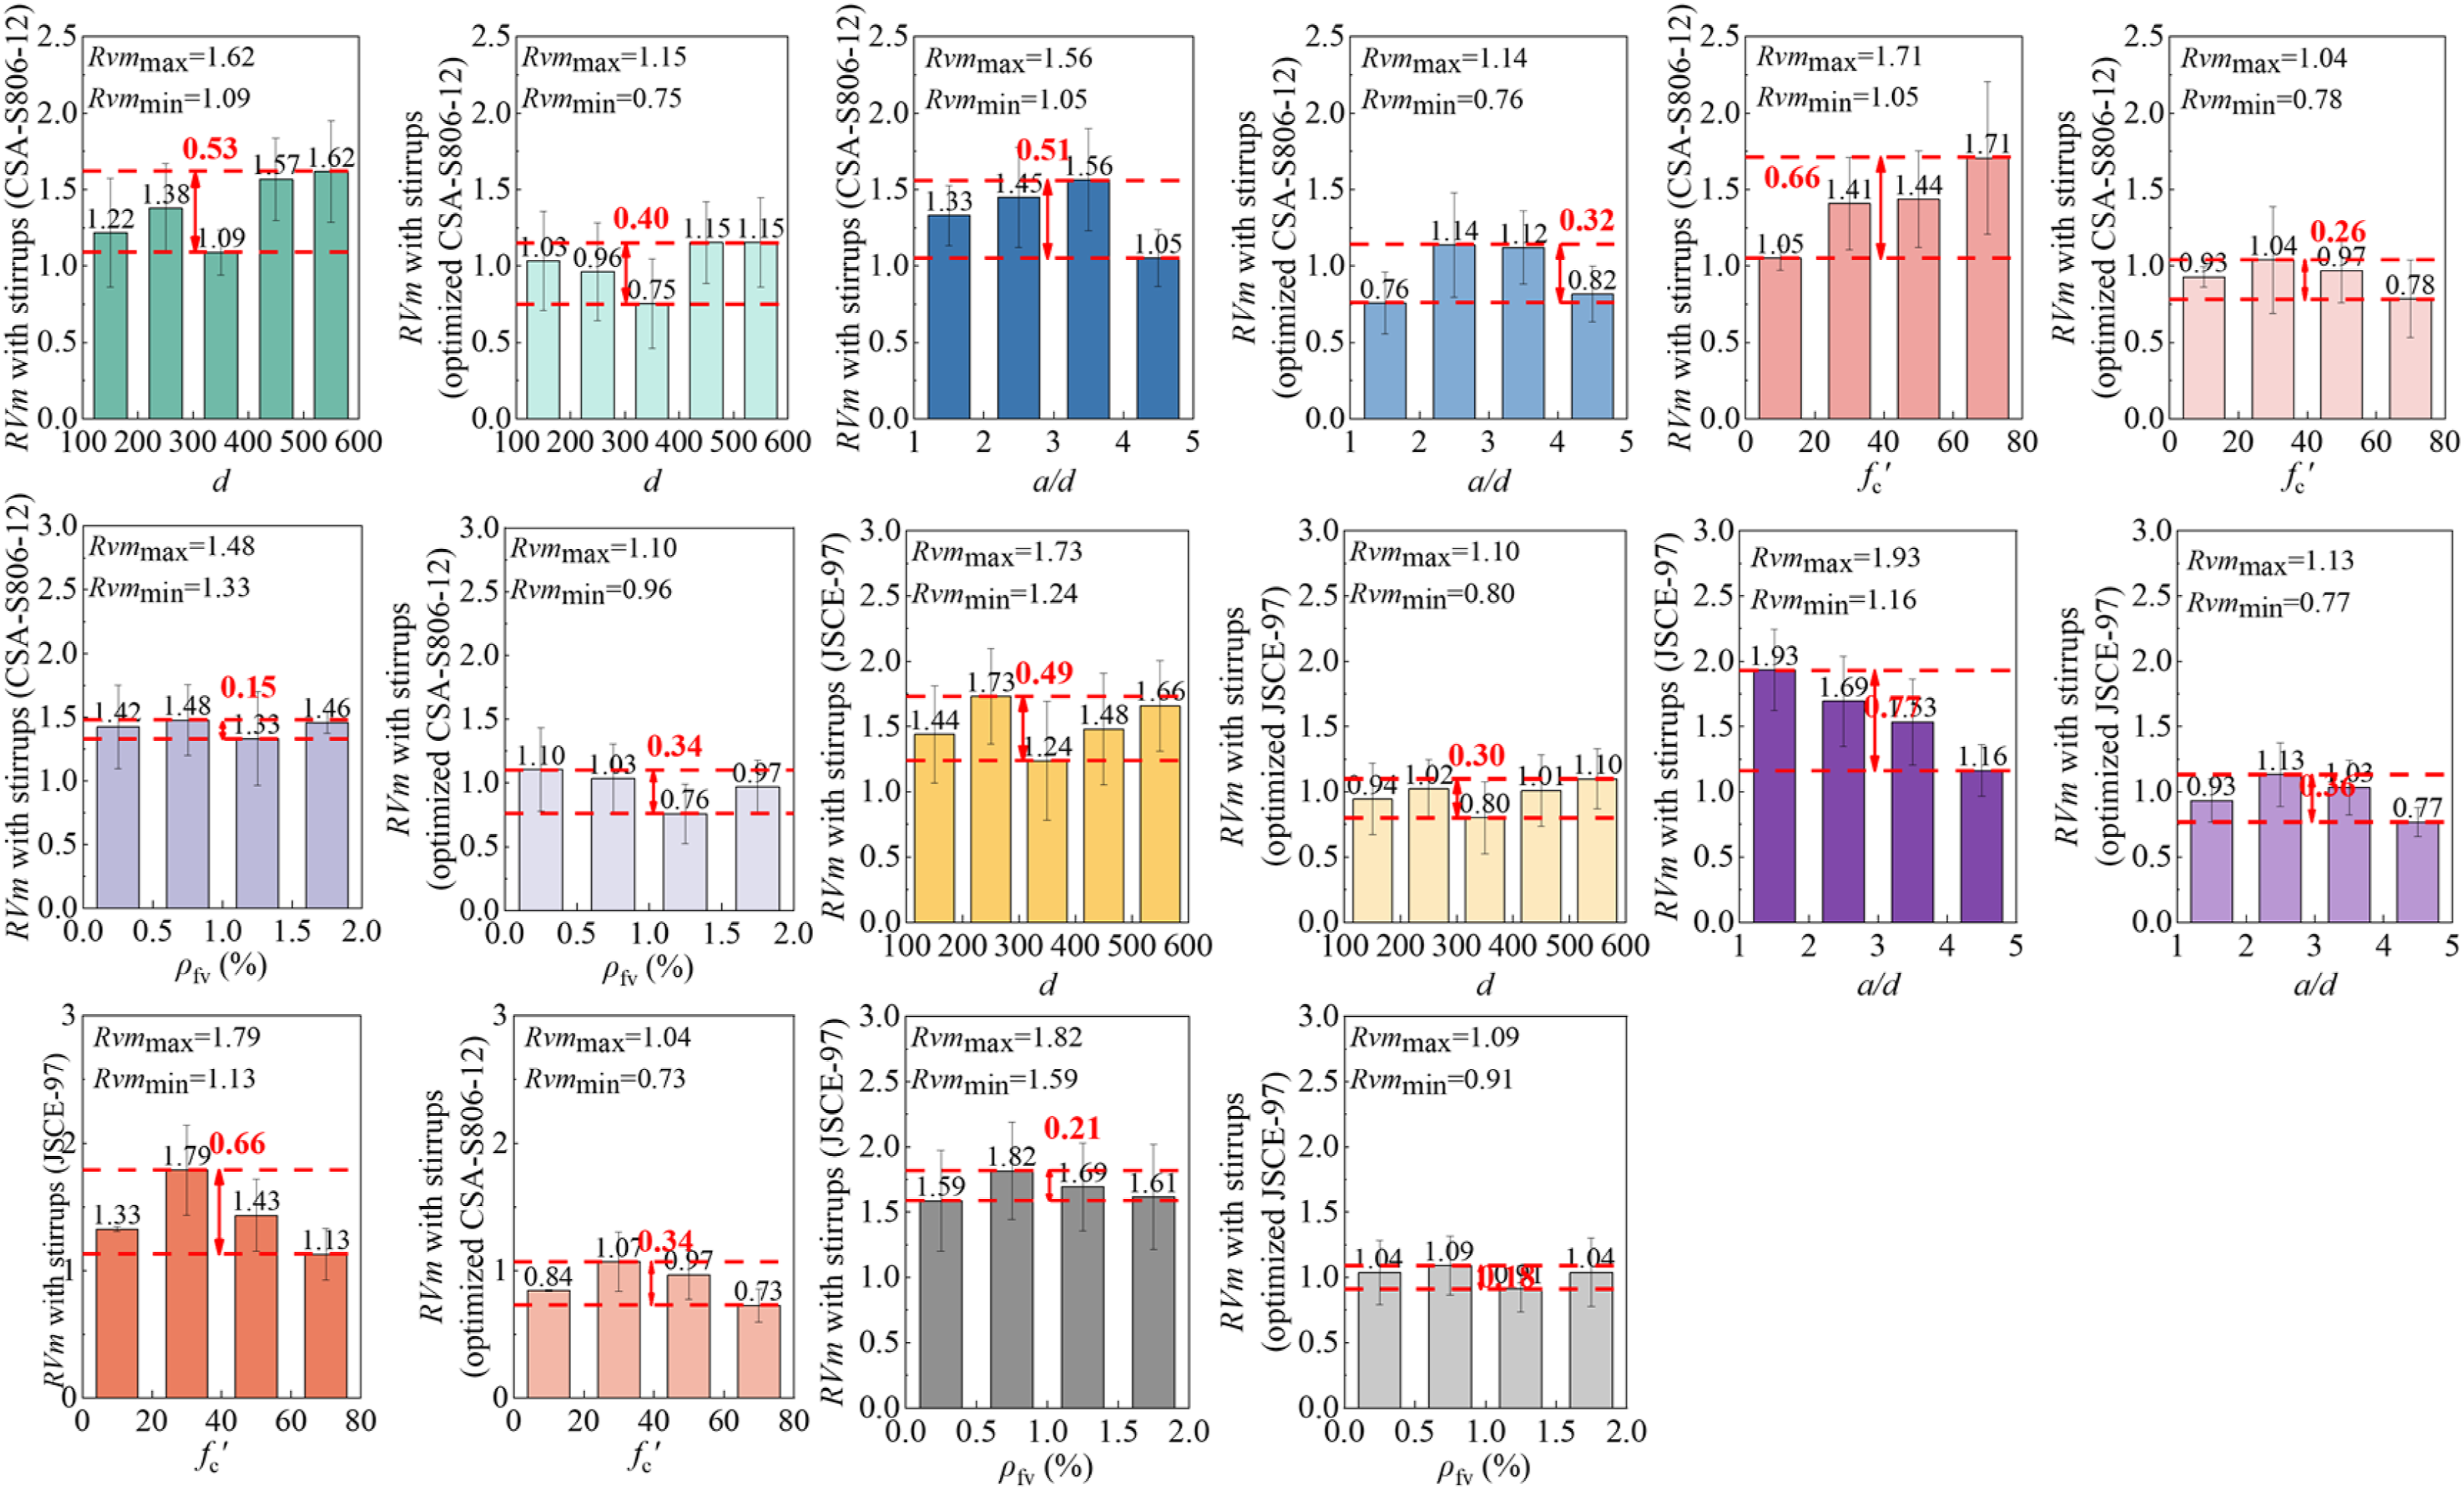
Based on the three dimensionless characteristic parameters reported in Table 5, the PSO-optimized standards that exhibit the best overall performance, that is, those with closest to 1 and the smallest and , are CSA S806-12, JSCE-97, CNR DT 203 and the model proposed by Hoult et al. However, for beams with stirrups, CNR DT 203 yields a relatively large value (1.1364) and the formulation of Hoult et al. does not provide an expression for beams with stirrups. These two methods are therefore not considered further in the subsequent recommendations. To examine in more detail the sensitivity of the calculated shear capacity to the ranges of the input parameters, a parametric analysis is carried out. In accordance with Section 2.4, the results for different ranges of the four parameters, namely the , , , and are presented in Figure 8.
Effects of the effective depth, shear span ratio, cylinder compressive strength, and stirrup reinforcement ratio on the shear capacity predicted by the proposed method.
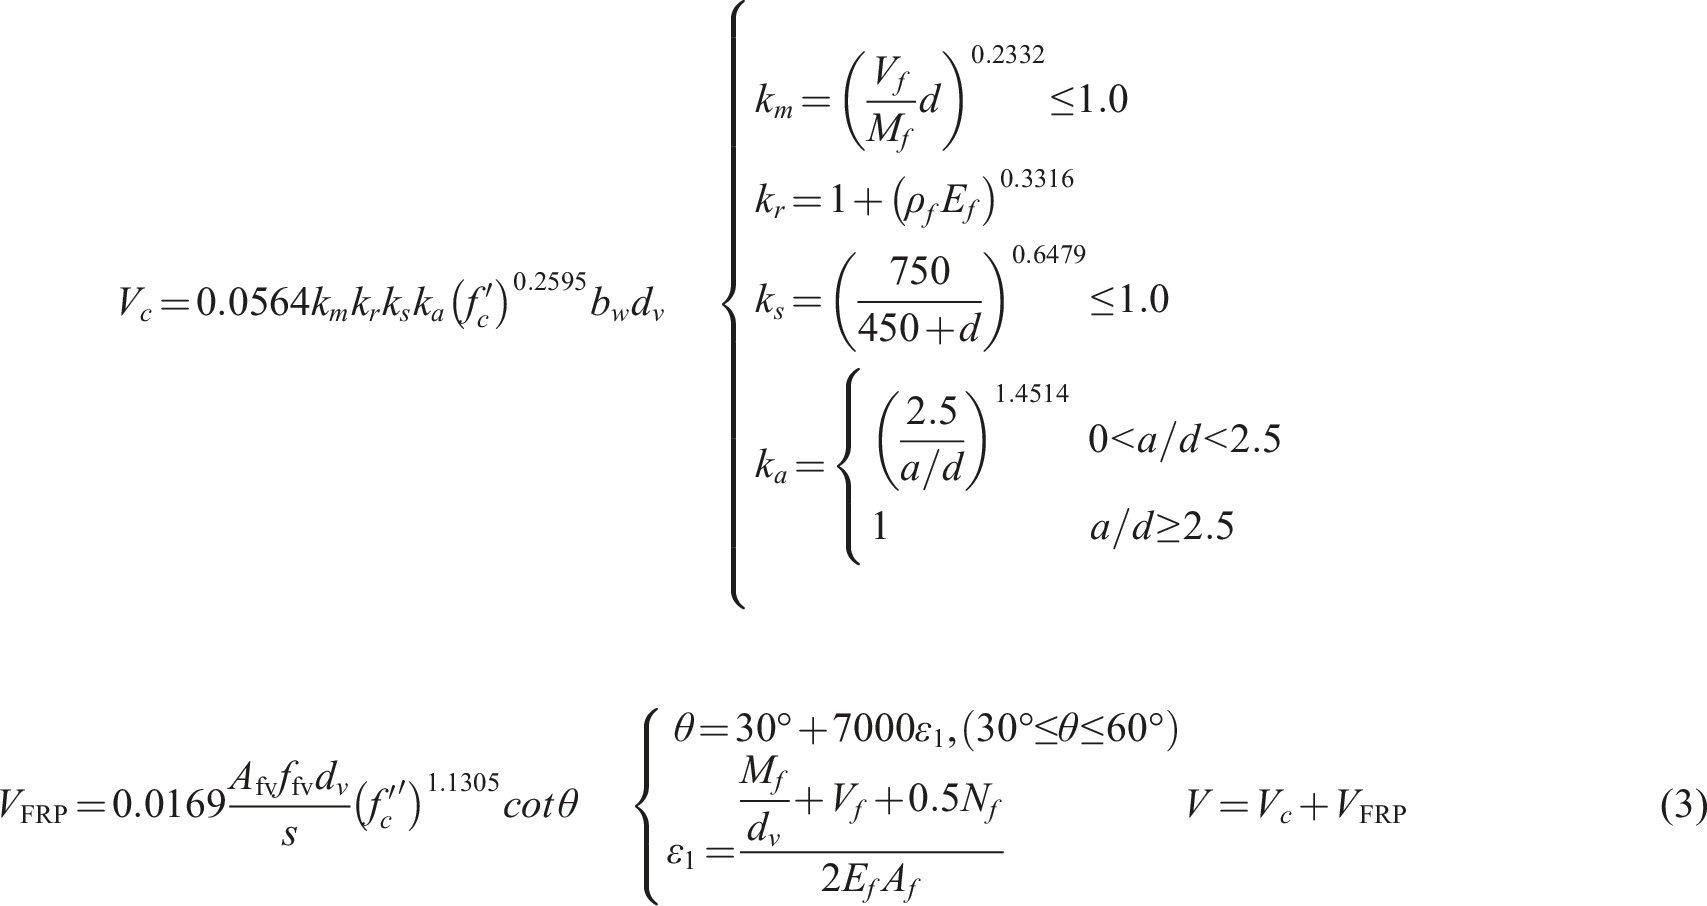
Overall, the PSO-optimized methods exhibit a marked reduction in the sensitivity of the predicted shear capacity to the key parameters. Although some optimized formulations yield lower dispersion (smaller ) in a specific subset, the baseline recommendation in this study targets a unified and implementable equation applicable to beams both without and with FRP stirrups. Table 5 shows that different candidates exhibit different trade-offs among mean bias (), dispersion (), and average absolute error (). For beams without stirrups, several formulations (e.g., CSA S6-19, CSA S806-12, and Hoult et al.) provide similarly competitive accuracy; however, Hoult et al. does not provide an expression for beams with stirrups. For beams with stirrups, some alternatives (e.g., JSCE-97) achieve lower , but such subset-wise improvement does not necessarily translate into a preferable unified baseline when considering bias and performance in the complementary subset. In addition, CNR DT 203 exhibits a relatively large mean ratio for beams with stirrups, indicating a pronounced conservative bias. Considering (i) applicability to both subsets, (ii) the importance of near-unbiased mean predictions ( close to 1.0) together with competitive and , and (iii) the mechanics-consistent MCFT-based code structure and direct implementability, the PSO-optimized CSA S806-12 is adopted as the baseline framework for subsequent recommendation. Therefore, within the parameter ranges covered by the calibration database, the optimized CSA S806-12 formulation is adopted as the recommended baseline method for calculating the shear capacity of concrete beams reinforced with FRP bars. Accordingly, CSA S806-12 is adopted as the baseline framework and substituting the optimized parameters given in Table 4 into its formulation yields:
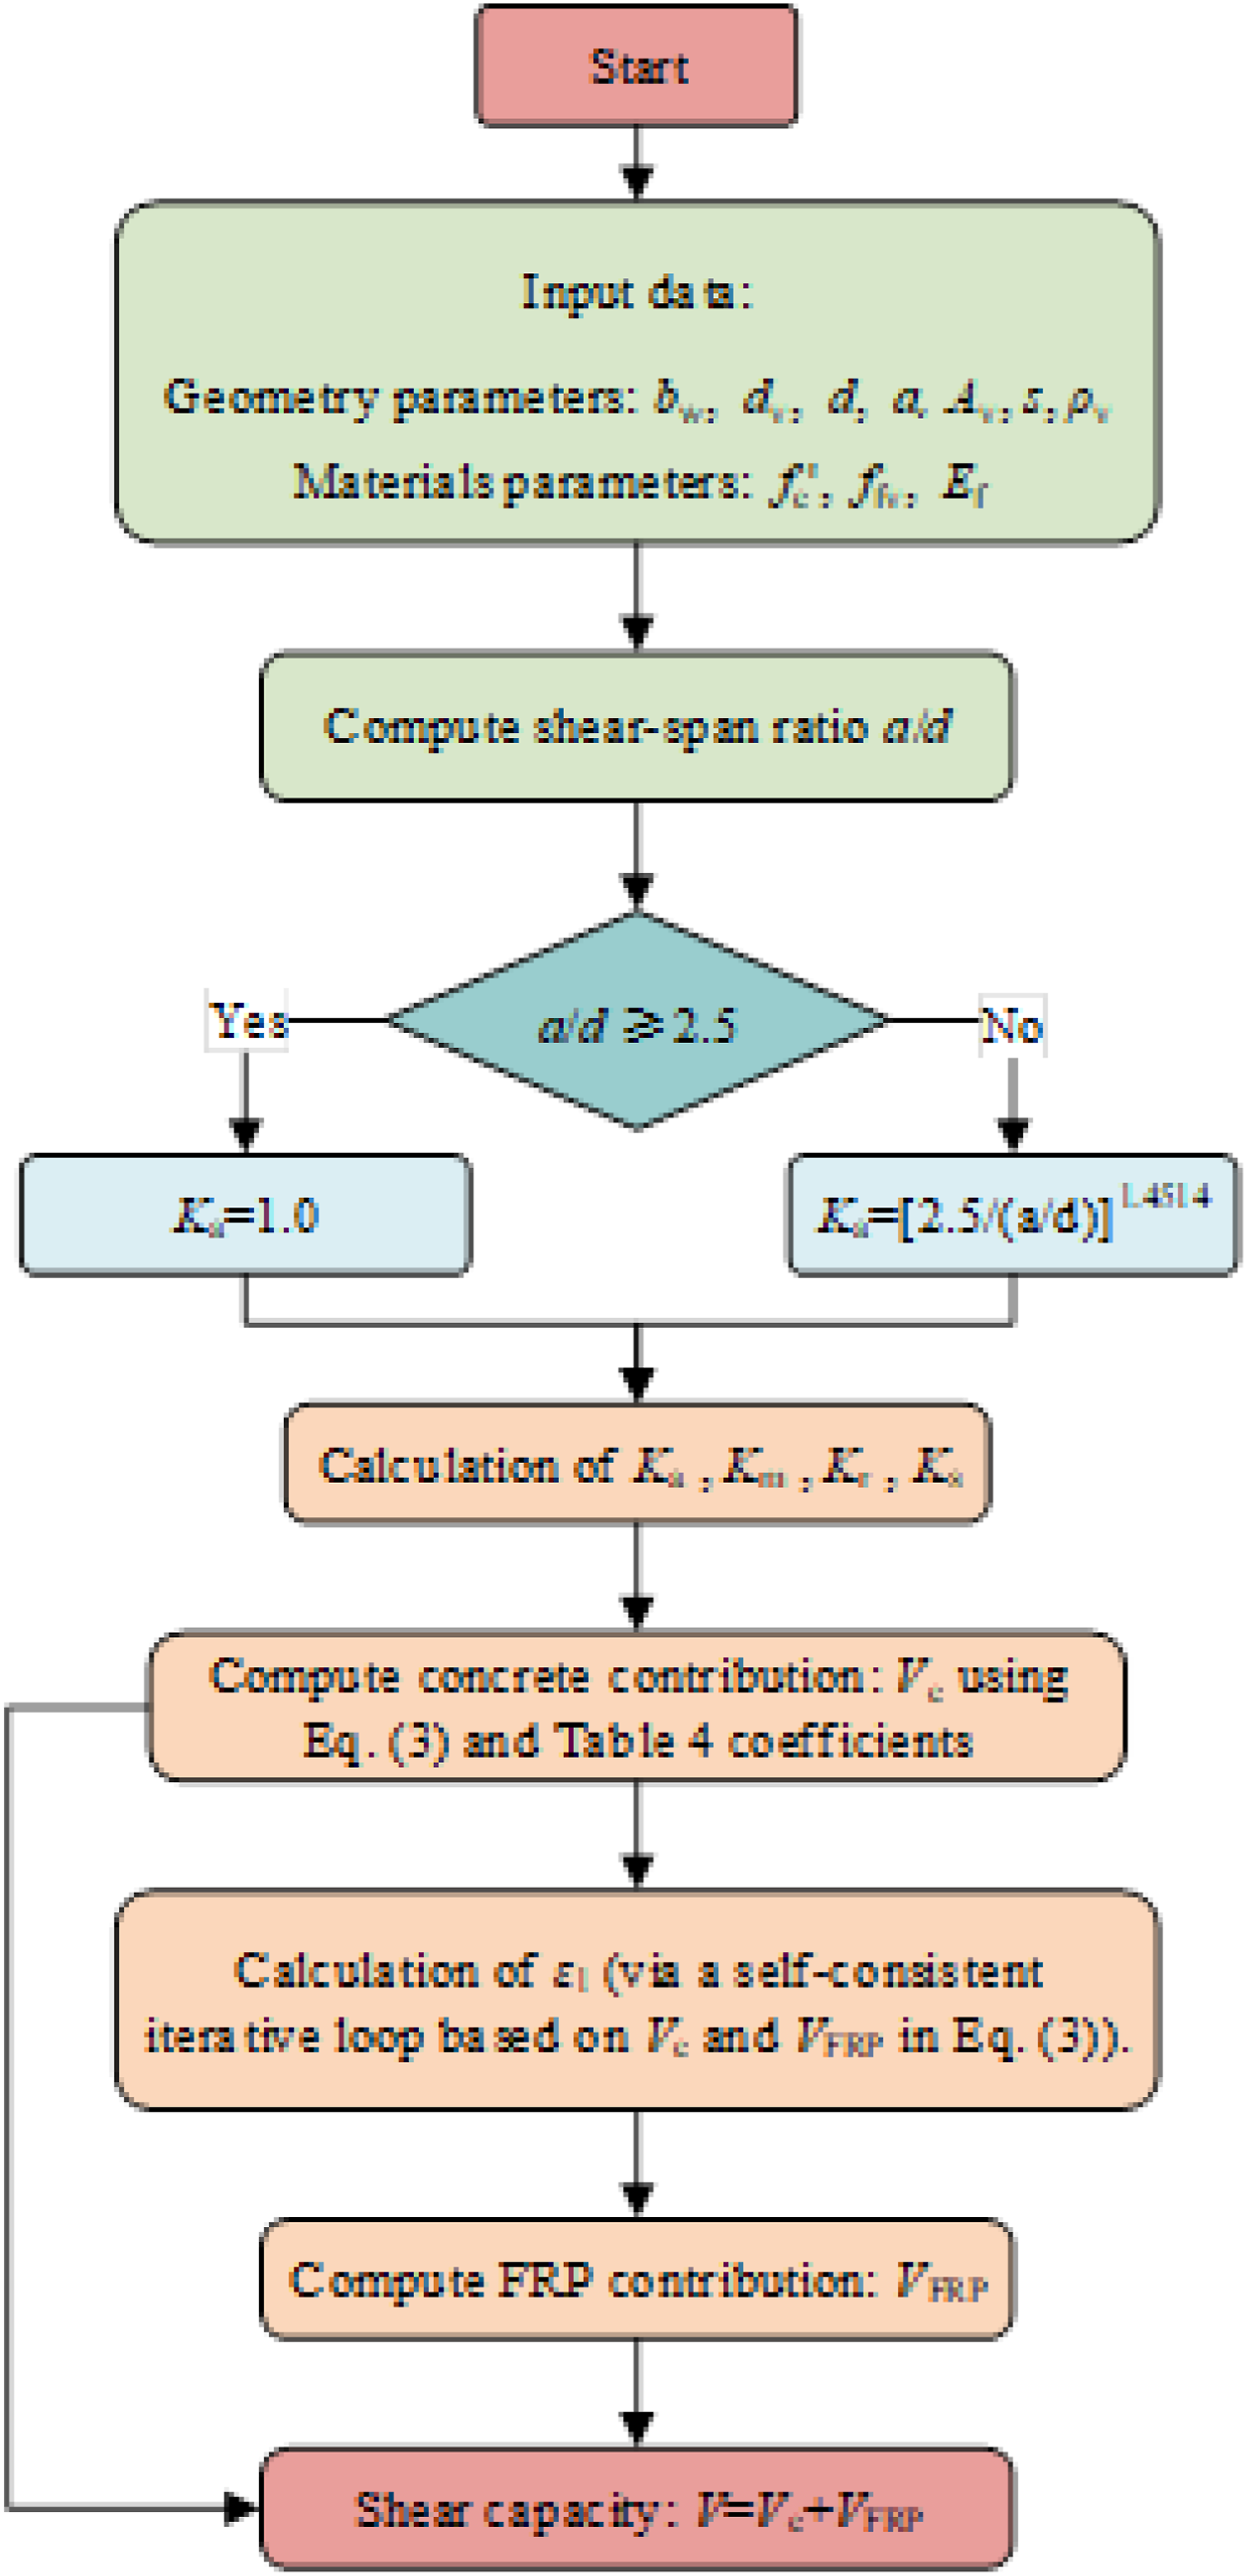
where is the moment–shear interaction factor; is the longitudinal-FRP rigidity factor; is the size-effect factor; is the arch-action factor used for small shear-span ratios; is the specified compressive strength of concrete; is the web (effective) width of the member; is the effective shear depth; is the effective flexural depth; , , and are the factored moment, shear, and axial force at the section; is the longitudinal FRP reinforcement ratio; is the elastic modulus of the longitudinal FRP reinforcement; is the area of transverse FRP shear reinforcement crossing the potential crack within spacing s (accounting for the number of legs); is the design stress in transverse FRP (limited to control brittle rupture and bend-capacity effects); is the stirrup spacing along the member; is the inclination of the concrete compression strut (or truss angle) in the variable-angle model; is the longitudinal strain; is the axial rigidity of the longitudinal FRP bar. For ease of practical implementation, the complete procedure is summarized in Figure 9.
Design-procedure flowchart for the PSO-optimized shear model.
The proposed equation is calibrated on a database of 631 shear tests on FRP-reinforced concrete beams (499 without and 132 with FRP stirrups). Therefore, its applicability is limited to the parameter ranges covered by the database: effective depth up to 1200 mm (without stirrups) and up to 1000 mm (with stirrups); shear span-to-depth ratio up to 10.0; concrete cylinder compressive strength up to 110 MPa; and FRP longitudinal bar types including AFRP, BFRP, CFRP, and GFRP (with stirrups also including hybrid GFRP/CFRP). For beams with stirrups, the FRP stirrup ratio ranges up to 2.4% (with most data within 0–0.6%). To further assess extrapolation risk at underrepresented extremes, we conducted subset-based checks for mm, , and . The results (Appendix, Table S7) indicate no concentration of unconservative predictions within these available extreme data points; nevertheless, extrapolation beyond the database envelope should be treated with caution.
Preliminary experimental verification
To provide preliminary external verification of the proposed PSO-optimized CSA S806-12-based method, shear tests were conducted on seven BFRP-reinforced concrete beams. This experimental program is intended as a preliminary external verification of the proposed model rather than a statistically exhaustive verification over the full parameter space of the 631-test database. The seven beams cover , BFRP stirrup ratios , and concrete strength classes C30–C70. Consequently, the present tests do not cover larger shear-span ratios (), high stirrup ratios (), or other FRP types (e.g., CFRP/GFRP), and extrapolation beyond the tested range should be treated with caution. Given , the statistical power of the experimental verification is limited; therefore, the test results are used to check external consistency rather than to claim definitive verification across the entire domain.
Materials and design of the beams
Materials
The mechanical properties of the BFRP reinforcement were determined through tensile characterization. Monotonic tensile tests were performed on straight BFRP bars with nominal diameters of 14 mm and 8 mm, as well as on BFRP stirrups with a nominal diameter of 8 mm, in accordance with ACI 440.3R-1229. The measured tensile strength, ultimate tensile strain, and elastic modulus of all BFRP reinforcement are summarized in Table 6. Specifically, the Ø14 BFRP longitudinal bars exhibited an average ultimate tensile strength of 1024.55 MPa and an average elastic modulus of 51.6 GPa. The Ø8 hanger bars and stirrups exhibited an average ultimate tensile strength of 1281.16 MPa and an average elastic modulus of 59.72 GPa; moreover, the tensile strength measured at the bent region of the Ø8 stirrups was 288.44 MPa. The stirrup bend radius-to-diameter ratio was fixed at 3. The deformed surface ribs were fabricated by a helical winding process, with a rib spacing equal to one bar diameter, a rib height equal to 6% of the bar diameter, and a rib width of 3 mm. All BFRP bars comprised 35% fiber and 65% epoxy resin matrix by mass. The concrete compressive strength was determined in accordance with the Chinese standard GB/T 50081.30 The measured compressive strengths of companion concrete cylinders are reported in Table 7. The concrete compressive strength classes adopted were C30, C50, and C70.
Mechanical properties of BFRP bars.
Diameter (mm)
Tensile strength (MPa)
Tensile strain capacity (%)
Elastic modulus (GPa)
8 (longitudinal bar)
1281.16 ± 21.95
2.15 ± 0.11
59.72 ± 2.58
14 (longitudinal bar)
1024.55 ± 24.84
1.99 ± 0.20
51.60 ± 3.12
8 (stirrups)
288.44 ± 39.27
0.48 ± 0.08
—
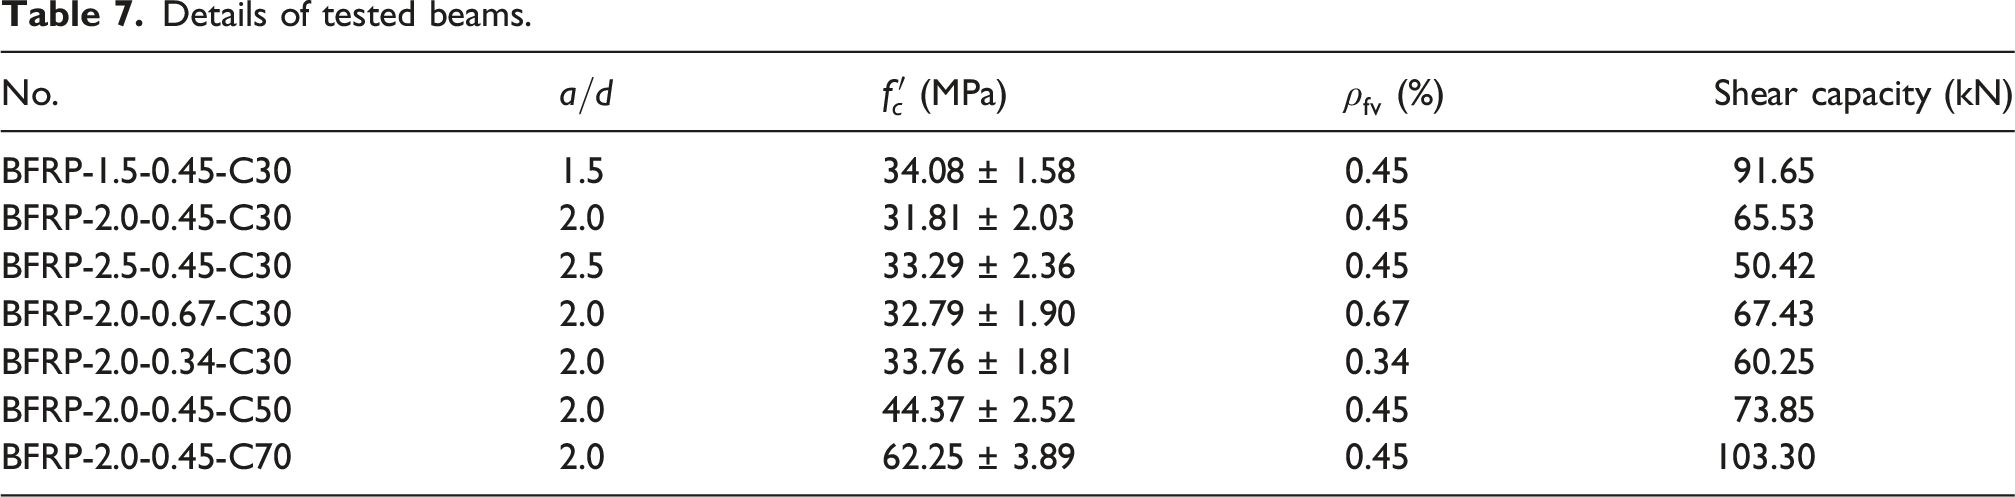
Details of tested beams.
No.
(MPa)
(%)
Shear capacity (kN)
BFRP-1.5-0.45-C30
1.5
34.08 ± 1.58
0.45
91.65
BFRP-2.0-0.45-C30
2.0
31.81 ± 2.03
0.45
65.53
BFRP-2.5-0.45-C30
2.5
33.29 ± 2.36
0.45
50.42
BFRP-2.0-0.67-C30
2.0
32.79 ± 1.90
0.67
67.43
BFRP-2.0-0.34-C30
2.0
33.76 ± 1.81
0.34
60.25
BFRP-2.0-0.45-C50
2.0
44.37 ± 2.52
0.45
73.85
BFRP-2.0-0.45-C70
2.0
62.25 ± 3.89
0.45
103.30
Specimen design and test setup
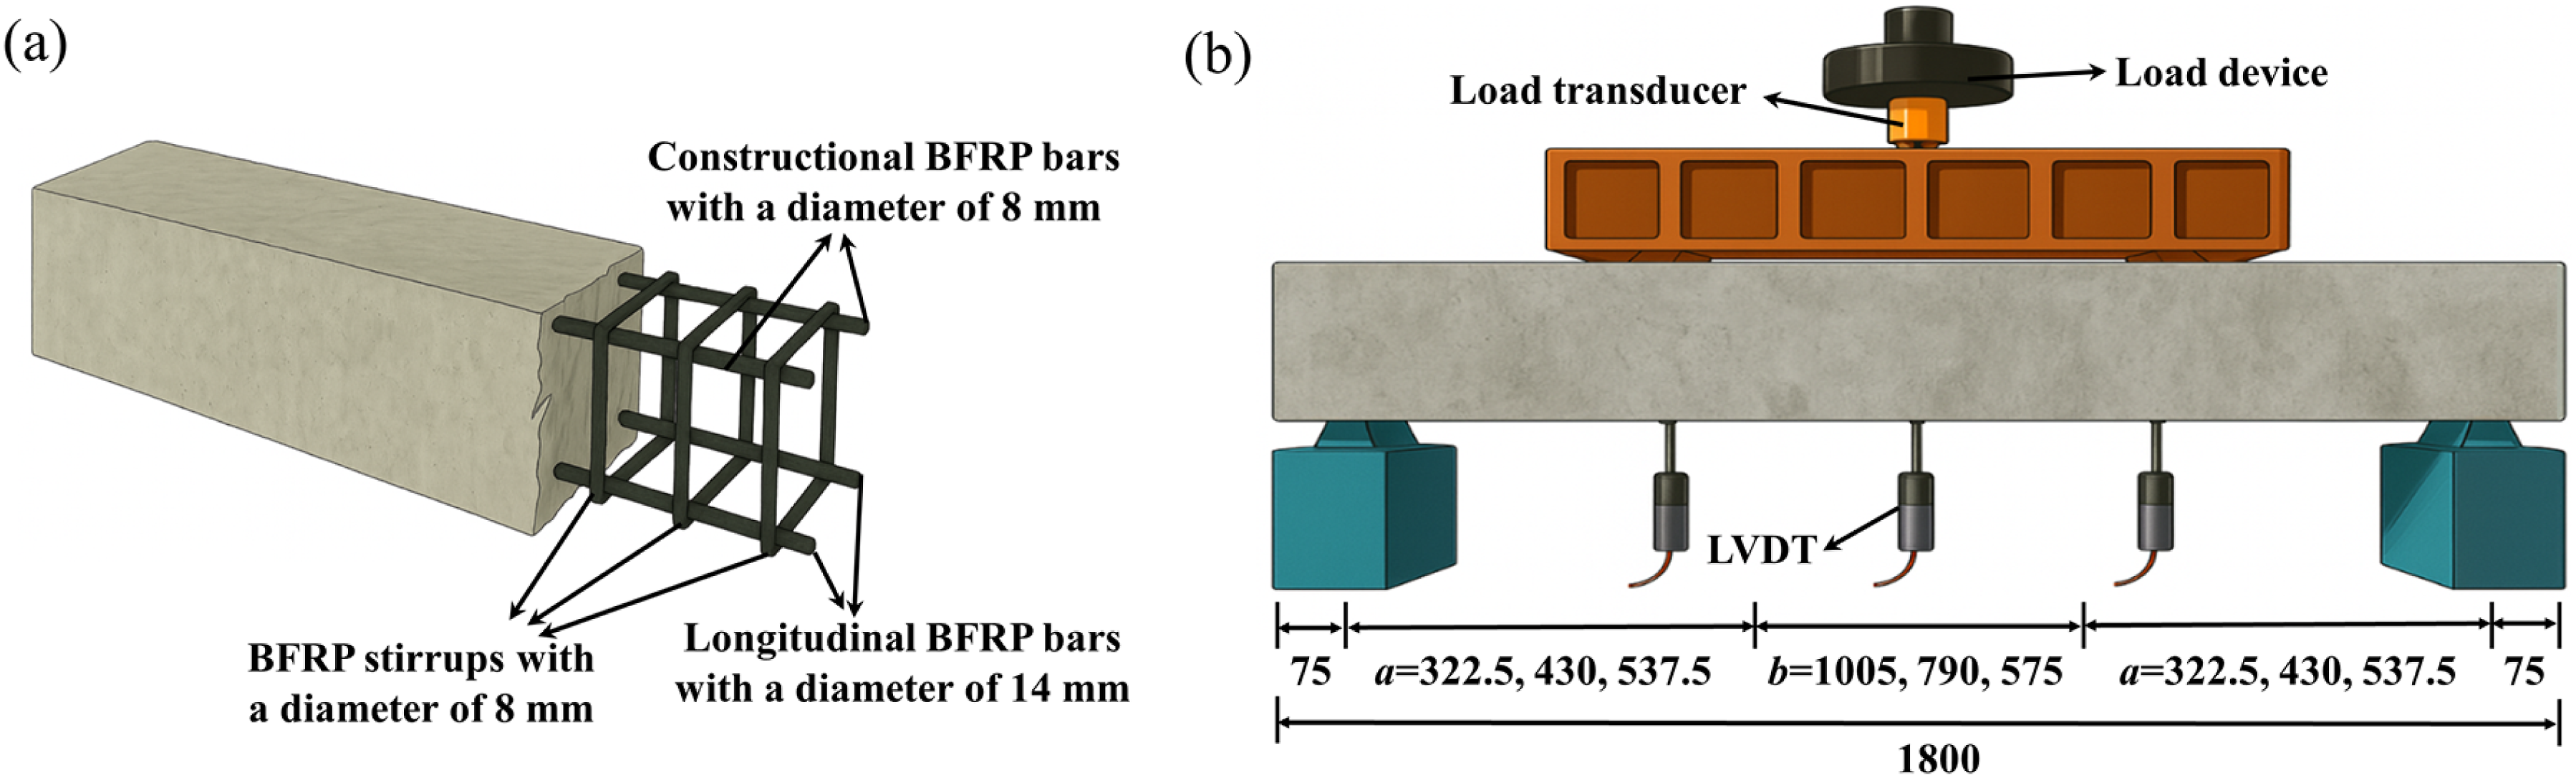
A total of seven beams were fabricated and tested in shear. These seven beams are fully independent from the 631-test calibration database and were not involved in any stage of coefficient optimization, model selection, or parameter tuning. Each beam had an overall length of 1800 mm, an effective span of 1650 mm, and a rectangular cross-section of 150 mm (width) × 250 mm (depth), with a concrete cover of 20 mm. The longitudinal reinforcement in each specimen consisted of two 14 mm-diameter BFRP bars, supplemented by two 8 mm-diameter BFRP bars used as hanger bars and 8 mm-diameter BFRP two-legged stirrups as transverse reinforcement (Figure 10(a)). The main test variables were the shear-span-to-depth ratio (1.5, 2.0, and 2.5), the concrete compressive strength class (C30, C50, and C70), and the BFRP stirrup reinforcement ratio (0.34%, 0.45%, and 0.67%). The specimen designations are summarized in Table 7. All beams were tested to failure under a four-point loading configuration designed to induce shear, as illustrated in Figure 10(b). A 50 t load cell and a linear variable differential transformer (LVDT) with a measuring range of 50 mm, both connected to a synchronized data acquisition system, were used to measure the applied vertical load and the mid-span vertical deflection of the reinforced concrete beams, respectively. The tests were conducted under quasi-static, displacement-controlled loading following a stepwise incremental protocol, with an actuator displacement rate of 1 mm/min. Prior to crack initiation at the bottom surface of the beam, the load was increased in increments of 2 kN per step; after bottom cracking occurred, the load increment was increased to 10 kN per step until failure.
Specimen design and test setup: (a) layout of BFRP bars; (b) test setup.
Failure mode, load-deflection behavior, and shear capacity
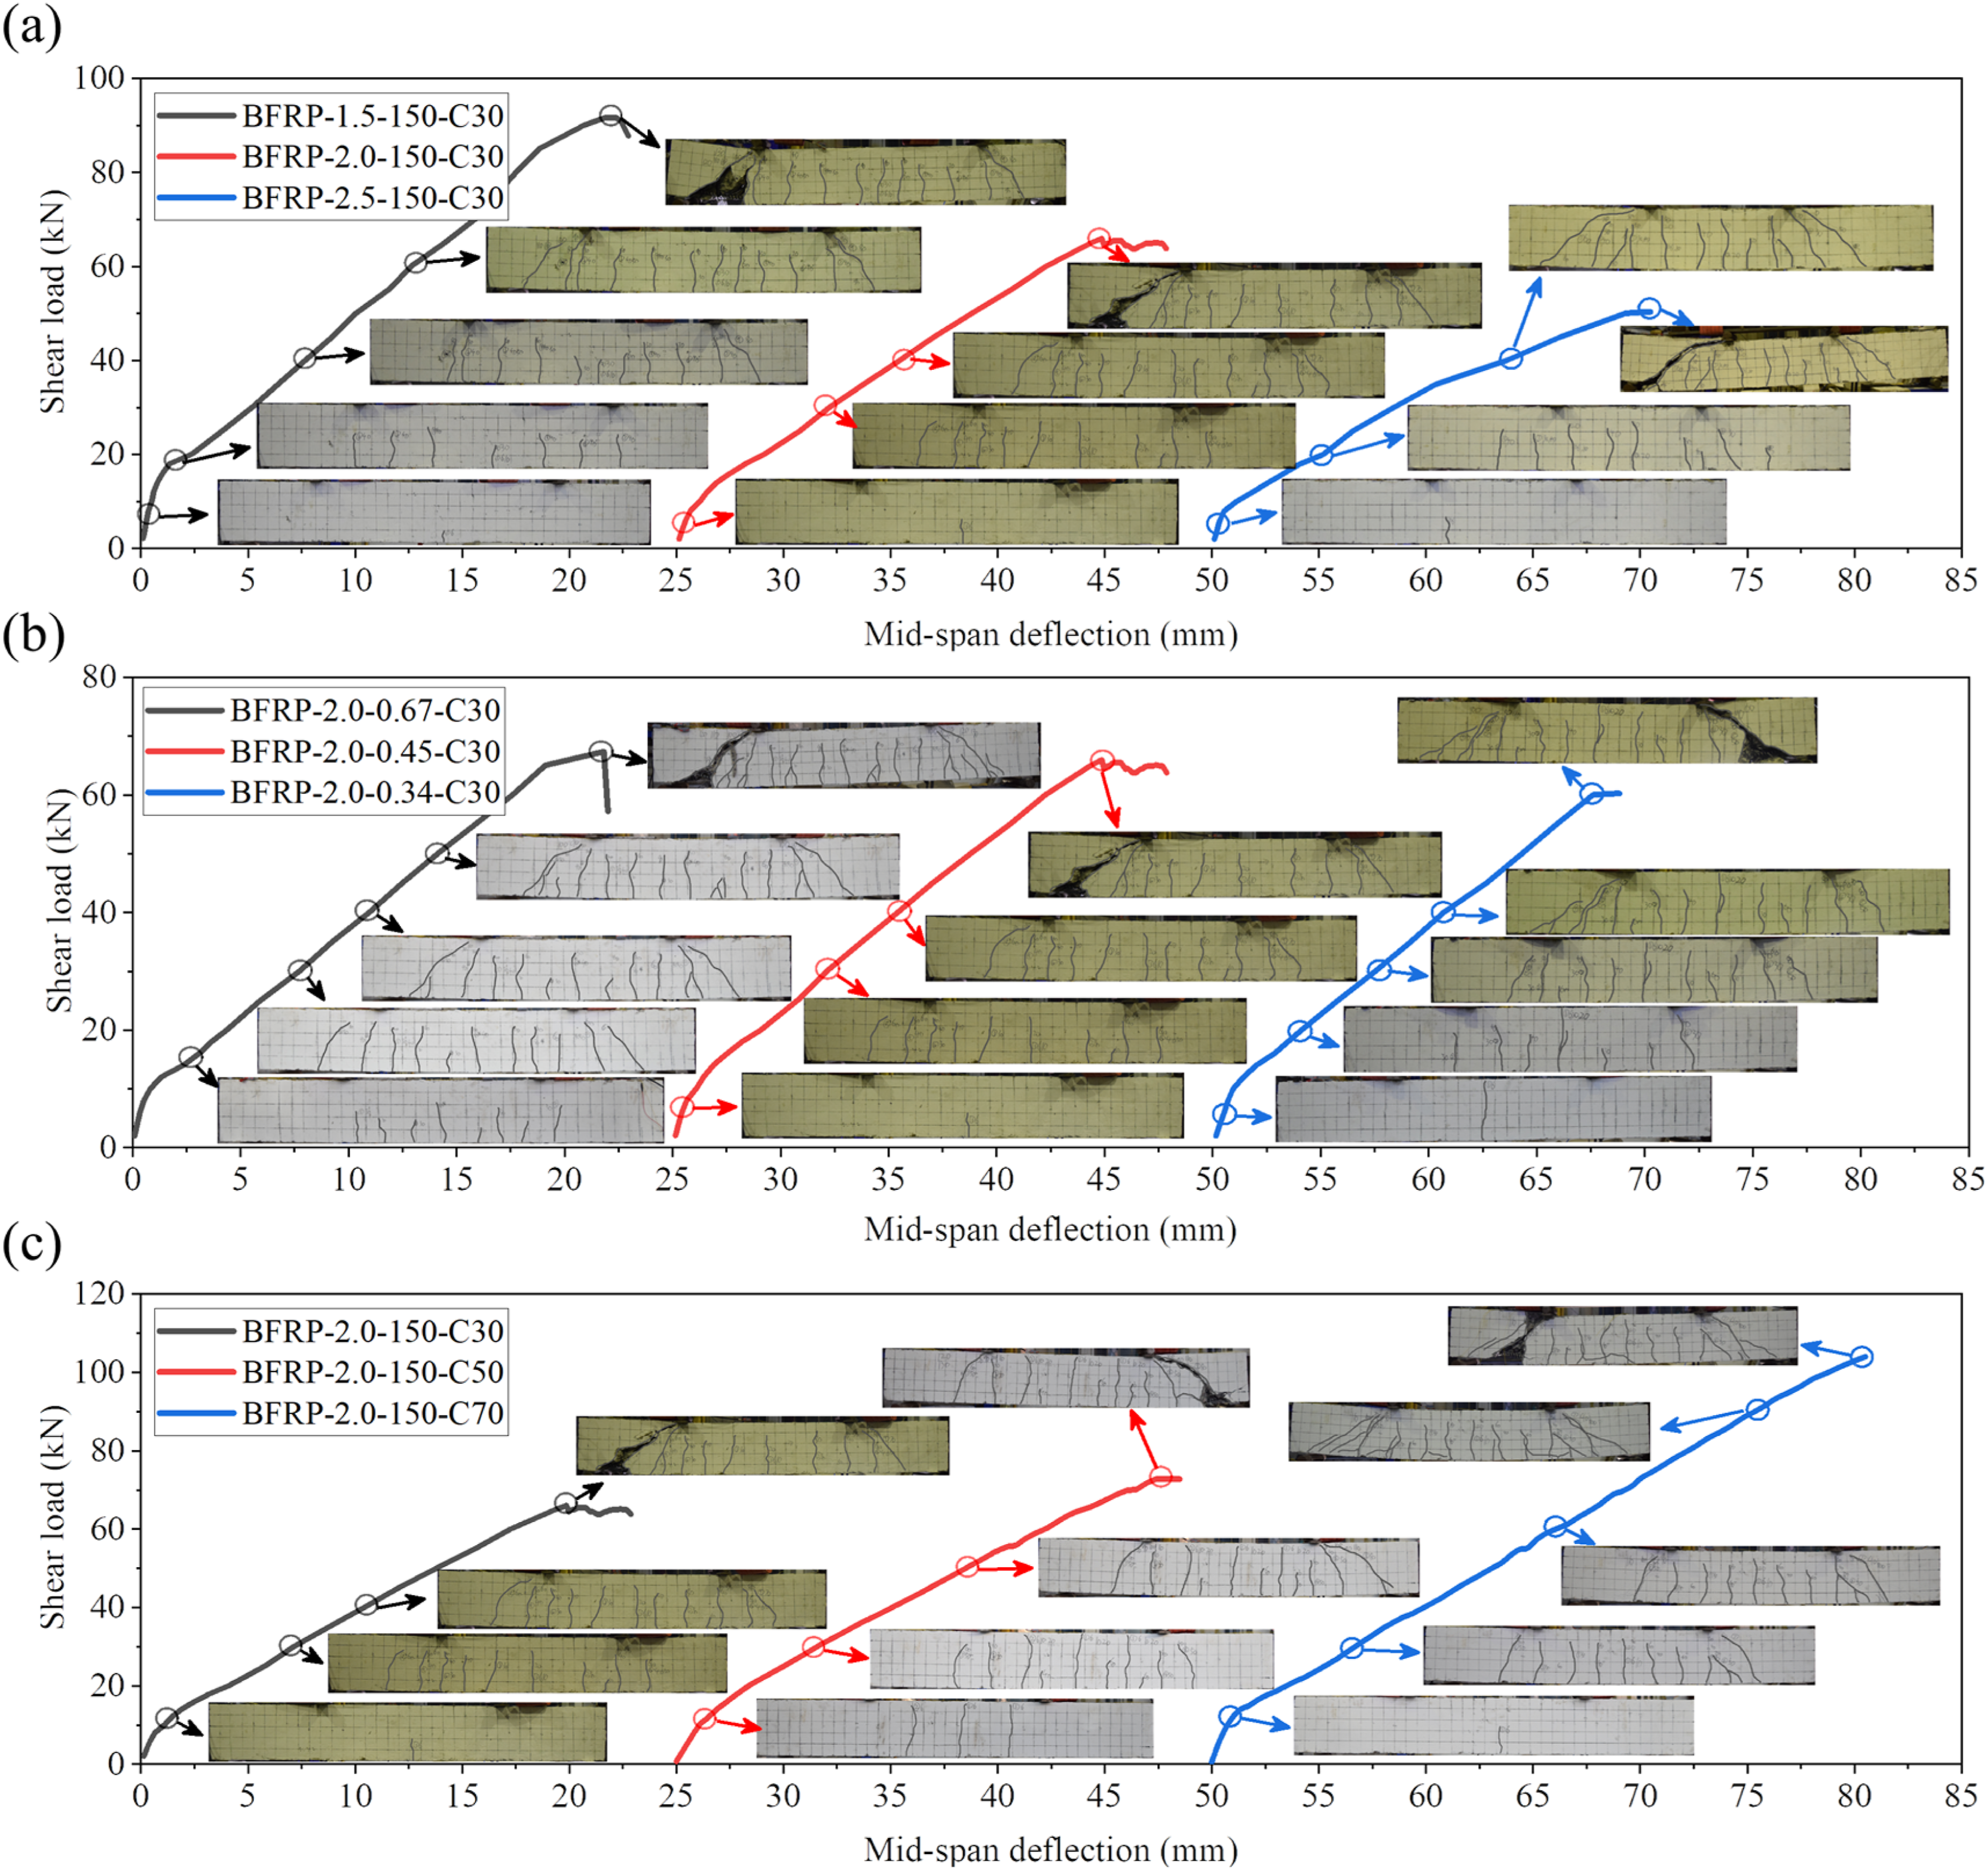
Figure 11 summarizes the load–deflection curves of all beams and the associated crack-pattern evolution and failure modes. The influence of shear-span ratio, stirrup ratio, and concrete strength is compared in Figures 11(a)–(c), respectively. The load–deflection response can be divided into two main stages. Before through-cracks form in the concrete (when the cracks have little influence on the overall stiffness), the beams exhibit high stiffness and the curves have a steep slope. Once through-cracks develop, the overall stiffness decreases and the slope of the curves is reduced.
Load–deflection curves and crack patterns of the tested beams: (a) effect of shear-span ratio; (b) effect of stirrup ratio; (c) effect of concrete compressive strength.
With decreasing shear-span ratio, increasing stirrup ratio and increasing concrete compressive strength, the shear capacity of the beams increases, which is consistent with the trends reported in design codes and previous studies. All beams ultimately failed in shear, characterized by the formation of an inclined shear crack in one of the two shear spans. When the stirrups reached their tensile strength, they ruptured, resulting in global shear failure of the beam and a sudden drop in the load to near zero. For convenience in assessing the accuracy of the predictive models, the experimentally measured shear capacities of all beams are summarized in Table 7.
Comparison of values obtained from different design standards
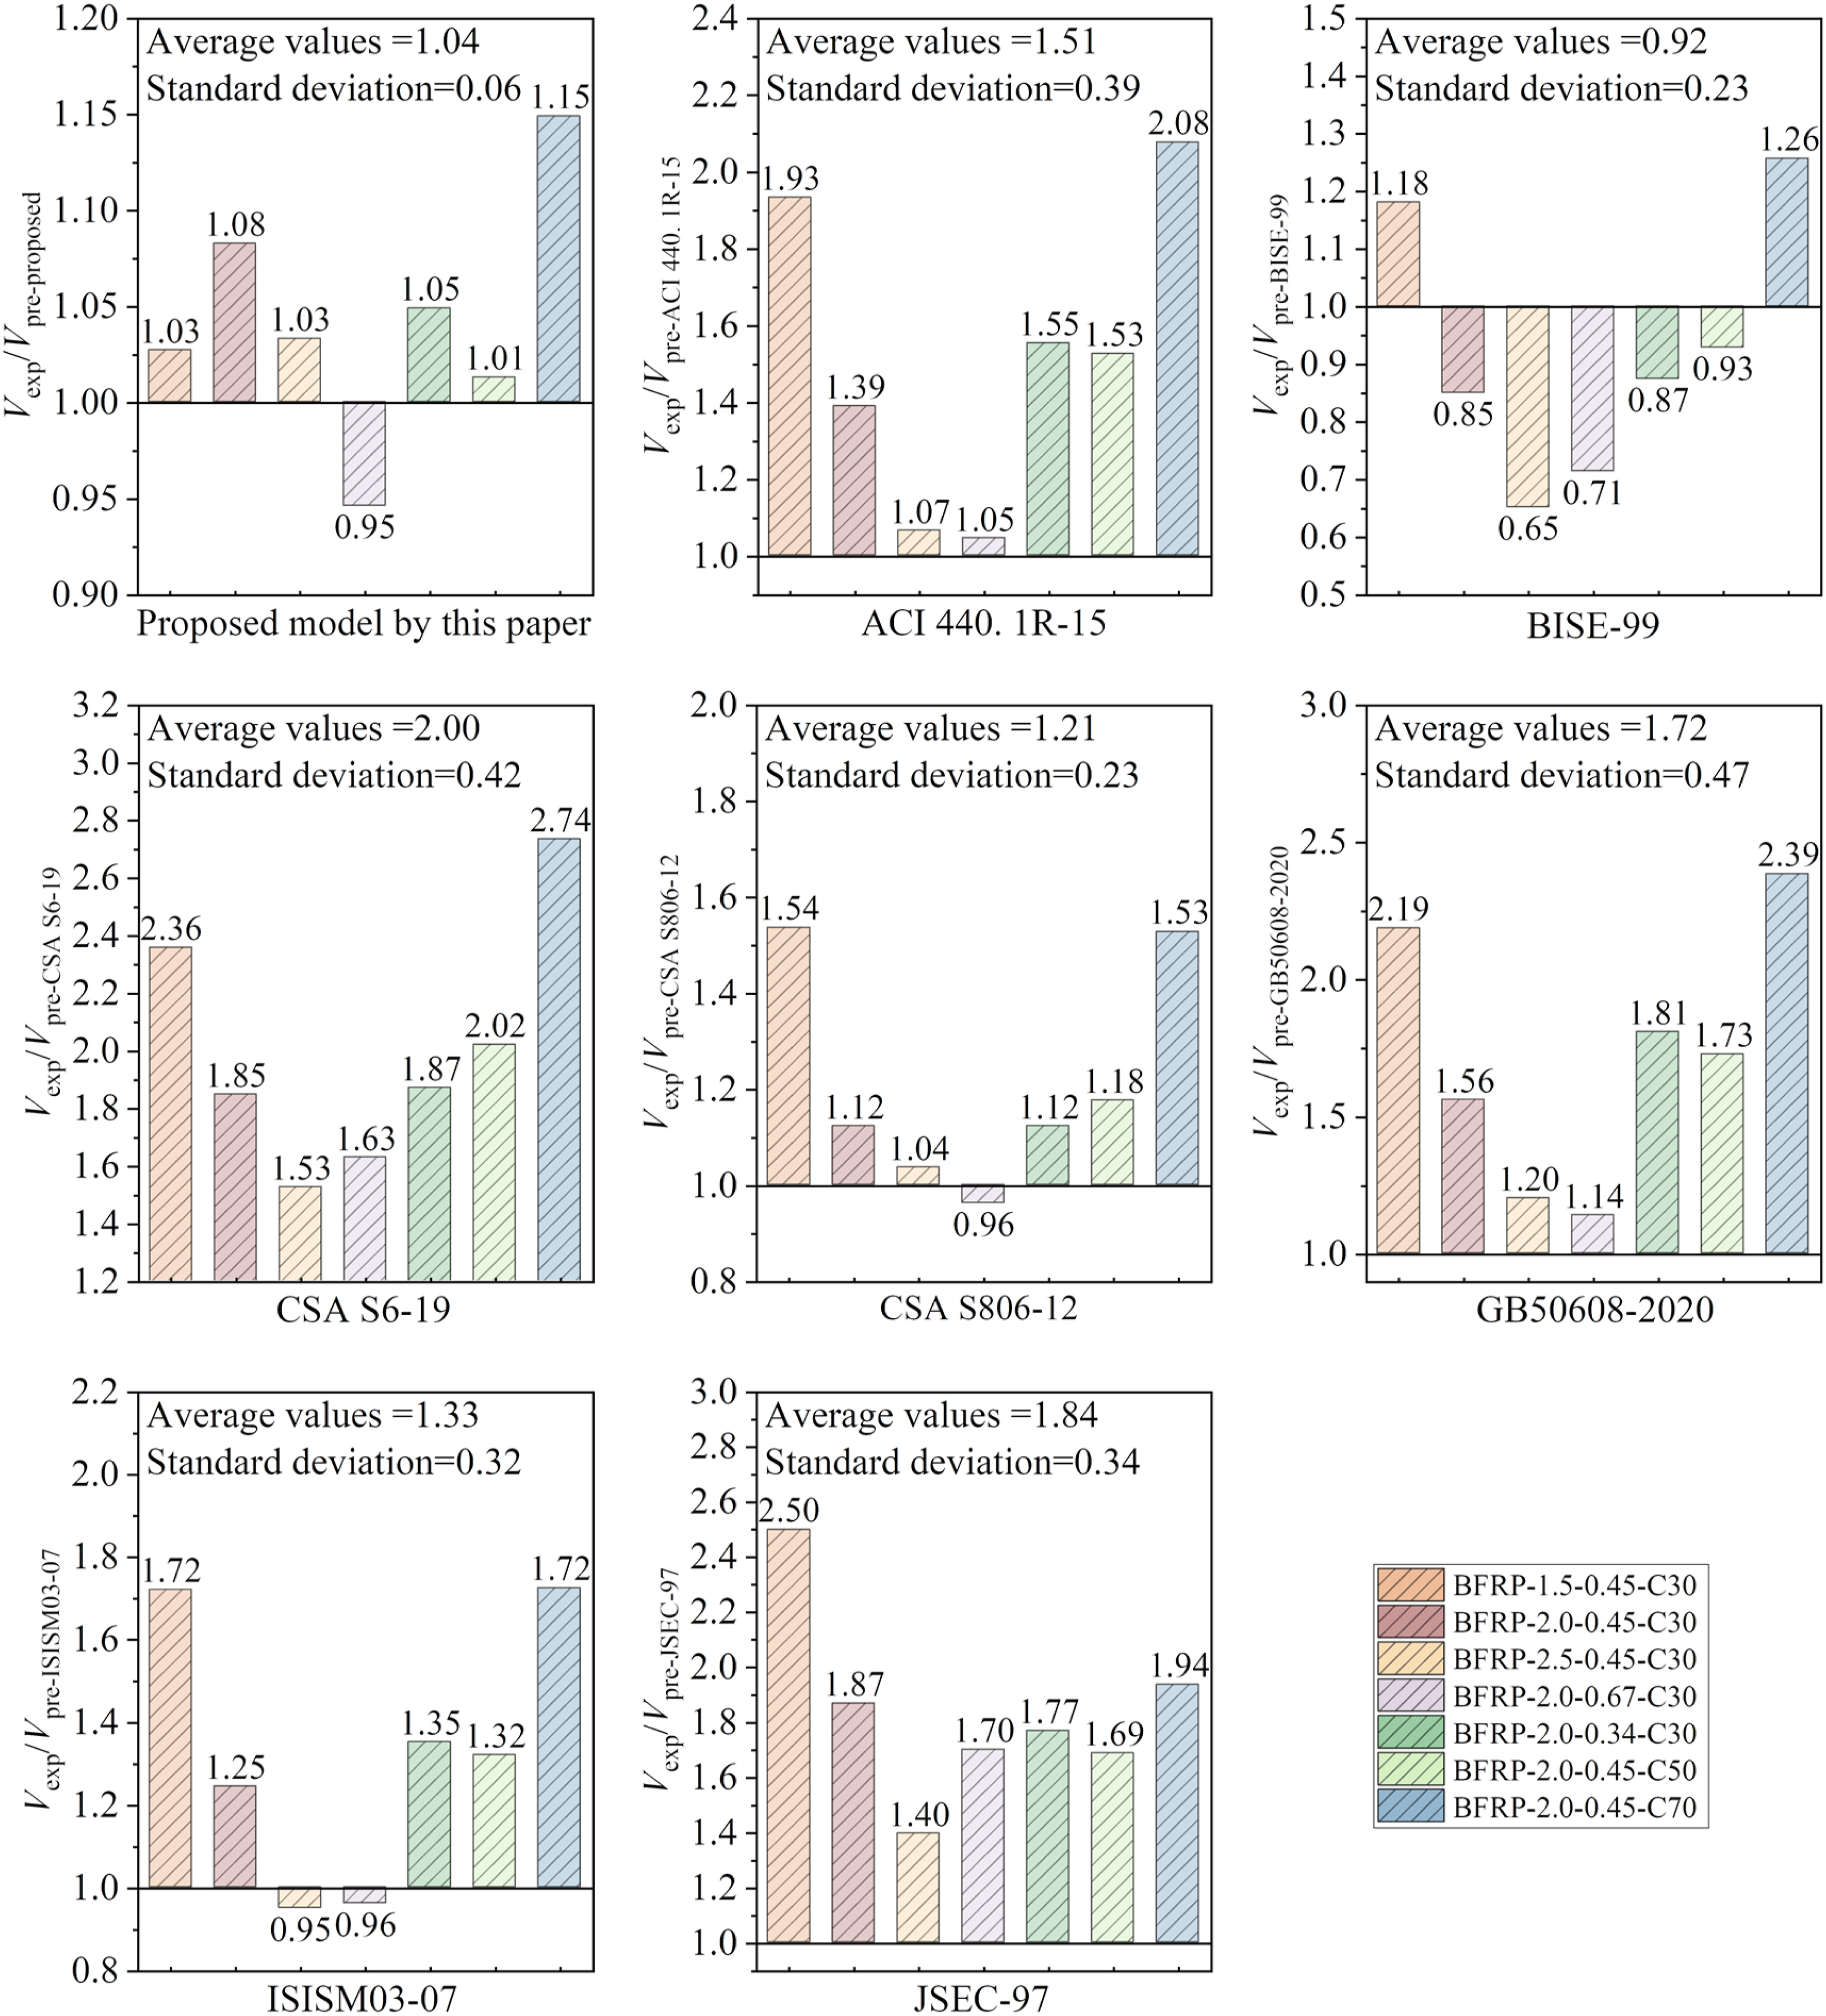
The material and geometric parameters of the seven beams were substituted into the shear-strength calculation model proposed in this study as well as into the formulations specified in existing design codes and the corresponding predictions were compared with the experimental shear capacities, as shown in Figure 12. For the proposed model, the test-to-prediction ratios are close to unity and do not exhibit marked variation with the shear-span ratio, concrete compressive strength, or BFRP stirrup ratio. By contrast, some existing provisions yield much larger mean test-to-prediction ratios; for example, the mean ratios corresponding to CSA S6-19, GB 50608-2020, and JSCE-97 are 2.0, 1.72, and 1.84, respectively, which are markedly greater than 1. Several methods, such as ACI 440.1R-15, CSA S6-19, GB 50608-2020, and JSCE-97, are sensitive to the shear-span ratio and tend to underestimate the shear capacity of beams with small shear-span ratios. Moreover, nearly all code provisions give overly conservative predictions for high-strength concrete, particularly for concrete with a strength grade of C70, whereas the proposed method provides relatively accurate predictions for the high-strength concrete specimen examined in the present verification set. To quantify uncertainty in the 7-beam preliminary verification, we report the ratio for each specimen. For the proposed model, the sample statistics are , , and (n = 7). Using a t-distribution, the 95% confidence interval for the mean ratio is [0.986, 1.100]. A corresponding 95% prediction interval for an individual observation is [0.881, 1.205], reflecting the limited statistical power of a small verification set. Therefore, the 7-beam results are presented as preliminary external verification within the tested ranges rather than a comprehensive statistical validation over the full parameter space. An additional comparison with a representative optimized model from Shahnewaz et al.18 was conducted (Table S8). Both the slender-beam subset (, consistent with the scope of Shahnewaz et al.) and the full database (all ) were evaluated to examine sensitivity to extrapolation. As summarized in Table S8, the proposed model showed better overall performance than the model of Shahnewaz et al. in terms of the adopted objective function . For , was reduced from 0.4059 to 0.3446 for beams without stirrups and from 0.8662 to 0.6018 for beams with stirrups. When applied to the full database, a pronounced deterioration in performance was observed for the model of Shahnewaz et al. (e.g., for beams without stirrups), whereas stable performance was maintained by the proposed model (). This comparison strengthens the assessment of advancement beyond existing design codes and highlights the improved robustness of the proposed framework for the database subsets examined outside the slender-beam domain.
Comparison of values obtained from different design standards.
Conclusions
To address the limited accuracy and robustness of existing design provisions for predicting the shear strength of FRP-reinforced concrete beams, this study assembles a database of 631 shear tests (499 without and 132 with FRP stirrups) to benchmark nine representative design methods, identify key parameter influences and deficiencies in current formulations and support the development of a unified shear strength prediction model. Based on these insights, a three-stage particle swarm optimization (PSO) framework is developed to recalibrate code-type shear equations and the resulting model is preliminarily examined using seven independent shear tests on concrete beams reinforced with basalt FRP (BFRP) bars. The main conclusions can be summarized as follows:
(1) Benchmarking nine representative shear design provisions and analytical models against the assembled database reveals pronounced scatter and clear parameter-dependent bias in the test-to-prediction ratios of FRP-reinforced concrete beams. For small shear span-to-depth ratios and high-strength concrete, some methods become unconservative whereas others are overly conservative, indicating that the size effect and the coupling between concrete and FRP reinforcement are not adequately represented in current formulations.
(2) Parametric analysis demonstrates that effective depth, shear span-to-depth ratio, concrete compressive strength and FRP stirrup ratio have a pronounced influence on the predicted shear capacity. For beams without stirrups, the absence or oversimplified treatment of the size effect leads to systematic misprediction in the short-span range; for beams with FRP stirrups, the commonly assumed linear superposition of concrete and FRP shear contributions cannot capture their coupling and therefore fails to adequately reflect the influence of stirrup ratio and concrete strength on shear capacity.
(3) The proposed three-stage PSO framework, in which the concrete contribution is optimized separately for beams with large and small shear span-to-depth ratios and then combined with an optimized expression for the FRP contribution and its coupling with concrete, substantially improves the predictive performance of the nine considered models. The optimized formulations bring the mean test-to-prediction ratios closer to unity and reduce both the coefficient of variation and the average absolute error for beams without and with FRP stirrups.
(4) A unified shear strength prediction model is proposed by introducing an explicit size-effect factor at low shear span-to-depth ratios and a more rational representation of the FRP stirrup contribution. Its predictive consistency is preliminarily examined using seven independent shear tests on BFRP-reinforced beams with different shear span-to-depth ratios, concrete strength classes, and stirrup ratios, for which the predicted shear capacities remain close to the experimental values within the tested ranges.
(5) Repeated hold-out validation demonstrates stable coefficients and consistent held-out performance, indicating limited overfitting; together with the independent 7-beam program, the model shows promising generalization within the database/verification envelope. The proposed equation is therefore recommended for use within the stated applicability ranges of the calibration database, and extrapolation beyond these ranges (e.g., very large depths, high , high , and additional FRP types) should be treated with caution.
Supplemental material
Supplemental Material - Shear capacity model for FRP-beams: Database evaluation, three-stage particle swarm optimization, and experimental validation
Supplemental Material for Shear capacity model for FRP-beams: Database evaluation, three-stage particle swarm optimization, and experimental validation by Weijia Ye, Yihao Liang, Xiangzhou Liang, Qiang Wang, Xin Zhang in Journal of Reinforced Plastics and Composites
Footnotes
ORCID iDs
Xiangzhou Liang
Qiang Wang
Author contributions
Weijia Ye: Methodology, investigation, formal analysis, and writing—original draft. Yihao Liang: Data curation and investigation. Xiangzhou Liang: Supervision, writing—review and editing, and funding acquisition. Qiang Wang and Xin Zhang: Writing—review and editing.
Funding
The authors disclosed receipt of the following financial support for the research, authorship, and/or publication of this article: This work was supported by the National Natural Science Foundation of China (Grant No. 52308288) and the Hebei Natural Science Foundation (Grant No. E2023203173).
Declaration of conflicting interests
The authors declare that they have no known competing financial interests or personal relationships that could have appeared to influence the work reported in this paper.
Data Availability Statement
The data that support the findings of this study are available from the corresponding author upon reasonable request.*
Supplemental material
Supplemental material for this article is available online.
References
1.
Al-KhafajiAFHaluzaRTBenzecryV, et al.Durability assessment of 15-to 20-year-old GFRP bars extracted from bridges in the US. II: GFRP bar assessment. J Compos Constr2021; 25: 04021008. https://doi.org/10.1061/(ASCE)CC.1943-5614.0001112
2.
BenzecryVAl-KhafajiAFHaluzaRT, et al.Durability assessment of 15-to 20-year-old GFRP bars extracted from bridges in the US. I: selected bridges, bar extraction, and concrete assessment. J Compos Constr2021; 25: 04021007. https://doi.org/10.1061/(ASCE)CC.1943-5614.0001110
3.
HuJYZhangSSChenE, et al.A review on corrosion detection and protection of existing reinforced concrete (RC) structures. Constr Build Mater2022; 325: 126718. https://doi.org/10.1016/j.conbuildmat.2022.126718
4.
AhmedAGuoSCZhangZH, et al.A review on durability of fiber reinforced polymer (FRP) bars reinforced seawater sea sand concrete. Constr Build Mater2020; 256: 119484. https://doi.org/10.1016/j.conbuildmat.2020.119484
5.
AhmedEABenmokraneBSansfaçonM. Case study: design, construction, and performance of the La Chanceliere parking garage's concrete flat slabs reinforced with GFRP bars. J Compos Constr2017; 21: 05016001. https://doi.org/10.1061/(ASCE)CC.1943-5614.0000656
6.
WuZWangXShiJ. Fiber reinforced composites in civil engineering (in Chinese). China Railway Publishing House Co., Ltd, 2020.
7.
LiangXZYinSP. Evaluation of the flexural behavior and serviceability of engineered cementitious composite-coral aggregate concrete beams reinforced with BFRP bars. Constr Build Mater2021; 308: 124937. https://doi.org/10.1016/j.conbuildmat.2021.124937
Canadian Standards Association (CSA). CSA S806-12. Design and construction of building structures with fibre-reinforced polymers. Canadian Standards Association, 2012.
10.
American Concrete Institute (ACI). ACI 440.1R-15. Guide for the design and construction of structural concrete reinforced with fiber-reinforced polymer (FRP) bars. American Concrete Institute, 2015.
11.
American Concrete Institute (ACI). ACI 318-19. Building code requirements for structural concrete (ACI 318-19) and commentary (ACI 318R-19). American Concrete Institute, 2019.
12.
LiangXPengJRenR. A state-of-the-art review: shear performance of the concrete beams reinforced with FRP bars. Constr Build Mater2023; 364: 129996. https://doi.org/10.1016/j.conbuildmat.2022.129996
13.
Canadian Standards Association (CSA). CSA S6:19. Canadian highway bridge design code. CSA Group, 2019.
14.
Japan Society of Civil Engineers (JSCE). Recommendation for design and construction of concrete structures using continuous fiber reinforcing materials. : Japan Society of Civil Engineers 23, Concrete Engineering Series, 1997.
15.
Ministry of Housing and Urban-Rural Development of the People’s Republic of China (MOHURD). GB 50608-2020. Technical standard for fiber reinforced polymer (FRP) in construction. China Planning Press, 2020.
ShahnewazMMachialRAlamMS, et al.Optimized shear design equation for slender concrete beams reinforced with FRP bars and stirrups using genetic algorithm and reliability analysis. Eng Struct2016; 107: 151–165. https://doi.org/10.1016/j.engstruct.2015.10.049
19.
El ZareefMAElbisyMSBadawiM. Evaluation of code provisions predicting the concrete shear strength of FRP-reinforced members without shear reinforcement. Compos Struct2021; 275: 114430. https://doi.org/10.1016/j.compstruct.2021.114430
20.
PengFXueWXueW. Database evaluation of shear strength of slender fiber-reinforced polymer-reinforced concrete members. ACI Struct J2020; 117: 273–281. https://doi.org/10.14359/51723504
21.
AnvariATBabanajadSGandomiAH. Data-driven prediction models for total shear strength of reinforced concrete beams with fiber reinforced polymers using an evolutionary machine learning approach. Eng Struct2023; 276: 115292. https://doi.org/10.1016/j.engstruct.2022.115292
22.
YangYZLiuGY. Data-driven shear strength prediction of FRP-reinforced concrete beams without stirrups based on machine learning methods. Buildings-Basel2023; 13: 313. https://doi.org/10.3390/buildings13020313
23.
TarawnehANSalehEFAlghossoonAM, et al.Modified shear design model for Steel- and fiber-reinforced polymer-reinforced concrete beams. ACI Struct J2024; 121: 147–158. https://doi.org/10.14359/51739191
24.
MaraniANehdiML. Predicting shear strength of FRP-reinforced concrete beams using novel synthetic data driven deep learning. Eng Struct2022; 257: 114083. https://doi.org/10.1016/j.engstruct.2022.114083
WakjiraTGAl-HamraniAEbeadU, et al.Shear capacity prediction of FRP-RC beams using single and ensenble explainable machine learning models. Compos Struct2022; 287: 115381. https://doi.org/10.1016/j.compstruct.2022.115381
27.
KennedyJEberhartR. Particle swarm optimization. In: Proceedings of ICNN'95 - International Conference on Neural Networks, 1995.
28.
KulkarniMPatekarMSBhoskarMT, et al.Particle swarm optimization applications to mechanical engineering - A review. Mater Today Proc2015; 2: 2631–2639. https://doi.org/10.1016/j.matpr.2015.07.223
29.
American Concrete Institute (ACI). ACI 440.3R-12. Guide test methods for fiber-reinforced polymer (FRP) composites for reinforcing or strengthening concrete and masonry structures. American Concrete Institute, 2012.
30.
Ministry of Housing and Urban-Rural Development of the People’s Republic of China (MOHURD); State Administration for Market Regulation (SAMR). Standard for test methods of concrete physical and mechanical properties. China Architecture & Building Press, 2019. GB/T 50081-2019.
Supplementary Material
Please find the following supplemental material available below.
For Open Access articles published under a Creative Commons License, all supplemental material carries the same license as the article it is associated with.
For non-Open Access articles published, all supplemental material carries a non-exclusive license, and permission requests for re-use of supplemental material or any part of supplemental material shall be sent directly to the copyright owner as specified in the copyright notice associated with the article.